LNG Risks & Loss Prevention of LNG Carrier, LNG FPSO & LNG FSRU

CURRENT STATE AND PROPECTS OF LNG IN THE
UNECE REGION Group of Experts on Gas
14th April 2014 - Geneva

UNECE Structure of the study
Executive Summary Chapter 1: LNG Market Chapter 2: LNG Value Chain and
Technology Chapter 3: Regulation Chapter 4: Interoperability
2
UNECE Participants Francisco de la Flor Benjamin Schlesinger Diego Portoghese Ramón Díaz Casado Víctor Tuñón Alfredo Puente Luis I. Parada María Ángeles de Vicente Luis Gorospe Pedro Moraleda
3

UNECE Next steps
Feedback
Final Wording
4

UNECE Chapter 1: LNG Markets
Definitions Key market
drivers Structure and
Pricing Directions and
outlook Discussion
5
Pacific Trading Basin
Atlantic Trading Basin
Middle East
UNECE Chapter 1: LNG Markets
0.0
5.0
10.0
15.0
20.0
25.0
Apr-
10
Sep-
10
Feb-
11
Jul-1
1
Dec-
11
May
-12
Oct
-12
Mar
-13
Aug-
13
Jan-
14
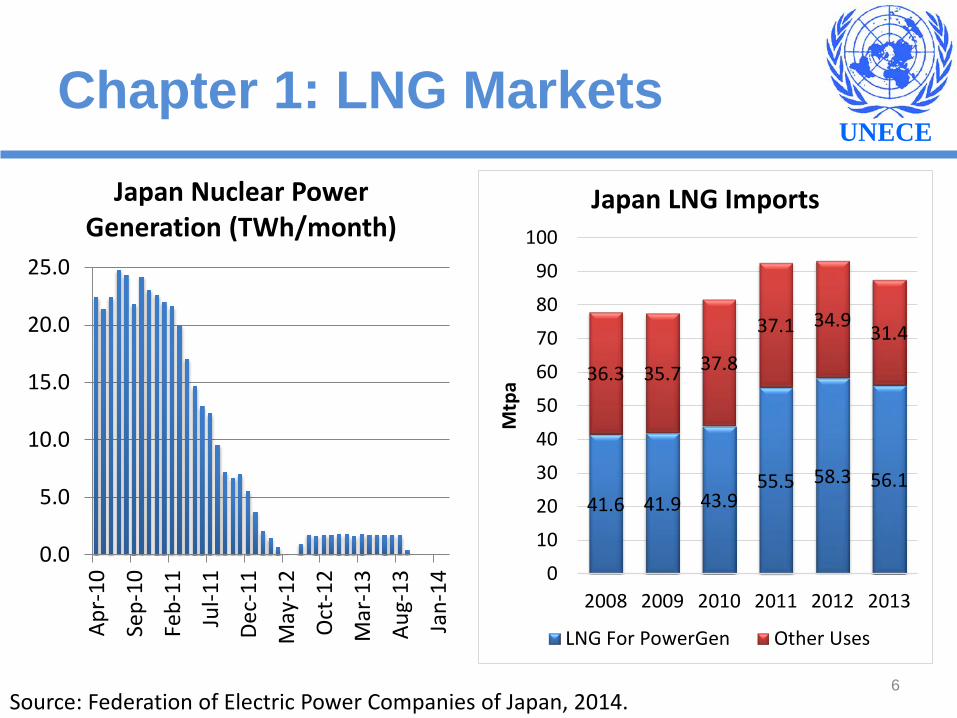
Japan Nuclear Power Generation (TWh/month)
6 Source: Federation of Electric Power Companies of Japan, 2014.
41.6 41.9 43.9 55.5 58.3 56.1
36.3 35.7 37.8
37.1 34.9 31.4
0
10
20
30
40
50
60
70
80
90
100
2008 2009 2010 2011 2012 2013
Mtp
a
Japan LNG Imports
LNG For PowerGen Other Uses
UNECE Chapter 1: LNG Markets
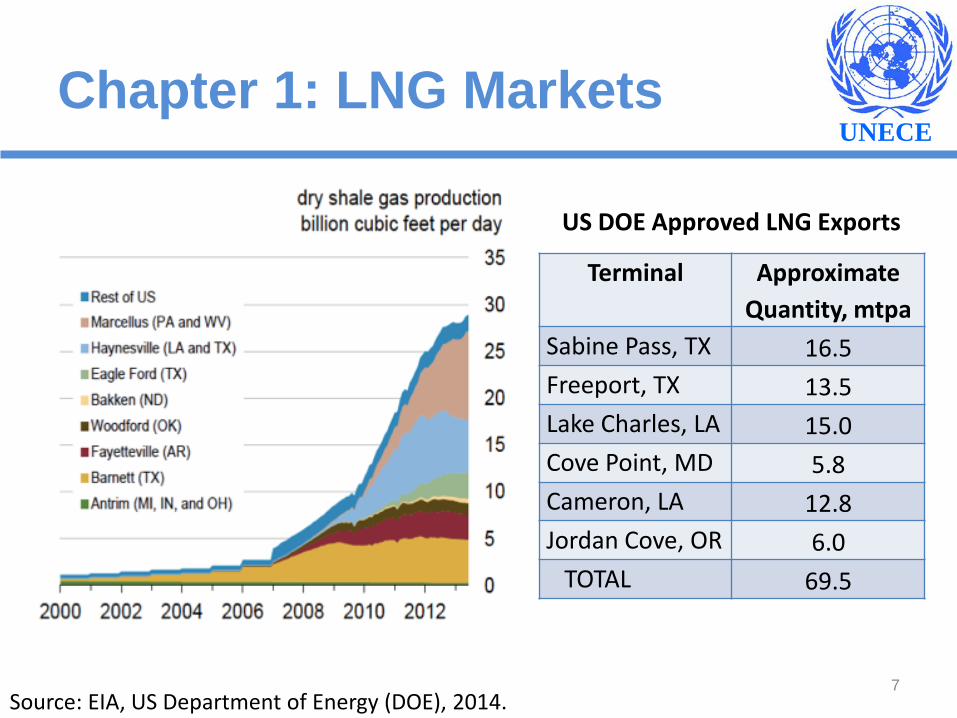
Terminal Approximate Quantity, mtpa
Sabine Pass, TX 16.5 Freeport, TX 13.5 Lake Charles, LA 15.0 Cove Point, MD 5.8 Cameron, LA 12.8 Jordan Cove, OR 6.0 TOTAL 69.5
7
US DOE Approved LNG Exports
Source: EIA, US Department of Energy (DOE), 2014.

UNECE Chapter 1: LNG Markets
8 Source: IEA, 2013.
Comparison of US LNG Delivered Costs
UNECE Chapter 1: LNG Markets
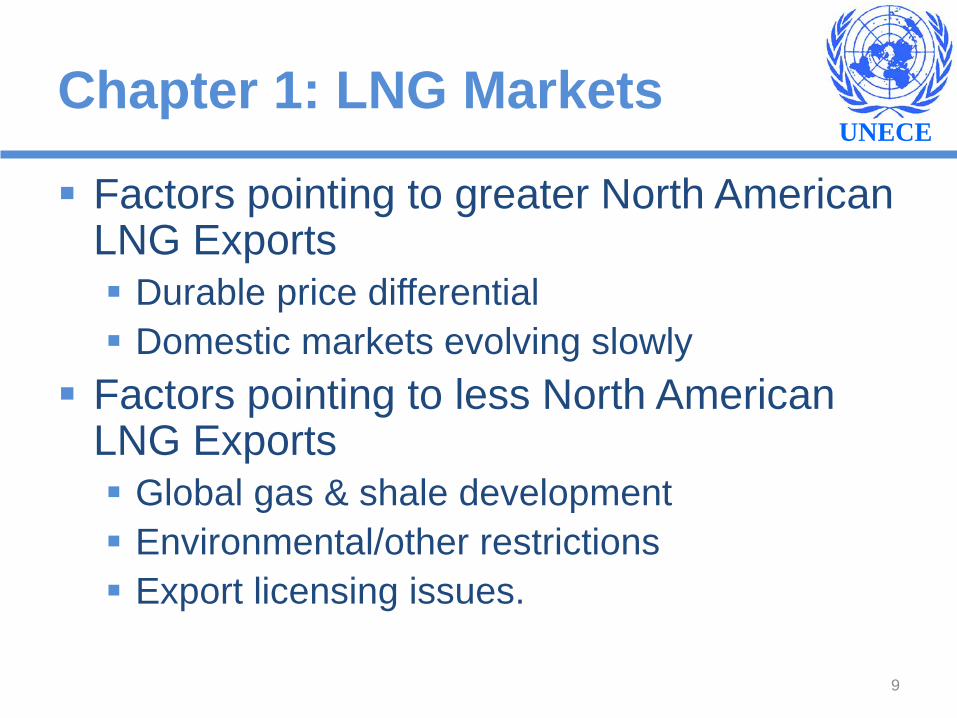
Factors pointing to greater North American LNG Exports Durable price differential Domestic markets evolving slowly
Factors pointing to less North American LNG Exports Global gas & shale development Environmental/other restrictions Export licensing issues.
9

UNECE Chapter 1: LNG Markets
78.02
25.14
22.41 18.36
16.47
13.67
10.81
10.69
8.35 7.01 22.91
Global LNG Supply in 2013, Highlighting Top 10 Countries (BCM)
QatarMalaysiaAustraliaIndonesiaNigeriaTrinidad & TobagoAlgeriaRussian FederationOmanBruneiAll Others
10 Source: GIIGNL, 2014.
UNECE Chapter 1: LNG Markets
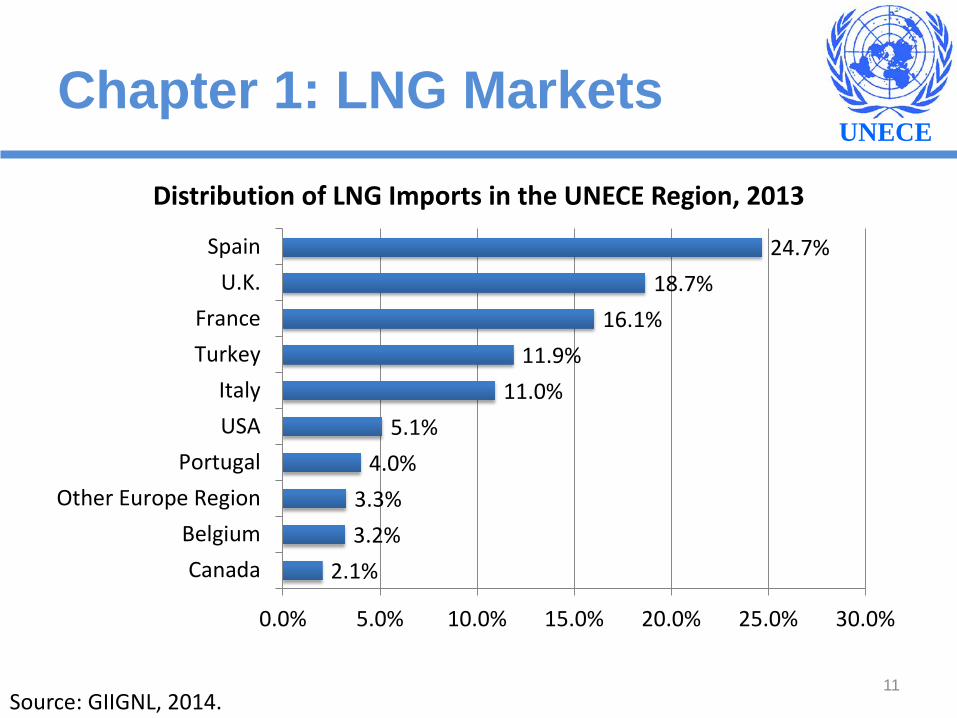
2.1% 3.2% 3.3%
4.0% 5.1%
11.0% 11.9%
16.1% 18.7%
24.7%
0.0% 5.0% 10.0% 15.0% 20.0% 25.0% 30.0%
CanadaBelgium
Other Europe RegionPortugal
USAItaly
TurkeyFrance
U.K.Spain
Distribution of LNG Imports in the UNECE Region, 2013
11 Source: GIIGNL, 2014.

UNECE Chapter 1: LNG Markets
12
Comparison of Spot Gas Prices in Key LNG Markets
Source: EEG, 2014.

UNECE Chapter 1: LNG Markets
- 500
1,000 1,500 2,000 2,500 3,000 3,500 4,000 4,500 5,000
1990 1995 2000 2005 2010 2015 2020 2025 2030
Global Gas Markets, BCM
OtherUNECE Region
13 Source: BP, 2013.

UNECE Chapter 1: LNG Markets
48.9
62.1
76.5 78.0
57.1
0.010.020.030.040.050.060.070.080.090.0
100.0
2008 2009 2010 2011 2012 2013 2014 2015 2016 2017 2018 2019 2020
LNG Importation into the UNECE Region, mtpa
14 Source: BP, 2013; various estimates.

UNECE Chapter 1: LNG Markets
LNG is increasing faster than pipeline trade. Global markets remain price-segmented. The UNECE region is raising its LNG
market involvement. US, Canada and Australia will be major
new suppliers in the next decade.
15

UNECE
Chapter 2: LNG value chain Chapter 2 Outline & Scope History of LNG Segments in the LNG value chain Upstream / Reserves Technology
Liquefaction Regasification Shipping
Floating LNG End user markets
Power generation; Industrial process; Feedstock; Residential NGV Satellite & Peak Shaving Plants
Economics (CAPEX; Business Models; Risk Analysis) 16

UNECE
Chapter 2: LNG value chain LNG Value Chain. Trends
17
UNECE
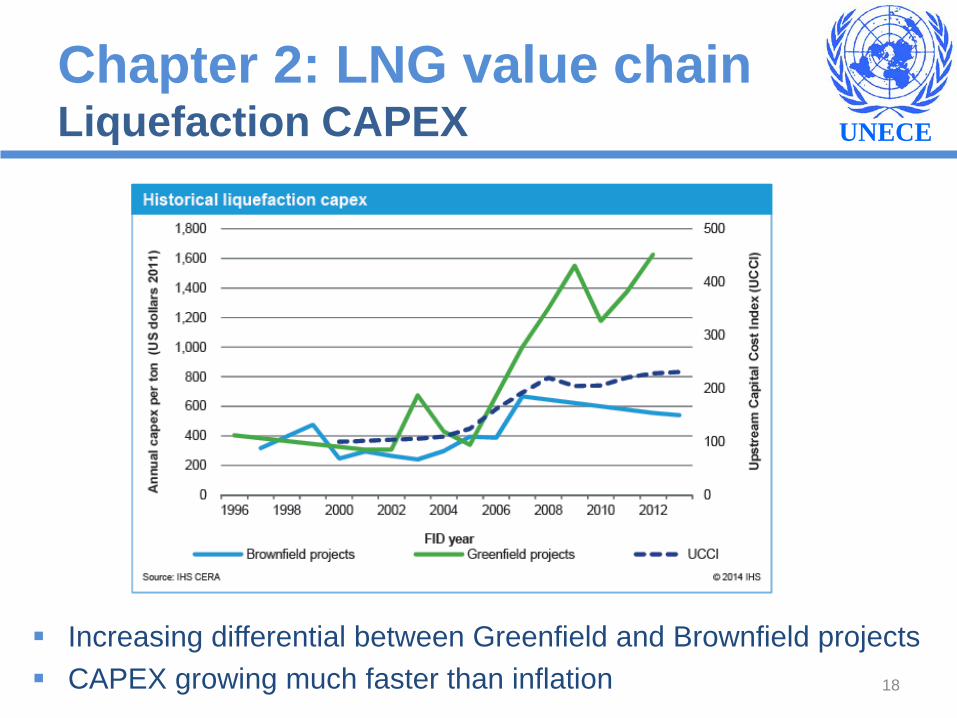
Chapter 2: LNG value chain Liquefaction CAPEX
18
Increasing differential between Greenfield and Brownfield projects CAPEX growing much faster than inflation

UNECE
Chapter 2: LNG value chain Project Economics
Liquefaction requires the highest investment in the LNG chain
Currently there is an excess of regasification and shipping capacities
Massive additional liquefaction capacity proposed Only a limited number of the projects will advance
19
Source: Office of Fossil Energy, U.S. DoE
UNECE
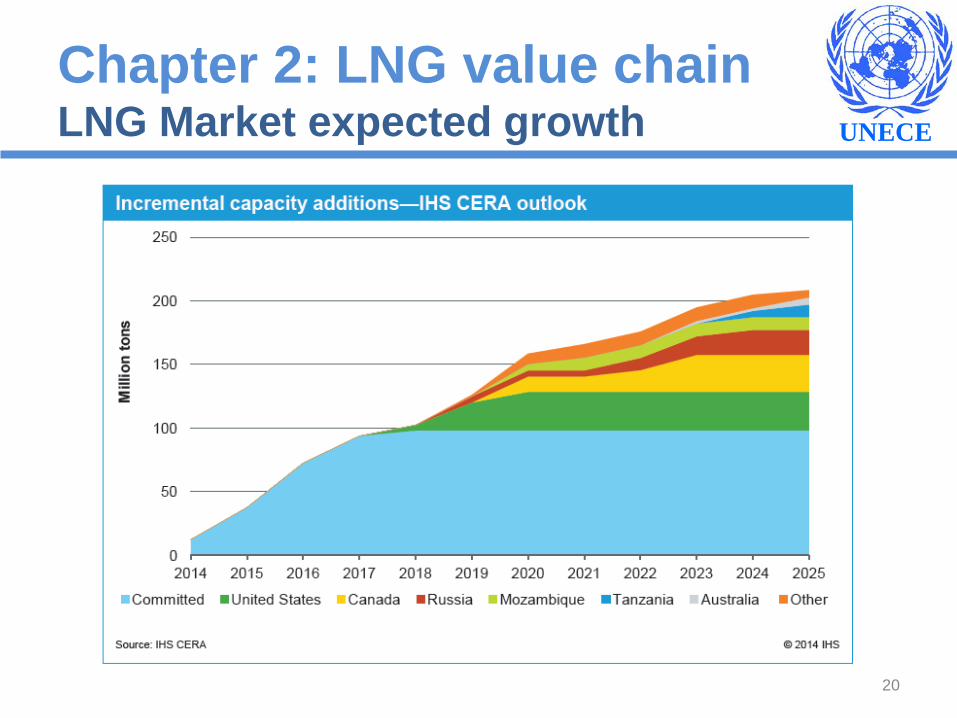
Chapter 2: LNG value chain LNG Market expected growth
20

UNECE
Chapter 2: LNG value chain Offshore is booming Floating regasification facilities in operation:
9 countries in less than 10 years USA, UK Argentina (2) Brazil (2-3) Chile Kuwait UAE (Dubai) Italy Israel,
3 Floating Liquefaction facilities under construction:
Prelude (Australia), the first to take FID in 2011 Petronas FLNG (Malaysia) Pacific Rubiales (Colombia), expecting to start production in 2015
Many more under development or being studied
21
UNECE
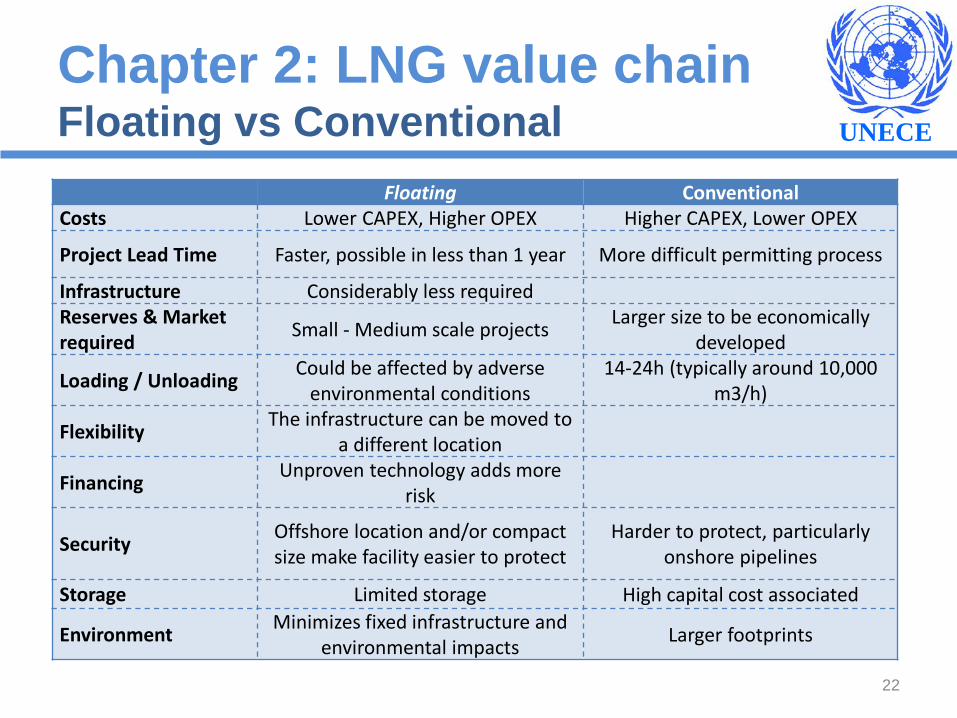
Chapter 2: LNG value chain Floating vs Conventional
22
Floating Conventional Costs Lower CAPEX, Higher OPEX Higher CAPEX, Lower OPEX
Project Lead Time Faster, possible in less than 1 year More difficult permitting process
Infrastructure Considerably less required Reserves & Market required Small - Medium scale projects Larger size to be economically
developed
Loading / Unloading Could be affected by adverse environmental conditions
14-24h (typically around 10,000 m3/h)
Flexibility The infrastructure can be moved to a different location
Financing Unproven technology adds more risk
Security Offshore location and/or compact size make facility easier to protect
Harder to protect, particularly onshore pipelines
Storage Limited storage High capital cost associated
Environment Minimizes fixed infrastructure and environmental impacts Larger footprints

UNECE
Chapter 2: LNG value chain Current trends in the LNG Value Chain
Reserves/Development Increasing costs x4 vs 2000 US Shale gas, new areas: Mozambique/Tanzania…
Liquefaction: Increasing costs: x4 vs 2000 Floating regasification
Shipping New generation of ships=> minimum boil off losses and reduced
fuel consumption. Regasification
Increasing costs Spare capacity in Europe
Markets Three different dynamics: USA, Europe and Asia New Opportunities: LNG for ships, trucks, cars. Small scale LNG
23

UNECE
24
gas – gas competition
Global Markets
From prodcucer to consumer/agregator/trader/… From producer to consumer
Vertically integrated companies (includding NOCs) Fragmented LNG value Chain
Open Market: multiple buyers and sellers from the same country Highly regulated monopoly markets,
Old LNG business model
Short and Medium Term contracts (options) Long Term Contracts(inflexible)
Multiple destinations: flexibility - diversion with PSM
One destination market: Diversion Restrictions
Liquid Markets indexation (HH, NBP, JKM…) Oil indexation Prices
Sales from NOC to Private utilities or State Companies Sales from NOC to State Companies
Competition with alternative energies
LNG Business model changes
Regional Markets: low interbasin exchange
Chapter 2: LNG value chain Current trends in the LNG Value Chain

UNECE
25
Oil
Derivative markets mature – industry dis-integration and realignment
Oil derivatives grow
Spot prices benchmark for all trades
Growth of spot trading
Administered markets
• Insignificant spot market – most trade on term
• Administered government and corporation pricing
• 19 producers (13 in OPEC)
• Production, purchasing, and refining dominated by the “7 sisters” oil majors
• Vertically integrated industry
1950-72
• Spot sales only 5% of total sales; many traders enter spot market
• Rapid price escalation
• Term contracts increasingly linked to prices of spot benchmarks
• Nationalization of upstream operations breaks up vertical integration
1973-79
• Sellers’ market became buyers’ market
• Additional non-OPEC production reduces preeminence of OPEC
• Spot trading over 30% of total sales
• 1983 – WTI futures listed on NYMEX
• OTC derivatives illegal in U.S. until 1987
Early 1980s
• Increased price volatility
• 1986 crude price collapse
• “Netback pricing” by Saudis
• Forward and futures markets grow in importance
• Oil majors reduce costs
• 1987 – Chase completes first matched commodity swap
1986-89
• Intermediary trades dwarf underlying physical markets
• Increased liquidity and derivatives competition
• Major oil companies restructure activities – role of refining and marketing reviewed
Early 1990s-today
LNG
• Comparing the evolution of the oil market with LNG shows that this type of evolution of the LNG market could occur
• As the LNG market becomes fully arbitraged, efficient spot markets in LNG , shipping and regas capacity likely to emerge
• (1962-2000) • (2002-> • (2002->
Chapter 2: LNG value chain Comparing LNG - oil markets evolution

UNECE
Chapter 2: LNG value chain Global LNG Demand
26
177.4 241.7
2010 2015
Asia
84.1
50.5
14.0
8.4
9.8
17.2
2010 2015
New Markets *
USA - Canada
Europe
(* Argentina, Brazil, Caribbean, Mexico)
LNG imports in 2010 and 2015 by region (bcm) Source: IHS Cera
26
Atlantic Basin
• Global LNG demand is growing dramatically. The main drivers are: After Fukushima, some countries have implanted non-nuclear policies. Different
alternatives to meet the energy demand were considered and LNG was presented as the most competitive and safest option.
New importers have emerged in Asia and Latin America, suppliers have diverted their volumes from the traditional Atlantic Market to the Pacific, affecting prices for the new Atlantic consumers.

UNECE
Chapter 2: LNG value chain NG vs Renewables: the Spanish case
27
Power Generation by Source (TWh) Gas Consumption (TWh)
UNECE
28
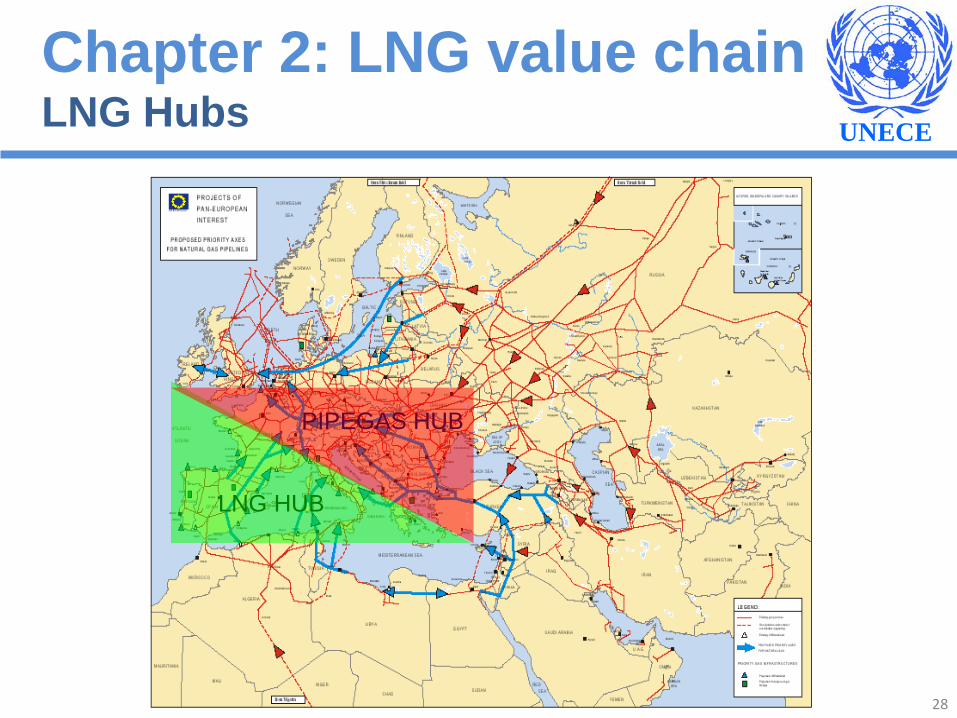
LNG HUB
PIPEGAS HUB
Chapter 2: LNG value chain LNG Hubs

UNECE
Range of approaches to LNG access regulation
Chapter 3: Regulation
Heavy Regulation
Light-handed regulation
Chapter 3: Detailed review of LNG regulation at a European level, in the USA, and in Japan, 3 areas where different regulatory models have been adopted.
Regulated and non-regulated regimes are not good or bad per se.
These models are in constant evolution, as a result of the recurrent interaction between the industry and regulators.
29

UNECE Chapter 3: Regulation
Regulatory evolution and trends - US
Open access not required under Energy Policy Act 2005
Open access not required
Open access
US: decision to remove access regulation from new terminals adopted in 2002 (Hackberry) and 2005 (EPAct).
Two regimes coexist.
30

UNECE
Regulatory evolution and trends - US
Chapter 3: Regulation
LNG import terminals (proposed/potential) LNG export terminals (proposed/potential/authorised)
Source: FERC. As of February 21, 2014 Source: FERC. As of July, 2009
Jordan Cove, OR
The access model is not driving the regulatory debate nowadays, after the shale gas revolution. Several terminals plan to export LNG, the debate have shited to export authorisation permits for non-free trade agreement countries.
31

UNECE Chapter 3: Regulation
1998 1999 2000 2001 2002 2003 2004 2005 2006 2007 2008 2009 2010 2011 2012 2013
Directive 98/30/EC
1st Gas Directive
Directive 2003/55/EC
2nd Gas Directive
Directive 2004/67/EC
Security of Supply
Regulation 1775/2005
Third party access to Gas Pipelines
Directive 2009/73/EC
3rd Gas Directive
Regulation 713/2009
ACER
Regulation 715/2009
Third party access to Gas Pipelines (incl. LNG and storages)
Regulation 994/2010
Security of Supply
Regulation 347/2013
Trans-European Energy Infrastructure
“3rd Package” Regulation 1227/2011
REMIT: Regulation on Energy Market Integrity
and Transparency
Regulatory evolution and trends - EU
rTA and nTPA allowed
rTA as default regime. Exemptions allowed for new capacity
32

UNECE Chapter 3: Regulation
Regulatory evolution and trends - EU
Regulated
Exempted
Exempted - Under Construction
Under Construction/FID adopted - Regulated
Fos Tonkin
Huelva
Cartagena
Barcelona Sines
Bilbao
Montoir
Sagunto
Ferrol
Gate LNG Isle of Grain
Fos Cavau Adriatic LNG (*)
OLT Offshore LNG Toscana
South Hook Dragon
El Musel
Polskie LNG
Zeebrugge Dunkerque
Revithousa
Panigaglia
(*) 80% of the capacity is exempted, the remaining 20% is subject to rTPA
Other Exempted - Cancelled Brindisi
Liongas LNG Eemshaven
Other Exempted – FID not taken
Shannon
Porto Empedocle (*) 33

UNECE Chapter 3: Regulation
Evolution of LNG regas capacity in Europe
34
UNECE Chapter 3: Regulation
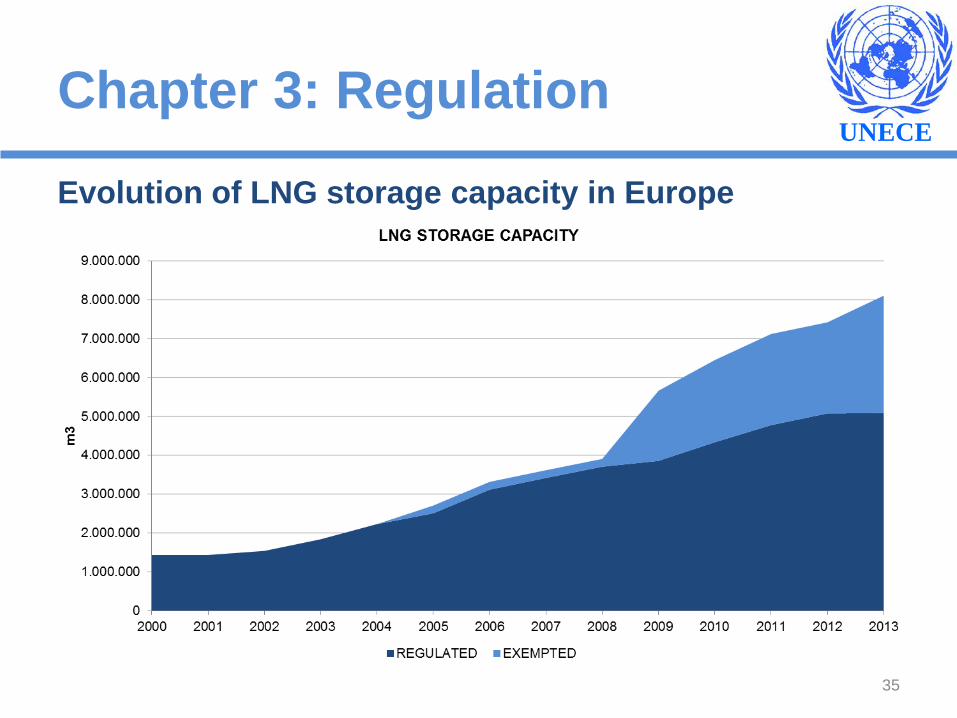
Evolution of LNG storage capacity in Europe
35

UNECE
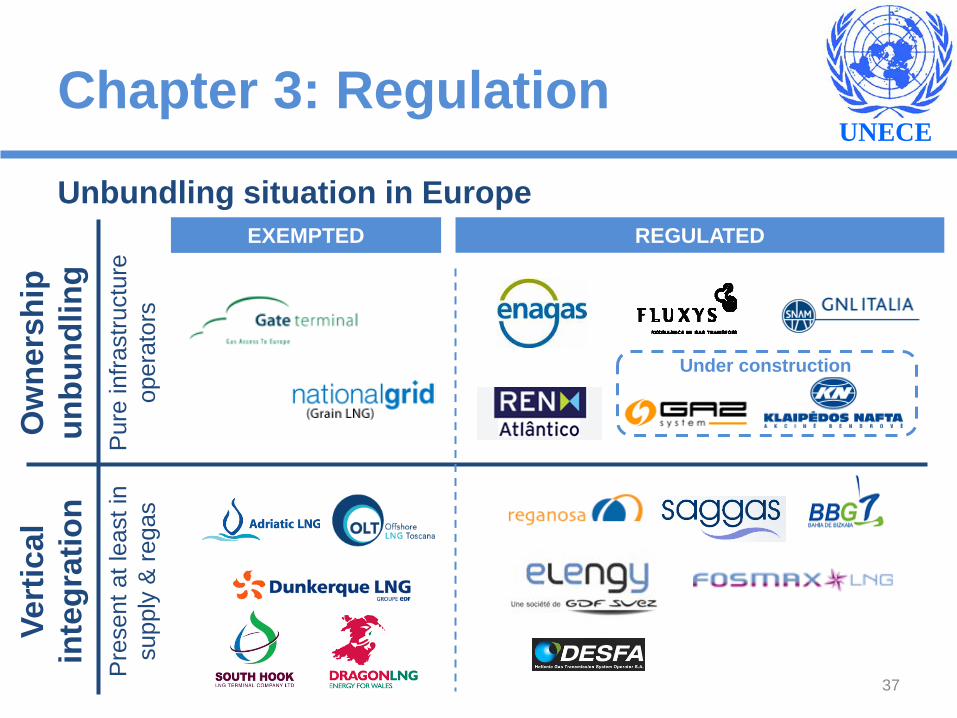
Integrated & unbundled (ownership) operators In practice regulated LNG terminals (and some exempted terminals
as well) are operated by regulated TSOs subject to ownership unbundling, except in France and in some Spanish terminals
Chapter 3: Regulation
COMPANY Transmission LNG UGS Distribution
36
UNECE
Unbundling situation in Europe
Chapter 3: Regulation O
wne
rshi
p un
bund
ling
Pur
e in
frast
ruct
ure
oper
ator
s
Vert
ical
in
tegr
atio
n P
rese
nt a
t lea
st in
su
pply
& re
gas
REGULATED EXEMPTED
Under construction
37

UNECE Chapter 3: Regulation
Zeebrugge (Fluxys)
Fos Cavaou (Fosmax LNG)
Fos Tonkin (Elengy)
Montoir de Bretagne (Elengy)
Revithousa (Desfa)
Adriatic LNG (Adriatic LNG)
Panigaglia (GNL Italia)
Toscana Offshore
(OLT Toscana Offshore)
Sines (REN)Barcelona (Enagás)
Cartagena (Enagás)
Huelva (Enagás)
Bilbao (BBG)Mugardos
(Reganosa)Sagunto (Saggas)
Rotterdam (Gate LNG)
Milford Haven (Dragon LNG)
Isle of Grain (Grain LNG)
Milford Haven (South Hook)
Basic servicesUnloadingStorageRegasificationAdditional servicesAdditional storageAdditional regasificationRedelivery servicesTank to ship loadingTanker cooling downTanker gassing upShip to ship loadingTruck loadingComplementary servicesShip approvalQuality adjustmentsOdorisationNitrogen servicingTrading specific servicesRegasification capacity tradingLNG inventory exchangeStorage capacity tradingUnloading slot trading
Service currently offeredService to be provided in the short-term and/or announce by the TO
Basic and additional / ancillary services All LNG terminals offer the basic services of unloading, storage and
regas. Additional services vary per country of terminal and are offered under different regimes
38
UNECE
The coexistence of regimes poses some questions.
Regulatory developments are focused on implementation of the 3rd Package, CMPs and transparency.
Tendency to make use of Open Seasons for new capacity, and sometimes to reallocate existing capacity.
Chapter 3: Regulation
39

UNECE Chapter 3: Regulation
TPA not implemented in Asia, but debated in some countries.
Operators in Japan are obliged to create manuals for negotiations about the use of LNG terminals. Not used in practice.
In late 2013 a public debate has been opened about whether to have clearer rules about TPA to LNG terminals, as part of a series of policy discussions aimed at further deregulating the country’s natural gas market.
Regulatory evolution and trends - Japan
40

UNECE Chapter 3: Regulation
Strategic issues affecting regulation in importing countries
Import regulations
Flexibility of supply
Liquidity
Prices
Security of supply /
Diversification of Supply
Development of new services
(Small scale / Bunkering)
41
UNECE Chapter 4: Interoperability
Critical aspect: ship to terminal interface compatibility Enormous range of coastal and port
environments Differences in local operational procedures
from port to port Increasing ship shore compatibility
42
UNECE Chapter 4: Interoperability
43
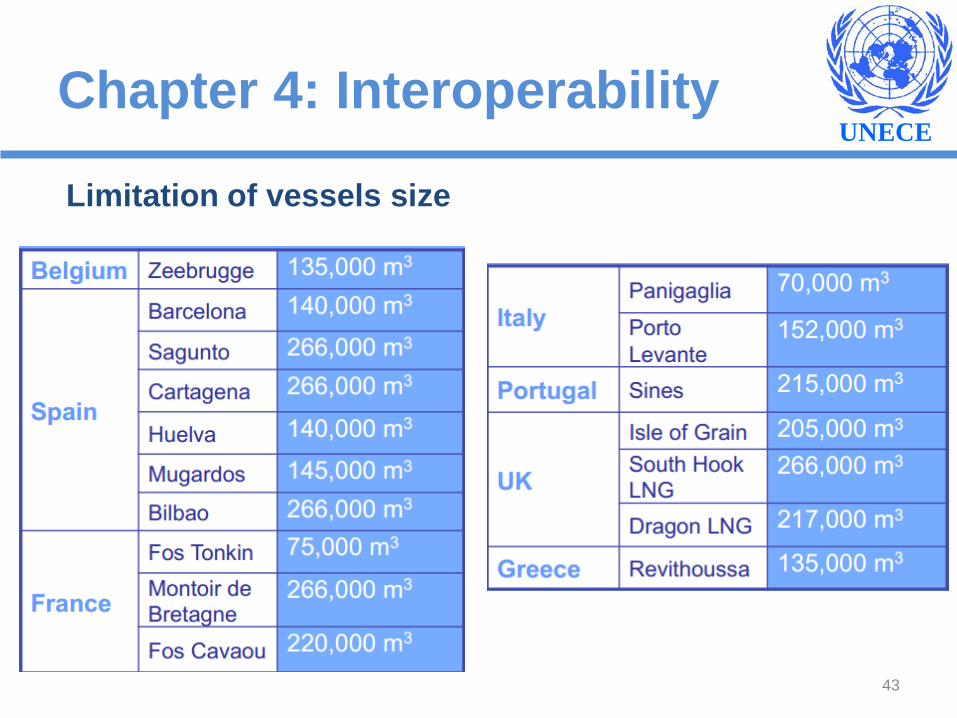
Limitation of vessels size

UNECE Chapter 4: Interoperability
Gas quality harmonization is an important effort Global harmonization or at least regional
harmonization Accurate analysis and measurement of
LNG quality is very important
44

UNECE Chapter 4: Interoperability
45
Wobbe Index

UNECE Chapter 4: Interoperability
LNG industry: excellent safety record Increasing spot-trading cargoes and off-
loading projects (FSRU, FSU, etc…) Encourage dialogue between: LNG
producers and receivers, LNG shippers, etc… New bi-directional capability,
regasification+liquefaction in the same plant
46

UNECE Chapter 4: Interoperability
Summing up, the chapter Interoperability and safety identifies the current issues, trends, requirements and challenges to allow the LNG industry to grow in safety and interoperability worldwide
47

UNECE Some Conclusions
48
69%
21%
10%
World Gas Consumption in 2012
Consumed whereproducedPipeline trade
LNG trade
3314 Bcm
Source: BP Statistical Review 2013

UNECE Some Conclusions
LNG advantages specifically fitting emerging energy market needs:
Balancing fuel for power generation New end-user oriented developments
(Small Scale LNG) Spot and short term agreements Global business
49

UNECE Some Conclusions
50 Source: IHS (IGU World LNG Report 2014)
Steep rise of non long-term contracts

UNECE Some Conclusions
51 Source BG. March 2014
LNG is a global business

UNECE Some Conclusions
LNG industry priority challenges:
Containing cost escalation Remaining competitive in power
generation Attracting financial resources
52

UNECE Some Conclusions
53 Source: Wood Mackenzie (OIES. LNG Plant Cost Escalation, 2014)
The LNG plant cost challenge

UNECE Some Conclusions
54
Different CAPEX will impact on project competitiveness
Source: IHS, US DOE (IGU World LNG Report 2014)

UNECE Some Conclusions
55
Regas: the most economic step of the LNG chain
Source: IHS, Companies (IGU World LNG Report 2014)

UNECE Some Conclusions
56
Gas competitiveness under threat in Europe
Source: IEA, Gas Medium-Term Market Report 2013
2007 Forecast
2013 Forecast
Euro zone crisis
Unfavourable sparkspreads
Renewable policies

UNECE Some Conclusions
57 Source: IEA Medium Term Gas Market Report 2013
Regional gas prices and LNG competitiveness

Thank you for your attention…and remember “LNG Makes Gas Global”
58
14th April 2014 - Geneva