Current Metrics: What is Measured Now?/media/Files/Activity Files... · Current Metrics: What is...
18
Current Metrics: What is Measured Now? Graduate Medical Education Outcomes and Metrics National Academies Washington, DC October 10-11, 2017 Peter J Katsufrakis National Board of Medical Examiners
Transcript of Current Metrics: What is Measured Now?/media/Files/Activity Files... · Current Metrics: What is...

Current Metrics: What is Measured Now?
Graduate Medical Education Outcomes and Metrics
National Academies Washington, DC
October 10-11, 2017
Peter J Katsufrakis National Board of Medical Examiners
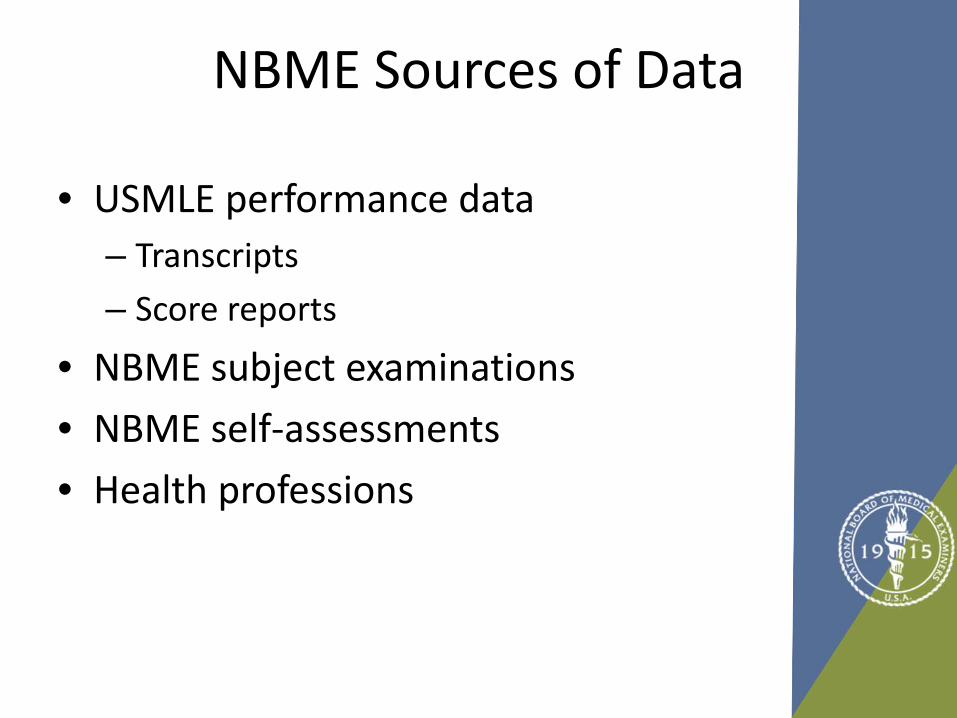
NBME Sources of Data
• USMLE performance data – Transcripts – Score reports
• NBME subject examinations • NBME self-assessments • Health professions

USMLE
• Four elements: Step 1, Step 2 CK, Step 2 CS, Step 3
• Steps 1 and 2 CK: single best answer, multiple choice questions (SBA MCQs)
• Step 3: SBA MCQs and computer case simulations
• Step 2 CS: 12 standardized patient stations

[Step 1 score report

United States Medical Licensing Examination Step 1 Score Report
This score reposrt is provided for the use of the examinee. Third-party users of USMLE information are advised to rely solely on official USMLE transcripts.
Name: Avg, Exee USMLE ID: 0-000-000-0 Test Date: May 13, 2016
Your Performance Percentile Rank
48 Test Score
231 Test Result
PASS
If you tested repeatedly on a different set of items covering the same content,
without learning or forgetting, your score would fall within one standard error of measurement (SEM) of your current score two thirds of the time.
Your score +/- SEM: 226-236
Your Performance Compared To Others
The histogram represents the score for first time takers from U.S. and Canadian Medical Schools. Reported scores range from 1-300 with a mean of 229 and a standard deviation of 20.
Overall Performance
Your Score
Minimum Passing Score
NOTE: Results of the examination are reported to medical licensing authorities in the United States and its territories for the use in granting an initial license to practice medicine. This score represents your result for the administration of Step 1 on the test date shown above.
Page 1 of 2
SEM 5
231
192

[Step 1 score profile]

Test Date: May 13, 2016 USMLE ID: 0-000-000-0
Name: Avg, Exee
Relative Strengths And Weaknesses
Relative Performance By Physician Task Compared to Your Overall Performance
Higher
Same
Lower
Practice Based Learning & Assessment
Patient Management Care
Medical Knowledge
Medical Knowledge (55-65) % Items Per Test
Patient Care (20-30)
Management (15-20)
Practice Based Learning & Assmt (4-8)
Relative Performance By Discipline Compared to Your Overall Performance
Lower
Physiology
Pharma
Pathology
Microb & Immun
Histo & Cell Bio
Gross Anat & Emb
Genetics Biochem & Nutrition
Behavioral Sciences
% Items Per Test Pathology (45-55)
Physiology (25-35)
Biochem & Nutrition (18-22) Gross Anat & Emb (10-15) Microb & Immuno (15-20) Pharmacology (17-22) Histo & Cell Bio (8-12) Beh Sciences (8-12) Genetics (8-12)
Relative Performance By System Compared to Your Overall Performance
Higher
General Principles Found. Science
Biostats & Pop Health
Multisys. Process/ Disorders
Repro& Endoc System
Respir.& Renal/ Urinary System
Cardio. System
Musco. Skin,& Subcut. Tissue
Behav. Health & Nerv. System
Blood Lymph & Immune System
Gastro System
% Items Per Test Gen Principles (15-20)
Blood, Lymph & Imm (7-11) Beh Health & Nerv (8-12) Musk, Skin & Subcut (6-10) Cardiovasc (6-10) Pharmacology (17-22) Multisys Proc & Dis (7-11) Gastro (5-9)
Higher + Same
Repro & Endo (5-9) Biostats & Epidem (4-8) Resp Sys (4-8) Urinary (4-8)
Same
Lower -

USMLE Examinee Volumes and Performance, 2016
# tested % passing # tested % passing # tested % passing # tested % passingExaminees from US/Canadian Schools
MD Degree1st Takers 20,122 96% 20,535 97% 19,906 97% 18,977 97%Repeaters 1,000 64% 980 71% 716 85% 597 70%
DO Degree1st Takers 3,398 94% 2,228 94% 46 91% 20 95%Repeaters 56 75% 44 84% 0 NA 1
Subtotal 24,576 94% 23,787 95% 20,668 97% 19,595 96%
Examinees from Non-US/Canadian Schools1st Takers 15,031 78% 12,720 80% 12,051 82% 8,804 86%Repeaters 2,575 39% 2,738 53% 2,300 71% 1,355 53%
Subtotal 17,606 72% 15,440 75% 14,351 81% 10,159 81%
Total
Step 1 Step 2 CK Step 2 CS Step 3
42,182 39,227 35,019 29,754

Basic Science Subject Exams
0
1000
2000
3000
4000
5000
6000
# of
Exa
min
ees
Scor
ed
2016 Basic Science Volumes

Clinical Science Subject Exams
0
5,000
10,000
15,000
20,000
25,000
30,000
Adult AmbMedicine
ClinicalNeurology
Family MedModular
Medicine Obstetricsand
Gynecology
Pediatrics Psychiatry Surgery
# of
Exa
min
ees
Scor
ed
2016 Clinical Science Volumes

Health Professional Organizations • American Board of Addiction Medicine
• American Board of Medical Genetics and
Genomics
• American Board of Neurological Surgery
• American Board of Obesity Medicine
• American Board of Quality Assurance and Utilization Review Physicians, Inc.
• American College of Cardiology
• American College of Physicians
• American College of Rheumatology
• American Osteopathic Board of Orthopedic Surgery
• American Society of Clinical Oncology
• American Society of Hematology
• American Society of Plastic Surgeons
• Infectious Diseases Society of America
• International Board of Heart Rhythm Examiners
• National Board of Echocardiography, Inc.

Challenges and Lessons Learned
• Data isolation • Data matching • Data policies • Internal and external barriers • Data Commons

WHAT MIGHT BE ADDED?
Pediatrics Milestones Assessment Collaborative (PMAC)
PMAC Mission: To uphold the public trust by creating a unified, longitudinal approach to assessment of Pediatricians that:
• verifies continued competence beyond just medical knowledge • drives continuous performance improvement • facilitates lifelong learning, and • recognizes and guides both personal and professional growth

APPD LEARN Sites Engaged in PMAC Data Collection 2011-present

PMAC Candidate Inferences Time range anticipated for achievement
Decision Description MS-III to MSIV
PGY-1 PGY-2 PGY-3
Readiness to serve as an intern
Readiness to care for patients without the presence of an onsite supervisor
Ready to supervise others in the care of patients, without the presence of an onsite supervisor
Competence in identifying areas of new learning for self, creating activities to address gaps
Competence in identifying areas for improvement in systems associated with practice
Ready to practice without supervision

PMAC Outcomes – Module 1 Instrument Number of Instruments Generalizability
Coefficient
Resident MSF1 6 .82
PMAC Outcomes – Module 2
Instrument Number of Instruments Generalizability Coefficient
Resident MSF 6 .80
Faculty MSF 6 .75
Nurse MSF 6 .86
SCO* 4 .60
1MSF = Multi-source feedback ; SCO=Structured clinical observation (of rounds, history or physical examination
*The reliability of the SCO is not expected to be high, due to the large variance in the activities (and therefore behaviors) on rounds.
PMAC Publications • Schwartz, A., Margolis, M. J., Multerer, S. Haftel, H. M., Schumacher, D. J., APPD LEARN-NBME
Pediatrics Milestones Assessment Group (2016). A multi-source feedback tool for measuring a subset of Pediatrics milestones. Med Teach, 1-8.
• Hicks, PJ, Margolis, M., Poynter, S., Chaffinch, C., Tenney-Soeiro, R., MD, Turner, T., Waggoner-Fountain, L., Young, R., Clyman, S., Schwartz, A., for the APPD LEARN - NBME Pediatrics Milestones Assessment Group (2016).The Pediatrics Milestones Assessment Pilot: Development of workplace-based assessment. Academic Medicine. 91:5,701-709.
• Turner TL, Bhavaraju VL, Luciw-Dubas UA, Hicks PJ, Multerer S, Osta A, McDonnell J, Poynter S, Schumacher DJ, Tenney-Soeiro R et al (2017). Validity evidence from ratings of pediatric interns and subinterns on a subset of pediatric milestones. Academic Medicine. 92(6):809-819.
• Hicks PJ, Margolis, M.J., Carraccio, C.L., Clauser, B.E., Donnelly, K., Fromme, H.B., Gifford, K.A., Poynter, S.E., Schumacher, D.J., Schwartz, A., and the PMAC Module 1 Study Group. A novel workplace-based assessment for competency-based decisions and learner feedback. [Submitted to Medical Teacher]