Current Climate Variability Assessment, Climate Change Report.pdf · Current Climate Variability...
55
Transcript of Current Climate Variability Assessment, Climate Change Report.pdf · Current Climate Variability...
Current Climate Variability Assessment, Climate Change Projections and Identification of “Climate Hotspot Blocks” for ICRG Blocks under MGNREGA
Infrastructure for Climate Resilient Growth in India (ICRG) Programme
Submitted By:
In association with
July, 2017
IPE GLOBAL LIMITED IPE Global House, B - 84, Defence Colony, New Delhi - 110 024, India www.ipeglobal.com
Indian Institute of Science, Bangalore
i
Current Climate Variability Assessment, Climate Change Projections and Identification of “Climate Hotspot Blocks” for ICRG Blocks under MGNREGA
Infrastructure for Climate Resilient Growth in India (ICRG) Programme
TABLE OF CONTENTS
1. INTRODUCTION ....................................................................................................................... 1
2. METHODOLOGY ...................................................................................................................... 3 2.1. Study Area ................................................................................................................................................ 3 2.2. Approach and Steps Adopted for Rainfall and Temperature Trend Analysis for Past 30-Years (1984 to
2014) 4 2.3. Approach and Steps for Climate Change Projections ............................................................................... 4
3. HISTORICAL CLIMATE: TRENDS AND EXTREMES........................................................................ 5 3.1. Temperature Trends during the Historical Period (1984-2014) ............................................................... 5
3.1.1. Distribution of Blocks According to Mean Maximum and Minimum Temperature During Summer Months ........................................................................................................................... 5
3.1.2. Trends in Maximum Temperature during the Historical Period of 1984-2014 ............................. 7 3.2. Trends in Rainfall during the Historical Period (1984-2014) .................................................................... 9
3.2.1. Mean Seasonal (JJAS) Rainfall during 1984-2014 ....................................................................... 10 3.2.2. Monsoon Rainfall Variability during 1984-2014 ......................................................................... 11 3.2.3. Trends in Sowing Rains (June rainfall) during 1984-2014 ........................................................... 15 3.2.4. Occurrence of Droughts: Frequency and Intensity during 1984-2014 ....................................... 17 3.2.5. Number of high intensity Rainy Days During the Historical Period (1984-2014) ........................ 20
4. HOTSPOTS OF CURRENT RAINFALL VARIABILITY ..................................................................... 23
5. CLIMATE CHANGE PROJECTIONS FOR 2021-2050 .................................................................... 24 5.1. CORDEX Models and RCP Scenario used for Projections ....................................................................... 24 5.2. Temperature Projections for 2021-2050 ................................................................................................ 25
5.2.1. Distribution of Blocks According to Mean Maximum and Minimum Temperature during Summer Months during 2021-2050 ............................................................................................ 25
5.2.2. Trends in Maximum Temperature During 2021-2050 (by 2035) Compared to the Historical Period of 1984-2014 ................................................................................................................... 26
5.3. Rainfall Projections for the Period 2021-2050 (2035) ............................................................................ 29 5.3.1. Changes in Mean Monsoon (JJAS) Rainfall During 2021-2050 Compared to the Historical Period
1984-2014 ................................................................................................................................... 29 5.3.2. Frequency and Intensity of Rainfall During the Projected Period (2021-2050) .......................... 30 5.3.3. Change in Frequency and Intensity of high intensity Rainfall During the Projected Period (2021-
2050) Over the Historical Period (1984-2014) ............................................................................ 32
6. CHANGES IN RAINFALL VARIABILITY DUE TO PROJECTED CLIMATE CHANGE ............................ 36
7. HOTSPOTS OF RAINFALL VARIABILITY .................................................................................... 38
8. CONCLUSIONS OF THE STUDY AND IMPLICATIONS FOR CLIMATE RESILIENT INFRASTRUCTURE DEVELOPMENT UNDER MGNREGA ........................................................................................ 40 8.1. Main Conclusions ................................................................................................................................... 40 8.2. Implications for Developing Climate Resilient Infrastructure under MGNREGA ................................... 41
8.2.1. Implications for ICRG .................................................................................................................. 42 8.2.2. Designing Climate Resilient MGNREGA Infrastructure ............................................................... 43
REFERENCES .............................................................................................................................. 45
APPENDIX 1: Percentage Change in JJAS Rainfall - Projected vs. Historical - Bihar ...................... A-1
APPENDIX 2: Percentage Change in JJAS Rainfall - Projected vs. Historical - Chhattisgarh ........... A-2
APPENDIX 3: Percentage Change in JJAS Rainfall - Projected vs. Historical - Odisha .................... A-3
ii
Current Climate Variability Assessment, Climate Change Projections and Identification of “Climate Hotspot Blocks” for ICRG Blocks under MGNREGA
Infrastructure for Climate Resilient Growth in India (ICRG) Programme
LIST OF TABLES
Table 2.1: Steps and approach to historical climate trend analysis ....................................................................... 4
Table 2.2: Meta data of climate variability and climate change projection data used for 100 blocks ................... 4
Table 3.1: Mean monsoon (JJAS) rainfall in the ICRG blocks of Bihar, Chhattisgarh and Odisha during 1984-2014 .............................................................................................................................................................................. 10
Table 3.2: June to September rainfall, standard deviation and Coefficient of Variation for the ICRG blocks in Bihar during 1984-2014 ........................................................................................................................................ 12
Table 3.3: June to September rainfall, standard deviation and coefficient of variation for the ICRG blocks in Chhattisgarh during 1984-2014 ............................................................................................................................ 13
Table 3.4: June to September rainfall, standard deviation and coefficient of variation for the ICRG blocks in Odisha during 1984-2014 ..................................................................................................................................... 14
Table 3.5: Number of years with normal sowing rains during the historical 30-year period (1985-2014) .......... 16
Table 3.6: Criteria for analysis of drought ............................................................................................................ 18
Table 3.7: Frequency of occurrence of rainfall events of 51-100 mm and > 100 mm (units are in days) in the ICRG blocks of Bihar, Chhattisgarh and Odisha .................................................................................................... 20
Table 5.1: List of CORDEX models used in this study for climate change projections .......................................... 24
Table 5.2: Distribution of rainfall across different ICRG blocks (units are days) across two rainfall intensity classes of 51-100 mm and >100 mm/day ............................................................................................................. 31
Table 6.1: Hotspots of current and future climate variability based on Coefficient of Variation in rainfall ........ 36
Table 7.1: Hotspots of current and future climate variability based on CV in rainfall ......................................... 38
iii
Current Climate Variability Assessment, Climate Change Projections and Identification of “Climate Hotspot Blocks” for ICRG Blocks under MGNREGA
Infrastructure for Climate Resilient Growth in India (ICRG) Programme
LIST OF FIGURES
Figure 2.1: Study area; States and blocks included in the ICRG project ................................................................. 3
Figure 3.1: Observed mean maximum and minimum temperature (OC) in the ICRG blocks of Bihar during 1984-2014 ........................................................................................................................................................................ 6
Figure 3.2: Observed mean maximum and minimum temperature (OC) in the ICRG blocks of Chhattisgarh during 1984-2014 ................................................................................................................................................... 6
Figure 3.3: Observed mean maximum and minimum temperature (OC) in the ICRG blocks of Odisha during 1984-2014 ............................................................................................................................................................... 7
Figure 3.4: Change in mean maximum temperature (OC) during the 30-year period of 1984-2014 in the identified ICRG blocks of Bihar ............................................................................................................................... 8
Figure 3.5: Change in mean maximum temperature (OC) during the 30-year period of 1984-2014 in the identified ICRG blocks of Chhattisgarh ................................................................................................................... 8
Figure 3.6: Change in mean maximum temperature (OC) during the 30-year period of 1984-2014 in the identified ICRG blocks of Odisha............................................................................................................................. 9
Figure 3.7: Number of blocks experiencing increase in temperature of varying degrees over the 30-year period of 1984-2014 .......................................................................................................................................................... 9
Figure 3.8: Number of blocks receiving normal sowing rains during June under three frequencies of 1-5 years, 5-10 years and >10 years during the 30-year period of 1984-2014 ..................................................................... 16
Figure 3.9: Drought occurrence frequency in study blocks of Bihar during 1984-2014 ....................................... 18
Figure 3.10: Drought occurrence frequency in study blocks of Chhattisgarh during 1984-2014 ......................... 19
Figure 3.11: Drought occurrence frequency in study blocks of Odisha during 1984-2014 .................................. 19
Figure 4.1: Blocks or hotspots of current rainfall variability as indicated by CV under historical 30-year period (1984-2014) .......................................................................................................................................................... 23
Figure 5.1: Projected mean seasonal temperature (C) under RCP 8.5 scenario in the study blocks of Bihar for the period 2021-2050 ........................................................................................................................................... 25
Figure 5.2: Projected mean seasonal temperature (C) under RCP 8.5 scenario in the study blocks of Chhattisgarh for the period 2021-2050 ................................................................................................................ 26
Figure 5.3: Projected mean seasonal temperature (C) under RCP 8.5 scenario in the study blocks of Chhattisgarh for the period 2021-2050 ................................................................................................................ 26
Figure 5.4: Change in temperature (C) by 2035 (2021-2050) relative to the historical 1984-2014 period in the ICRG blocks of Bihar .............................................................................................................................................. 27
Figure 5.5: Change in temperature (C) by 2035 (2021-2050) relative to the historical 1984-2014 period in the ICRG blocks of Chhattisgarh.................................................................................................................................. 28
Figure 5.6: Change in temperature (C) by 2035 (2021-2050) relative to the historical 1984-2014 period in the ICRG blocks of Odisha ........................................................................................................................................... 28
Figure 5.7: Top five blocks projected to increase or decrease in rainfall during 2021-2050 period compared to the historical period of 1984-2014 ....................................................................................................................... 30
Figure 5.8: Change in frequency of occurrence (in days) of rainfall events of 51-100 mm and > 100 mm in the projected scenario (2021-2050) relative to the historical period (1984-2014) in the ICRG blocks of Bihar......... 33
Figure 5.9: Change in frequency of occurrence of rainfall events of 51-100 mm and > 100 mm in the projected scenario (2021-2050) relative to the historical period (1984-2014) in the ICRG blocks of Chhattisgarh ............. 34
Figure 5.10: Change in frequency of occurrence of rainfall events of 51-100 mm and > 100 mm in the projected scenario (2021-2050) relative to the historical period (1984-2014) in the ICRG blocks of Odisha ...................... 34
1
Current Climate Variability Assessment, Climate Change Projections and Identification of “Climate Hotspot Blocks” for ICRG Blocks under MGNREGA
Infrastructure for Climate Resilient Growth in India (ICRG) Programme
1. INTRODUCTION
Climate change is one of the most important global environmental challenges facing
humanity. Climate change, driven by the increasing concentration of greenhouse gases
(GHG), is projected to impact natural ecosystems and socio-economic systems. According to
IPCC (2014), climate change is already occurring and impacting natural ecosystems and
socio-economic systems such as food production. India, is already experiencing a significant
level of warming and changes in the rainfall pattern accompanied by increasing rainfall
variability. The agriculture sector and farming communities are already experiencing higher
levels of climate variability and extreme events (e.g., droughts and floods).
The Paris Agreement aims at "Enhancing adaptive capacity, strengthening resilience, and
reducing vulnerability to climate change". Further, the Agreement highlights "The current
need for adaptation is significant", and "the need for assessment of climate change impacts
and vulnerability" and "Building resilience of socio-economic and ecological systems". India’s
INDC also aims “To better adapt to climate change by enhancing investments in
development programmes in sectors vulnerable to climate change, particularly agriculture
and water resources and in regions such as the Himalayas and the coastal regions”.
The vulnerability of developing countries to potential impacts of climate change and the
need for adaptation is thus rapidly emerging as the central issue in the debate around policy
responses to climate change. There is also a need for combining disaster reduction, natural
resource management and climate change adaptation in a new approach to reduce
vulnerability and enhance resilience to climate risks. Given the inherent costs involved,
adaptation should be pursued not as an end but as a means to meet the development
objectives of the countries. India has been implementing a large number of developmental
programmes and projects as part of national economic development goals largely with
domestic funding and limited bilateral and multilateral sources, which may have to be
climate proofed. One such major developmental programme is the MGNREGA.
Climate change projections for India indicate that different parts of India will experience
different levels of warming as well as changes in rainfall pattern. A good understanding of
the historical climate trends, current climate variability and climate change projections is
very critical for identifying the most vulnerable regions, cropping systems, communities,
etc., and to prioritize and implement adaptation / resilience measures. This study aims at
assessing the trends in observed climate, current climate variability and make climate
change projections for the selected 100 blocks under the ICRG programme. The specific
objectives as detailed in the proposal are:
1. Based on the IMD historical climate data, conduct climate trend analysis for monsoon
seasonal rainfall, temperature changes and droughts at block level;
2. Conduct current climate variability analysis and a trend analysis of monsoon season
rainfall at block level;
3. Make climate change projections at block level for 2030s and 2050s; maximum and
minimum temperature, monsoon seasonal rainfall, monthly rainfall and droughts;
2
Current Climate Variability Assessment, Climate Change Projections and Identification of “Climate Hotspot Blocks” for ICRG Blocks under MGNREGA
Infrastructure for Climate Resilient Growth in India (ICRG) Programme
4. Rank and prioritize the 100 blocks to identify the “Hotspots” of current climate
variability and future climate change according to:
Current monsoon season rainfall variability;
Projected monsoon season rainfall and its variability;
Occurrence of droughts.

3
Current Climate Variability Assessment, Climate Change Projections and Identification of “Climate Hotspot Blocks” for ICRG Blocks under MGNREGA
Infrastructure for Climate Resilient Growth in India (ICRG) Programme
2. METHODOLOGY
2.1. Study Area
The study is being conducted in the three states of Bihar, Chhattisgarh and Odisha, covering
the 100+ blocks, identified under the DFID Infrastructure for Climate Resilient Growth in
India (ICRG) Programme. The blocks selected under the ICRG program are presented in
Figure 2.1.
Bihar
Chhattisgarh
Odisha
Figure 2.1: Study area; States and blocks included in the ICRG project

4
Current Climate Variability Assessment, Climate Change Projections and Identification of “Climate Hotspot Blocks” for ICRG Blocks under MGNREGA
Infrastructure for Climate Resilient Growth in India (ICRG) Programme
2.2. Approach and Steps Adopted for Rainfall and Temperature Trend Analysis for Past 30-
Years (1984 to 2014)
The procedure adopted for historical climate analysis is presented in Table 2.1. Daily gridded
rainfall dataset of 0.25° latitude x 0.25° longitude provided by Indian Meteorological
Department (IMD) for the India region for the 30-year period of 1984– 2014, for
precipitation (Pai et al. 2014), and 1.0°x1.0° latitude and longitude gridded daily
temperature data, spanning over 30 years (1984-2014) for maximum and minimum
temperature (Rajeevan et al. 2006), has been used to calculate the variability and trend in
precipitation and temperature respectively. Rainfall variability is assessed only for the critical
southwest monsoon (rainy) season and temperature is assessed only for the summer season
for heat stress. For assessing the temperature variability block-wise data was obtained by re-
gridding the temperature dataset to 0.2°x0.2°, and re-aggregating by the districts to study
the maximum and minimum temperature variability at block level.
Table 2.1: Steps and approach to historical climate trend analysis
STEP 1 Selection of blocks Blocks identified under the DFID – ICRG
programme
STEP 2 Access the IMD historical data for
the past 30 years at block level
Mean monthly temperature, max-min
temperature, and daily rainfall
STEP 3 Conduct analysis of trends in
climate parameters at block level
Trends in Mean Monthly Max and Min
temperature
Trends in Monsoon Season rainfall
Monsoon rainfall variability
Trends in occurrence of high intensity rainfall
events
Trends in frequency of droughts
2.3. Approach and Steps for Climate Change Projections
The CORDEX South Asia modeled data on precipitation, maximum temperature and
minimum temperature have been analyzed for 100 blocks. The details of data used for
historical/observed and climate change analysis for 100 blocks is given in Table 2.2.
Table 2.2: Meta data of climate variability and climate change projection data used for 100 blocks
Variable Data source Period Grid resolution (°)
Observed maximum
temperature and
precipitation
IMD, Pune (http://imd.gov.in/) 1984-
2014
1° x 1°(temp)
0.25° x 0.25
(rainfall)
Projected maximum
temperature and
projected precipitation
CORDEX South Asia, IITM Pune (RCP 8.5)
RCM - SMHI-RCA4 (Rossby Centre
regional atmospheric model V.4, Swedish
Meteorological and Hydrological Institute
2021-
2050
0.5° x 0.5°
Daily data for the study blocks have been used for rainfall intensity analysis. Climate change
projections on precipitation, maximum temperature and minimum temperature have been
assessed. Grid-resolution for the climate projection is 0.5°x0.5°. The ensemble mean of 5
RCM models for precipitation, maximum temperature, and minimum temperature data has
been analyzed for RCP 8.5 scenario, which is more likely.


5
Current Climate Variability Assessment, Climate Change Projections and Identification of “Climate Hotspot Blocks” for ICRG Blocks under MGNREGA
Infrastructure for Climate Resilient Growth in India (ICRG) Programme
Climate in a narrow sense is defined as average weather, or more rigorously, as the statistical
description in terms of the mean and variability of relevant quantities over a period ranging from
months to hundreds of years. The relevant climate parameters include temperature, rainfall and
wind. Climate variability refers to variations in the mean state of temperature, monthly or seasonal
rainfall, etc. and other statistics such as standard deviations, statistics of extremes, etc. of the
climate on a temporal and spatial scale, beyond that of individual weather events.
3. HISTORICAL CLIMATE: TRENDS AND EXTREMES
In this section, the historical trends in temperature and rainfall across the ICRG blocks in the
three states of Bihar, Chhattisgarh and Odisha for the 30-year period of 1984-2014 is
presented.
3.1. Temperature Trends during the Historical Period (1984-2014)
In this section, temperature analysis has been carried out for the March to May period
(summer), since this is the period when heat stress events are likely to occur. Analysis of the
IMD (Indian Meteorological Department) temperature data shows the following:
In Bihar, mean summer maximum temperature for the selected ICRG blocks varied from
32.1 OC to 36.6 OC, whereas the mean summer minimum temperature varied from 14.9 OC to 18.2 OC.
In Chhattisgarh, the mean summer maximum temperature in the ICRG blocks varied
from 36.5 OC- 37.2 OC and mean summer minimum temperature varied from 17 OC - 19.8 OC.
In Odisha, the mean summer maximum temperature for selected ICRG blocks varied
from 35 OC to 37 OC and the mean summer minimum temperature varied from 20.12 OC -
23.13 OC.
3.1.1. Distribution of Blocks According to Mean Maximum and Minimum Temperature During
Summer Months
In this section, the distribution of blocks according to maximum and minimum temperature
during the summer months of March, April and May (MAM) is presented.
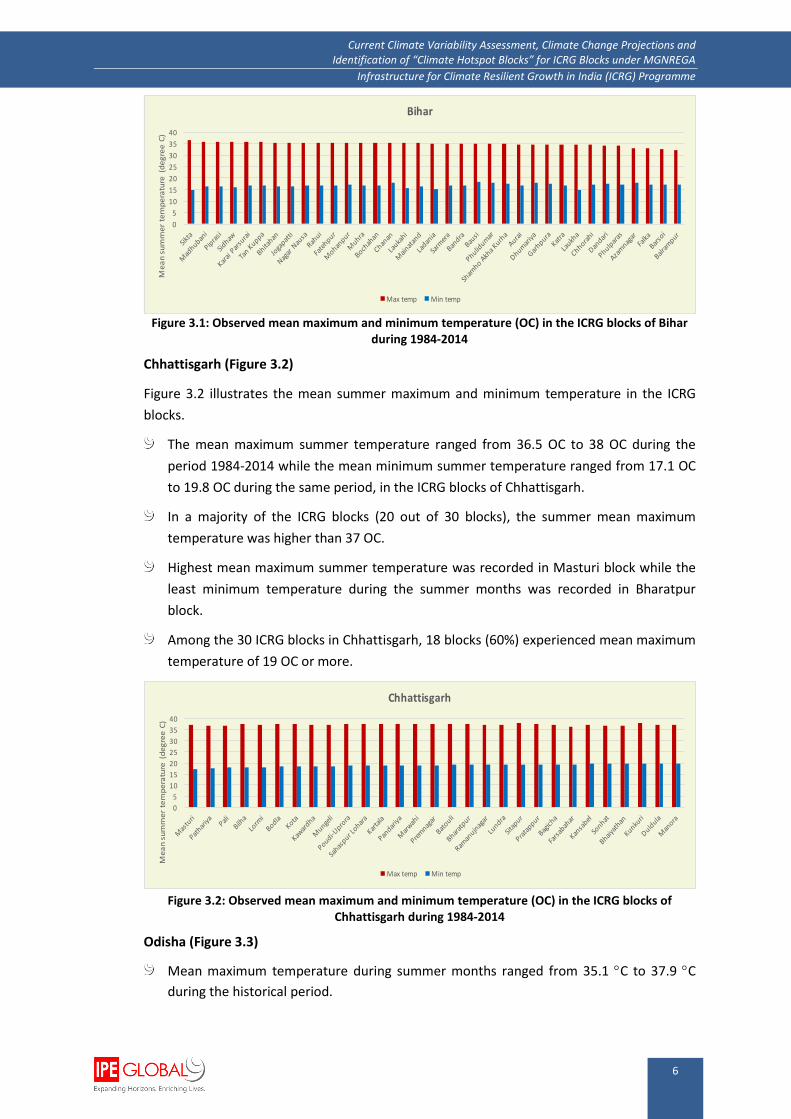
Bihar (Figure 3.1)
Mean maximum summer temperature in the ICRG blocks of Bihar ranged from 32.1 OC
to 36.6 OC during the historical period of 1984-2014.
Sikta block recorded the highest mean maximum summer temperature (36.6 OC) during
the historical period.
In almost 50% (17 out of 35) of the ICRG blocks, mean maximum summer temperature
recorded during the historical period was >35 OC.
The mean minimum summer temperature in the ICRG blocks ranged from 14.9 OC to
18.2 OC during the historical period.
Sikta and Laukha blocks recorded the least mean minimum summer temperature (14.9 OC) during the historical period.
6
Current Climate Variability Assessment, Climate Change Projections and Identification of “Climate Hotspot Blocks” for ICRG Blocks under MGNREGA
Infrastructure for Climate Resilient Growth in India (ICRG) Programme
Figure 3.1: Observed mean maximum and minimum temperature (OC) in the ICRG blocks of Bihar
during 1984-2014
Chhattisgarh (Figure 3.2)
Figure 3.2 illustrates the mean summer maximum and minimum temperature in the ICRG
blocks.
The mean maximum summer temperature ranged from 36.5 OC to 38 OC during the
period 1984-2014 while the mean minimum summer temperature ranged from 17.1 OC
to 19.8 OC during the same period, in the ICRG blocks of Chhattisgarh.
In a majority of the ICRG blocks (20 out of 30 blocks), the summer mean maximum
temperature was higher than 37 OC.
Highest mean maximum summer temperature was recorded in Masturi block while the
least minimum temperature during the summer months was recorded in Bharatpur
block.
Among the 30 ICRG blocks in Chhattisgarh, 18 blocks (60%) experienced mean maximum
temperature of 19 OC or more.
Figure 3.2: Observed mean maximum and minimum temperature (OC) in the ICRG blocks of
Chhattisgarh during 1984-2014
Odisha (Figure 3.3)
Mean maximum temperature during summer months ranged from 35.1 C to 37.9 C
during the historical period.
0
5
10
15
20
25
30
35
40
Meansummertemperature(degreeC)
Bihar
Maxtemp Mintemp
0
5
10
15
20
25
30
35
40
Meansummertemperature(degreeC)
Chhattisgarh
Maxtemp Mintemp
7
Current Climate Variability Assessment, Climate Change Projections and Identification of “Climate Hotspot Blocks” for ICRG Blocks under MGNREGA
Infrastructure for Climate Resilient Growth in India (ICRG) Programme
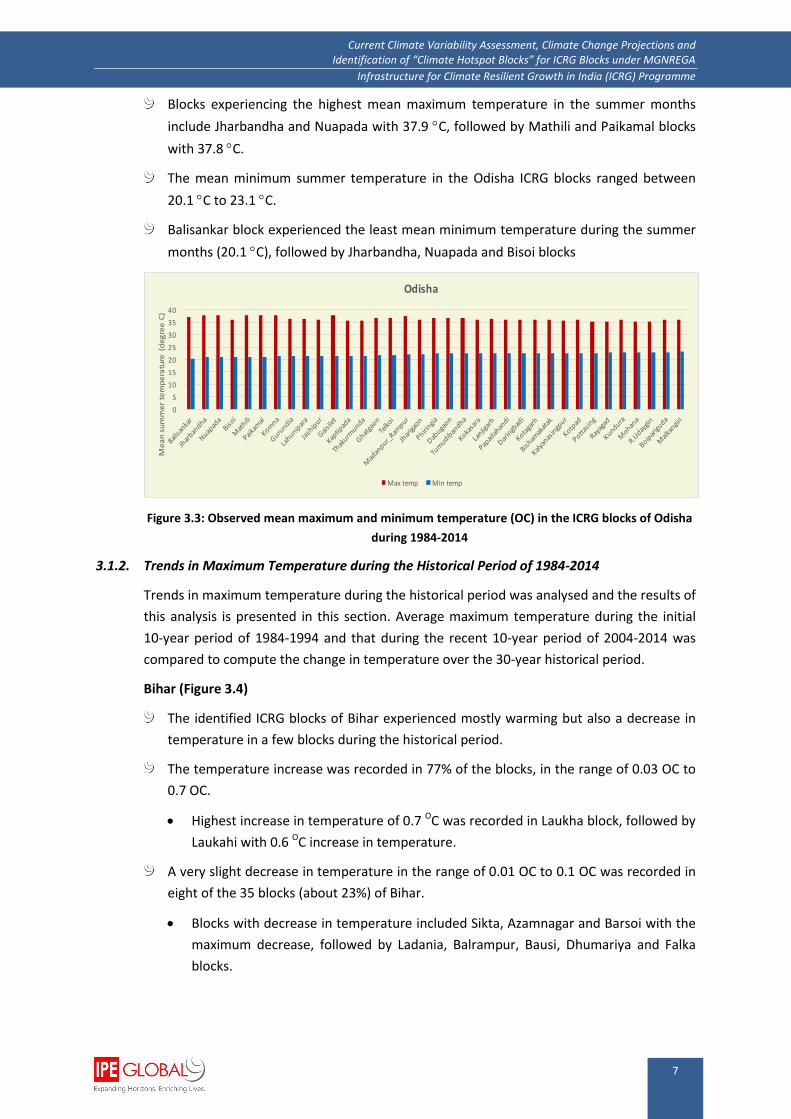
Blocks experiencing the highest mean maximum temperature in the summer months
include Jharbandha and Nuapada with 37.9 C, followed by Mathili and Paikamal blocks
with 37.8 C.
The mean minimum summer temperature in the Odisha ICRG blocks ranged between
20.1 C to 23.1 C.
Balisankar block experienced the least mean minimum temperature during the summer
months (20.1 C), followed by Jharbandha, Nuapada and Bisoi blocks
Figure 3.3: Observed mean maximum and minimum temperature (OC) in the ICRG blocks of Odisha
during 1984-2014
3.1.2. Trends in Maximum Temperature during the Historical Period of 1984-2014
Trends in maximum temperature during the historical period was analysed and the results of
this analysis is presented in this section. Average maximum temperature during the initial
10-year period of 1984-1994 and that during the recent 10-year period of 2004-2014 was
compared to compute the change in temperature over the 30-year historical period.
Bihar (Figure 3.4)
The identified ICRG blocks of Bihar experienced mostly warming but also a decrease in
temperature in a few blocks during the historical period.
The temperature increase was recorded in 77% of the blocks, in the range of 0.03 OC to
0.7 OC.
Highest increase in temperature of 0.7 OC was recorded in Laukha block, followed by
Laukahi with 0.6 OC increase in temperature.
A very slight decrease in temperature in the range of 0.01 OC to 0.1 OC was recorded in
eight of the 35 blocks (about 23%) of Bihar.
Blocks with decrease in temperature included Sikta, Azamnagar and Barsoi with the
maximum decrease, followed by Ladania, Balrampur, Bausi, Dhumariya and Falka
blocks.
0
5
10
15
20
25
30
35
40
Meansummertemperature(degreeC)
Odisha
Maxtemp Mintemp
8
Current Climate Variability Assessment, Climate Change Projections and Identification of “Climate Hotspot Blocks” for ICRG Blocks under MGNREGA
Infrastructure for Climate Resilient Growth in India (ICRG) Programme
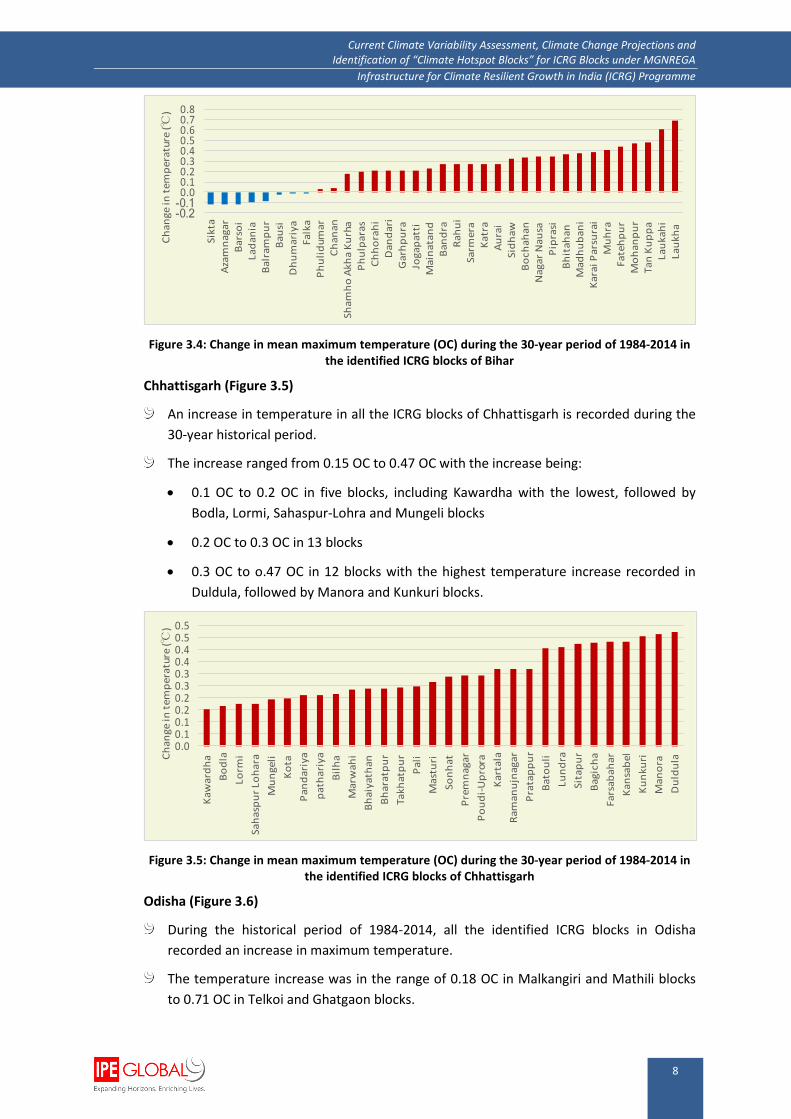
Figure 3.4: Change in mean maximum temperature (OC) during the 30-year period of 1984-2014 in the identified ICRG blocks of Bihar
Chhattisgarh (Figure 3.5)
An increase in temperature in all the ICRG blocks of Chhattisgarh is recorded during the
30-year historical period.
The increase ranged from 0.15 OC to 0.47 OC with the increase being:
0.1 OC to 0.2 OC in five blocks, including Kawardha with the lowest, followed by
Bodla, Lormi, Sahaspur-Lohra and Mungeli blocks
0.2 OC to 0.3 OC in 13 blocks
0.3 OC to o.47 OC in 12 blocks with the highest temperature increase recorded in
Duldula, followed by Manora and Kunkuri blocks.
Figure 3.5: Change in mean maximum temperature (OC) during the 30-year period of 1984-2014 in the identified ICRG blocks of Chhattisgarh
Odisha (Figure 3.6)
During the historical period of 1984-2014, all the identified ICRG blocks in Odisha
recorded an increase in maximum temperature.
The temperature increase was in the range of 0.18 OC in Malkangiri and Mathili blocks
to 0.71 OC in Telkoi and Ghatgaon blocks.
0.00.10.10.20.20.30.30.40.40.50.5
Kaw
ardha
Bodla
Lorm
i
SahaspurLohara
Mungeli
Kota
Pandariya
pathariya
Bilha
Marwahi
Bhaiyathan
Bharatpur
Takhatpur
Pali
Masturi
Sonhat
Premnagar
Poudi-Uprora
Kartala
Ram
anujnagar
Pratappur
Batouli
Lundra
Sitapur
Bagicha
Farsabahar
Kansabel
Kunkuri
Manora
DuldulaChangeintem
perature(℃
)

9
Current Climate Variability Assessment, Climate Change Projections and Identification of “Climate Hotspot Blocks” for ICRG Blocks under MGNREGA
Infrastructure for Climate Resilient Growth in India (ICRG) Programme
Majority of the blocks recorded a temperature increase of 0.2 OC to 0.5 OC.
Figure 3.6: Change in mean maximum temperature (OC) during the 30-year period of 1984-2014 in the identified ICRG blocks of Odisha
Overall there was an increasing trend in warming as indicated by the increase in mean
maximum temperature across all the identified ICRG blocks in Chhattisgarh and Odisha, and
a majority of the blocks experienced warming, excluding eight blocks in Odisha, which
recorded a marginal decrease in temperature.
The increase in temperature in the range of 0.26 OC to 0.5 OC was recorded in the
maximum number of blocks (Figure 3.7) across all the three states (>50% in
Chhattisgarh, 49% in Odisha and 46% in Bihar).
Across the states the increase in temperature in the range 0.26 to 0.5 OC was
experienced in maximum number of blocks.
An increase of > 0.5 OC up to 0.75 OC was recorded only in a few blocks of Bihar and
Odisha.
Figure 3.7: Number of blocks experiencing increase in temperature of varying degrees over the 30-year period of 1984-2014
3.2. Trends in Rainfall during the Historical Period (1984-2014)
Total rainfall and the distribution of monsoon rainfall is critical for agriculture and water
0.00.10.20.30.40.50.60.70.8
Malkangiri
Mathili
Boipariguda
Kundura
Kotpad
Dabugaon
Nuapada
Papadahandi
Jharigaon
Kokasara
Komna
Paikamal
Jharbandha
Lanjigarh
Kalyanasingpur
Tumudibandha
Gaisilet
Madanpur_Ram
pur
Bisham
akatak
Kotagarh
pottasing
Daringbadi
Phiringia
Balisankar
Thakurm
unda
Mohana
R.Udaygiri
Rayagad
Bisoi
Gurundia
Jashipur
Lahunipara
Kaptipada
Ghatgaon
Telkoi
Changeintem
perature(℃
)

10
Current Climate Variability Assessment, Climate Change Projections and Identification of “Climate Hotspot Blocks” for ICRG Blocks under MGNREGA
Infrastructure for Climate Resilient Growth in India (ICRG) Programme
supply in rural areas. The rainfall trend is analysed for the monsoon period – JJAS (June to
August), which is the most important cropping season in the states. The mean seasonal
rainfall trend and the seasonal rainfall variability is analysed and presented in this section for
the three states for the period 1984 to 2014.
3.2.1. Mean Seasonal (JJAS) Rainfall during 1984-2014
Mean seasonal rainfall during June to September is analysed and presented in this section
for the historical 30-year period of 1984-2014. Table 3.1 presents the mean JJAS rainfall in
the identified ICRG blocks of the three study states.
Bihar (Table 3.1)
In Bihar, Balrampur block received the highest mean monsoon rainfall of 1274 mm,
followed by Mainatand (1260 mm), Barsoi (1253 mm), Azamnagar (1253 mm) and Sikta
(1217 mm) during the monsoon months.
The lowest mean rainfall during JJAS was recorded in Sidhaw with 744 mm only,
followed by five blocks receiving mean seasonal rainfall of 837 mm to 889 mm.
Chhattisgarh (Table 3.1)
In Chhattisgarh, during the period 1984-2014, Kunkuri block received the highest mean
monsoon rainfall of 1251 mm, followed by Poudi-Uprora, Duldula, Farsabahar, Kartala,
Sitapur, Batouli and Pali blocks – all receiving more than 1200 mm of rainfall during the
monsoon months.
Lowest rainfall was recorded in Bodla block (927 mm) and four other blocks (Sahaspur-
Lohara (929 mm), Kawardha (953 mm), Pathariya (979 mm) and Pandariya (992 mm)), all
receiving less than 1000 mm of rainfall during the monsoon months.
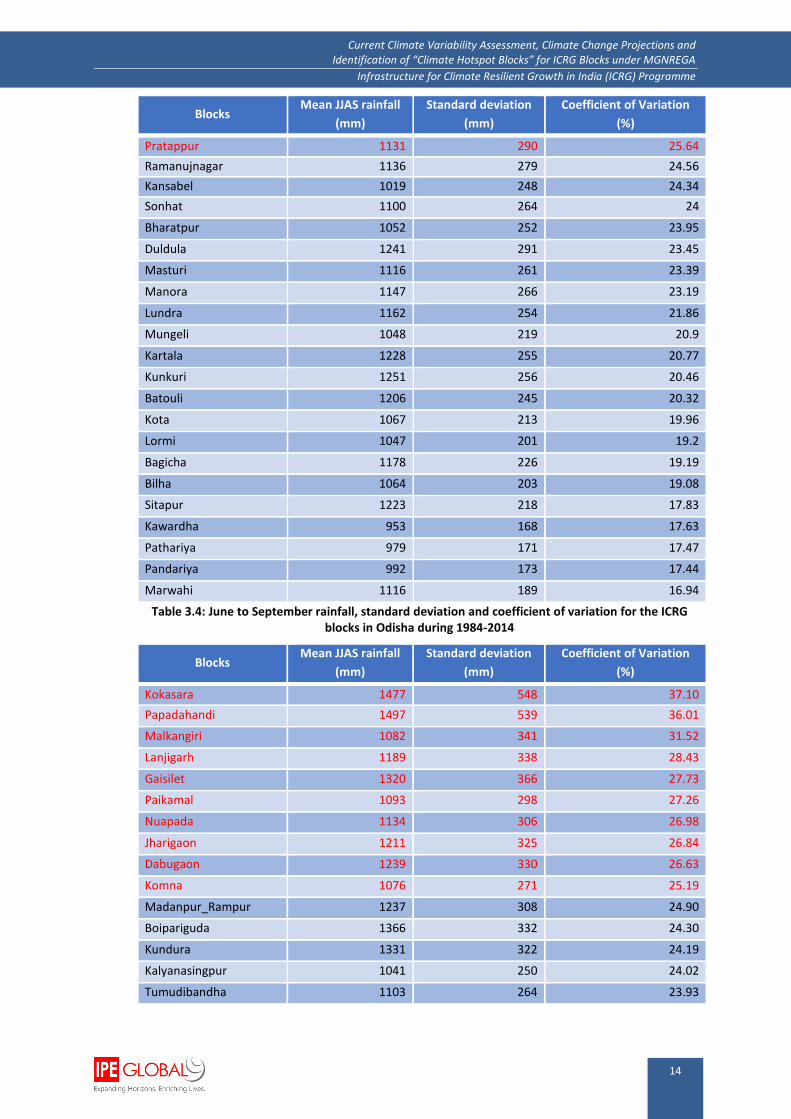
Odisha (Table 3.1)
In Odisha, Papadahandi block received the highest rainfall (1497 mm), followed by
Kokasara block (1477 mm) during 1984-2014.
Most of the blocks recorded a rainfall between 1100 mm to 1250 mm during the
monsoon season.
Rayagad block received the least monsoon rainfall of 761 mm, followed by R. Udaygiri
(800 mm), Mohana (864 mm) and Pottasing (885 mm) blocks.
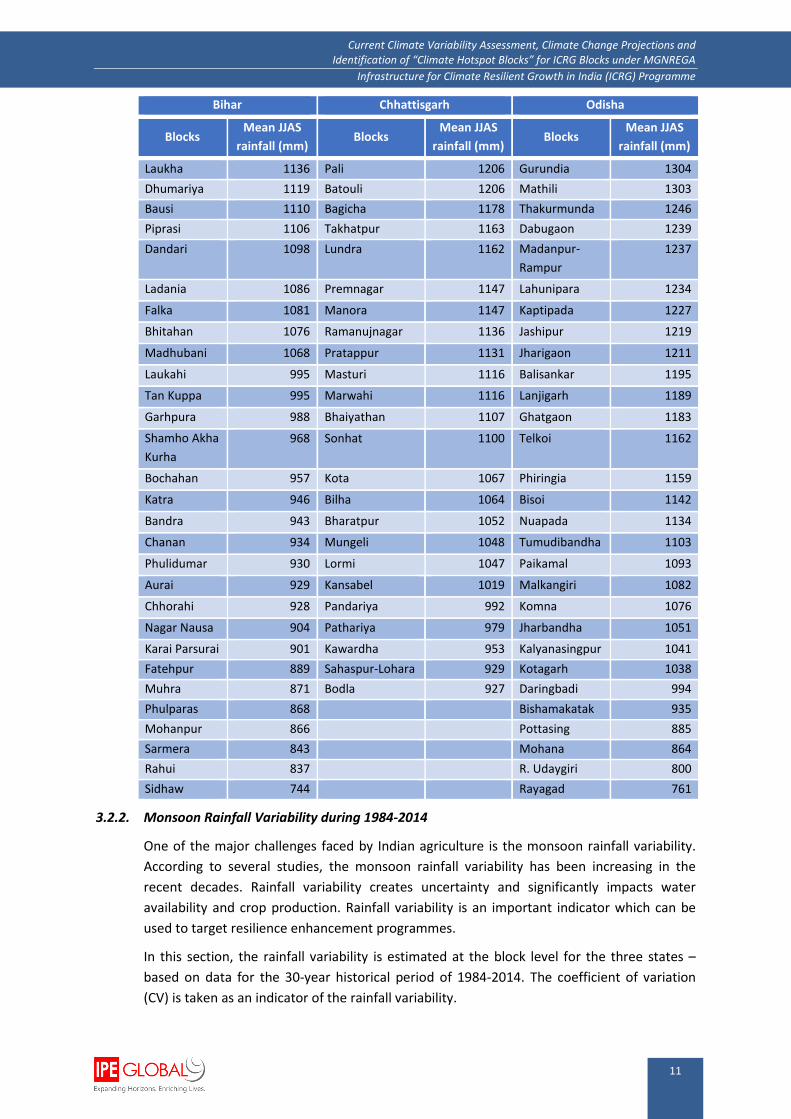
Table 3.1: Mean monsoon (JJAS) rainfall in the ICRG blocks of Bihar, Chhattisgarh and Odisha during 1984-2014
Bihar Chhattisgarh Odisha
Blocks Mean JJAS
rainfall (mm) Blocks
Mean JJAS
rainfall (mm) Blocks
Mean JJAS
rainfall (mm)
Balrampur 1274 Kunkuri 1251 Papadahandi 1497
Mainatand 1260 Poudi-Uprora 1246 Kokasara 1477
Azamnagar 1253 Duldula 1241 Boipariguda 1366
Barsoi 1253 Farsabahar 1230 Kundura 1331
Sikta 1217 Kartala 1228 Gaisilet 1320
Jogapatti 1154 Sitapur 1223 Kotpad 1311
11
Current Climate Variability Assessment, Climate Change Projections and Identification of “Climate Hotspot Blocks” for ICRG Blocks under MGNREGA
Infrastructure for Climate Resilient Growth in India (ICRG) Programme
Bihar Chhattisgarh Odisha
Blocks Mean JJAS
rainfall (mm) Blocks
Mean JJAS
rainfall (mm) Blocks
Mean JJAS
rainfall (mm)
Laukha 1136 Pali 1206 Gurundia 1304
Dhumariya 1119 Batouli 1206 Mathili 1303
Bausi 1110 Bagicha 1178 Thakurmunda 1246
Piprasi 1106 Takhatpur 1163 Dabugaon 1239
Dandari 1098 Lundra 1162 Madanpur-
Rampur
1237
Ladania 1086 Premnagar 1147 Lahunipara 1234
Falka 1081 Manora 1147 Kaptipada 1227
Bhitahan 1076 Ramanujnagar 1136 Jashipur 1219
Madhubani 1068 Pratappur 1131 Jharigaon 1211
Laukahi 995 Masturi 1116 Balisankar 1195
Tan Kuppa 995 Marwahi 1116 Lanjigarh 1189
Garhpura 988 Bhaiyathan 1107 Ghatgaon 1183
Shamho Akha
Kurha
968 Sonhat 1100 Telkoi 1162
Bochahan 957 Kota 1067 Phiringia 1159
Katra 946 Bilha 1064 Bisoi 1142
Bandra 943 Bharatpur 1052 Nuapada 1134
Chanan 934 Mungeli 1048 Tumudibandha 1103
Phulidumar 930 Lormi 1047 Paikamal 1093
Aurai 929 Kansabel 1019 Malkangiri 1082
Chhorahi 928 Pandariya 992 Komna 1076
Nagar Nausa 904 Pathariya 979 Jharbandha 1051
Karai Parsurai 901 Kawardha 953 Kalyanasingpur 1041
Fatehpur 889 Sahaspur-Lohara 929 Kotagarh 1038
Muhra 871 Bodla 927 Daringbadi 994
Phulparas 868 Bishamakatak 935
Mohanpur 866 Pottasing 885
Sarmera 843 Mohana 864
Rahui 837 R. Udaygiri 800
Sidhaw 744 Rayagad 761
3.2.2. Monsoon Rainfall Variability during 1984-2014
One of the major challenges faced by Indian agriculture is the monsoon rainfall variability.
According to several studies, the monsoon rainfall variability has been increasing in the
recent decades. Rainfall variability creates uncertainty and significantly impacts water
availability and crop production. Rainfall variability is an important indicator which can be
used to target resilience enhancement programmes.
In this section, the rainfall variability is estimated at the block level for the three states –
based on data for the 30-year historical period of 1984-2014. The coefficient of variation
(CV) is taken as an indicator of the rainfall variability.
12
Current Climate Variability Assessment, Climate Change Projections and Identification of “Climate Hotspot Blocks” for ICRG Blocks under MGNREGA
Infrastructure for Climate Resilient Growth in India (ICRG) Programme
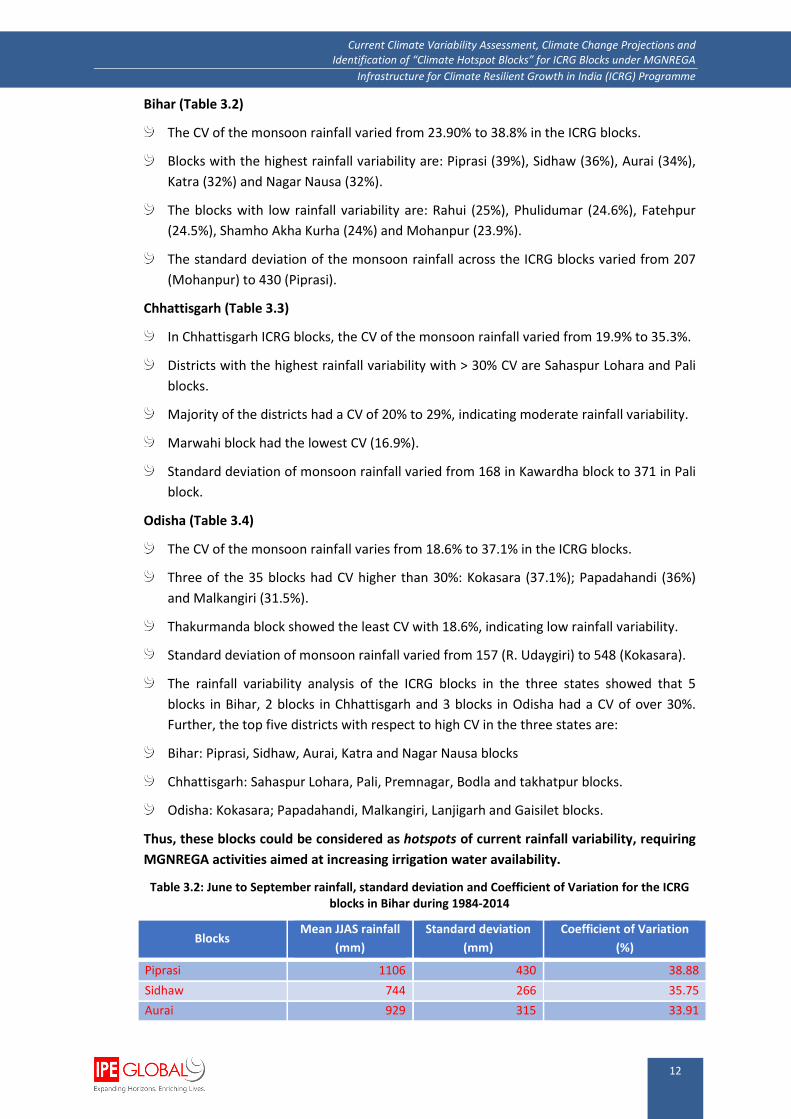
Bihar (Table 3.2)
The CV of the monsoon rainfall varied from 23.90% to 38.8% in the ICRG blocks.
Blocks with the highest rainfall variability are: Piprasi (39%), Sidhaw (36%), Aurai (34%),
Katra (32%) and Nagar Nausa (32%).
The blocks with low rainfall variability are: Rahui (25%), Phulidumar (24.6%), Fatehpur
(24.5%), Shamho Akha Kurha (24%) and Mohanpur (23.9%).
The standard deviation of the monsoon rainfall across the ICRG blocks varied from 207
(Mohanpur) to 430 (Piprasi).
Chhattisgarh (Table 3.3)
In Chhattisgarh ICRG blocks, the CV of the monsoon rainfall varied from 19.9% to 35.3%.
Districts with the highest rainfall variability with > 30% CV are Sahaspur Lohara and Pali
blocks.
Majority of the districts had a CV of 20% to 29%, indicating moderate rainfall variability.
Marwahi block had the lowest CV (16.9%).
Standard deviation of monsoon rainfall varied from 168 in Kawardha block to 371 in Pali
block.
Odisha (Table 3.4)
The CV of the monsoon rainfall varies from 18.6% to 37.1% in the ICRG blocks.
Three of the 35 blocks had CV higher than 30%: Kokasara (37.1%); Papadahandi (36%)
and Malkangiri (31.5%).
Thakurmanda block showed the least CV with 18.6%, indicating low rainfall variability.
Standard deviation of monsoon rainfall varied from 157 (R. Udaygiri) to 548 (Kokasara).
The rainfall variability analysis of the ICRG blocks in the three states showed that 5
blocks in Bihar, 2 blocks in Chhattisgarh and 3 blocks in Odisha had a CV of over 30%.
Further, the top five districts with respect to high CV in the three states are:
Bihar: Piprasi, Sidhaw, Aurai, Katra and Nagar Nausa blocks
Chhattisgarh: Sahaspur Lohara, Pali, Premnagar, Bodla and takhatpur blocks.
Odisha: Kokasara; Papadahandi, Malkangiri, Lanjigarh and Gaisilet blocks.
Thus, these blocks could be considered as hotspots of current rainfall variability, requiring
MGNREGA activities aimed at increasing irrigation water availability.
Table 3.2: June to September rainfall, standard deviation and Coefficient of Variation for the ICRG blocks in Bihar during 1984-2014
Blocks Mean JJAS rainfall
(mm)
Standard deviation
(mm)
Coefficient of Variation
(%)
Piprasi 1106 430 38.88
Sidhaw 744 266 35.75
Aurai 929 315 33.91

13
Current Climate Variability Assessment, Climate Change Projections and Identification of “Climate Hotspot Blocks” for ICRG Blocks under MGNREGA
Infrastructure for Climate Resilient Growth in India (ICRG) Programme
Blocks Mean JJAS rainfall
(mm)
Standard deviation
(mm)
Coefficient of Variation
(%)
Katra 946 305 32.24
Nagar Nausa 904 288 31.86
Phulparas 868 274 31.57
Madhubani 1068 327 30.62
Garhpura 988 302 30.57
Muhra 871 266 30.54
Tan Kuppa 995 297 29.85
Bandra 943 280 29.69
Ladania 1086 317 29.19
Bhitahan 1076 313 29.09
Laukha 1136 329 28.96
Falka 1081 312 28.86
Laukahi 995 287 28.84
Sarmera 843 242 28.71
Jogapatti 1154 327 28.34
Karai Parsurai 901 251 27.86
Chanan 934 259 27.73
Dandari 1098 300 27.32
Bochahan 957 259 27.06
Sikta 1217 329 27.03
Mainatand 1260 337 26.75
Chhorahi 928 247 26.62
Balrampur 1274 337 26.45
Dhumariya 1119 289 25.83
Barsoi 1253 321 25.62
Azamnagar 1253 321 25.62
Bausi 1110 283 25.50
Rahui 837 213 25.45
Phulidumar 930 229 24.62
Fatehpur 889 218 24.52
Shamho Akha Kurha 968 233 24.07
Mohanpur 866 207 23.90
Table 3.3: June to September rainfall, standard deviation and coefficient of variation for the ICRG blocks in Chhattisgarh during 1984-2014
Blocks Mean JJAS rainfall
(mm)
Standard deviation
(mm)
Coefficient of Variation
(%)
Sahaspur –Lohara 929 328 35.31
Pali 1206 371 30.76
Premnagar 1147 343 29.90
Bodla 927 277 29.88
Takhatpur 1163 317 27.26
Poudi-Uprora 1246 333 26.73
Bhaiyathan 1107 293 26.47
Farsabahar 1230 325 26.42
14
Current Climate Variability Assessment, Climate Change Projections and Identification of “Climate Hotspot Blocks” for ICRG Blocks under MGNREGA
Infrastructure for Climate Resilient Growth in India (ICRG) Programme
Blocks Mean JJAS rainfall
(mm)
Standard deviation
(mm)
Coefficient of Variation
(%)
Pratappur 1131 290 25.64
Ramanujnagar 1136 279 24.56
Kansabel 1019 248 24.34
Sonhat 1100 264 24
Bharatpur 1052 252 23.95
Duldula 1241 291 23.45
Masturi 1116 261 23.39
Manora 1147 266 23.19
Lundra 1162 254 21.86
Mungeli 1048 219 20.9
Kartala 1228 255 20.77
Kunkuri 1251 256 20.46
Batouli 1206 245 20.32
Kota 1067 213 19.96
Lormi 1047 201 19.2
Bagicha 1178 226 19.19
Bilha 1064 203 19.08
Sitapur 1223 218 17.83
Kawardha 953 168 17.63
Pathariya 979 171 17.47
Pandariya 992 173 17.44
Marwahi 1116 189 16.94
Table 3.4: June to September rainfall, standard deviation and coefficient of variation for the ICRG blocks in Odisha during 1984-2014
Blocks Mean JJAS rainfall
(mm)
Standard deviation
(mm)
Coefficient of Variation
(%)
Kokasara 1477 548 37.10
Papadahandi 1497 539 36.01
Malkangiri 1082 341 31.52
Lanjigarh 1189 338 28.43
Gaisilet 1320 366 27.73
Paikamal 1093 298 27.26
Nuapada 1134 306 26.98
Jharigaon 1211 325 26.84
Dabugaon 1239 330 26.63
Komna 1076 271 25.19
Madanpur_Rampur 1237 308 24.90
Boipariguda 1366 332 24.30
Kundura 1331 322 24.19
Kalyanasingpur 1041 250 24.02
Tumudibandha 1103 264 23.93
15
Current Climate Variability Assessment, Climate Change Projections and Identification of “Climate Hotspot Blocks” for ICRG Blocks under MGNREGA
Infrastructure for Climate Resilient Growth in India (ICRG) Programme
Blocks Mean JJAS rainfall
(mm)
Standard deviation
(mm)
Coefficient of Variation
(%)
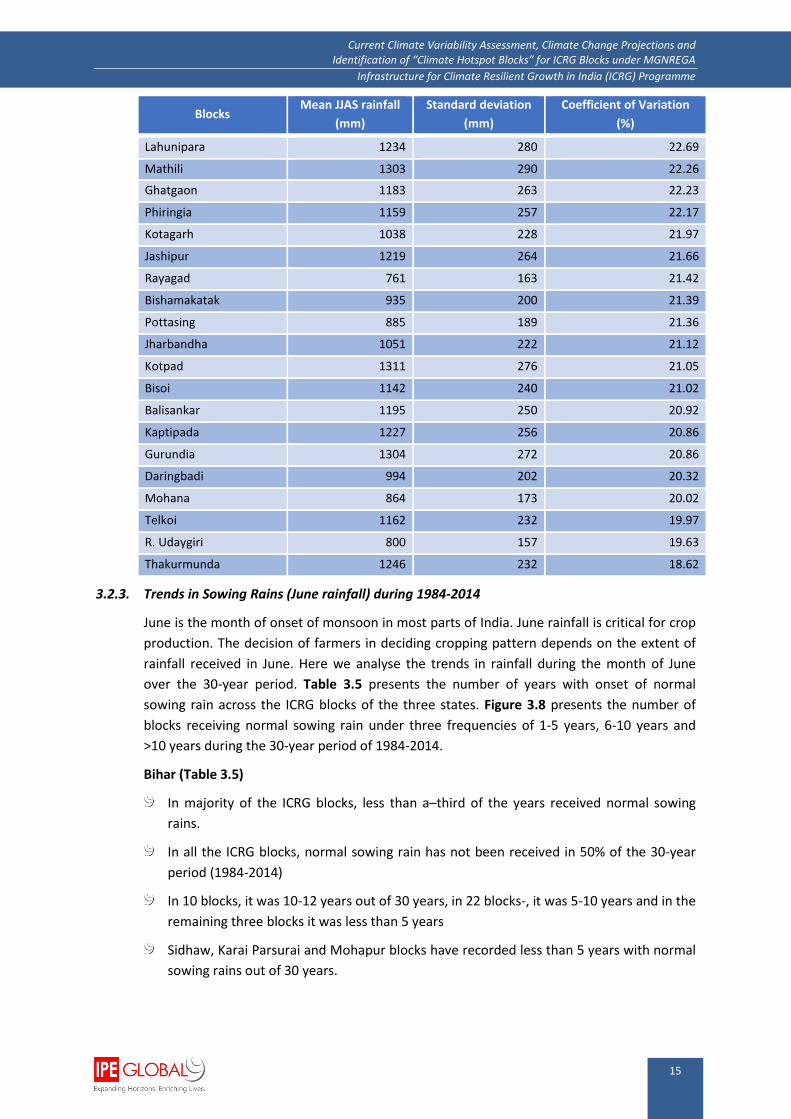
Lahunipara 1234 280 22.69
Mathili 1303 290 22.26
Ghatgaon 1183 263 22.23
Phiringia 1159 257 22.17
Kotagarh 1038 228 21.97
Jashipur 1219 264 21.66
Rayagad 761 163 21.42
Bishamakatak 935 200 21.39
Pottasing 885 189 21.36
Jharbandha 1051 222 21.12
Kotpad 1311 276 21.05
Bisoi 1142 240 21.02
Balisankar 1195 250 20.92
Kaptipada 1227 256 20.86
Gurundia 1304 272 20.86
Daringbadi 994 202 20.32
Mohana 864 173 20.02
Telkoi 1162 232 19.97
R. Udaygiri 800 157 19.63
Thakurmunda 1246 232 18.62
3.2.3. Trends in Sowing Rains (June rainfall) during 1984-2014
June is the month of onset of monsoon in most parts of India. June rainfall is critical for crop
production. The decision of farmers in deciding cropping pattern depends on the extent of
rainfall received in June. Here we analyse the trends in rainfall during the month of June
over the 30-year period. Table 3.5 presents the number of years with onset of normal
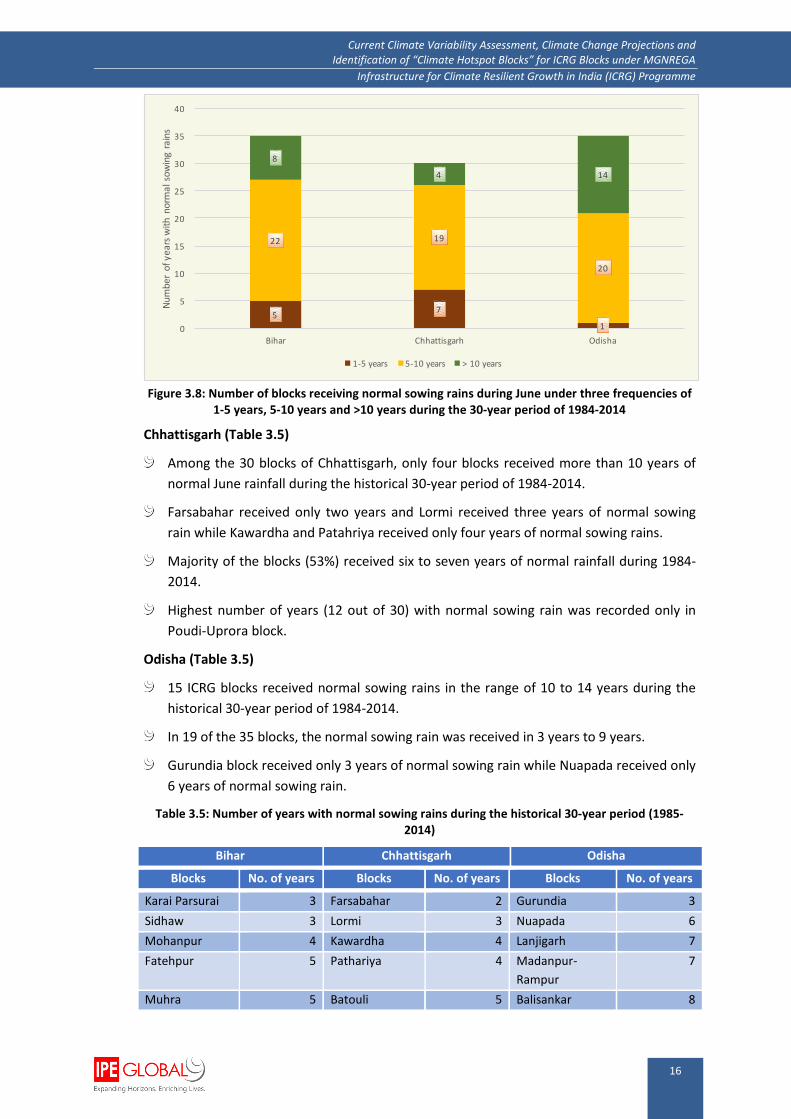
sowing rain across the ICRG blocks of the three states. Figure 3.8 presents the number of
blocks receiving normal sowing rain under three frequencies of 1-5 years, 6-10 years and
>10 years during the 30-year period of 1984-2014.
Bihar (Table 3.5)
In majority of the ICRG blocks, less than a–third of the years received normal sowing
rains.
In all the ICRG blocks, normal sowing rain has not been received in 50% of the 30-year
period (1984-2014)
In 10 blocks, it was 10-12 years out of 30 years, in 22 blocks-, it was 5-10 years and in the
remaining three blocks it was less than 5 years
Sidhaw, Karai Parsurai and Mohapur blocks have recorded less than 5 years with normal
sowing rains out of 30 years.
16
Current Climate Variability Assessment, Climate Change Projections and Identification of “Climate Hotspot Blocks” for ICRG Blocks under MGNREGA
Infrastructure for Climate Resilient Growth in India (ICRG) Programme
Figure 3.8: Number of blocks receiving normal sowing rains during June under three frequencies of
1-5 years, 5-10 years and >10 years during the 30-year period of 1984-2014
Chhattisgarh (Table 3.5)
Among the 30 blocks of Chhattisgarh, only four blocks received more than 10 years of
normal June rainfall during the historical 30-year period of 1984-2014.
Farsabahar received only two years and Lormi received three years of normal sowing
rain while Kawardha and Patahriya received only four years of normal sowing rains.
Majority of the blocks (53%) received six to seven years of normal rainfall during 1984-
2014.
Highest number of years (12 out of 30) with normal sowing rain was recorded only in
Poudi-Uprora block.
Odisha (Table 3.5)
15 ICRG blocks received normal sowing rains in the range of 10 to 14 years during the
historical 30-year period of 1984-2014.
In 19 of the 35 blocks, the normal sowing rain was received in 3 years to 9 years.
Gurundia block received only 3 years of normal sowing rain while Nuapada received only
6 years of normal sowing rain.
Table 3.5: Number of years with normal sowing rains during the historical 30-year period (1985-2014)
Bihar Chhattisgarh Odisha
Blocks No. of years Blocks No. of years Blocks No. of years
Karai Parsurai 3 Farsabahar 2 Gurundia 3
Sidhaw 3 Lormi 3 Nuapada 6
Mohanpur 4 Kawardha 4 Lanjigarh 7
Fatehpur 5 Pathariya 4 Madanpur-
Rampur
7
Muhra 5 Batouli 5 Balisankar 8
57
1
22 19
20
8
4 14
0
5
10
15
20
25
30
35
40
Bihar Chhattisgarh Odisha
Numberofyearswithnorm
alsowingrains
1-5years 5-10years >10years

17
Current Climate Variability Assessment, Climate Change Projections and Identification of “Climate Hotspot Blocks” for ICRG Blocks under MGNREGA
Infrastructure for Climate Resilient Growth in India (ICRG) Programme
Bihar Chhattisgarh Odisha
Blocks No. of years Blocks No. of years Blocks No. of years
Aurai 6 Lundra 5 Komna 8
Chhorahi 6 Pandariya 5 Lahunipara 8
Katra 6 Bagicha 6 Mohana 8
Garhpura 7 Bodla 6 Paikamal 8
Jogapatti 7 Kunkuri 6 Phiringia 8
Madhubani 7 Manora 6 Bishamakatak 9
Tan Kuppa 7 Premnagar 6 Dabugaon 9
Balrampur 8 Sahaspur
Lohara
6 Ghatgaon 9
Ladania 8 Bhaiyathan 7 Jharbandha 9
Bausi 9 Bharatpur 7 Jharigaon 9
Bhitahan 9 Duldula 7 Kokasara 9
Bochahan 9 Kansabel 7 Malkangiri 9
Chanan 9 Kota 7 Papadahandi 9
Dandari 9 Mungeli 7 Rayagad 9
Falka 9 Pali 7 Gaisilet 10
Laukahi 9 Pratappur 7 Thakurmunda 10
Phulparas 9 Sonhat 7 Boipariguda 11
Rahui 9 Takhatpur 7 Jashipur 11
Sarmera 9 Bilha 8 Kalyanasingpur 11
Shamho Akha
Kurha
9 Marwahi 8 Kaptipada 11
Nagar Nausa 10 Masturi 9 Kotagarh 11
Phulidumar 10 Kartala 11 Mathili 11
Azamnagar 11 Ramanujnagar 11 R.Udaygiri 11
Bandra 11 Sitapur 11 Bisoi 12
Barsoi 11 Poudi-Uprora 12 Daringbadi 12
Piprasi 11 Kotpad 13
Dhumariya 12 Telkoi 13
Laukha 12 Tumudibandha 13
Mainatand 12 Kundura 14
Sikta 12 Pottasing 14
Analysis of occurrence of sowing rainfall events during June for the historical 30-year period
showed that majority of the blocks did not receive June rainfall in most of the years. This
mean only in few years the farmers received the normal sowing rain in June. This will have
implications for designing MGNREGA works to assist farmers to cope with delayed sowing
rains. The famers may require access to rainfall prediction in June and MGNREGA may have
to have provision for contingency planning in case of delayed sowing rains.
3.2.4. Occurrence of Droughts: Frequency and Intensity during 1984-2014
Drought is the bane of Indian agriculture. Periodic occurrence of droughts adversely impacts
food production, water availability, farmers’ livelihoods and survival. India is likely to
18
Current Climate Variability Assessment, Climate Change Projections and Identification of “Climate Hotspot Blocks” for ICRG Blocks under MGNREGA
Infrastructure for Climate Resilient Growth in India (ICRG) Programme
experience increased frequency and intensity in occurrence of droughts in the coming
decades due to climate change. The historical climate data has been analysed for occurrence
of droughts during the 30-year period of 1984 to 2014. The criteria for this analysis is
presented in Table 3.6. Figure 3.10, Figure 3.11 and Figure 4.1 present the occurrence of
mild, moderate and severe drought in the study blocks across the three states of Bihar,
Chhattisgarh and Odisha.
Table 3.6: Criteria for analysis of drought
Drought type Rainfall deficit from normal
Mild Drought 0-25%
Moderate Drought 26-50%
Severe Drought >50%
Source: Lala et al., 2013
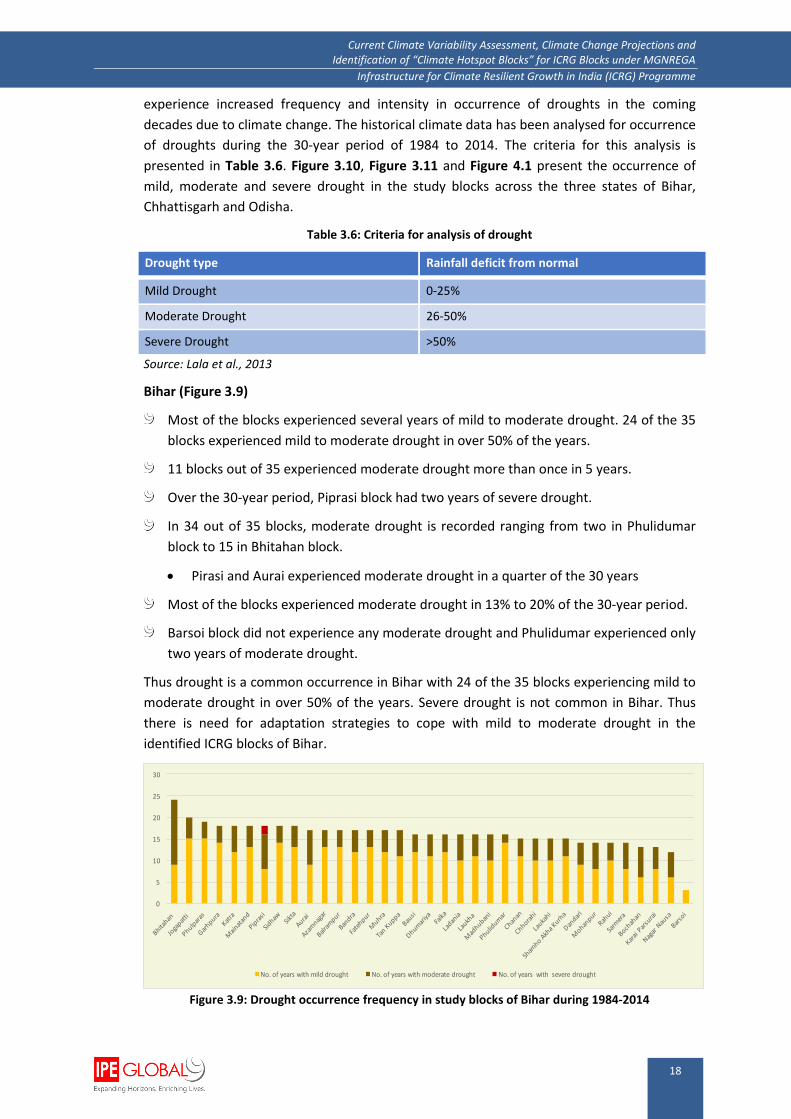
Bihar (Figure 3.9)
Most of the blocks experienced several years of mild to moderate drought. 24 of the 35
blocks experienced mild to moderate drought in over 50% of the years.
11 blocks out of 35 experienced moderate drought more than once in 5 years.
Over the 30-year period, Piprasi block had two years of severe drought.
In 34 out of 35 blocks, moderate drought is recorded ranging from two in Phulidumar
block to 15 in Bhitahan block.
Pirasi and Aurai experienced moderate drought in a quarter of the 30 years
Most of the blocks experienced moderate drought in 13% to 20% of the 30-year period.
Barsoi block did not experience any moderate drought and Phulidumar experienced only
two years of moderate drought.
Thus drought is a common occurrence in Bihar with 24 of the 35 blocks experiencing mild to
moderate drought in over 50% of the years. Severe drought is not common in Bihar. Thus
there is need for adaptation strategies to cope with mild to moderate drought in the
identified ICRG blocks of Bihar.
Figure 3.9: Drought occurrence frequency in study blocks of Bihar during 1984-2014
0
5
10
15
20
25
30
No.ofyearswithmilddrought No.ofyearswithmoderatedrought No.ofyearswithseveredrought

19
Current Climate Variability Assessment, Climate Change Projections and Identification of “Climate Hotspot Blocks” for ICRG Blocks under MGNREGA
Infrastructure for Climate Resilient Growth in India (ICRG) Programme
Chhattisgarh (Figure 3.10)
Most blocks in Chhattisgarh have experienced mild drought during the historical 30-year
period of 1984-2014.
Severe drought is recorded in Bhaiyathan, Premnagar, Ramanujnagar and Pratappur
blocks (one out of 30 years)
Kansabel, Lundra and Manora blocks have recorded the highest number of years with
moderate drought (5 out of 30 years).
Of the 30 blocks in Chhattisgarh, Kartala, Poudi-Upora and Premnagar have recorded
moderate drought in only one year over the 30-year period.
Thus, it can be concluded that severe and moderate droughts are not so prevalent in the
identified ICRG blocks of Chhattisgarh.
Figure 3.10: Drought occurrence frequency in study blocks of Chhattisgarh during 1984-2014
Odisha (Figure 3.11)
Kokasara was the only block to experience severe drought over the 30-years (2 of 30
years).
Figure 3.11: Drought occurrence frequency in study blocks of Odisha during 1984-2014
All the blocks experienced a few moderate drought events over the 30-year period. Of
these, Papadahandi had moderate drought in eight out of 30 years.
0
5
10
15
20
25
30
No.ofyearswithmilddrought No.ofyearswithmoderatedrought No.ofyearswithseveredrought
0
5
10
15
20
25
30
No.ofyearswithmilddrought No.ofyearswithmoderatedrought No.ofyearswithseveredrought
20
Current Climate Variability Assessment, Climate Change Projections and Identification of “Climate Hotspot Blocks” for ICRG Blocks under MGNREGA
Infrastructure for Climate Resilient Growth in India (ICRG) Programme
Mathili, Kotpad, Kaptipadi, Bishamakatak, Bisoi and Boipariguada blocks recorded only
one mild drought year during 1984-2014.
Thus, in Odisha, occurrence of severe drought is a rare event. Majority of the blocks
experienced only mild drought. The occurrence of moderate drought is also low for
majority of the blocks.
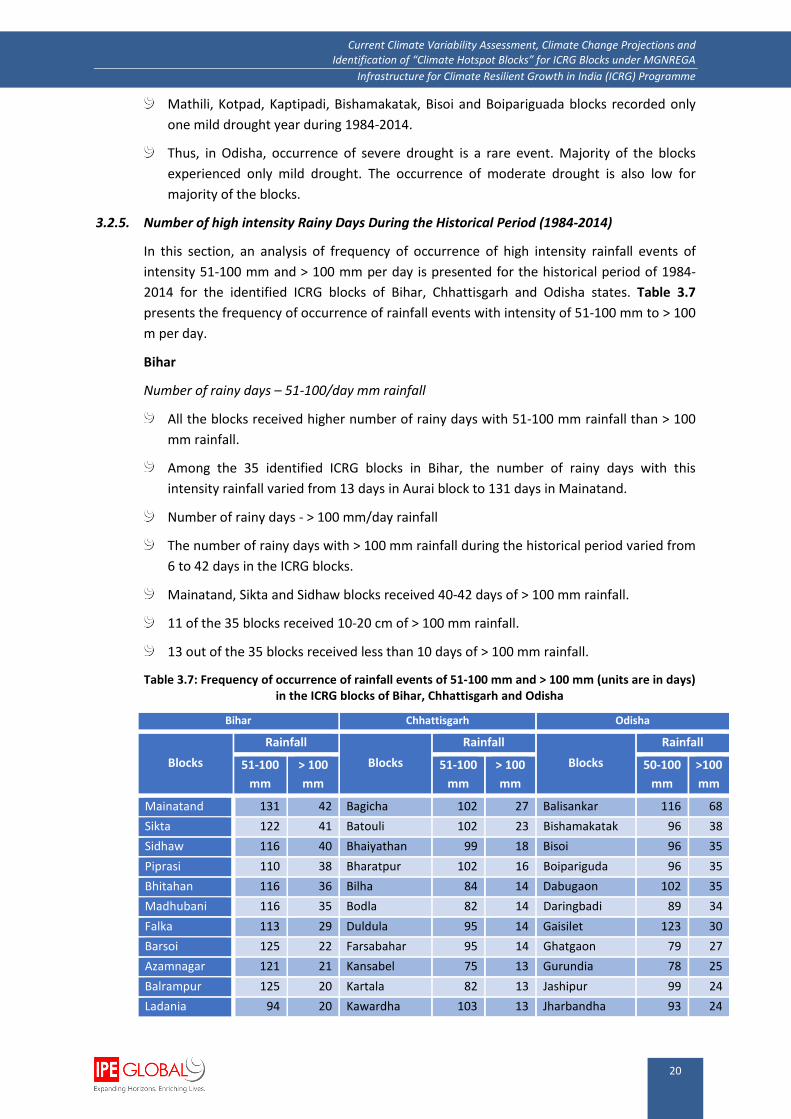
3.2.5. Number of high intensity Rainy Days During the Historical Period (1984-2014)
In this section, an analysis of frequency of occurrence of high intensity rainfall events of
intensity 51-100 mm and > 100 mm per day is presented for the historical period of 1984-
2014 for the identified ICRG blocks of Bihar, Chhattisgarh and Odisha states. Table 3.7
presents the frequency of occurrence of rainfall events with intensity of 51-100 mm to > 100
m per day.
Bihar
Number of rainy days – 51-100/day mm rainfall
All the blocks received higher number of rainy days with 51-100 mm rainfall than > 100
mm rainfall.
Among the 35 identified ICRG blocks in Bihar, the number of rainy days with this
intensity rainfall varied from 13 days in Aurai block to 131 days in Mainatand.
Number of rainy days - > 100 mm/day rainfall
The number of rainy days with > 100 mm rainfall during the historical period varied from
6 to 42 days in the ICRG blocks.
Mainatand, Sikta and Sidhaw blocks received 40-42 days of > 100 mm rainfall.
11 of the 35 blocks received 10-20 cm of > 100 mm rainfall.
13 out of the 35 blocks received less than 10 days of > 100 mm rainfall.
Table 3.7: Frequency of occurrence of rainfall events of 51-100 mm and > 100 mm (units are in days) in the ICRG blocks of Bihar, Chhattisgarh and Odisha
Bihar Chhattisgarh Odisha
Blocks
Rainfall
Blocks
Rainfall
Blocks
Rainfall
51-100
mm
> 100
mm
51-100
mm
> 100
mm
50-100
mm
>100
mm
Mainatand 131 42 Bagicha 102 27 Balisankar 116 68
Sikta 122 41 Batouli 102 23 Bishamakatak 96 38
Sidhaw 116 40 Bhaiyathan 99 18 Bisoi 96 35
Piprasi 110 38 Bharatpur 102 16 Boipariguda 96 35
Bhitahan 116 36 Bilha 84 14 Dabugaon 102 35
Madhubani 116 35 Bodla 82 14 Daringbadi 89 34
Falka 113 29 Duldula 95 14 Gaisilet 123 30
Barsoi 125 22 Farsabahar 95 14 Ghatgaon 79 27
Azamnagar 121 21 Kansabel 75 13 Gurundia 78 25
Balrampur 125 20 Kartala 82 13 Jashipur 99 24
Ladania 94 20 Kawardha 103 13 Jharbandha 93 24
21
Current Climate Variability Assessment, Climate Change Projections and Identification of “Climate Hotspot Blocks” for ICRG Blocks under MGNREGA
Infrastructure for Climate Resilient Growth in India (ICRG) Programme
Bihar Chhattisgarh Odisha
Blocks
Rainfall
Blocks
Rainfall
Blocks
Rainfall
51-100
mm
> 100
mm
51-100
mm
> 100
mm
50-100
mm
>100
mm
Phulidumar 63 19 Kota 103 12 Jharigaon 96 24
Dhumariya 79 17 Kunkuri 80 12 Kalyanasingpur 84 24
Bausi 79 16 Lormi 98 11 Kaptipada 75 23
Laukahi 105 15 Lundra 89 10 Kokasara 106 22
Chanan 61 12 Manora 83 10 Komna 56 22
Laukha 103 12 Marwahi 84 10 Kotagarh 66 21
Garhpura 25 11 Masturi 81 9 Kotpad 95 21
Jogapatti 25 11 Mungeli 91 9 Kundura 76 18
Fatehpur 47 10 Pali 85 8 Lahunipara 74 17
Katra 67 10 Pandariya 87 8 Lanjigarh 78 16
Phulparas 86 10 Pathariya 85 7 Madanpur-
Rampur
71 13
Dandari 78 9 Poudi-Uprora 57 7 Malkangiri 58 12
Chhorahi 72 8 Pratappur 89 6 Mathili 62 12
Karai Parsurai 64 8 Premnagar 79 6 Mohana 58 12
Rahui 57 8 Ramanujnagar 84 6 Nuapada 84 11
Shamho Akha
Kurha
96 8 Sahaspur
Lohara
79 6 Paikamal 84 11
Aurai 13 7 Sitapur 84 5 Papadahandi 86 10
Bandra 81 7 Sonhat 61 4 Phiringia 58 9
Bochahan 81 7 Takhatpur 42 3 Pottasing 60 9
Muhra 55 7 R.Udaygiri 52 9
Mohanpur 46 6 Rayagad 48 7
Nagar Nausa 67 6 Telkoi 45 6
Sarmera 55 6 Thakurmunda 47 5
Tan Kuppa 62 6 Tumudibandha 51 4
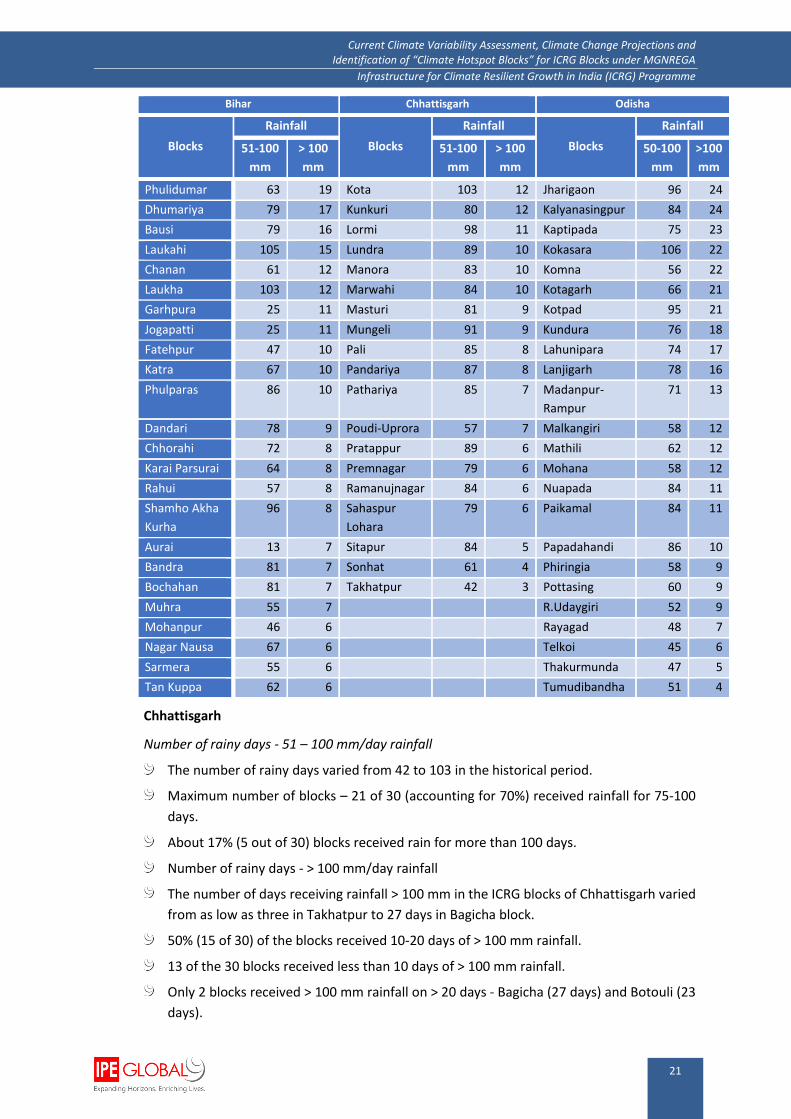
Chhattisgarh
Number of rainy days - 51 – 100 mm/day rainfall
The number of rainy days varied from 42 to 103 in the historical period.
Maximum number of blocks – 21 of 30 (accounting for 70%) received rainfall for 75-100
days.
About 17% (5 out of 30) blocks received rain for more than 100 days.
Number of rainy days - > 100 mm/day rainfall
The number of days receiving rainfall > 100 mm in the ICRG blocks of Chhattisgarh varied
from as low as three in Takhatpur to 27 days in Bagicha block.
50% (15 of 30) of the blocks received 10-20 days of > 100 mm rainfall.
13 of the 30 blocks received less than 10 days of > 100 mm rainfall.
Only 2 blocks received > 100 mm rainfall on > 20 days - Bagicha (27 days) and Botouli (23
days).
22
Current Climate Variability Assessment, Climate Change Projections and Identification of “Climate Hotspot Blocks” for ICRG Blocks under MGNREGA
Infrastructure for Climate Resilient Growth in India (ICRG) Programme
Odisha
Number of rainy days - 51 – 100 mm/day rainfall
More than one-third (34%) of the blocks received 51-100 mm of rainfall for 50-75 days
during 1984-2014
Three blocks out of 35, namely Telkoi, Thakurmunda and Rayagad received 51-100 mm
of rain in less than 50 days
Four blocks – Dabugaon, Kokasara, Balisankar and Gaiselt blocks received > 100 mm of
rainfall for more than 100 days during the historical period.
Number of rainy days - > 100 mm/day rainfall
> 100 mm rainfall was received by the ICRG blocks in Odisha for four (Tumudibandha
block) to 68 (Balisankar block) days.
Majority of the blocks received 51-100 mm of rainfall for 10-30 days.
Occurrence of high intensity rainfall is an indicator of flood causing rainfall events. More
than 100 mm of rain/day could lead to damage to land, crops and may cause excessive
runoff and even flood. These high intensity rainfall events could damage the soil and water
conservation structures created under MGNREGA. It can be observed that the frequency of
high intensity rainfall of > 100 mm is highest in the blocks of Odisha state and lowest in the
blocks of Bihar. This information will have implications for designing soil and water
conservation structures and flood control measures under MGNREGA.
23
Current Climate Variability Assessment, Climate Change Projections and Identification of “Climate Hotspot Blocks” for ICRG Blocks under MGNREGA
Infrastructure for Climate Resilient Growth in India (ICRG) Programme
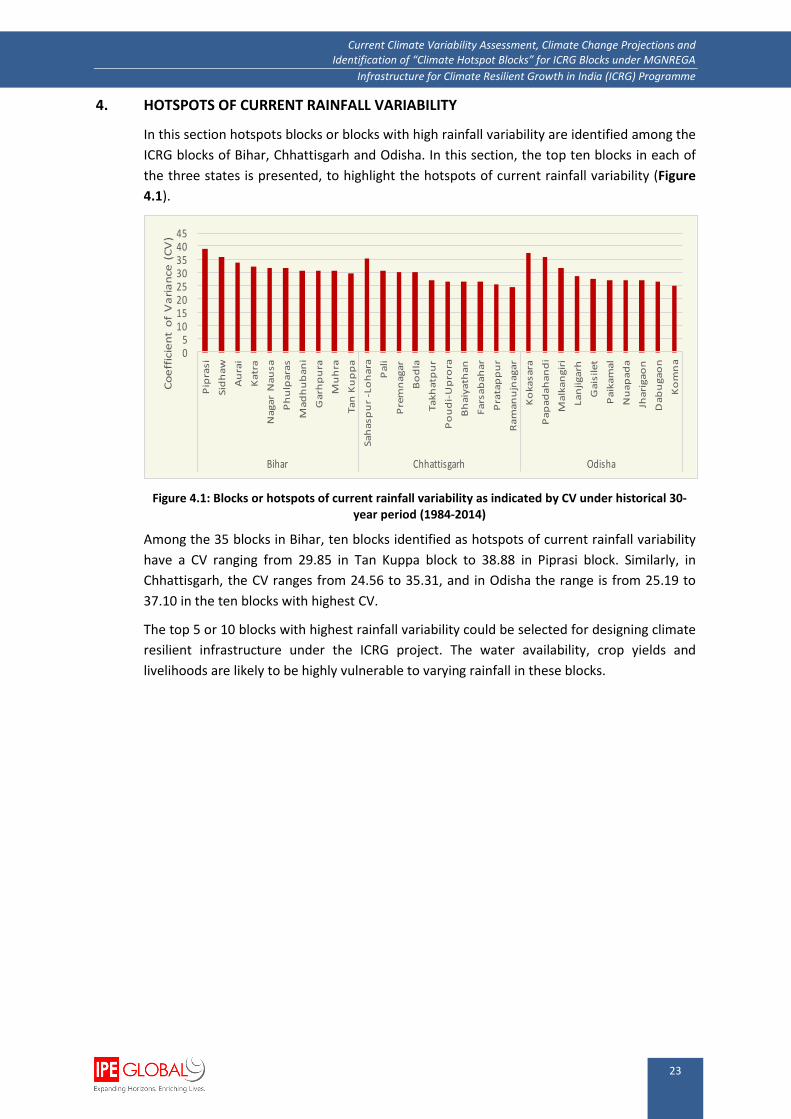
4. HOTSPOTS OF CURRENT RAINFALL VARIABILITY
In this section hotspots blocks or blocks with high rainfall variability are identified among the
ICRG blocks of Bihar, Chhattisgarh and Odisha. In this section, the top ten blocks in each of
the three states is presented, to highlight the hotspots of current rainfall variability (Figure
4.1).
Figure 4.1: Blocks or hotspots of current rainfall variability as indicated by CV under historical 30-year period (1984-2014)
Among the 35 blocks in Bihar, ten blocks identified as hotspots of current rainfall variability
have a CV ranging from 29.85 in Tan Kuppa block to 38.88 in Piprasi block. Similarly, in
Chhattisgarh, the CV ranges from 24.56 to 35.31, and in Odisha the range is from 25.19 to
37.10 in the ten blocks with highest CV.
The top 5 or 10 blocks with highest rainfall variability could be selected for designing climate
resilient infrastructure under the ICRG project. The water availability, crop yields and
livelihoods are likely to be highly vulnerable to varying rainfall in these blocks.
05
1015202530354045
Piprasi
Sidhaw
Aurai
Katra
NagarNausa
Phulparas
Madhubani
Garhpura
Muhra
TanKuppa
Sahaspur-Lohara
Pali
Premnagar
Bodla
Takhatpur
Poudi-Uprora
Bhaiyathan
Farsabahar
Pratappur
Ramanujnagar
Kokasara
Papadahandi
Malkangiri
Lanjigarh
Gaisilet
Paikamal
Nuapada
Jharigaon
Dabugaon
Komna
Bihar Chhattisgarh Odisha
CoefficientofVariance(CV)

24
Current Climate Variability Assessment, Climate Change Projections and Identification of “Climate Hotspot Blocks” for ICRG Blocks under MGNREGA
Infrastructure for Climate Resilient Growth in India (ICRG) Programme
5. CLIMATE CHANGE PROJECTIONS FOR 2021-2050
All blocks and districts will be subjected to warming and climate change, in particular
changes in total rainfall and rainfall variability to varying degrees. Climate change is also
projected to impact the frequency and intensity of occurrence of droughts. Thus it is
necessary to assess the projected impacts of climate change at block level, especially impact
on rainfall variability. This would enable identification of hotspot blocks with respect to
monsoon seasonal rainfall variability, so that adaptation or resilience programs can be
targeted first.
The CORDEX South Asia model data on precipitation, maximum temperature and minimum
temperature have been analysed for the 100 blocks for baseline (1984-2014) and mid-
century (2021-2050). Climate change projections on precipitation, maximum temperature
and minimum temperature have been assessed for the ICRG blocks. Projections have been
made at a grid-spacing of 0.5°x0.5° resolution (50 km x 50 km) for the RCP 8.5 scenario (the
most likely scenario).
IPCC has provided multiple pathways of future GHG emissions and irradiative forcings. The
pathways are used for climate modeling and research. The recent IPCC Assessment Report
(2014) used four possible climate futures. The four RCPs, RCP2.6, RCP4.5, RCP6, and RCP8.5,
are named after a possible range of radiative forcing values in the year 2100 relative to pre-
industrial values (+2.6, +4.5, +6.0, and +8.5 W/m2, respectively) (Weyant et al., 2009).
CORDEX is a WCRP-sponsored program to organize an international coordinated framework
to produce an improved generation of regional climate change projections world-wide for
input into impact and adaptation studies within the AR5 timeline. CORDEX produced an
ensemble of multiple dynamical and statistical downscaling models considering multiple
forcing GCMs from the CMIP5 archive. Initially 50 km grid spacing has been selected. For the
present study only the SMHI-RCA4 model data which was available is used.
5.1. CORDEX Models and RCP Scenario used for Projections
The CORDEX South Asia data on precipitation, maximum and minimum temperature have
been analysed for 100 blocks for baseline (1984-2014) and mid-century (2021-2050) RCP 8.5
scenarios for RCM SMHI-RCA4 and the ensemble of the RCMs are taken for this study. List of
CORDEX models used and their details are given Table 5.1.
Table 5.1: List of CORDEX models used in this study for climate change projections
Asia CORDEX RCM RCM GCM boundary
condition Institute Scenario
Resolution
(o lon x
o lat)
Daily time
period
CNRM-CERFACS-CNRM-
CM5_SMHI-RCA4
SMHI-
RCA4
CNRM SMHI RCP8.5 0.5X0.5 1951-
2100
NOAA-GFDL-GFDL-
ESM2M_SMHI-RCA4
SMHI-
RCA4
GFDL SMHI RCP8.5 0.5X0.5 1951-
2100
IPSL-CM5A-MR_SMHI-
RCA4
SMHI-
RCA4
IPSL-CM5A SMHI RCP8.5 0.5X0.5 1951-
2100
MIROC-MIROC5_SMHI-
RCA4
SMHI-
RCA4
MIRCO SMHI RCP8.5 0.5X0.5 1951-
2100
MPI-M-MPI-ESM-
LR_SMHI-RCA4
SMHI-
RCA4
MPI-M SMHI RCP8.5 0.5X0.5 1951-
2100

25
Current Climate Variability Assessment, Climate Change Projections and Identification of “Climate Hotspot Blocks” for ICRG Blocks under MGNREGA
Infrastructure for Climate Resilient Growth in India (ICRG) Programme
5.2. Temperature Projections for 2021-2050
Temperature projections have been estimated for the summer months of March to May for
the 30-year period of 2021-2050. Mean maximum and mean minimum temperatures have
been projected for this period.
5.2.1. Distribution of Blocks According to Mean Maximum and Minimum Temperature during
Summer Months during 2021-2050
In this section, the mean maximum and minimum temperature projections for the different
ICRG blocks of the three states of Bihar, Chhattisgarh and Odisha under the RCP 8.5 scenario
for the period 2021-2050 is presented.
Bihar (Figure 5.1)
Blocks Tan Kuppa, Muhra, Fatehpur, Mohanpur, Karai Parsurai and Nagar Nausa show
the highest mean seasonal maximum temperature under projected (RCP 8.5) scenario,
the temperature reaching 37 C and above.
Balrampur block recorded the least mean maximum seasonal temperature during 2021-
2050.
Bhitahan and Madhubani blocks are projected to have the least mean minimum
seasonal temperature (17.5C), followed by Jogapatti, Piprasi and other blocks with the
maximum mean minimum seasonal temperature being 20.3 C during 2021-2050.
Chhattisgarh (Figure 5.2)
Blocks Masturi, Pathariya, Takhatpur and Pali show the highest seasonal maximum
temperature of 36 C and above under RCP 8.5 scenario during 2021-2050.
Blocks Sonhat, Bagicha, Bhaiyathan and Lundra blocks are projected to experience the
lowest mean seasonal minimum temperature of 16.6 C to 17.9 C under RCP 8.5
scenario during the period – 2021-2050.
Figure 5.1: Projected mean seasonal temperature (C) under RCP 8.5 scenario in the study blocks of Bihar for the period 2021-2050
05
10152025303540
TanKuppa
Muhra
Fatehpur
Mohanpur
KaraiParsurai
NagarNausa
Rahui
Sarm
era
Sikta
Phulidumar
Dhumariya
Jogapatti
ShamhoAkhaKurha
Bhitahan
Madhubani
Aurai
Piprasi
Garhpura
Bochahan
Chanan
Bausi
Sidhaw
Katra
Phulparas
Dandari
Mainatand
Bandra
Chhorahi
Ladania
Laukha
Laukahi
Falka
Azamnagar
Barsoi
Balrampur
Meansummertemperature(℃)
Bihar
Maxtemp Mintemp
26
Current Climate Variability Assessment, Climate Change Projections and Identification of “Climate Hotspot Blocks” for ICRG Blocks under MGNREGA
Infrastructure for Climate Resilient Growth in India (ICRG) Programme
Figure 5.2: Projected mean seasonal temperature (C) under RCP 8.5 scenario in the study blocks of Chhattisgarh for the period 2021-2050
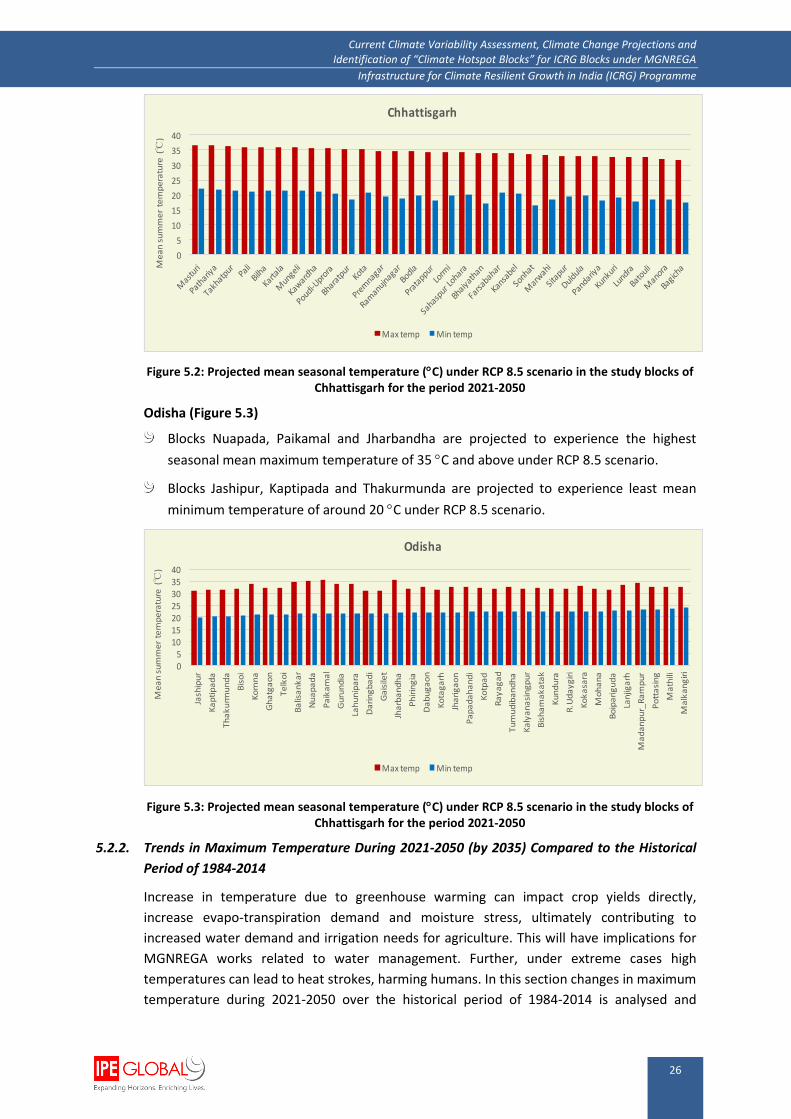
Odisha (Figure 5.3)
Blocks Nuapada, Paikamal and Jharbandha are projected to experience the highest
seasonal mean maximum temperature of 35 C and above under RCP 8.5 scenario.
Blocks Jashipur, Kaptipada and Thakurmunda are projected to experience least mean
minimum temperature of around 20 C under RCP 8.5 scenario.
Figure 5.3: Projected mean seasonal temperature (C) under RCP 8.5 scenario in the study blocks of Chhattisgarh for the period 2021-2050
5.2.2. Trends in Maximum Temperature During 2021-2050 (by 2035) Compared to the Historical
Period of 1984-2014
Increase in temperature due to greenhouse warming can impact crop yields directly,
increase evapo-transpiration demand and moisture stress, ultimately contributing to
increased water demand and irrigation needs for agriculture. This will have implications for
MGNREGA works related to water management. Further, under extreme cases high
temperatures can lead to heat strokes, harming humans. In this section changes in maximum
temperature during 2021-2050 over the historical period of 1984-2014 is analysed and
0
5
10
15
20
25
30
35
40
Meansummertemperature(℃)
Chhattisgarh
Maxtemp Mintemp
05
10152025303540
Jashipur
Kaptipada
Thakurm
unda
Bisoi
Komna
Ghatgaon
Telkoi
Balisankar
Nuapada
Paikamal
Gurundia
Lahunipara
Daringbadi
Gaisilet
Jharbandha
Phiringia
Dabugaon
Kotagarh
Jharigaon
Papadahandi
Kotpad
Rayagad
Tumudibandha
Kalyanasingpur
Bishamakatak
Kundura
R.Udaygiri
Kokasara
Mohana
Boipariguda
Lanjigarh
Madanpur_Rampur
Pottasing
Mathili
Malkangiri
Meansummertemperature(℃)
Odisha
Maxtemp Mintemp
27
Current Climate Variability Assessment, Climate Change Projections and Identification of “Climate Hotspot Blocks” for ICRG Blocks under MGNREGA
Infrastructure for Climate Resilient Growth in India (ICRG) Programme
presented for the identified ICRG blocks in the three states of Bihar, Chhattisgarh and
Odisha.
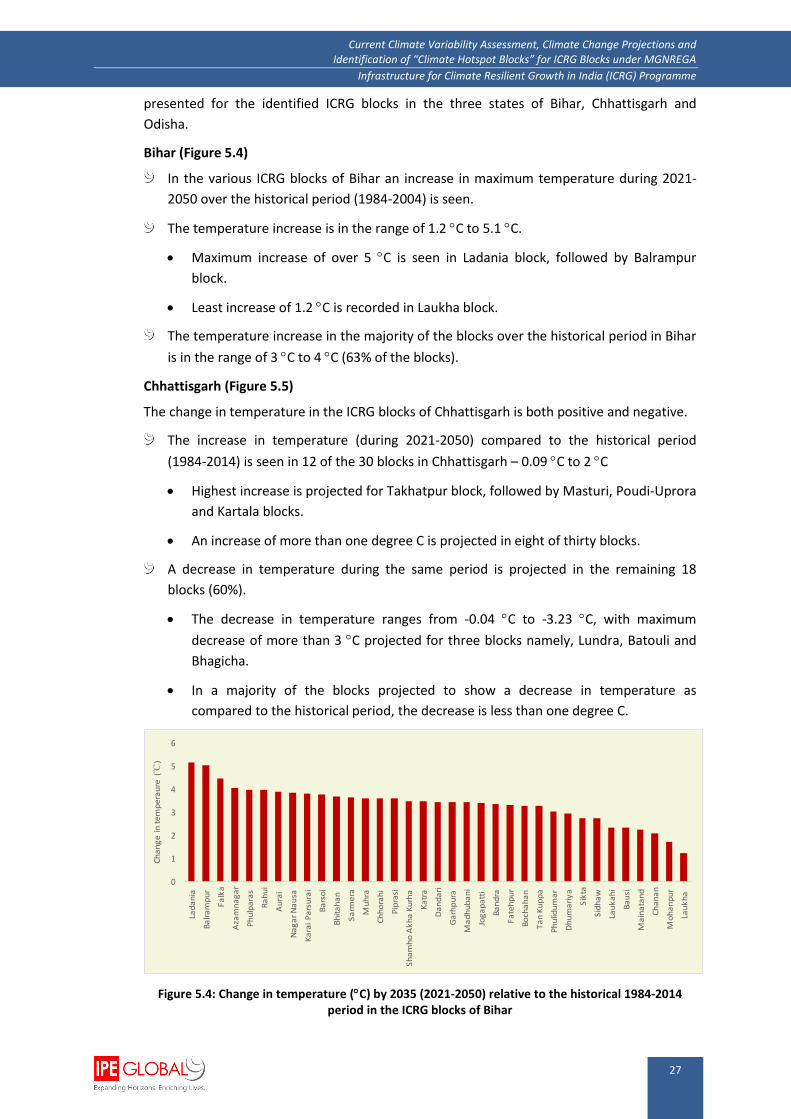
Bihar (Figure 5.4)
In the various ICRG blocks of Bihar an increase in maximum temperature during 2021-
2050 over the historical period (1984-2004) is seen.
The temperature increase is in the range of 1.2 C to 5.1 C.
Maximum increase of over 5 C is seen in Ladania block, followed by Balrampur
block.
Least increase of 1.2 C is recorded in Laukha block.
The temperature increase in the majority of the blocks over the historical period in Bihar
is in the range of 3 C to 4 C (63% of the blocks).
Chhattisgarh (Figure 5.5)
The change in temperature in the ICRG blocks of Chhattisgarh is both positive and negative.
The increase in temperature (during 2021-2050) compared to the historical period
(1984-2014) is seen in 12 of the 30 blocks in Chhattisgarh – 0.09 C to 2 C
Highest increase is projected for Takhatpur block, followed by Masturi, Poudi-Uprora
and Kartala blocks.
An increase of more than one degree C is projected in eight of thirty blocks.
A decrease in temperature during the same period is projected in the remaining 18
blocks (60%).
The decrease in temperature ranges from -0.04 C to -3.23 C, with maximum
decrease of more than 3 C projected for three blocks namely, Lundra, Batouli and
Bhagicha.
In a majority of the blocks projected to show a decrease in temperature as
compared to the historical period, the decrease is less than one degree C.
Figure 5.4: Change in temperature (C) by 2035 (2021-2050) relative to the historical 1984-2014 period in the ICRG blocks of Bihar
0
1
2
3
4
5
6
Ladania
Balrampur
Falka
Azamnagar
Phulparas
Rahui
Aurai
NagarNausa
KaraiParsurai
Barsoi
Bhitahan
Sarm
era
Muhra
Chhorahi
Piprasi
ShamhoAkhaKurha
Katra
Dandari
Garhpura
Madhubani
Jogapatti
Bandra
Fatehpur
Bochahan
TanKuppa
Phulidumar
Dhumariya
Sikta
Sidhaw
Laukahi
Bausi
Mainatand
Chanan
Mohanpur
Laukha
Changeintemperaure(℃)

28
Current Climate Variability Assessment, Climate Change Projections and Identification of “Climate Hotspot Blocks” for ICRG Blocks under MGNREGA
Infrastructure for Climate Resilient Growth in India (ICRG) Programme
Figure 5.5: Change in temperature (C) by 2035 (2021-2050) relative to the historical 1984-2014 period in the ICRG blocks of Chhattisgarh
Odisha (Figure 5.6)
The identified ICRG blocks in Odisha also show both increasing and decreasing trends in
warming as compared to the historical period (1984-2014).
The increase in temperature is in 13 of the 35 blocks while in the rest, a decrease in
temperature is projected.
The increase in temperature is in the range of 0.3 C to 1.5 C.
Highest increase in temperature of about 1.5 C is projected in Telkoi, Balisankar and
Gaisilet blocks.
Least increase in temperature is recorded in Kaptipada block.
The decrease in temperature is highest in Tumudibandha block (-1.69 C), followed by
Madanpur_Rampur, Boipariguda, Thakurmunda, Daringbadi and Kundura blocks all
showing an increase of more than one degree C under the projected 2021-2050
scenario.
In nine blocks, the decrease in temperature is in the range of 0.5 C to 1.0 C.
Figure 5.6: Change in temperature (C) by 2035 (2021-2050) relative to the historical 1984-2014 period in the ICRG blocks of Odisha

29
Current Climate Variability Assessment, Climate Change Projections and Identification of “Climate Hotspot Blocks” for ICRG Blocks under MGNREGA
Infrastructure for Climate Resilient Growth in India (ICRG) Programme
5.3. Rainfall Projections for the Period 2021-2050 (2035)
In this section, assessment of rainfall projections for the period 2021-2050, with respect to
number of rainy days and in comparison to the historical period (1984-2014) are presented.
Any reduction in the number of rainy days, accompanied by either increase in total rainfall
or no significant change in rainfall indicates the occurrence of flood events. Number of rainy
days and rainfall intensity are also critical for designing water storage structures under
MGNREGA.
5.3.1. Changes in Mean Monsoon (JJAS) Rainfall During 2021-2050 Compared to the Historical
Period 1984-2014
The mean monsoon (June to September-JJAS) rainfall for the two periods – historical (1984-
2014) and projected (2021-2050) is compared in this section to understand the changes in
rainfall during the critical agricultural season. Figure 5.7 presents the top five blocks among
the identified ICRG blocks, showing increase or decrease in rainfall during JJAS in the three
states of Bihar, Chhattisgarh and Odisha. Appendix gives the change in rainfall for all the
identified ICRG blocks in the three states.
Bihar
The top five blocks showing increase in rainfall during 2021-2050 over the historical
period in Bihar are Azamnagar, Barsoi, Balrampur, Aurai and Karai Parsurai.
The positive change or increase in rainfall ranges from 31.4% in Karai Parsurai to
about 40% in Azamnagar.
However, in the blocks of Sidhaw, Nagar Nuasa, Phulidumar, Phulparas and Laukahi, a
decrease in rainfall during the 2021-2050 compared to the historical period is projected.
In the other blocks, the decrease is in the range of -20.3% to -25.6%.
Chhattisgarh
The increase in rainfall in the Chhattisgarh blocks (top five) ranges from 8% in
Farsabahar to 16.8% in Kota block.
Other blocks showing an increase in rainfall include Bodla (15.7%), Sahasrapur-
Lohara (10.1%) and Marwahi (9.7%).
During the same period, a decrease in rainfall is projected in the blocks (top five) of
Bhaiyathan, Pathariya, Pratappur, Kunkuri and Pali.
The decrease is greater than one-fourth in Bhaiyathan (-25.4%), it is -21.6% in
Pratappur and -23% in Pathariya.
There is a 16% decrease in the other two blocks – Kunkuri and Pali.
Odisha
Top five blocks with highest projected increase in monsoon rainfall in Odisha are
Pottasingh, Daringbadi, Bisoi, Kaptipada and Jashipur.
The increase in rainfall is more than 20% in Pottasingh and Daringbadi and it is 13%
and 14.6% in Kaptipada and Bisoi blocks, respectively.
The least increase of 8.9% is projected for Jashipur block.
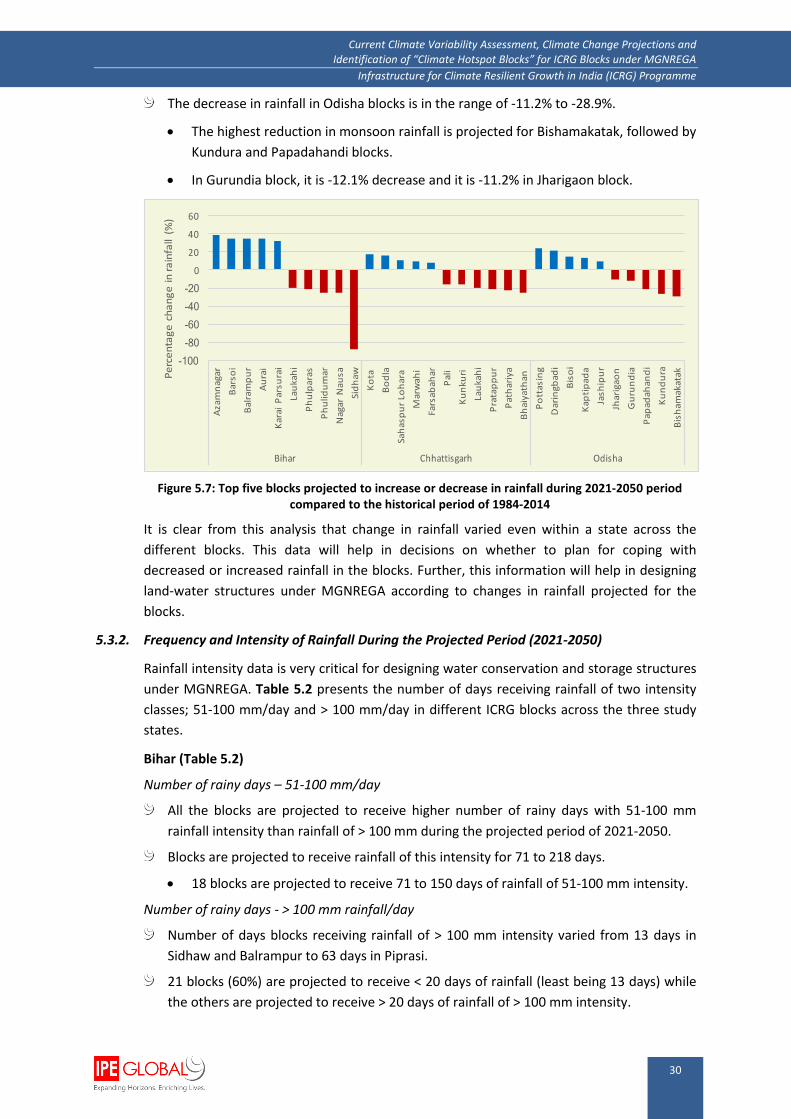
30
Current Climate Variability Assessment, Climate Change Projections and Identification of “Climate Hotspot Blocks” for ICRG Blocks under MGNREGA
Infrastructure for Climate Resilient Growth in India (ICRG) Programme
The decrease in rainfall in Odisha blocks is in the range of -11.2% to -28.9%.
The highest reduction in monsoon rainfall is projected for Bishamakatak, followed by
Kundura and Papadahandi blocks.
In Gurundia block, it is -12.1% decrease and it is -11.2% in Jharigaon block.
Figure 5.7: Top five blocks projected to increase or decrease in rainfall during 2021-2050 period
compared to the historical period of 1984-2014
It is clear from this analysis that change in rainfall varied even within a state across the
different blocks. This data will help in decisions on whether to plan for coping with
decreased or increased rainfall in the blocks. Further, this information will help in designing
land-water structures under MGNREGA according to changes in rainfall projected for the
blocks.
5.3.2. Frequency and Intensity of Rainfall During the Projected Period (2021-2050)
Rainfall intensity data is very critical for designing water conservation and storage structures
under MGNREGA. Table 5.2 presents the number of days receiving rainfall of two intensity
classes; 51-100 mm/day and > 100 mm/day in different ICRG blocks across the three study
states.
Bihar (Table 5.2)
Number of rainy days – 51-100 mm/day
All the blocks are projected to receive higher number of rainy days with 51-100 mm
rainfall intensity than rainfall of > 100 mm during the projected period of 2021-2050.
Blocks are projected to receive rainfall of this intensity for 71 to 218 days.
18 blocks are projected to receive 71 to 150 days of rainfall of 51-100 mm intensity.
Number of rainy days - > 100 mm rainfall/day
Number of days blocks receiving rainfall of > 100 mm intensity varied from 13 days in
Sidhaw and Balrampur to 63 days in Piprasi.
21 blocks (60%) are projected to receive < 20 days of rainfall (least being 13 days) while
the others are projected to receive > 20 days of rainfall of > 100 mm intensity.
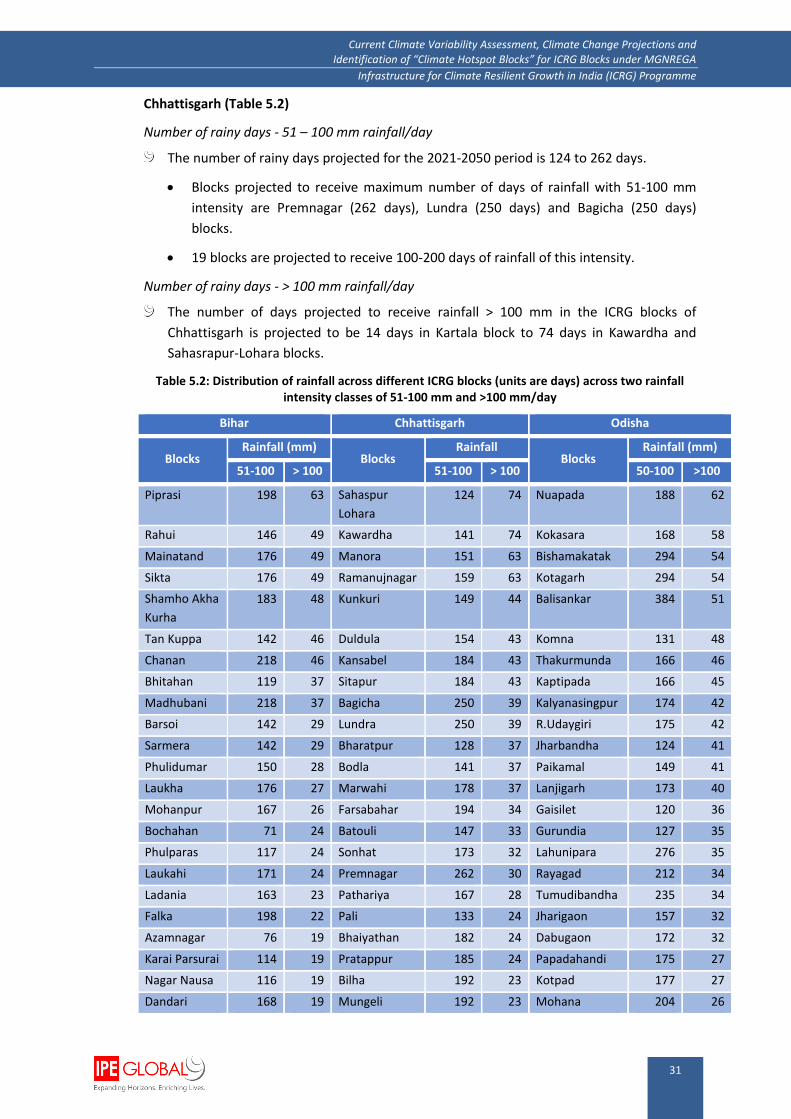
31
Current Climate Variability Assessment, Climate Change Projections and Identification of “Climate Hotspot Blocks” for ICRG Blocks under MGNREGA
Infrastructure for Climate Resilient Growth in India (ICRG) Programme
Chhattisgarh (Table 5.2)
Number of rainy days - 51 – 100 mm rainfall/day
The number of rainy days projected for the 2021-2050 period is 124 to 262 days.
Blocks projected to receive maximum number of days of rainfall with 51-100 mm
intensity are Premnagar (262 days), Lundra (250 days) and Bagicha (250 days)
blocks.
19 blocks are projected to receive 100-200 days of rainfall of this intensity.
Number of rainy days - > 100 mm rainfall/day
The number of days projected to receive rainfall > 100 mm in the ICRG blocks of
Chhattisgarh is projected to be 14 days in Kartala block to 74 days in Kawardha and
Sahasrapur-Lohara blocks.
Table 5.2: Distribution of rainfall across different ICRG blocks (units are days) across two rainfall intensity classes of 51-100 mm and >100 mm/day
Bihar Chhattisgarh Odisha
Blocks Rainfall (mm)
Blocks Rainfall
Blocks Rainfall (mm)
51-100 > 100 51-100 > 100 50-100 >100
Piprasi 198 63 Sahaspur
Lohara
124 74 Nuapada 188 62
Rahui 146 49 Kawardha 141 74 Kokasara 168 58
Mainatand 176 49 Manora 151 63 Bishamakatak 294 54
Sikta 176 49 Ramanujnagar 159 63 Kotagarh 294 54
Shamho Akha
Kurha
183 48 Kunkuri 149 44 Balisankar 384 51
Tan Kuppa 142 46 Duldula 154 43 Komna 131 48
Chanan 218 46 Kansabel 184 43 Thakurmunda 166 46
Bhitahan 119 37 Sitapur 184 43 Kaptipada 166 45
Madhubani 218 37 Bagicha 250 39 Kalyanasingpur 174 42
Barsoi 142 29 Lundra 250 39 R.Udaygiri 175 42
Sarmera 142 29 Bharatpur 128 37 Jharbandha 124 41
Phulidumar 150 28 Bodla 141 37 Paikamal 149 41
Laukha 176 27 Marwahi 178 37 Lanjigarh 173 40
Mohanpur 167 26 Farsabahar 194 34 Gaisilet 120 36
Bochahan 71 24 Batouli 147 33 Gurundia 127 35
Phulparas 117 24 Sonhat 173 32 Lahunipara 276 35
Laukahi 171 24 Premnagar 262 30 Rayagad 212 34
Ladania 163 23 Pathariya 167 28 Tumudibandha 235 34
Falka 198 22 Pali 133 24 Jharigaon 157 32
Azamnagar 76 19 Bhaiyathan 182 24 Dabugaon 172 32
Karai Parsurai 114 19 Pratappur 185 24 Papadahandi 175 27
Nagar Nausa 116 19 Bilha 192 23 Kotpad 177 27
Dandari 168 19 Mungeli 192 23 Mohana 204 26

32
Current Climate Variability Assessment, Climate Change Projections and Identification of “Climate Hotspot Blocks” for ICRG Blocks under MGNREGA
Infrastructure for Climate Resilient Growth in India (ICRG) Programme
Bihar Chhattisgarh Odisha
Blocks Rainfall (mm)
Blocks Rainfall
Blocks Rainfall (mm)
51-100 > 100 51-100 > 100 50-100 >100
Garhpura 174 19 Poudi-Uprora 192 23 Daringbadi 191 25
Chhorahi 188 19 Pandariya 175 22 Malkangiri 110 22
Bandra 138 18 Lormi 137 16 Mathili 110 22
Dhumariya 149 18 Masturi 158 16 Ghatgaon 268 22
Katra 106 17 Kota 173 16 Madanpur-
Rampur
378 22
Bausi 114 14 Takhatpur 185 16 Pottasing 169 21
Muhra 114 14 Kartala 158 14 Phiringia 378 21
Aurai 142 14 Boipariguda 314 17
Fatehpur 142 14 Kundura 314 17
Jogapatti 176 14 Bisoi 131 15
Balrampur 174 13 Jashipur 131 15
Sidhaw 174 13 Telkoi 156 14
Odisha (Table 5.2)
Number of rainy days - 51 – 100 mm rainfall/day
The number of rainy days projected for the 2021-2050 period in the ICRG blocks of
Odisha are 110 days to 384 days.
Blocks projected to receive maximum number of days of rainfall (> 300 days) with
51-100 mm intensity are Boipariguda, Kundura, Madanpur-Rampur, Phiringia and
Balisankar blocks.
Least number of rainy days (110-200 days) of this intensity is projected in 23 blocks.
Number of rainy days - > 100 mm rainfall/day
Rainfall of intensity > 100 mm is projected to occur over 14 to 62 days in Odisha blocks.
12 blocks are projected to receive < 25 days of >100 mm rainfall; 18 blocks for 25-50
days and only 5 blocks for > 50 days.
5.3.3. Change in Frequency and Intensity of high intensity Rainfall During the Projected Period
(2021-2050) Over the Historical Period (1984-2014)
A comparison of the frequency of occurrence (number of days) of rainfall of different
intensities between the historical period (1984-2014) and the projected RCP 8.5 scenario for
the period 2021-2050 indicates that the trends are varied across blocks and states.
Bihar (Figure 5.8)
Number of rainy days - 51 – 100 mm rainfall/day
Among the identified ICRG blocks in Bihar, the frequency of occurrence of rainfall events
of 51-100 mm intensity is projected to increase in all except two blocks – Azamnagar and
Bausi.
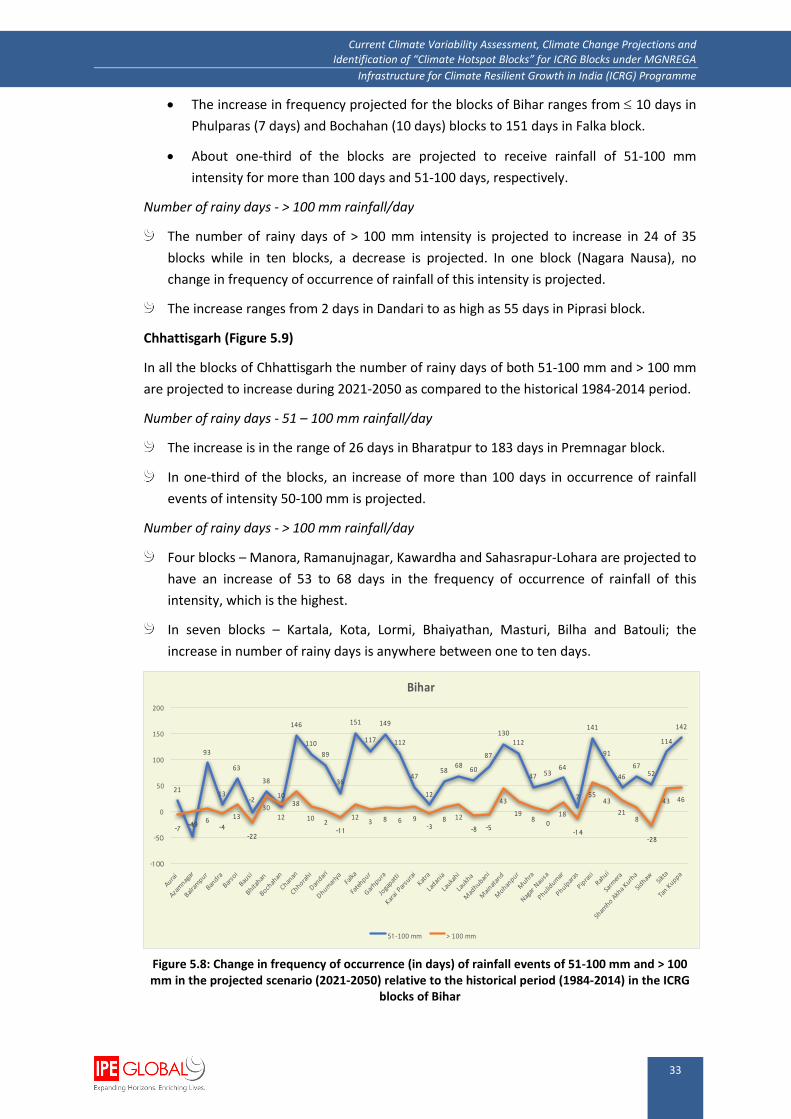
33
Current Climate Variability Assessment, Climate Change Projections and Identification of “Climate Hotspot Blocks” for ICRG Blocks under MGNREGA
Infrastructure for Climate Resilient Growth in India (ICRG) Programme
The increase in frequency projected for the blocks of Bihar ranges from 10 days in
Phulparas (7 days) and Bochahan (10 days) blocks to 151 days in Falka block.
About one-third of the blocks are projected to receive rainfall of 51-100 mm
intensity for more than 100 days and 51-100 days, respectively.
Number of rainy days - > 100 mm rainfall/day
The number of rainy days of > 100 mm intensity is projected to increase in 24 of 35
blocks while in ten blocks, a decrease is projected. In one block (Nagara Nausa), no
change in frequency of occurrence of rainfall of this intensity is projected.
The increase ranges from 2 days in Dandari to as high as 55 days in Piprasi block.
Chhattisgarh (Figure 5.9)
In all the blocks of Chhattisgarh the number of rainy days of both 51-100 mm and > 100 mm
are projected to increase during 2021-2050 as compared to the historical 1984-2014 period.
Number of rainy days - 51 – 100 mm rainfall/day
The increase is in the range of 26 days in Bharatpur to 183 days in Premnagar block.
In one-third of the blocks, an increase of more than 100 days in occurrence of rainfall
events of intensity 50-100 mm is projected.
Number of rainy days - > 100 mm rainfall/day
Four blocks – Manora, Ramanujnagar, Kawardha and Sahasrapur-Lohara are projected to
have an increase of 53 to 68 days in the frequency of occurrence of rainfall of this
intensity, which is the highest.
In seven blocks – Kartala, Kota, Lormi, Bhaiyathan, Masturi, Bilha and Batouli; the
increase in number of rainy days is anywhere between one to ten days.
Figure 5.8: Change in frequency of occurrence (in days) of rainfall events of 51-100 mm and > 100 mm in the projected scenario (2021-2050) relative to the historical period (1984-2014) in the ICRG
blocks of Bihar
21
-49
93
13
63
-2
38
10
146
110
89
36
151
117
149
112
47
12
5868
60
87
130112
47 5364
7
141
91
46
6752
114
142
-7 -1 6-4
13
-22
3012
38
102
-1 1 12
3 8 6 9-3
8 12
-8 -5
43
198
018
-14
5543
218
-28
43 46
-100
-50
0
50
100
150
200
Bihar
51 -100mm >100mm
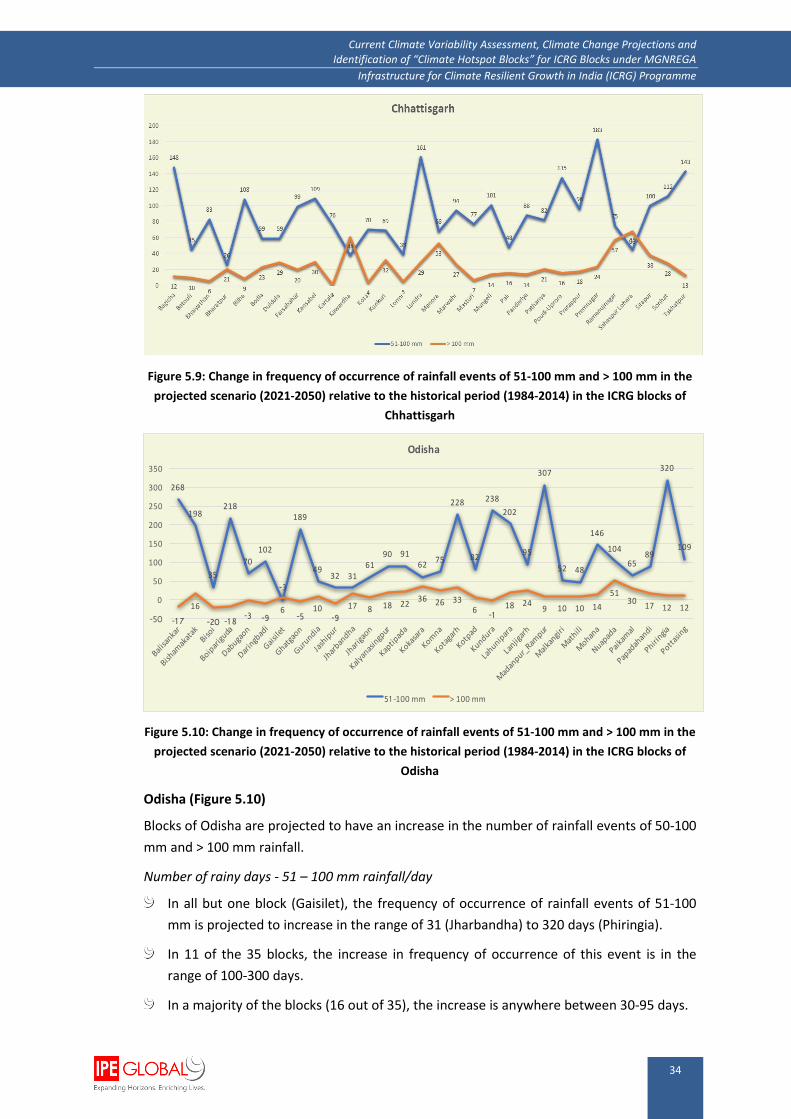
34
Current Climate Variability Assessment, Climate Change Projections and Identification of “Climate Hotspot Blocks” for ICRG Blocks under MGNREGA
Infrastructure for Climate Resilient Growth in India (ICRG) Programme
Figure 5.9: Change in frequency of occurrence of rainfall events of 51-100 mm and > 100 mm in the
projected scenario (2021-2050) relative to the historical period (1984-2014) in the ICRG blocks of
Chhattisgarh
Figure 5.10: Change in frequency of occurrence of rainfall events of 51-100 mm and > 100 mm in the
projected scenario (2021-2050) relative to the historical period (1984-2014) in the ICRG blocks of
Odisha
Odisha (Figure 5.10)
Blocks of Odisha are projected to have an increase in the number of rainfall events of 50-100
mm and > 100 mm rainfall.
Number of rainy days - 51 – 100 mm rainfall/day
In all but one block (Gaisilet), the frequency of occurrence of rainfall events of 51-100
mm is projected to increase in the range of 31 (Jharbandha) to 320 days (Phiringia).
In 11 of the 35 blocks, the increase in frequency of occurrence of this event is in the
range of 100-300 days.
In a majority of the blocks (16 out of 35), the increase is anywhere between 30-95 days.
268
198
35
218
70
102
-3
189
4932 31
6190 91
6275
228
82
238
202
95
307
52 48
146
104
6589
320
109
-17 16
-20 -18 -3 -9 6 -5
10-9
17 8 18 2236 26 33
6 -1 18 24
9 10 10 14
5130
17 12 12
-50 0
50
100
150
200
250
300
350
Odisha
51 -100mm >100mm
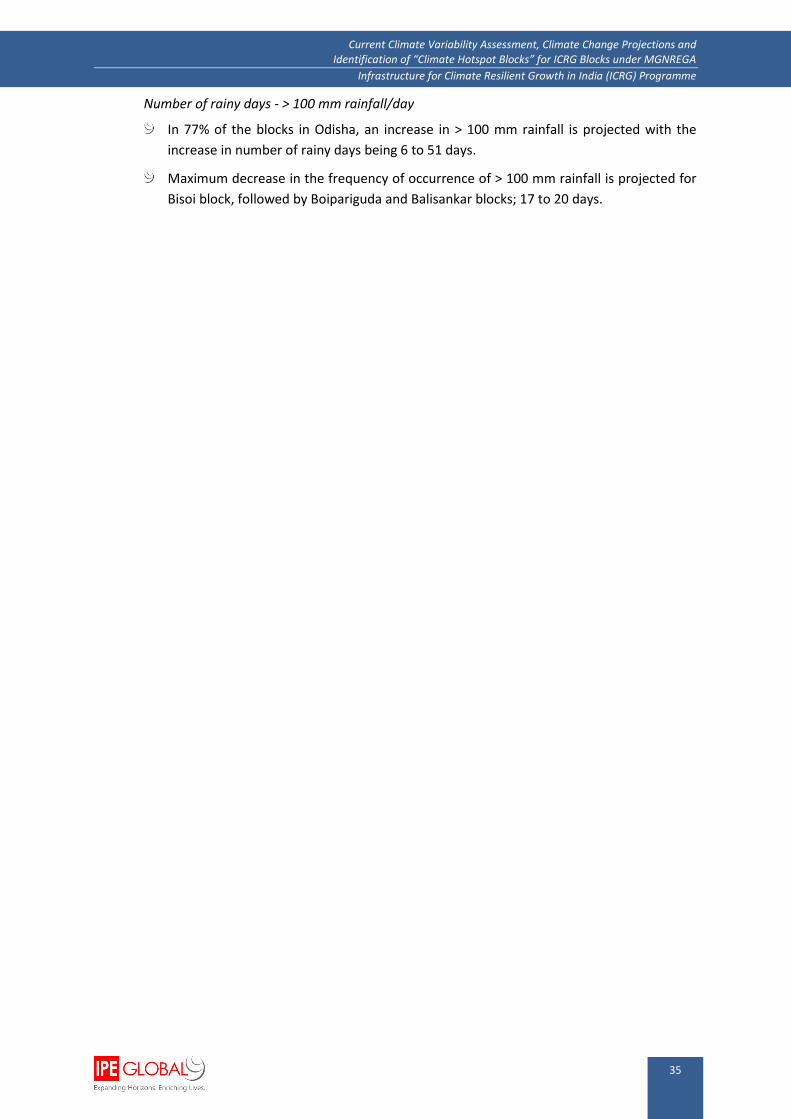
35
Current Climate Variability Assessment, Climate Change Projections and Identification of “Climate Hotspot Blocks” for ICRG Blocks under MGNREGA
Infrastructure for Climate Resilient Growth in India (ICRG) Programme
Number of rainy days - > 100 mm rainfall/day
In 77% of the blocks in Odisha, an increase in > 100 mm rainfall is projected with the
increase in number of rainy days being 6 to 51 days.
Maximum decrease in the frequency of occurrence of > 100 mm rainfall is projected for
Bisoi block, followed by Boipariguda and Balisankar blocks; 17 to 20 days.
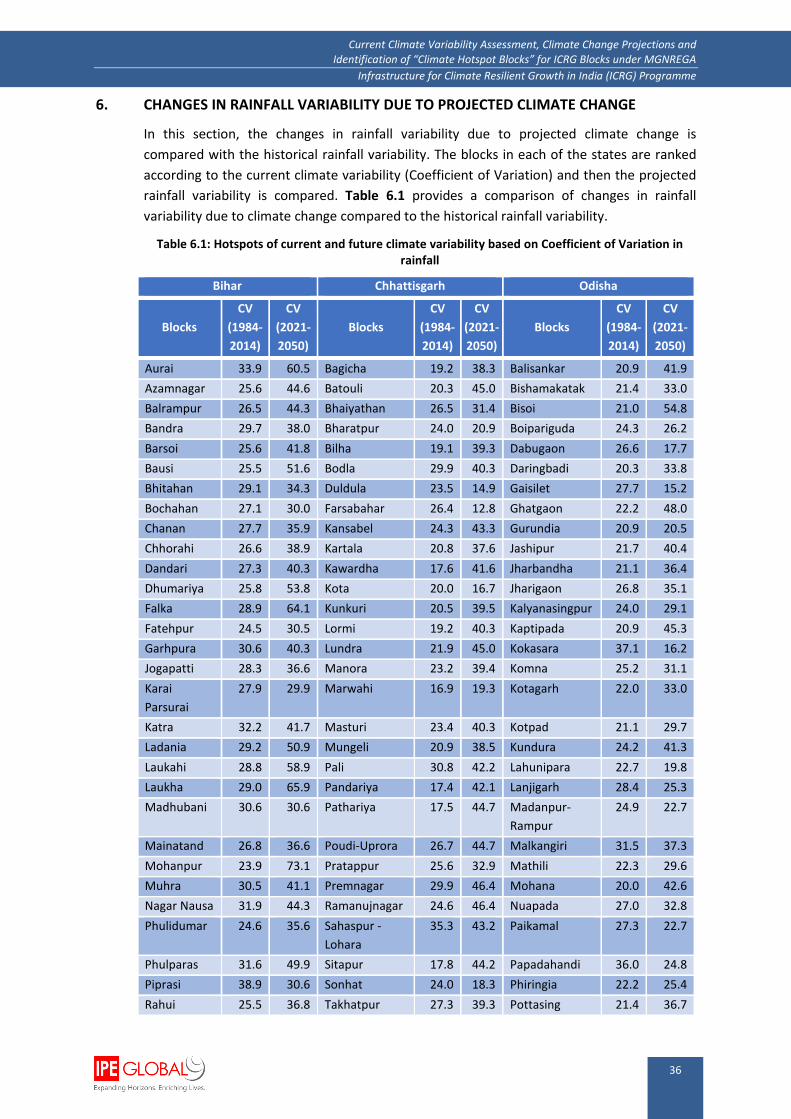
36
Current Climate Variability Assessment, Climate Change Projections and Identification of “Climate Hotspot Blocks” for ICRG Blocks under MGNREGA
Infrastructure for Climate Resilient Growth in India (ICRG) Programme
6. CHANGES IN RAINFALL VARIABILITY DUE TO PROJECTED CLIMATE CHANGE
In this section, the changes in rainfall variability due to projected climate change is
compared with the historical rainfall variability. The blocks in each of the states are ranked
according to the current climate variability (Coefficient of Variation) and then the projected
rainfall variability is compared. Table 6.1 provides a comparison of changes in rainfall
variability due to climate change compared to the historical rainfall variability.
Table 6.1: Hotspots of current and future climate variability based on Coefficient of Variation in rainfall
Bihar Chhattisgarh Odisha
Blocks
CV
(1984-
2014)
CV
(2021-
2050)
Blocks
CV
(1984-
2014)
CV
(2021-
2050)
Blocks
CV
(1984-
2014)
CV
(2021-
2050)
Aurai 33.9 60.5 Bagicha 19.2 38.3 Balisankar 20.9 41.9
Azamnagar 25.6 44.6 Batouli 20.3 45.0 Bishamakatak 21.4 33.0
Balrampur 26.5 44.3 Bhaiyathan 26.5 31.4 Bisoi 21.0 54.8
Bandra 29.7 38.0 Bharatpur 24.0 20.9 Boipariguda 24.3 26.2
Barsoi 25.6 41.8 Bilha 19.1 39.3 Dabugaon 26.6 17.7
Bausi 25.5 51.6 Bodla 29.9 40.3 Daringbadi 20.3 33.8
Bhitahan 29.1 34.3 Duldula 23.5 14.9 Gaisilet 27.7 15.2
Bochahan 27.1 30.0 Farsabahar 26.4 12.8 Ghatgaon 22.2 48.0
Chanan 27.7 35.9 Kansabel 24.3 43.3 Gurundia 20.9 20.5
Chhorahi 26.6 38.9 Kartala 20.8 37.6 Jashipur 21.7 40.4
Dandari 27.3 40.3 Kawardha 17.6 41.6 Jharbandha 21.1 36.4
Dhumariya 25.8 53.8 Kota 20.0 16.7 Jharigaon 26.8 35.1
Falka 28.9 64.1 Kunkuri 20.5 39.5 Kalyanasingpur 24.0 29.1
Fatehpur 24.5 30.5 Lormi 19.2 40.3 Kaptipada 20.9 45.3
Garhpura 30.6 40.3 Lundra 21.9 45.0 Kokasara 37.1 16.2
Jogapatti 28.3 36.6 Manora 23.2 39.4 Komna 25.2 31.1
Karai
Parsurai
27.9 29.9 Marwahi 16.9 19.3 Kotagarh 22.0 33.0
Katra 32.2 41.7 Masturi 23.4 40.3 Kotpad 21.1 29.7
Ladania 29.2 50.9 Mungeli 20.9 38.5 Kundura 24.2 41.3
Laukahi 28.8 58.9 Pali 30.8 42.2 Lahunipara 22.7 19.8
Laukha 29.0 65.9 Pandariya 17.4 42.1 Lanjigarh 28.4 25.3
Madhubani 30.6 30.6 Pathariya 17.5 44.7 Madanpur-
Rampur
24.9 22.7
Mainatand 26.8 36.6 Poudi-Uprora 26.7 44.7 Malkangiri 31.5 37.3
Mohanpur 23.9 73.1 Pratappur 25.6 32.9 Mathili 22.3 29.6
Muhra 30.5 41.1 Premnagar 29.9 46.4 Mohana 20.0 42.6
Nagar Nausa 31.9 44.3 Ramanujnagar 24.6 46.4 Nuapada 27.0 32.8
Phulidumar 24.6 35.6 Sahaspur -
Lohara
35.3 43.2 Paikamal 27.3 22.7
Phulparas 31.6 49.9 Sitapur 17.8 44.2 Papadahandi 36.0 24.8
Piprasi 38.9 30.6 Sonhat 24.0 18.3 Phiringia 22.2 25.4
Rahui 25.5 36.8 Takhatpur 27.3 39.3 Pottasing 21.4 36.7

37
Current Climate Variability Assessment, Climate Change Projections and Identification of “Climate Hotspot Blocks” for ICRG Blocks under MGNREGA
Infrastructure for Climate Resilient Growth in India (ICRG) Programme
Bihar Chhattisgarh Odisha
Blocks
CV
(1984-
2014)
CV
(2021-
2050)
Blocks
CV
(1984-
2014)
CV
(2021-
2050)
Blocks
CV
(1984-
2014)
CV
(2021-
2050)
Sarmera 28.7 26.6 R.Udaygiri 19.6 47.7
Shamho
Akha Kurha
24.1 33.3 Rayagad 21.4 40.7
Sidhaw 35.8 36.5 Telkoi 20.0 27.9
Sikta 27.0 38.9 Thakurmunda 18.6 47.2
Tan Kuppa 29.9 31.4 Tumudibandha 23.9 31.4
Bihar
When CV of monsoon seasonal rainfall of all the blocks of Bihar is considered, 32 out of
35 blocks are projected to experience increased rainfall variability.
Further, it is projected that six blocks may experience increase in rainfall variability by
over 100% and 12 blocks out of 35 are projected to experience > 50%.
Chhattisgarh
Out of the 30 blocks, 27 blocks are projected to experience increased rainfall variability.
Among the 30 blocks, eight blocks are projected to experience > 100% increase in
monsoon season rainfall variability and 18 blocks by over 50%.
Odisha
In Orissa, out of the 35 blocks, 26 blocks are projected to experience increasing rainfall
variability.
Out of the 35 blocks, seven blocks are projected to experience over 100% increase in
rainfall variability and 15 blocks are projected to experience by over 50%.
Comparison of projected rainfall variability (2021-2050) with the historical 30-year variability
(1984-2014) shows an increase in rainfall variability under climate change for most of the
blocks. Further, six blocks in Bihar, eight blocks in Chhattisgarh and seven blocks in Odisha
are projected to experience more than doubling of the rainfall variability. Similarly, 34% of
blocks in Bihar, 60% of the blocks in Chhattisgarh and 43% of the blocks in Odisha are
projected to experience over 50% increase in rainfall variability. Thus, this is a significant
impact of climate change on monsoon rainfall variability. This will have implications for
agriculture, water availability and design of MGNREGA structures.

38
Current Climate Variability Assessment, Climate Change Projections and Identification of “Climate Hotspot Blocks” for ICRG Blocks under MGNREGA
Infrastructure for Climate Resilient Growth in India (ICRG) Programme
7. HOTSPOTS OF RAINFALL VARIABILITY
It is possible to rank the various identified ICRG blocks in the three states based on variability
in monsoon rainfall, which is crucial for agriculture. The top ranked blocks with high rainfall
variability (Coefficient of Variation) could be prioritized for designing climate resilient land
and water related structures under MGNREGA. Table 7.1 lists the top five blocks with
highest CV under current climate (1984-2014) as well as under the projected RCP 8.5
scenario for the period – 2021-2050.
Bihar
CV under current climate
It can be seen from Table 7.1 that climate variability is greater than 30% in the top five
blocks, showing highest CV.
It is highest in Piprasi (38.8%) and lowest in Nagar Nuasa (31.8%)
CV under projected climate
Climate variability under this scenario as indicated by the CV is very high and ranges
from 58.9% in Laukahi block to as high as 73.1% in Mohanpur block.
In the other three blocks, it is 60.5% to 65.8%.
Chhattisgarh
CV under current climate
Among the top five blocks showing high climate variability, Takhatpur block has least CV
(27.2%), followed by Bodla and Premnagar blocks.
In Pali and Sahaspur-Lohara blocks, the CV is greater than 30%.
CV under projected climate
Variability under the projected climate for the 5 blocks is within a small range of 44.7%
to 46.3%.
Highest variability is projected for Premnagar block (46.3%), which is the third most
vulnerable block under the current climate.
Least variability is projected for Pathariya block (44.7%).
Table 7.1: Hotspots of current and future climate variability based on CV in rainfall
State
Top 5 blocks with highest CV under
current climate (1984-2014)
Top 5 blocks with highest CV under RCP
8.5 scenario (2021-2050)
Blocks CV Blocks CV
Bihar Piprasi 38.88 Mohanpur 73.14
Sidhaw 35.75 Laukha 65.86
Aurai 33.91 Falka 64.14
Katra 32.24 Aurai 60.51
Nagar Nausa 31.86 Laukahi 58.90
Chhattisgarh Sahaspur-Lohara 35.31 Premnagar 46.36
Pali 30.76 Ramanujnagar 46.36
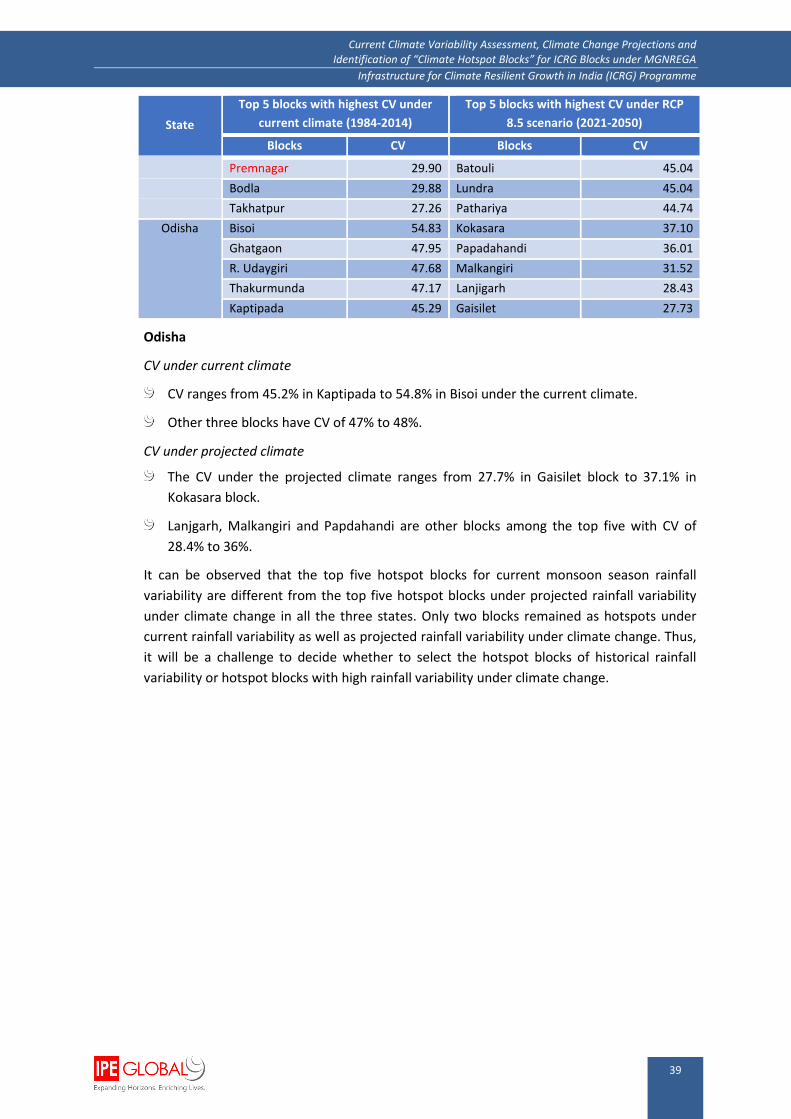
39
Current Climate Variability Assessment, Climate Change Projections and Identification of “Climate Hotspot Blocks” for ICRG Blocks under MGNREGA
Infrastructure for Climate Resilient Growth in India (ICRG) Programme
State
Top 5 blocks with highest CV under
current climate (1984-2014)
Top 5 blocks with highest CV under RCP
8.5 scenario (2021-2050)
Blocks CV Blocks CV
Premnagar 29.90 Batouli 45.04
Bodla 29.88 Lundra 45.04
Takhatpur 27.26 Pathariya 44.74
Odisha Bisoi 54.83 Kokasara 37.10
Ghatgaon 47.95 Papadahandi 36.01
R. Udaygiri 47.68 Malkangiri 31.52
Thakurmunda 47.17 Lanjigarh 28.43
Kaptipada 45.29 Gaisilet 27.73
Odisha
CV under current climate
CV ranges from 45.2% in Kaptipada to 54.8% in Bisoi under the current climate.
Other three blocks have CV of 47% to 48%.
CV under projected climate
The CV under the projected climate ranges from 27.7% in Gaisilet block to 37.1% in
Kokasara block.
Lanjgarh, Malkangiri and Papdahandi are other blocks among the top five with CV of
28.4% to 36%.
It can be observed that the top five hotspot blocks for current monsoon season rainfall
variability are different from the top five hotspot blocks under projected rainfall variability
under climate change in all the three states. Only two blocks remained as hotspots under
current rainfall variability as well as projected rainfall variability under climate change. Thus,
it will be a challenge to decide whether to select the hotspot blocks of historical rainfall
variability or hotspot blocks with high rainfall variability under climate change.
40
Current Climate Variability Assessment, Climate Change Projections and Identification of “Climate Hotspot Blocks” for ICRG Blocks under MGNREGA
Infrastructure for Climate Resilient Growth in India (ICRG) Programme
8. CONCLUSIONS OF THE STUDY AND IMPLICATIONS FOR CLIMATE RESILIENT
INFRASTRUCTURE DEVELOPMENT UNDER MGNREGA
8.1. Main Conclusions
In this study, historical rainfall analysis was carried out for the identified ICRG blocks in the
three states of Bihar, Chhattisgarh and Odisha for the period 1984-2014. Similarly, climate
change projections were carried out using the latest climate models for the same blocks in
the three states for the period 2021-2050. Some of the key highlights of this assessment are
presented below:
i. Rainfall variability differs across states and across blocks within a state.
ii. Current rainfall variability is high for 88% of the blocks in Bihar to 30% of the blocks in
Chhattisgarh. Number of blocks with > 25% Coefficient of Variation in the three states
are:
Bihar, 31 out of 35 blocks
Chhattisgarh - 9 out of 30 blocks, and
Odisha 10 blocks out of 35.
iii. Majority of the blocks across states experienced mild to moderate drought events
In Bihar, 24 of the 35 blocks experienced mild to moderate drought in over 50% of
the years.
In Chhattisgarh, most blocks experienced mild drought only.
In Odisha, majority of the blocks experienced only mild drought.
iv. The main implication of temperature and rainfall trend and variability shows that there
is a large variation from block to block even within a state and definitely across states.
Thus, block level detailed historical analysis of climate trends, especially rainfall trends is
critical and necessary to:
Inform block and district level engineers and staff involved in designing MGNREGA
structures and assets, such as check dams, farm ponds, and minor irrigation works.
Assist them in preparing coping strategies for mild and moderate droughts.
Assist in contingency planning in the event of delay or failure of June or early sowing
rains.
Inform all the stakeholders about rainfall and temperature trends, frequency of
potential extreme rainfall events or droughts.
v. Climate change projections show a large variation in projected temperature trends, with
majority of the blocks projected to experience warming even by 2030s.
Bihar is projected to experience very high levels of warming with majority of the
blocks likely warm by 3 to 40C by 2030s. This will have significant implications for
irrigation water requirement, soil water stress and heat stress for humans.
The projected warming levels are moderate in Chhattisgarh and Odisha. Infact, some
blocks may experience a marginal decline in temperature.

41
Current Climate Variability Assessment, Climate Change Projections and Identification of “Climate Hotspot Blocks” for ICRG Blocks under MGNREGA
Infrastructure for Climate Resilient Growth in India (ICRG) Programme
Thus, temperature projections and high levels of warming and heat stress are critical
for majority of the blocks in Bihar.
vi. Multiple CORDEX model ensemble projections of monsoon season rainfall showed the
following:
Climate change is projected to have significant impact on total monsoon rainfall with
majority of the blocks projected to experience either increase or decline.
In Bihar, top five blocks are projected to experience 31 to 40% increase in rainfall.
But, 5 other blocks are projected to experience decline in the range of 20 to 25%.
Chhattisgarh and Odisha are projected to experience moderate increase or
decline in rainfall.
Thus, it is necessary to use block level projections in designing MGNREGA structures,
rather than the district or state level trends.
High intensity rainfalls days (> 100mm/day) are projected to increase most in Odisha
with some blocks likely to receive additional 2 days of high rainfall intensity per year.
Rainfall variability has increased for most blocks and some blocks are projected to
experience near doubling of the coefficient of variation of monsoon rainfall.
vii. Comparison of projected rainfall variability (2021-2050) with the historical 30-year
variability (1984-2014) shows an increase in rainfall variability under climate change for
most of the blocks.
Six blocks in Bihar, eight blocks in Chhattisgarh and seven blocks in Odisha are
projected to experience more than doubling of the rainfall variability.
Similarly, 34% of blocks in Bihar, 60% of the blocks in Chhattisgarh and 43% of the
blocks in Odisha are projected to experience over 50% increase in rainfall variability.
Thus, climate change is projected to have significant adverse impact on monsoon
rainfall variability in all the three states.
8.2. Implications for Developing Climate Resilient Infrastructure under MGNREGA
MGNREGA works are largely related to natural resources such as cropland, grazing land,
forests and water resources. Majority of the MGNREGA works are related to land and water
conservation and management. The new “Mission Water Conservation” guidelines focus on
integrated natural resource management approach. The mission calls for a paradigm shift
from promoting “relief measures” to integrated natural resource management approach in
implementing MGNREGA. This calls for adoption of climate resilient infrastructure approach
to natural resource management under MGNREGA. Under MGNREGA, 100 works out of 153
works relate to NRM, and further, 71 relate to water. Some of the NRM related activities
which require climate resilience infrastructure are given below:
Check Dam, Earthern Dam, Farm Pond, Feeder Channel, Mini Percolation tank, Stop
Dam, Sub Surface Dam, Sunken Pond, Underground Dyke, Boulder Check, Water
absorption Trench, Box Trenches, Continuous Contour Trench, Contour Bunds, Earthen
Bunding, Earthen Gully Plug, Staggered Trench, Dugwell, Farm Pond Construction of
42
Current Climate Variability Assessment, Climate Change Projections and Identification of “Climate Hotspot Blocks” for ICRG Blocks under MGNREGA
Infrastructure for Climate Resilient Growth in India (ICRG) Programme
canal, Distributory and Minor, Lift Irrigation, Community Well for Irrigation, Desilting,
Renovation, Strengthening of Embankment, Belt Vegetation, Afforestation, Eco
Restoration of Forest, Forest Protection, Grass Land Development and Silvipasture,
Nursery Raising, Plantation in Government Premises, Plantation, Earthen Bunding, Land
Development, Development of waste land, Land Levelling, reclamation of Land, Recharge
pits, etc.
A study conducted by Indian Institute of Science in four states has shown that MGNREGA
works related to water and land development have contributed to generation of
environmental benefits and natural resource conservation - ground water recharge,
increased water availability for irrigation, increased soil fertility, reduction in soil erosion,
and improved tree cover. These environmental benefits derived from MGNREGA works have
in turn contributed to reducing the agricultural and livelihood vulnerability, thus helping to
cope with current climate risks and potentially build long-term resilience to projected
climate change. Thus, a large poverty alleviation programme such as the MGNREGA is
demonstrated to have the potential to deliver resilience or adaptation benefits to current
vulnerability.
The MGNREGA is the largest rural development programme implemented in India with a
large investment in works related to soil and water conservation, land development, and
afforestation, all of which address the causes of degradation of natural resources. Such
works lead to the creation of durable assets. MGNREGA works have led to enhanced
productivity and regeneration of the natural resource base, further strengthening its
potential for generating resilience benefits. In addition, soil conservation, fodder
development, afforestation, and drought proofing works have sequestered carbon, thus
mitigating climate change.
Potential could exist to further enhance resilience to long-term climate change, through
packaging of MGNREGA as a programme to build long-term resilience to future climate
change, in addition to reducing vulnerability to current climate risks. In this context, the
“Infrastructure for Climate Resilient Growth (ICRG) – a technical assistance programme
supported by Department for International Development (DFID) seeks to facilitate more
effective investment in rural infrastructure under MGNREGA to support rural economic
growth and improve the climate resilience of vulnerable communities. This is envisaged
through improving the quality of the physical assets under MGNREGA in selected 103 blocks
of three states namely, Bihar, Chhattisgarh and Odisha in India. These blocks are among the
2,500 blocks that the Government of India has chosen for focussed implementation of
MGNREGA works.
The identified hotspots of rainfall variability could be the priority blocks wherein planning,
designing and implementation of MGNREGA works take into consideration the current
climate variability and long-term climate change risks.
8.2.1. Implications for ICRG
In India, programmes such as MGNREGA rarely use historical rainfall trends, flood or drought
occurrence information and data in designing the water storage, transport, land
management, etc., structures. Some of the potential reasons for not utilising the historical
rainfall information are as follows:
43
Current Climate Variability Assessment, Climate Change Projections and Identification of “Climate Hotspot Blocks” for ICRG Blocks under MGNREGA
Infrastructure for Climate Resilient Growth in India (ICRG) Programme
i. Rainfall distribution or intensity data for a given village or even block may not be
available to the staff of the Rural Development Department or the Zilla Parishad, to
assist them in designing the MGNREGA structures.
ii. Infact, in states such as Bihar, with very few rain guage stations, rainfall data at the block
level may not exist.
iii. In some cases, even if historical climate data are available at IMD or IITM at district or
block level, the data may not be accessible to the staff of Rural Development
Department or Zilla Parishad, who may have to design the structures under MGNREGA.
iv. Even if data is accessible - a rarity, the staff at the district or block level may not have
computing facility or technical capacity to analyse large volumes of daily data for 20 or
30 years.
Thus, currently it is a challenge to design the land and water related structures based on
historical climate variables at village or block level under the current climate scenario.
However, under the ICRG project, historical climate data could be provided to the identified
hotspot blocks, along with training of junior engineers and other staff.
8.2.2. Designing Climate Resilient MGNREGA Infrastructure
The challenges in using current and historical climate data in designing MGNREGA land-
water structures were presented in previous section. In this section the challenges and
options in utilising the climate change projections data are presented.
i. Climate change projections are at a scale of 50 km X 50 km, which is the finest scale
available from CORDEX. This scale will limit the application of projected climate variables
at village or Panchayat level for designing the MGNREGA structures.
ii. GCM and CORDEX projections are for a 30-year period of 2020-2050 and the projected
changes occur on decadal scale, which is inadequate for planning the structures under
MGNREGA for immediate implementation.
iii. Lack of simple manuals and toolkits for utilizing historical and climate change projections
in designing land-water structures or assets at village, block or even district level under
MGNREGA.
iv. Lack of technical capacity in utilizing the data on climate variables in designing the land-
water structures.
v. Lack of computer skills and computing facilities at the panchayat, block and even at
district level.
Suggested options for ICRG
i. Develop simple toolkits and manuals for utilizing historical and climate change
projections in designing land-water structures at a decentralized scale under MGNREGA.
ii. Select pilot hotspot blocks based on rainfall variability (historical) and projected climate
change rainfall variability.
iii. Prepare data packages of historical climate trends and climate change projections for
the pilot hotspot blocks.
44
Current Climate Variability Assessment, Climate Change Projections and Identification of “Climate Hotspot Blocks” for ICRG Blocks under MGNREGA
Infrastructure for Climate Resilient Growth in India (ICRG) Programme
iv. Conduct training programmes to all technical staff at block and district level in utilising
historical and climate change projections data in designing MGNREGA structures.
v. Organize and provide technical back up support to the technical staff of the pilot blocks
under the MGNREGA programme.
vi. Monitor, evaluate and learn lessons for large-scale dissemination of climate resilient
planning of MGNREGA works.
45
Current Climate Variability Assessment, Climate Change Projections and Identification of “Climate Hotspot Blocks” for ICRG Blocks under MGNREGA
Infrastructure for Climate Resilient Growth in India (ICRG) Programme
REFERENCES
1. Pai D.S., Latha Sridhar, Rajeevan M., Sreejith O.P., Satbhai N.S. and Mukhopadhyay B., 2014:
Development of a new high spatial resolution (0.25° X 0.25°) Long period (1901-2010) daily
gridded rainfall data set over India and its comparison with existing data sets over the region;
MAUSAM, 65, 1 (January 2014), pp1-18.
2. A K Srivastava, M Rajeevan and S R Kshirsagar. Development of a High Resolution Daily Gridded
Temperature Data Set (1969-2005) for the Indian Region
3. Lala I.P. Ray, P.K. Bora, A.K. Singh, Ram Singh, N.J. Singh and S.M. Feroze (2013). Meteorological
drought occurrences at Shillong, Meghalaya, Keanean Journal of Science, Vol 2, 31-36.
4. John Weyant, Christian Azar, Mikiko Kainuma, Jiang Kejun, Nebojsa Nakicenovic, P.R. Shukla,
Emilio La Rovere and Gary Yohe (2009). Report of 2.6 Versus 2.9 Watts/m2 RCPP Evaluation
Panel (PDF). Geneva, Switzerland: IPCC Secretariat.
5. Collins, M., et al.: Section 12.3.1.3 The New Concentration Driven RCP Scenarios, and their
Extensions, in: Chapter 12: Long-term Climate Change: Projections, Commitments and
Irreversibility (archived 16 July 2014), in: IPCC AR5 WG1 2013, pp. 1045–1047.
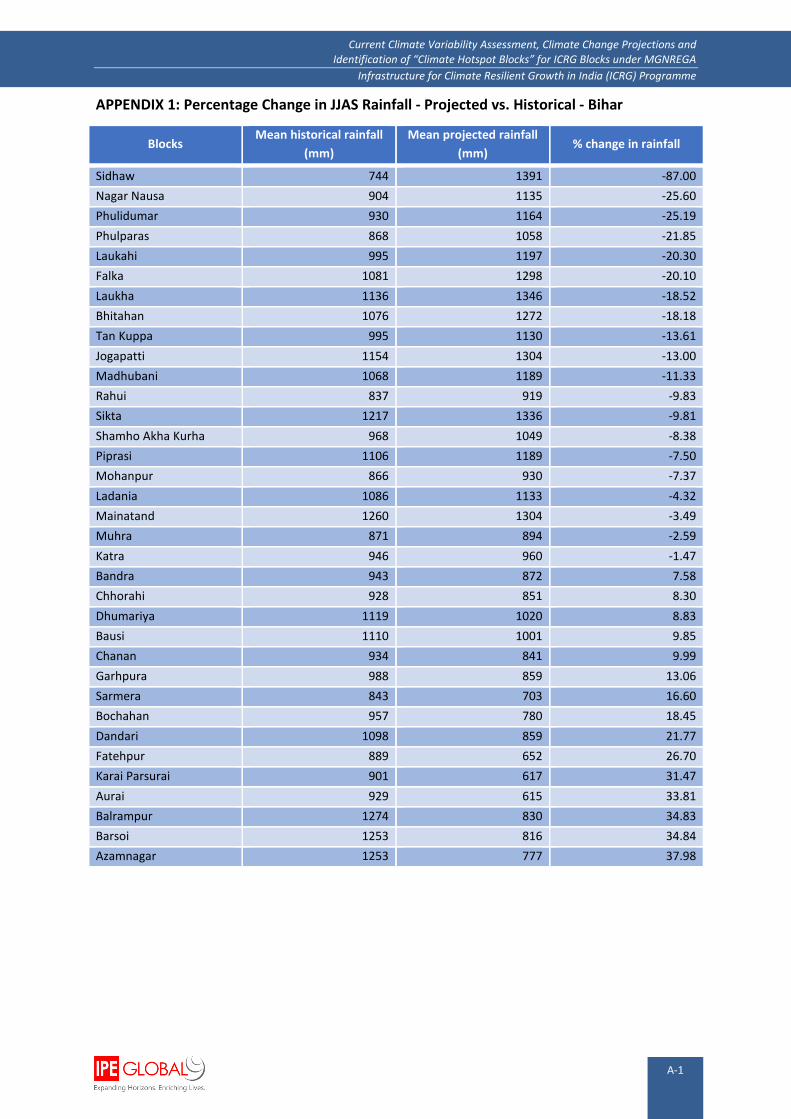
A-1
Current Climate Variability Assessment, Climate Change Projections and Identification of “Climate Hotspot Blocks” for ICRG Blocks under MGNREGA
Infrastructure for Climate Resilient Growth in India (ICRG) Programme
APPENDIX 1: Percentage Change in JJAS Rainfall - Projected vs. Historical - Bihar
Blocks Mean historical rainfall
(mm)
Mean projected rainfall
(mm) % change in rainfall
Sidhaw 744 1391 -87.00
Nagar Nausa 904 1135 -25.60
Phulidumar 930 1164 -25.19
Phulparas 868 1058 -21.85
Laukahi 995 1197 -20.30
Falka 1081 1298 -20.10
Laukha 1136 1346 -18.52
Bhitahan 1076 1272 -18.18
Tan Kuppa 995 1130 -13.61
Jogapatti 1154 1304 -13.00
Madhubani 1068 1189 -11.33
Rahui 837 919 -9.83
Sikta 1217 1336 -9.81
Shamho Akha Kurha 968 1049 -8.38
Piprasi 1106 1189 -7.50
Mohanpur 866 930 -7.37
Ladania 1086 1133 -4.32
Mainatand 1260 1304 -3.49
Muhra 871 894 -2.59
Katra 946 960 -1.47
Bandra 943 872 7.58
Chhorahi 928 851 8.30
Dhumariya 1119 1020 8.83
Bausi 1110 1001 9.85
Chanan 934 841 9.99
Garhpura 988 859 13.06
Sarmera 843 703 16.60
Bochahan 957 780 18.45
Dandari 1098 859 21.77
Fatehpur 889 652 26.70
Karai Parsurai 901 617 31.47
Aurai 929 615 33.81
Balrampur 1274 830 34.83
Barsoi 1253 816 34.84
Azamnagar 1253 777 37.98

A-2
Current Climate Variability Assessment, Climate Change Projections and Identification of “Climate Hotspot Blocks” for ICRG Blocks under MGNREGA
Infrastructure for Climate Resilient Growth in India (ICRG) Programme
APPENDIX 2: Percentage Change in JJAS Rainfall - Projected vs. Historical - Chhattisgarh
Blocks Mean historical rainfall
(mm)
Mean projected rainfall
(mm) % change in rainfall
Bhaiyathan 1107 883 -25.42
Pathariya 979 796 -23.01
Pratappur 1131 930 -21.61
Kunkuri 1251 1076 -16.27
Pali 1206 1038 -16.16
Batouli 1206 1050 -14.87
Sitapur 1223 1075 -13.73
Bagicha 1178 1043 -12.97
Premnagar 1147 1031 -11.21
Takhatpur 1163 1046 -11.20
Kartala 1228 1105 -11.14
Lundra 1162 1050 -10.68
Ramanujnagar 1136 1031 -10.15
Manora 1147 1046 -9.65
Masturi 1116 1051 -6.16
Lormi 1047 1028 -1.86
Bilha 1064 1046 -1.73
Mungeli 1048 1041 -0.72
Pandariya 992 1017 2.50
poudi-Uprora 1246 1299 4.07
Duldula 1241 1326 6.41
Kawardha 953 1024 6.97
Kansabel 1019 1097 7.09
Bharatpur 1052 1134 7.22
Sonhat 1100 1195 7.94
Farsabahar 1230 1339 8.14
Marwahi 1116 1236 9.69
Sahaspur Lohara 929 1033 10.09
Bodla 927 1099 15.68
Kota 1067 1283 16.84

A-3
Current Climate Variability Assessment, Climate Change Projections and Identification of “Climate Hotspot Blocks” for ICRG Blocks under MGNREGA
Infrastructure for Climate Resilient Growth in India (ICRG) Programme
APPENDIX 3: Percentage Change in JJAS Rainfall - Projected vs. Historical - Odisha
Blocks Mean historical rainfall
(mm)
Mean projected rainfall
(mm) % change in rainfall
Bishamakatak 935 726 -28.86
Kundura 1331 1051 -26.61
Papadahandi 1497 1230 -21.72
Gurundia 1304 1163 -12.10
Jharigaon 1211 1089 -11.20
Lanjigarh 1189 1096 -8.51
Mathili 1303 1201 -8.50
Balisankar 1195 1102 -8.44
Nuapada 1134 1060 -6.99
Phiringia 1159 1089 -6.42
Kotpad 1311 1251 -4.77
Lahunipara 1234 1188 -3.85
Thakurmunda 1246 1213 -2.69
Komna 1076 1055 -1.96
Kokasara 1477 1461 -1.07
Kotagarh 1038 1029 -0.89
Ghatgaon 1183 1181 -0.19
Gaisilet 1320 1318 -0.17
Boipariguda 1366 1380 1.01
Malkangiri 1082 1095 1.20
Jharbandha 1051 1068 1.62
Kalyanasingpur 1041 1067 2.47
Tumudibandha 1103 1135 2.85
Dabugaon 1239 1277 2.95
Madanpur_Rampur 1237 1282 3.51
Mohana 864 897 3.72
Paikamal 1093 1143 4.40
Telkoi 1162 1222 4.94
Rayagad 761 819 7.03
R.Udaygiri 800 869 7.89
Jashipur 1219 1338 8.88
Kaptipada 1227 1411 13.02
Bisoi 1142 1338 14.63
Daringbadi 994 1259 21.04
Pottasing 885 1155 23.40