Current Burden of Cardiac Arrest in the United States .../media/Files/Report Files/2015/ROC… ·...
48
Current Burden of Cardiac Arrest in the United States: Report from the Resuscitation Outcomes Consortium Mohamud R. Daya MD, MS Robert H. Schmicker MS Susanne May PhD Laurie J. Morrison MD, MSc Commissioned by the Institute of Medicine Committee on Treatment of Cardiac Arrest: Current Status and Future Directions *The responsibility for the content of this report rests with the authors and does not necessarily represent the views of the Institute of Medicine or its committees and convening bodies
Transcript of Current Burden of Cardiac Arrest in the United States .../media/Files/Report Files/2015/ROC… ·...

Current Burden of Cardiac Arrest in the United States: Report from the Resuscitation
Outcomes Consortium
Mohamud R. Daya MD, MS Robert H. Schmicker MS
Susanne May PhD Laurie J. Morrison MD, MSc
Commissioned by the Institute of Medicine Committee on Treatment of Cardiac Arrest: Current Status and Future Directions
*The responsibility for the content of this report rests with the authors and does not necessarily represent the views of the Institute of Medicine or its committees
and convening bodies

Current Burden of Cardiac Arrest in the United States: Report from the Resuscitation Outcomes Consortium
Authors Mohamud R. Daya MS, MS1, Robert H. Schmicker MS2, Susanne May PhD2, Laurie J. Morrison MD, MSc3 for the Resuscitation Outcomes Consortium Investigators. 1. Department of Emergency Medicine, Oregon Health & Science University, Portland, OR 2. University of Washington Clinical Trial Center, Seattle, WA 3. University of Toronto, Toronto, ON, Canada
FUNDING
The ROC is supported by a series of cooperative agreements to nine regional clinical centers and
one Data Coordinating Center (5U01 HL077863-University of Washington Data Coordinating
Center, HL077866-Medical College of Wisconsin, HL077867-University of Washington,
HL077871-University of Pittsburgh, HL077872-St. Michael’s Hospital, HL077873-Oregon
Health and Science University, HL077881-University of Alabama at Birmingham, HL077885-
Ottawa Hospital Research Institute, HL077887-University of Texas SW Medical Center/Dallas,
HL077908-University of California San Diego) from the National Heart, Lung and Blood
Institute in partnership with the National Institute of Neurological Disorders and Stroke, U.S.
Army Medical Research & Material Command, The Canadian Institutes of Health Research
(CIHR) - Institute of Circulatory and Respiratory Health, Defence Research and Development
Canada and the Heart, Stroke Foundation of Canada and the American Heart Association. The
content is solely the responsibility of the authors and does not necessarily represent the official
views of the National Heart, Lung and Blood Institute or the National Institutes of Health

1
Current Burden of Cardiac Arrest in the United States: Report from the Resuscitation Outcomes Consortium
Introduction:
The Resuscitation Outcomes Consortium (ROC) is a collaboration of 10 regional sites in the United States and Canada managed through a single Data Coordinating Center. Formed in 2004, the ROC’s primary goals are to conduct out-of-hospital randomized clinical trials (RCTs) in patients with life threatening trauma and cardiac arrest. The ROC is funded by the National Heart, Lung and Blood Institute in partnership with the U.S. Army Medical Research & Materiel Command, The Canadian Institutes of Health Research - Institute of Circulatory and Respiratory Health, Defence Research and Development Canada, the Heart and Stroke Foundation of Canada and the American Heart Association.
To assist with the planning and conduct of clinical trials as well as to assess secular trends, investigators developed a population based data set of cardiac arrest (ROC Epistry). The Institute of Medicine commissioned a report on out-of-hospital cardiac arrest (OHCA) from the ROC investigators to assess the public health burden of cardiac arrest in the United States and identify opportunities for improvement. The objectives of the report were to provide: 1) annual OHCA incidence, 2) estimates of outcomes (survival to discharge rates, and neurological/functional status) 3) population demographics including disease etiology, bystander resuscitation efforts and EMS system factors 4) estimates of potential number of lives saved if the highest observed survival rates could be achieved throughout the US.
Methods:
ROC Sites and Agencies (EMS services – Fire or Paramedic)
When ROC Epistry began in December 2005, nearly 250 agencies were participating (1). Currently there are 120 agencies participating in ROC Epistry; of these 67 are from the United States and 53 from Canada. The reduction in agencies may be attributed to the study monitoring committee requirement to meet performance benchmarks prior to enrolling patients in clinical trials. Any service not meeting these eligibility requirements discontinued participation in ROC. To allow for an unbiased analysis over time, cases from agencies that ended their participation in ROC from 2005 to 2011 have been excluded from this analysis. In addition, sites that could not provide consistent data since 2005 e.g. San Diego have been excluded from this analysis. Satellite sites such as Fort Worth that were subsequently recruited for the trauma and cardiac RCTs contributed data were not included in this analysis as they did not contribute data during the early years.
Population
Determining the true burden of disease is important to communities as they engage key stakeholders to improve survival from OHCA. Of the 2 large OHCA registries in North America, only the ROC Epistry collects incidence data since it captures data on all events (untreated and treated) for which an organized EMS response is requested. Since ROC has had a stable footprint in participating communities, the covered population can be estimated based on the census data allowing incidence rates to be calculated. Based on 2000 census data, the population served by the 120 ROC agencies which have consistently provided data since 2006 is 18 million of which 7.8 million resides in the US and remainder

2
in Canada. Except where explicitly stated all data shown include pediatric and adult OHCA. Due to time constraints the pediatric data for Canada is not reported separately. Race and ethnicity data were available for only the US population and the reliability of these data are questionable since these were collected from the EMS documentation and not independently verified and up to 20% of race and ethnicity data were missing. Inclusion Criteria The ROC Epistry by design is a prospective database of consecutive OHCA patients for whom there was an organized EMS response by participating agencies and includes treated and untreated cases. Minimal data were recorded for untreated cases. Treated cases were defined as an OHCA patient who received chest compressions by EMS or any defibrillation; including use of a public automated external defibrillator (AED). (2) Data Definitions The original data set was developed by an interdisciplinary ROC committee using existing EMS reporting structures and OHCA templates and was comprised of mandatory and optional variables. The scope of ROC Epistry data collection has been revised twice since its inception and all variables became mandatory including CPR process data taking effect with the first update. The identification of who performed bystander CPR and location of discharge were added in 2011. Epistry data collection began December 1, 2005 Epistry data collection was reviewed and approved by the relevant institutional review boards (IRBs) and/or research ethics boards (REBs) at all participating institutions. Minimal data are recorded for untreated cases. The ROC Epistry-Cardiac Arrest methods paper provided all the data elements, and definitions, reference citations and variable options for version one as an online appendix. (2) Unique to this data set was the close alignment with the Utstein reporting requirements for core elements. (3) In particular, all cardiac arrests were classified as obvious cause or no obvious cause based on paramedic documentation of etiology and contributing factors and when transported to hospital as verified by in-hospital documentation. Obvious cause refers to etiologies such as trauma, drowning, hanging, asphyxia by inhaled gases, mechanical strangulation or hanging and drug induced. No obvious cause events are presumed to be cardiac in origin. Unique Aspects of the Data
Outcome and CPR Metrics Embargo
Beginning in June 2011, some ROC sites began enrolling patients in two large cardiac arrest clinical trials (NCT01401647 ROC ALPs and NCT01372748 ROC CCC) which will complete enrolment in late 2015. (4) Most sites started enrolment into the trials in the end of 2011 or in the beginning of 2012. Outcome data (survival to discharge and survival to discharge with favorable functional neurological status defined as Modified Rankin ≤ 3) and CPR Metrics data for patients enrolled in these two trials are currently embargoed. As such, outcomes and CPR process data are presented for all cases until the end of 2011 (six year time frame) or the date that an agency started enrolling in either clinical trial, whichever came first. Patient characteristics, prehospital interventions and incidence data are reported for all cases through December 31, 2013 (eight year time frame).
Incidence Calculations

3
Out-of-hospital cardiac arrest incidence rates were calculated using all cardiac arrests that occurred in 2013 in areas with complete geographic coverage by the participating agencies. United States incidence rates were calculated with respect to the 2010 US Census while Canadian incidence rates were calculated with respect to 2006 Statistics Canada. Since census tracts only cover the more urban areas of Canada, only episodes within the site’s geographic area that are located inside a census tract were included. Incidence rates were calculated with respect to the location of the cardiac arrest rather than the location of the patient’s home residence and presented in terms of 100,000 person-years.
Trend analysis
We focused the time trend analysis on the continuously participating agencies at the 6 US sites (Alabama, Dallas, Milwaukee, Pittsburgh, Portland, Seattle-King County). Time trend analyses were also provided for two separate subgroups – no obvious cause and pediatrics (age <18 years).
CPR Process Data
Over the last 10 years, the quality of CPR has been determined to be an important variable affecting outcomes in resuscitation trials. (5) As a result, the ROC sites measured and reported CPR quality metrics during all clinical trials. Several CPR quality metrics are reported by sites and the performance is monitored closely by the Data Coordinating Center and the ROC Study Monitoring Committee. The CPR Process data that were actively monitored include the rate of availability of CPR process measures on uploaded defibrillation files, CPR fraction (defined as the proportion of each minute that a victim receives chest compressions), Compression Rate, Compression Depth, Pre-shock and Post-shock pause. These CPR process measures were extracted and measured from the data files downloaded from monitor-defibrillator devices used at ROC sites. The majority of these files come from the 3 device companies (Philips, PhysioControl, and Zoll) which differ slightly in their measurement capabilities. For example, CPR depth can only be measured by Philips and Zoll since this requires the use of accelerometer technology. Since CPR process data are very detailed and require manual processing/review, ROC sites are required to report this information for only the first ten minutes of a resuscitation event or until ROSC is achieved in the case of short resuscitations.
In-hospital post arrest care
In recent years, the importance of a post-resuscitation bundle of care that includes the use of Targeted Temperature Management (TTM) as well as early coronary artery catheterization for selected cases (e.g. initial rhythm of VT/VF or post-ROSC ECG with STEMI) has been shown to improve outcomes following successful resuscitation from OHCA. The ROC Epistry actively collects these data and reports performance in terms of compliance with AHA guidelines at the level of the hospital.
Results:
Descriptive data on patient, event and EMS response characteristics for all cause adult and pediatric OHCA for 2013
The nine ROC sites collectively reported an EMS response to 20,392 (9,863 in the US and 10,529 in Canada) cardiac arrests during 2013. Of these, 10,780 (47.5%) had resuscitation attempted by EMS personnel (49% in the US, 46.1% in Canada). (Table 1a) The data reported in this document are for both US and Canadian data combined unless otherwise stated as US data only or a comparison of US versus Canadian data. The data in the Excel spread sheet also include Canada specific tables.

4
Untreated
Untreated rates vary considerably across the US ROC sites with a low of 32.4% in Alabama to 62.7% in Portland. When to initiate resuscitation is not governed by a uniform validated rule for EMS, thus it can be governed by legislation or by local policy or left to the discretion of the paramedic. In Canada, untreated rates are governed by provincial legislation and these rates are consistent by province. Untreated cardiac arrests were older (mean age of 65.6 in the US and 67.6 in Canada) and more frequently male (63.5% in the US and 76.3% in Canada) in both countries.
Treated
In terms of patient characteristics, the mean age for treated cases in the US was 62.1 years, while in Canada the resuscitated population was slightly older with a mean of 66.6 years. In both countries, males represented the majority of the treated cases accounting for 61.0% of cases in the US and 65.2% in Canada. In 2013, the race categorization for treated patients in the US was 2,612 white (51.9%), 1,448 non-white (28.8%) and 971 (19.3%) unknown. Ethnicity categorization in the US was non-Hispanic for 3,796 (75.5%), Hispanic 264 (5%) and unknown for 971 (19.3%) individuals.
In terms of event characteristics, an obvious cause of arrest was declared in 7.8% of treated cases in both the US (n= 392) and Canada (n = 445). Rates of reporting obvious cause of arrest varied considerably across all ROC sites from a low of 2.9% to a high of 13.7%. Overall, 92.2% (n = 9,870 [4,638 US, 5,232 Canada]) of the treated cases had no obvious etiology. With regards to witness status, 1,291 (12.1%) of cases were EMS witnessed, 3,840 (35.9%) were bystander witnessed, 5,370 (50.2%) were unwitnessed and in 197 (1.8%), the status was unknown in both countries combined. With respect to the first recorded cardiac arrest rhythm, 2,144 (20%) were in pulseless VT/VF, 2,580 (24.1%) in PEA and 5,189 (48.5%) in Asystole. Rhythm was also classified as No Shock/No Strip for 476 (4.4% of cases) and could not be determined in 93 (0.9%) of cases. In terms of event response and actions, 4,490 (41.9%) victims had CPR attempted by a bystander and this was slightly higher in the US (43.1%) compared to Canada (40.9%). In 3,254 (72.5%) instances, the individual attempting CPR was a layperson, in 403 (9%) cases CPR was attempted by police and in 894 (19.9%) cases, a healthcare worker initiated CPR. Police and healthcare workers more frequently attempted CPR in the US compared to Canada. A public AED was applied by a bystander in only 207 (1.9%) of treated arrests in 2013.
In terms of EMS characteristics, 1,541 (14.4%) patients arrested in public places while the majority 7,878 (73.6%) occurred at home and 1,039 (9.7%) in residential facilities in both countries combined. Although the proportion of public place witnessed arrests were similar in the US and Canada, residential facility arrests were more common in the US compared to Canada (13.4% vs. 6.4%). Home arrests were more common in Canada (77%) compared to the US (69.6%). Overall for the whole consortium BLS first response occurred in 6,448 (60.2%) and ALS was first on scene in 4,250 (39.7%) cases. BLS first response was much more common (74.4%) in Canada in comparison to the US where ALS often arrived first (55.8%) in 2013. The mean response time from dispatch to the scene was 5.8 minutes (5.1 minutes in the US vs. 6.4 minutes in Canada). Prehospital hypothermia was initiated in 257 (2.4%) of cases and this occurred more frequently in the US (3.9%) than Canada (1.1%). CPR was initiated and subsequently stopped on the basis of written DNR orders in 290 (2.7%) cases and this proportion was similar in both countries.
Table 1b summarizes the patient, event and EMS characteristics for the cases identified as no obvious cause by EMS. Although the case numbers are less, overall characteristics are similar to what has been summarized above for Table 1a.

5
Trend Analysis on patient, event and EMS characteristics for all cause adult and pediatric OHCA from 2006 to 2013 for 6 US ROC sites
Table 1c summarizes the trends in patient, event and EMS characteristics for the agencies of the 6 US ROC sites that contributed data continuously from 2006 to 2013. During this time frame, the six sites collectively reported an EMS response to 66,964 cardiac arrests. Resuscitation was attempted for 34,161 cases (51%) and this proportion has stayed stable over time. The trend data are presented for all patients and then separately for patients without obvious cause of the cardiac arrest and then for pediatric patients defined as age ≤ 18.
The mean age and proportion male trends have remained consistent during these 8 years. With regards to race and ethnicity, most arrest victims are white (40.5%) and non-Hispanic (59.2%). The proportion that are categorized as white and non-Hispanic has increased over time likely due to a decrease in the proportion with unknown ethnicity. The proportion of patients with Hispanic ethnicity has increased very slightly over time which may be related to concurrent population changes. As noted previously, these data are gathered from the EMS reports and the previously noted caveats regarding validity must be considered when interpreting these data.
Of the treated cases at the US sites, 31,530 (92.3%) have no obvious cause while 2,588 (7.6%) have a clear cause (e.g. drowning, hanging, asphyxiation, overdose). The cause of arrest data have stabilized around 8% for obvious cause over time reflecting improvements in quality and consistency of data abstraction although there is site to site variability with respect to these data. With regards to event witness status, the proportion that is EMS witnessed increased from 8.8% in 2006 to 12.3% in 2013. Bystander witnessed arrests have remained stable ranging from 33.2% to 36.7% with a mean of 34.5%. The proportion of unwitnessed cases has increased over time from 40.8% in 2006 to 50.5% in 2013 likely due to a decrease in the number of patients with unknown witness status. With respect to the initial cardiac arrest rhythm, the percentage of cases with VT/VF has decreased from a high of 22.7% in 2006 to 19.3% in 2013 while the number of PEA cases has increased from 876 (22.5%) in 2006 to 1,236 (24.6%) in 2013. The percentage of patients in Asystole has increased from 41.7% in 2006 to 49.9% in 2013 likely due to a concurrent decrease in the percentage of cases reported as cannot determine. Bystander CPR trends are encouraging showing an increase of nearly 10% from 33.9% in 2006 to 43.1% in 2013. Beginning in 2011, more detailed information on the individuals providing CPR prior to EMS arrival have been collected and although the majority of bystanders are still either laypersons (66%) or healthcare workers (27.3%), the proportion of cases in which police have provided CPR before EMS has increased every year (7.7% in 2011, 8.4% in 2012, 10.6% in 2013). Bystander AED application has remained low and unchanged at around 2% of all arrests over time.
The majority of arrests occur in a home setting (69.7%) with 13.9% in public locations and 12.6% in residential care facilities and these rates are unchanged over time. With regards to EMS response, the mean time from dispatch to arrival at the scene has remained very consistent around 5.2 minutes. At these US sites, BLS has generally arrived before ALS from 2006 up until 2012 although this trend pattern reversed in 2013. If confirmed and persistent, this may reflect the impact from increased adoption of ALS engines by first responding fire agencies in the US. Resuscitation was initiated and then subsequently halted due to the presence of written do not resuscitate orders in 2.9% of cases and this percentage has remained consistent over time. The use of prehospital hypothermia (intra or post ROSC) consistently increased from 2006 to 2012 but decreased in 2013. Possible factors for this include the completion and publication of 2 trials, one from Australia and one from the US that failed to demonstrate efficacy of prehospital post ROSC cooling with IV chilled crystalloid fluids. (6, 7)

6
Table 1d summarizes the patient, event and EMS trend characteristics for the cases identified as having no obvious cause by EMS. Although the case numbers are less, overall trend characteristics are consistent to what has been summarized for Table 1c.
Patient, event and EMS response characteristics and trend over time for all cause pediatric OHCA from 2006 to 2013 for 6 US sites.
Table 1e summarizes the overall data pertaining to patient, event and EMS characteristics for pediatric cardiac arrest defined as age ≤ 18 at the 6 US ROC sites from 2006 to 2013. During this 8 year period there were 1,550 pediatric cardiac arrests in the 6 US ROC sites representing 2.3% of all arrests (66,964). Resuscitation was attempted in 1,239 (79.8%) which is higher than the attempted resuscitation rate (51%) for adults during the same time period. The mean age for treated arrests was 0.7 years and the median age was 4.3 years due to the presence of a large number of Sudden Infant Death Syndrome (SIDS) cases under the age of 1. Untreated pediatric arrests (20.2%) were older in terms of mean (1.6 years) and median (6.3 years) age. Males accounted for 59.1% of treated cases. The race profile for pediatric arrests was 30.4% white, 30.6% non-white and unknown in 39%. With regards to ethnicity, 11.2% were Hispanic, 49.7% were non-Hispanic and status was unknown in 39% of cases. An obvious cause of arrest was more common in the pediatric population (26.1% of cases compared to approximately 8% in adults) consistent with the higher incidence of primary respiratory arrests in children. Pediatric arrests are primarily unwitnessed (64.6%) events and the most common initial recorded EMS rhythm is Asystole (68.9%). Bystander CPR was attempted in 50.4% of these arrests most often by lay persons (78.8%) followed by police (17.6%) and healthcare workers (6.9%). Bystander AED application was very rare (11 cases in 8 years). The majority of pediatric arrests occurred at home (86.7%) with only 9.8% occurring in public locations. Mean EMS response time was 5.1 minutes and the BLS was on scene slightly more often than ALS. Once initiated, resuscitation was rarely halted due to written DNR orders and prehospital hypothermia (intra-arrest or post ROSC) was extremely uncommon in this population.
With respect to trends in pediatric cardiac arrests between 2006 and 2013 for the 6 US sites (Table 1e), the mean and median age of treated patients has remained consistent over time as has the percentage treated that is male and witnessed status. The trend data on race and ethnicity as well as obvious cause show more variability over time as does the percentage of cases that have resuscitation attempted. Initial EMS rhythm shows an increased in VT/VF and PEA over time while Asystole has remained stable. These trends can largely be explained by the drop in the “cannot determine” category which decreased from 13.8% in 2006 to 3.9%. Bystander CPR and AED application rates have remained unchanged over time as has location of arrest and EMS response time and mode (BLS vs. ALS first on scene).
Canadian comparison and trend analysis on patients, event and EMS response characteristics for adult and pediatric all cause OHCA and no obvious cause OHCA
Table 1f and Table 1g summarize the trends for all cases and as well as with those with no obvious cause over time for the 3 Canadian ROC sites. Table 1h and Table 1i summarize the trend data for the entire consortium (US and Canada) for all cause adult and pediatric OHCA as well as those with no obvious cause OHCA. Since the focus of this report is on the trends within the US ROC sites, these data are being provided primarily for completeness.
Mean Incidence based on 2013 US data
The ROC Epistry provides a mean overall incidence (untreated and treated) estimate for 2013 of 108.7 cases per 100,000 person years overall with US sites reporting a mean incidence of 124.8 compared to

7
96.6 in Canada. Within the US sites incidence variation was noted in an earlier paper by the ROC investigators and this variation has continued over time. (8) In 2013 the mean overall incidence (untreated and treated) of OHCA in the six US ROC sites were as follows: Alabama 106.0, Dallas- 130.0, Milwaukee 191.3, Pittsburgh 151.2, Portland 75.2 and Seattle-King County 122.4. In 2013 the mean overall incidence of treated OHCA in the six US ROC sites were as follows: Alabama 32.5, Dallas 74.6, Milwaukee 91.9, Pittsburgh 69.4, Portland 49.7 and Seattle-King County 63.0. The overall mean incidence of EMS treated cases in 2013 in the six US ROC sites was 63.8 which is similar to the median incidence rate of 52.1 previously reported for all ROC sites in 2008 (8). Incidence calculations are limited by imprecise measurements of the population at risk since individuals travel in and out of communities over time. Additional incidence data based on gender, age, race, ethnicity, initial rhythm and witnessed status are detailed in Table 2.
Overall Outcomes for all cause adult and pediatric OHCA for 2011
In 2011, the overall survival for EMS assessed and treated OHCA were 5.5% and 10.8% respectively.
Table 3a Of the 1,017 survivors, 496 (48.8%) were discharged home. Survival was highest (15.2%) in the 40-64 year age group and lowest (7.7%) in those > 65 years. There was a gender difference in survival with men (11.9%) more likely to survive than women (9%). There was also a race difference in survival with whites (12.5%) more likely to survive then nonwhites (9.2%) but this finding must be interpreted with care since race was unknown for all Canadian patients and unknown in 19.3% of US cases. Survival was highest with an initial EMS rhythm of VT/VF (29.7%) followed by PEA (9.6%) and Asystole (1.7%). Witnessed arrests were also more much more likely to survive (17.3%) compared to unwitnessed events (4.5%). When initial rhythm and witnessed status are combined, survival from highest to lowest was as follows: witnessed VT/VF 34.8%, unwitnessed VT/VF 16.6%, witnessed and unwitnessed PEA were about the same with 9.6% and 9.7% respectively, witnessed Asystole 4% and unwitnessed Asystole 0.8%. Survival was also more common when bystanders initiated CPR (12.9%) compared to EMS initiated CPR (7.2%). ROC reports functional survival in terms of the Modified Rankin Score (MRS) in which a score of ≤ 3 is considered favorable. For the 732 cases in which MRS data were available, a favorable functional survival was reported in 563 (76.9% of those who survived to hospital discharge). Favorable functional survival was higher in Canada (86.3%) than the US (69.5%). Favorable functional survival was also more common with an initial rhythm of VT/VF or PEA when compared to Asystole. Favorable functional survival was also more common between the ages of 18 and 64 years and in males compared to females.
Table 3b presents the same 2011 data with the exclusion of cases with an obvious cause of arrests. Findings remain consistent with the findings in Table 3a.
Trend Analysis on outcomes for all cause adult and pediatric OHCA from 2006 to 2011 for 6 US ROC Sites
Table 3c summarizes the trends in cardiac arrest outcomes for the 6 US ROC sites that have contributed data continuously from 2006 to 2011. For all cases, survival increased from 9.9% in 2006 to 11.3% in 2011. The 2011 data suggest that nearly one-half of patients discharged alive returned to their homes. Survival differences between men and women have stayed consistent over time as has survival by age group with the highest survival in the 40-64 group followed by the 18 to 39 year group. Survival by race has also consistently favored the white compared to the non-white patient population although in almost 20% of cases, race is recorded as unknown. Survival from an initial rhythm of VT/VF improved over time increasing from a low of 25.4% in 2006 to a high of 30% in 2011. Similarly, PEA survival has

8
improved from 7.9% in 2006 to 9.9% in 2011. This is important since the percent of VT/VF cases has decreased slightly at sites over time as previously noted in Table 1c. As expected, survival remains higher for witnessed events and events in which victims receive bystander CPR and these have remained consistent over time. Functional survival based on the MRS score ≤ 3 shows that about 2/3 of patients have a favorable outcome. Favorable functional survival over time has also been better between the ages of 18 and 64 years and in males compared to females.
Table 3d summarizes the trends for all OHCA outcomes for the 6 US ROC sites from 2006 to 2011 for cardiac arrests with no obvious cause. As for other tables that are restricted to patients with no obvious cause, the numbers are smaller, but the general trends are the same.
Trend Analysis for Pediatric OHCA Outcomes 2006 to 2011 in 6 US ROC Sites
Table 3e summarizes outcome data and trends for pediatric cardiac arrest defined as age ≤ 18 at the 6 US ROC sites from 2006 to 2011. These are challenging to interpret because of the very small numbers of survivors as well as missing data. Witnessed pediatric arrests have consistently better outcomes than unwitnessed events and survival is also better for an initial rhythm of VT/VF or PEA in comparison to Asystole.
Canadian comparison and trend analysis on outcomes for adult and pediatric all cause OHCA and no obvious cause OHCA
Tables 3f and 3g summarize the trends for all cause adult and pediatric OHCA over time for 3 Canadian ROC sites and Tables 3h and 3i for the entire consortium. Since the focus of this report is on the trends within the US ROC sites, these data are being provided primarily for completeness.
CPR Process Data 2011
In 2011, of the 9,427 treated arrests, CPR process data were available in 71.4% of cases. (Table 4) Availability was higher in the US (75.6%) compared to Canada (67.3%). In terms of CPR fraction, the mean was 0.76 and this was slightly higher in the US (0.78) compared to Canada (0.74). The mean CPR rate (based on compressions per minute with a least one minute of data) was 111.9 and the mean depth was 37.5 cm. The pre-shock pause defined as the time between the last compression and delivery of defibrillation for cases where at least 1 defibrillation event was recorded was 16.5 seconds and the mean post-shock pause (time from shock delivery to resumption of chest compressions) was 7.5 seconds. Other than data availability and CPR Fraction, the reported CPR metrics were similar in both countries in 2011.
Hospital Interventional Data
In 2011, the overall use of TTM was 42.8% among all patients admitted to the hospital and this was higher in Canada (44.8%) compared to the US (41.6%). (Table 5) A cardiac catheterization was performed in 26.9% of all admitted patients and a percutaneous coronary intervention occurred in 62.3% of patients undergoing cardiac catheterization. Secondary prevention of recurrent cardiac arrest through the placement of automated internal cardiac defibrillators (ICDs) is considered an important hospital intervention especially in cases where no clear etiology other than an electrical event is believed to be responsible for the primary cardiac arrest. The ICD placement rate in patients discharged from the hospital in 2011 was 24.2% and similar in the US and Canada.
Burden of Disease Estimates

9
If the data from the 6 US ROC sites were extrapolated to the country at large (Population estimated at 308,745,538 in the 2010 census), we estimate that there was an EMS response to 385,314 (using the most recent and complete data to estimate an incidence of 124.8 * 308,745,538 / 100,000) OHCA in 2010 with 196,980 (incidence of 63.8 * 308,745,538 / 100,000) receiving treatment. If similar estimates are calculated using the 2013 census data (using estimates of the US population as of July 1, 2013, <http://www.census.gov/popclock/>, accessed on May 21, 2015), we obtain the following results. We estimate that there was an EMS response to 394,529 (incidence of 124.8 * 316,128,839 / 100,000) OHCA in 2013 with 201,690 (incidence of 63.8 * 316,128,839 / 100,000) receiving treatment. The incidence estimates are based on cardiac arrest patients of all ages and include all cardiac arrests (i.e. obvious causes and no obvious causes combined). Of note, the census track areas can change every 10 years. Specifically, census tracks can stay the same, expand or shrink at each of the 10 year marks. Until the end of 2011 sites determined the location of a cardiac arrest based on the 2000 census track definition. Starting at the beginning of 2012, the sites were asked to use the (potentially new) 2010 census track definition. Because the location of the arrests (which occurred after January 1, 2012) are linked to the 2010 census track definition, we used 2010 census track data for estimating the potential number of lives saved (see below). As such and because the population appears to be growing over time and this increase in population is not reflected in the denominator, the estimated/extrapolated incidence rates for years after 2010 can be expected to be a slight overestimate. An alternative approach would have been to assume that the overall predicted US population growth is reflected the same way for all of the geographic areas that are part of the involved ROC agencies, but we decided to not make this assumption for these estimates.
Estimate of potential lives that could be saved if the highest survival rates were achieved by all We present three approaches to obtain an estimate of the number of lives that could potentially be saved within one year if the highest observed survival rates were achieved by all EMS agencies and communities across the US. The first (1) is a straightforward method that assumes a low overall survival rate for OHCA victims and extrapolates to the potential number of lives saved if a number of different and higher survival rates can be achieved nationally. The second approach (2) assumes that the variable survival rates observed among the six US ROC sites that contributed to this report are representative of the current situation in the US and that survival can be improved by a similar absolute percentage among all sites which exhibit less than the highest observed survival rates. The third and final approach (3) also assumes that the variable survival rates observed among the US ROC sites covered in the report are representative of the US and it assumes in addition that all sites with lower survival rates can achieve the highest observed survival rates.
(1) Based on US census data from 2010 the US population was 308,745,538 people. The US ROC population covered by the agencies/sites included in this report represented 7,767,584 (2.5% of the US population). Among the US ROC sites included here, we observed 9,560 OHCAs in 2011 of which 4,720 were treated. If only 2% of the treated OHCAs survive to hospital discharge this represents 94 (2% of 4,720) lives saved for the US ROC sites and 3,752 for the US population. If 6% were to survive (rather than 2%, i.e. a tripling of the survival rate), this represents 283 lives saved per year among the US ROC sites and 11,257 within the US. If 18% were to survive (rather than 2%, i.e. a nine-fold increase of the survival rate), this represents 850 lives saved per year among the US ROC sites and 33,770 in the US. As a result about an additional 29,000 lives might be saved if the survival rate increased from 2 to 18%. This estimate might be viewed as an upper possible limit, because it assumes that only 2% of OHCA patients survive in the US (which we know not to be true across all sites, as we have observed survival rates up to 18%) and that it is

10
possible to achieve a survival rate of 18% in the country (which is also unlikely). The next approaches (2) and (3) attempt to explore more realistic goals for improving survival from OHCA.
(2) We use the same US census data from 2010 for the second approach to estimating the potential number of lives saved. Six US ROC sites contribute to this report. See Table 6 for site specific information regarding the population, percent of the total, incidence rate per 100,000 person years and survival among treated out-of-hospital cardiac arrest. If the US ROC sites are considered as representative of the country , then the survival rate from OHCA is about 6% for 36% of the population, 9% for 20% of the population and 14% for 17% of the population and 19.5% for 27% of the population (Table 6). If it were possible to increase the survival rate that is currently at about 6% to 9% (in 36% of the population) this would result in an additional 2,022 lives saved. If it were possible to increase the survival rate that is currently at about 9% to 14% (in 20% of the population), this would result in an additional 2,564 lives saved. And if it is possible to increase the survival rate that is currently at about 14% to 19% (in 17% of the population), this would represent 1,193 lives saved. Assuming that the survival rate of 19% remains the same for 27% of the population this would mean that overall additional 5,779 lives could be saved.
(3) For the third approach we again use the same US census data from 2010 to estimating the potential number of lives saved. We work with the same population, percent of the total, incidence rate per 100,000 person years and survival among treated out of hospital cardiac arrest within the six US ROC sites contributing to this report (Table 6). Compared to approach (2) we now assume that it is possible to increase survival to 19% for the entire US population. This would mean that it is possible to increase the survival rate that is currently at about 6% to 19% (in 37% of the population) this would represent 8,509 lives saved. If it is possible to increase the survival rate that is currently at about 9% to 19% (in 20% of the population), this would represent 5,098 lives saved. As before, if it is possible to increase the survival rate that is currently at about 14% to 19% (in 17% of the population) 308,745,538 / 100,000), this would represent 1,193 lives saved. Assuming that the survival rate of 19% remains the same for 27% of the population this would mean that overall additional 14,800 lives could be saved.
Of note, there is a variability among the US ROC sites regarding the percent of OHCA patients that are treated that ranges from 32.4% to 62.7%. This variability will contribute to the percent of lives that potentially can be saved, but is not considered in the estimates above. Note that an absolute increase of 4% in survival rate over the course of 5 years (from 2006 to 2011) was observed for the site that had the lowest survival rate in 2006 (survival rate of 1.7% in 2006 and 5.7 in 2011) and also for the site that had with the highest survival rate in 2006 (15.4% in 2006 and 19.5% in 2011).

11
How many lives could be saved if bystander CPR was performed on all OHCA In the US ROC sites contributing to this report, 55% of OHCA cases received their initial CPR by EMS personnel. In 2011 the survival rate for patients who received their initial CPR by a bystander (non-EMS), was 13.7% and the survival rate for patients who received their initial CPR by EMS personnel was 8.5%. This represents a difference of 5.2%. The smallest difference between these survival rates observed from 2006 through 2011 was 1.3%. If bystander CPR could be performed for all OHCA cases and the survival rate increased from 8.5% to 13.7% (in 55% of the population), this would save an additional 117 lives per year for the US ROC sites and 4,644 patients throughout the US. If the difference in survival rates between bystander and EMS initiated CPR is 1.3% (instead of 5.2%), then the estimated number of lives saved within one year within the US ROC sites is 29 and the corresponding potential lives saved within the US within one year is 1,161. Another possible way to estimate the potential number of lives saved through enhanced bystander CPR would be to consider the survival rate in the sites with the highest rate of bystander CPR. Table 7 gives number of cardiac arrests for 2011 for each site that where CPR was initiated by EMS and where it was initiated by a bystander, the number and percent of patients who survived to hospital discharge, and the total number treated patients and the percent that had CPR initiated by a bystander. We estimated the number of patients that potentially could be saved per year for the 6 US ROC sites if the survival experience of all patients where bystander CPR was performed was at the highest level observed with these sites (22.2%). For example in the site 1, there were 110 patients that received bystander CPR. If 22.2% of these patients survived, this would result in about 24 survivors. In 2011 the actual number of survivors was 6. As a result 18 (24 – 6) additional lives could have been saved if the survival among the patients who had bystander CPR performed had been at the highest rate that was observed among the six sites. If the same calculation is then performed for each of the sites, a total of 154 patients could have been saved within the US ROC sites if the survival among patients with bystander CPR would have been 22.2%. If these sites were representative of the US, 6,102 lives could be saved per year if survival from bystander CPR was increased to 22.2% instead of the assumed current lower survival rates. As table 7 shows, the percent of bystander CPR performed varies by site and ranges from 23% to almost 60%. We also estimated the number of patients that potentially could be saved per year for the 6 US ROC sites, if both of the following could be achieved, bystander CPR survival rates at the highest level for all sites (22.2% ) and percent of CPR performed by bystanders at the highest level (60% bystander CPR performed in treated cases). E.g. in site 1, 273 patients were treated, if 40% have their initial CPR performed by EMS, this would represent 109 patients and if 60% would have their initial CPR performed by a bystander, this would represent 164 patients. We assume that the survival rate (for the purpose of this calculation) remains the same site specific rate for those patients for whom EMS initiates CPR (7.4% for this site), but that the survival rate among those patients where a bystander initiates CPR is 22.2% (instead of 5.5% for this site). As a result the number of patients surviving where EMS initiated CPR is 8 and the number of patients surviving where a bystander initiates CPR is 36, totaling 44 patient saved. Compared to the 18 patients observed to survive 2011 this represents an additional 26 patients. If similar calculations are performed for the other sites, the total potential lives saved for the 6 US ROC sites is 248. If the 6 US ROC sites are representative for the US, this might translate to potentially saving 9,873 patients per year if CPR can be performed at the highest level observed within these sites and if survival among these patient is at the highest level observed for these sites. How many lives could be saved if bystander used AED at the highest levels observed

12
Within the 6 US ROC sites contributing to this report there were 1,808 patients where a bystander performed CPR. In 11.3% of these cases the bystander also applied a public access AED (these include application of AED whether or not a shock was delivered). The survival rate among patients where bystander CPR was performed but no AED was used by the bystander was 12.6%. Among those patients where the bystander used an AED in addition to performing CPR, the survival rate was 23.4%. If the survival rate of 23.4% could be achieved for all cases where bystander CPR was performed 175 (1,624*0.234) additional patients could potentially be saved among the 6 US ROC sites. Again, if the 6 ROC sites were representative of the US with respect to this, then this could translate to 6,937 potential additional lives saved within the US per year. The percent survival among the sites varies among patients for whom bystander CPR is performed and a public access AED is applied among both, the patients who receive a shock by the AED (survival ranges from 22.2% to 54.1%) and the patients who do not receive any bystander AED shocks (survival ranges from zero percent to 16.7%). If all patients for whom a bystander performs CPR and an AED is used and shock delivered have the highest observed survival rate, 52 potential lives could be saved among the 6 US ROC sites and if they are representative of the US this would represent an additional 632 lives saved. If all patients for whom a bystander performs CPR and an AED is used but no shock is given have the highest observed survival rate 8 potential lives could be saved among the 6 US ROC sites and if they are representative of the US this would represent an additional 305 lives saved. As described above, the percent of patient where a bystander performs CPR and an AED is applied is low. If an AED could always be used when bystander CPR is performed and the survival rates among those patients where a shock is given and where no shock is given are at the highest observed level than 406 potential lives could be saved across the 6 US ROC sites. And again, if they are representative of the US and this (AED always used in combination with bystander CPR and the highest observed survival rates) could be achieved across country 16,138 potential additional lives could be saved each year. All of the above estimates rely on many assumptions, some of which are mentioned above. Other assumptions are e.g. that the survival rates remain the same over time. They might change for example if the rate of VT/VF continues to decrease. We also assume e.g. that it is possible to improved bystander CPR across the US such that the quality of the bystander CPR results in the highest observed survival rates. In the estimates we have not taken into account other factors that are known or thought to affect survival in communities (such as disease burden and whether or not 911 dispatchers encourage or guide bystander CPR, EMS response times etc.). For these assumptions it is a difficult judgment call whether these are/can be met.
Discussion:
Survival from EMS treated OHCA in 2011 was 11.3% and the trend data suggests that this has improved by 1.4% since 2006 at the 6 US ROC sites. An important contributing factor is the nearly 10% improvement in bystander CPR rates between 2006 and 2013. The majority of individuals who arrest are male in their early 60’s. Most arrests occur at home and the mean EMS response time to these incidents is around 5 minutes. The most favorable neurological outcomes are for witnessed events with an initial rhythm of VT/VF where the survival approaches 35%. The incidence of VT/VF as the initial rhythm however has declined over time and now accounts for about 20% of all cardiac arrests. OHCA with PEA as a presenting rhythm appears to be increasing and accounts for approximately 25% of all cases with a survival rate of 10%. There are gender differences in survival to hospital discharge rates favoring males. There are also apparent survival differences between whites and non-whites as well as non-Hispanics

13
and Hispanics although these data need further validation and also suffer from incompleteness. Pediatric arrests are rare and the overall survival of 7.9% is lower than that reported overall for all patients (10.7%) at the six US sites. A prior ROC publication however showed that much of this was related to the poor outcome of SIDS deaths in the population under 1 year of age. (9)
Although the focus of this report is on the 6 US sites participating in ROC Epistry, the analysis generated several interesting findings that merit further mention. For example, we noted consistent difference in the number of home vs. residential facility cardiac arrests between the United States and Canadian sites. A possible explanation for this is that home care is more commonly available in Canada in comparison to the US and the Canadian health system emphasizes it is more cost effective to care for the patients at home than it is to institutionalize them. Similarly, functional outcomes for discharged patients were much better in Canada compared to the US (86.3 vs. 69.5%) and may be reflective of the different philosophies of the health care models with regards to quality of life choices following resuscitation from OHCA in the two countries. In addition, there is considerable variability in the types of EMS response configuration models that are being utilized in US communities compared to Canada. EMS system configuration in Canada is tiered with BLS usually first on scene followed by ALS while in the US, trends suggest more ALS first on scene possibly due to the deployment of paramedic engine companies by fire departments. Since survival is similar across the US and Canadian sites this may suggest that a focus on high quality BLS care in cardiac arrest may be an effective strategy. Although not detailed extensively in this report, there is considerable, site level variation in patient, event, EMS system, treatment and outcome data. This is especially evident in the incidence data which show a 2-3 fold variation across sites. In addition, sites differ with regards to the proportion of treated cases and this requires further study.
Important strengths of ROC Epistry include its independent assessment of complete case ascertainment, use of range and logic checks to enhance data quality, as well as independent periodic audit of data collection and abstraction procedures at each site. Improvements in data collection and quality over time as well as EMS documentation have helped create a stable measurement platform and reduced the amount of missing data. Missingness for outcome data is less than 1% across all ROC sites.
Limitations of ROC Epistry includes changes in the number of agencies that have contributed data which decreased from over 250 in 2006 to the 120 consistent contributors summarized in this report. This creates a selection bias in that that the data presented are not representative of all agencies within the six ROC US sites. Furthermore though geographically diverse, the 6 ROC sites may not be representative of all EMS agencies across Unites States since they were initially selected through a competitive process for their ability to conduct out-of-hospital RCTs. In fact the baseline survival (9.9%) of the sites included in this analysis was higher than average survival rate (7.6%) reported in a recent 30 year systematic review. (10)
Summary:
We describe the epidemiological trends for OHCA at the 6 US ROC sites including event, patient, EMS, treatment and outcome characteristics. Collectively, OHCA survival has increased slightly over time among these ROC communities which are geographically dispersed. The survival increases demonstrate that OHCA is a condition whose treatment warrants ongoing investment of health care resources to achieve further improvements. Based on survival differences between sites, and whether or not bystander CPR is performed and AEDs are used, the estimates of potential number of additional lives

14
saved show that significant improvements can be achieved in outcomes for OHCA in the United States. References:
1. Davis DP, Garberson LA, Andrusiek DL, et al. A descriptive analysis of Emergency Medical Service Systems participating in the Resuscitation Outcomes Consortium (ROC) network. Prehosp Emerg Care 2007;11:369-82.
2. Morrison LJ, Nichol G, Rea TD, et al. Rationale, development and implementation of the Resuscitation Outcomes Consortium Epistry-Cardiac Arrest. Resuscitation 2008;78:161-9.
3. Jacobs I, Nadkarni V, Bahr J, et al. Cardiac arrest and cardiopulmonary resuscitation outcome reports: update and simplification of the Utstein templates for resuscitation registries. Resuscitation. 2004;63:233-49.
4. Kudenchuk PJ, Brown SP, Daya M, et al. Resuscitation Outcomes Consortium-Amiodarone, Lidocaine or Placebo Study (ROC-ALPS): Rationale and methodology behind an out-of-hospital cardiac arrest anti antiarrhythmic drug trial. Am Heart J. 2014;167:653-9.
5. Meaney PA, Bobrow BJ, Mancini ME, et al. Cardiopulmonary resuscitation quality: improving cardiac resuscitation outcomes both inside and outside the hospital: a consensus statement from the American Heart Association. Circulation 2013;128:417-3.
6. Bernard SA, Smith K, Cameron P, et al. Rapid Infusion of Cold Hartmanns (RICH) Investigators. Induction of therapeutic hypothermia by paramedics after resuscitation from out-of-hospital ventricular fibrillation cardiac arrest: a randomized controlled trial. Circulation. 2010;122:737-42.
7. Kim F, Nichol G, Maynard C, et al. Effect of prehospital induction of mild hypothermia on survival and neurological status among adults with cardiac arrest: a randomized clinical trial. JAMA. 2014;311:45-52.
8. Nichol G, Thomas E, Callaway CW, et al. Regional variation in out-of-hospital cardiac arrest incidence and outcome. JAMA. 2008;300:1423-31
9. Atkins DL, Everson-Stewart S, Sears GK, et al. Epidemiology and outcomes from out-of-hospital cardiac arrest in children: the Resuscitation Outcomes Consortium Epistry-Cardiac Arrest. Circulation. 2009;119:1484-91.
10. Sasson C, Rogers MA, Dahl J, Kellermann AL. Predictors of survival from out-of-hospital cardiac arrest: a systematic review and meta-analysis. Circ Cardiovasc Qual Outcomes 2010;3:63-81.

Date Range: 07/07/2073 - 12/3I/2013Country: USA and Canada
Subset: None
Table 1a: Descriptive Statistics
Country Cãnada OVERALL
9863 20392
Untreated, n (%) 4832 (49.0%) 4852 (46.7%I e684 (47.s%l
Treated, n (%) s031(s1.0%) s677 (s3.9%l 10708 (s2.s%)
Age
Treated Arrests Median (lQR)
Treated Arrests Mean (sd)
Untreated Arrests Median (lQR)
Untreated Arrests Mean (sd)
64.0 (26.0)
62.1 (1e.8)
66.0 (28,0)
6s.6 (1e.1)
6e.0 (2s.0)
66.6 (le.1)6e.o (26.8)
67.6 (r7.sl
67.0 (26.0)
64.s (1e,6)
67.0 (27.ol
66.6 (18.s)
Male, n (%)
Treated n (%)
Untreated n (%)
3068 (61.0%) 3700 (6s.2%) 6768 (63.2%l
283s (63.s%) 3000 (76.3%) s83s (6s.s%)
Race
White, n (%)
Non-white, n (%)
Unknown, n (%)
2612 (sr.e%) 0 (o.o%)
1448 (28.8%) o (o.o%l
97t (79.3%) s677 (7O0.O%l
261.2 (24.4%)
L448 (1.3.s%l
6648 (62.r%)
EthnicityHispanic, n (%)
Non-Hispanic, n (%)
Unknown, n (%)
264 (s.2%)
37e6 (7s.s%l
971. (19.3%l
o (0.0%) 264 (2.s%l
0 (0.0%l 37e6 (3s.s%)
s677 (1,O0.O%) 6648 (62.r%)
Cause of Arrest
No obvious cause, n (%)
Obvious cause, n (%)
4638 (s2.2%l 5232 (s2.2%) e87O (e2.2%l
3e2 (7.8%) 44s (7.8%l 837 (7.8%l
Witness Status
EMS, n (%)
Bystander, n (%)
None, n (%)
Unknown, n (%)
621. (12.3%l
1.680 (33.4%l
2s43 (s0.s%)
184{.3.7%l
670 (71.8%)
2160 (38.0%)
2834 (4s.s%l
13 (0.2%)
129r (r2.1%)
3840 (3s.e%)
s377 (s0.2%l
r97 (1,8%)
lnitial EMS Rhythm
YT/VF, n (%)
PEA, n (%)
Asystole, n (%)
No Shock/No Strip, n (%)
Cannot Determine, n (%)
e73 (1.e.3%l
7236 (24.6%l
zstt ( es%lL72 (3.4%l
63 (L.3%)
1r7t (20.6%l
1.344 (23.7%)
2678 (47.2%)
3O4 (s. %l
30 (o.s%)
2744 (20.0%l
2s8O (24.1%l
s18e (48.s%)
476 (4.4%)
e3 (o.s%)
Bystander CPR
Attempted, n (%)
Who Attempted (available)
Lay person, n (%)
Police, n (%)
Healthcare worker, n (%)
Other, n (%)
Unknown, n (%)
21.67 (43.1%l
2167
1370 (63.2%')
229 (70.6%')
62s (ze.A%)
1,1, (0.5%l
e (o.4%l
2323 (40.9%',)
2323
188s (81.1%)
774 (7.s%l
26s (rL.4%)
2s (L.r%)
1(0.0%)
44eO (41.9%)
4490
32ss (72.s%)
403 (9.0%')
8e4 (ts.e%l
36 (0.8%)
1.0 {o.2%l

Date Range: OL/OL12073 - I2|3U20I3Country: USA and Canada
Subset: No obvious cause (cardiac etiology)
Table 1b: Descriptive Statistics
4638 5232
Untreated, n (%) 0 (0.0%) o (o.o%) 0 (0.0%)
Treated, n (%) 4638 (47.o%',) s232 (4e.7%) 9870 (48.4%l
Age
Treated Arrests Median (lQR)
Treated Arrests Mean (sd)
Untreated Arrests Median (lQR)
Untreated Arrests Mean (sd)
6s.o (2s.0)
63.4 (1s.0)7O.O (24.0) 68.0 (2s.0)
67.s (t8.21 6s.8 (18.7)
Male, n (%)
Treated n (%)
Untreated n (%)
2810 (60.6%) 3407 (65.10/o1 6277 (63.0%)
Race
White, n (%)
Non-white, n (%)
Unknown, n (%)
2478 (s2.r%) O (O.O%l 2418 (24.s%l
734s (2e.0%) 0 (0.0%') L34s (L3.6%)
87s (rgs%l s232 (to0.0%l 6Lo7 (61..e%l
Ethnicity
Hispanic, n (%)
Non-Hispanic, n (%l
Unknown, n (%)
24O (s.2%l
3523 (76.0%lo (o.o%) 240 (2.4%l
o (o.o%\ 3s23 (3s.7%l
87s (r8.9%l s232 (r10.0%l 6tO7 (6t.s%l
Cause of ArrestNo obvious cause, n (%)
Obvious cause, n (%)
4638 (100.0%) s232 (100.0%) e870 (100.0%)
o (0.0%) 0 (o.o%) 0 (o.o%)
Witness Status
EMS, n (%)
Bystander, n (%)
None, n (%)
Unknown, n (%)
s64 (72.2%)
7s6s (33.7%)
2332 (sO.3%)
774 (3.8o/ol
64L (r2.3%l
2031(38.8%)
2s47 (48.7%)
L3 (0.2%l
120s (12.2%',)
3s96 (36.4%l
4879 (49.4%)
187 (L.e%l
lnitial EMS Rhythm
YrlYF, n (%)
PEA, n (%)
Asystole, n (%)
No Shock/No Strip, n (%)
Cannot Determine, n (%)
ss3 (20.s%)
r7t7 (24.7%)
2293 (49.4%l
Ls6 (3.4%',)
53 (l.Io/ol
rLso (22.0%l
1239 (23.7%')
2403 (4s.9%)
277 (5.3%l
26 (o.s%l
2703 (27.3%)
23s6 (233%l46e6 (47.6%l
433 (4.4%l
79 (O.8%l
Bystander CPR
Attempted, n (%)
Who Attempted (availa ble)
Lay person, n (%)
Police, n (%)
Healthcare worker, n (%)
Other, n (%)
Unknown, n (%)
ts82 (42.7%l
19821236 (62.4%l
1e4 (e.8%)
606 (30.6%)
e (0.s%)
s (o.s%)
2129 (4O.7%l
2729
1747 (82.r%)
740 (6.6%l
243 (11.4%)
23 (1.r%l
t (o.o%l
4ttt (41,.7%l
4t1,r2983 (72.6%l
334 (8.1%l
84s (20.7%l
32 (O.8%)
t0 (o.2%)

Date Range: OUOL/2006 - t2/3t/2073Country: USA
Subset: None
Table 1c: Descriptive Statistics
8219 8808 9511" 9475 9863 66964untreated,.n (%) zzat (qsJxl zosa (!l.qxl ztsg (so.sy.l zsgs (qa.tN) qEço (qg.sxl qaot $oTreated, n (%) gesg $qsx) zzat $z.sx) zaço @slx) qzzo (st.tt) qqqe $osNl qtAge
Treated Arrests Median (lQR)
Treated Arrests Mean (sd)
Untreated Arrests Med¡an (lQR)
Untreated Arrests Mean (sd)
63.0 (28.0) 63.0 (27.0) 64.0 (27.0)
67.2 (27.21 61.6 (20.s) 62.3 (20.2)
68.0 (29.0) 68.0 (29.s) 67.0 (29.0)
64.0 (27 .O) 63.0 (27.0) 64.0 (27.O) 63.0 (27.0) 64.0 (26.0) 64.0 (27.O)
62.4 (20.0) 61.6 (20.8) 62.1 (20.1) 62.2 (20.0') 62.1 (19.S) 62.0 (20.3)66.0 (28.0) 67.0 (2e.0) 6s.0 (28.0) 66.0 (28.0) 66.0 (28.0) 66.0 (2s.0)
66.2 (19.41 6s.8 (19.9) 6s.8 (19.s) 6s.4 (19.4) 66.4 (19.6) 6s.3 (19.2) 6s.7 (19.0) 6s.6 (19.1) 6s.8 (19.3)Male, n (%)
Treated n (%)
Untreated n (%)
2397 (61.5%l 2to3 (62.7%)
t4s7 (s7.4%)2233 (61'0%) 2636 (62.s%l 27s4 (s9.3%) 290s (60,s%)2664 (s9.9%l
1663 (s6.0%)20800 (60.s%)
188s (57.4%l 308 1390 2s2s (58. 2679 (s7.4%l3068 (61.0%)
283s (s8.7%) 14742 1s7.8%Race
White, n (%)
Non-white, n (%)
Unknown, n (%)
1s8s (40.7%l
974 (2s.0%l
1340 (34.4%)
L296 (38.3%)
72s (21.4%)
1366 (40.3%)
t2s2 (34.2%l
646 (17.7%)
]-762 (48.1%l
1483 (3s.1%)
74s (17.7%l7s78 (3s.s%l
938(27.1%l7932(43.4%l
1766 (37.s%)
to04 (27.3%l2280 (47.4%l
t74L(23.7%l26t2 (s7.9%l
7448 (28.8%')
97t 119.3%)
738s2 (40.s%)
7627(22.3%)
EthnicityHispanic, n (%)
Non-Hispanic, n (%)
1992 (47.2%l 1940 138s (28.8%) 72688 ß7.
142 (3.6%) 774 (3.4%l 90 (2.5%) t}s (2.s%) t79 (4.o%) r74 (3.7%) tgs (4.t%) 264 (s.2%) 7263 t3.7%)2477 (62.0%) rsOT (s6.3%) 1808 (49.4%) 2722 (s0.3%) 2336 (s2.s%) 2s96 (5s.1%) 322s (67.1%) 37s6 (7s.s%l 20207 (ss.2%)
unknown,n(%l I34O(34.4%) 1366(40.3%) 1762(48.r%) 7992(47.2%) 1932(43.4%) rg4}(47.2%l t38s(28.8%) s7L(t9.3%l 12688(37.1%lCause of Arrest
No obvious cause, n (%) 340s (93.0%) 31s30 (92.3%)3470 (89.0%1 3122 (92.2%l
428 (tt.O%) 260 (7.7%)3966 (s4.0%l 4206 (e4.6%l
23s (s.6%l 24L(s.4%l4333 (s2.0%) 4390 (9].3%l
Obvious cause, n
W¡tness Status
EMS, n (%)
Bystander, n (%)
None, n (%)
240 377 4ts (8.6%l
4638 (92.2%)
392 (7.8%l 2s88 (7.6%l
34s (8.8%) 3tO (9.2%)
7373 (35.2%1 7092 (32.2%l
1s90 (40.8%) 74ss (43.0%)
398 (10.9%) st2 (72.1%)
t22s (33.s%) L46s (34.7%l
t664 (4s.s%) 78t9 (43.7%l
s68 (72.8%) s27 (L7.2%)
r.s63 (3s.1%) 1729 (36.7%l
2083 (46.8%) 2277 (48.3%)
614 (12.8%) 621(12.3%') 389s (11.4%)
1,669 (34.7%) t68O (33.4%) 1.1796 (34.s%l2367 (49.3%) 2s43 (s}.s%l 1s798(46.2%l
n(%)lnitial EMS Rhythm
W/Vt,nl%)PEÃ, n (%)
Asystole, n (%)
No Shock/No Strip, n (%)
Cannot Determine, n (%)
sgr (1s.2%) szs
88s (22.7%) 7t2 (2L.0%l
876 (22.s%) 766 (22.6%l
t627 (41.7%1 1s24 (4s.0%)
7s (2.O%l 68 (2.O%)
358
783 (21.4%) 8s9 (2O.4%l
849 (23.2%) tO49 (24.9%l
1681 (4s.9%) 2048 (48.s%l
38 (1.0%) s7 (t.4%l
894 (20.1%1 978 (20.8%l
1070 (24.r%) 11]-9 (23.8%)
2201 (49.s%) 23Ot (48.9%)
786 (4.2%) 183 (3.9%)
1OO2 (20.8%) 973 (79.3%1 7086 (20.7%)
123r(2s.6%) 7236(24.6%1 8196(24.O%l2270 (47.2%) 2s7!(49.9%) 16t63 (47.3%\
lss (3.3%l L72 (3.4%) s42 (2.8%l
406 (9.6%1 233 (s.2%\ 177 (3.8%l tss (3.2%l L84 (3.7%) 2629 (7.7%l
327 (8.4%l 26s 0 198 (s.4%l ]'08 (2.6%) 6L (1.4 76 (7.6%) 63 (t.3%l ]-766 (3.4%Bystander CPR
Attempted, n (%)
Who Attempted (available)1320 (33.9%) L196 (3s.3%)
007362 (37.2%l 1660 (39.3%)
007722 (38.7%\ 7872 (38.s%) 2067 (43.0%l
0 1346 20672t67 (43.1%) 1"3306 (3e.0%)
2L67 5580

Date Range: Ot/Ot/2OO6 - L2/3t/2Ot3Country: USA
Subset: No obvious cause (cardiac etiology)
Table 1d: Descr¡ptive Statistics
43s (L1.3%l 40s (9. 39s ß.6% ]42(3.2%1 0Treated, n (%) 3470 (s6.0%) 3122 (62.s%) 34os (88.7%) 3966 (90.7%) 4206 (91.4%)Age
Treated Arrests Median (lQR)
Treated Arrests Mean (sd)
Untreated Arrests Median (lQR)
6s.0 (26.0)
63.0 (19.8)
69.0 (29.s)
64.0 (26.8)
62.8 (19.e)
68.0 (29.0)
6s.0 (27.0)
63.s (1s.2)
67.0 (2s.s)
6s.0 (27.0)
63.s (19.3)
69.0 (31.0)
68.4 (18.6)
64.0 (26.0)
62.4(20.31
69.0 (31.0)
64.0 (2s.0)
63.4 (19.0)
72.o (28.01
64.0 (2s.0)
63.6 (19.0)
NA (NA)
NaN (NaN)
6s.0 (2s.0)
63.4 (19.0)
NA (NA)
6s.0 (26.0)
63.2 (19.4)
69.0 (29.0)Untreated Arrests Mean 67.t( 66.3 (19.s) 67.81t7.7 69.4 7L.6 (L7. NaN 67.3 (18.9)
Male, n (%)
Treated n (%) 2t3O (6L.4%l 193s (62.0%1 2077 (67.0%1 2464 (62.1%) 2s2O (s9.9%) 2s69 (ss.3%) 26s8 (60.s%) 2810 (60.6%) 1s163 (60.8%)untreated n (%) 1ss4 (s7.1%) 1063 (s7.6%) 244 (s6.s%) 240 (59.6%) 239 (61.1%) 79 (s6.0%) O (NaN) O (NaN) 3419 (57.6%)
Race
white, n (%)
Non-white, n (%)
Hispanic, n (%)
Non-Hispaniq n (%)
Lr4 (3.3%)
2182(62.9%lLo2(3.3%l
t740 (ss.1%l8re.4%l
t67O (49.O%)
s3 (2.3%l
L976(49.8%l
L67 (4.O%',)
22L8(s2.7%l1s8 (3.6%)
2367 (s4.6%lt72(3.9%)
2953 (67.3%'l
24o(s.2%l3s23 (76.0%l
87s (18.9%)
]-t27 (3.6%l
18629 (s9.1%)
tt774137.3%l
L479 (4O.9%l !784 (37.9%l Lt6O (34.L%l 1368 (34.s%) L489 (3s.4%l 7s92 (36.7%1 2077 (47.3%1 24L8 (sz.L%) t27O7 (4O.3%l877 (253%1 658(2t.7%) s9r.17.4%l 7,r(r7.7%l 896(21.3%l s33(2:^.s%) ro48(23.s%l L34s(2s.O%l 7O4s(22.4%)
unknown,n(%l LI74(33.8%) L28O(47.O%' L6s4(48.6%) 1897(47.8%) 1827(43.3%1 7808(47.7%') t26s(28.8%l 87s(78.s%l LL774(37.3%lEthnicity
Unknown, n
Cause of Arrest
No obvious cause, n (%)
LL74 (33.8%l 1280 1654 1897 (47. r82L(43.3%l 1808(4t.7%l 7265
3470 (100.0%) 3L22 (LO}.O%| 340s (100.0%) 3e66 (100.0%) 4206 (100.0%) 4333 (100.0%) 4390 (100.0%) 4638(LOO.O%) 31s30 (1OO.O%)Obvious cause, n (%) 0 (0.0%) 0 (0.0%) O (O.O%) O (0.0%) o (o.o%) 0 (0.0%) 0 (0.0%) 010.0%) o (0.0%)
Witness Status
EMs, n (%)
Bystander, n (%)
None, n (%)
277 (8.o%l 277 (8.s%l 368 (10.8%)
1264 (36.4%l tO23 (32.8%l tLsT (34.O%',)
L393 (4O.L%l r32O (42.3%l ts46 (4s.4%l
479{\t2.7%l
1406 (3s.s%)
LTOL(42.9%l
380 (9.6%)
s32(t2.6%l1491 (3s.4%)
tss3 (46.4%l
230 (s.s%)
477 (rL.O%l
\6].6(37.3%lzoTo(47.8%l
r7o(3.9%l
sss (t2.7%)
1ss0 (3s.3%)
2t3s (48.6%l
t46(3.3%l
s64 (]-2.2%1 3s33 (11.2%)
Ls6s (33.7%l ttÙ72 (3s.t%)
2332 (5O.3y"1 t44s0 (4s.8%lUnknown, n (%) s36 (Ls. %l sO2 (L6.1%l 334 (9.5%) 174ß.8%l 2472(7.8%l
lnit¡al EMS Rhwhm
w/vF,n(%lPEA, n (%l
Asystole, n (%)
862(24.8%l74s (2r.6%l
1424(41,.O%l
63 (t.8%)
688(22.O%l
68s(2r.9%lL39s (44.7%l
6s(z.t%l
776 (22.8%l
77r(22.6%ltss6(4s.7%)
34(t.o%lt83(s.4%)
848 (2]-.4%l
98s (24.8%l
190s (48.0%)
s3 (t.3%)
too (2.s%l
882(2L.o%)
988 (23.s%)
2067 (49.1%l
L78 (4.2%l
9s4122.O%',t
1000 (23.1%)
zo93 (48.3%l
178 (4.7%l
s7o (22.L%l
1110 (2s.3%)
2039 (46.4%l
147(3.2%l70 (7.6yól
ss3 (2o.s%l
trrT (24.L%l
2293 (49.4%l
Ls6 (3.4%)
s3 (t.I%l
6s33 (22.o%l
74Os (23.s%l
L4772(46.9%l
868(2.8%lNo Shock/No Strip, n (%)
Cannot Determine, n
Bystander CPR
Attempted, n (%)
Who AttemptedLay person, n (%)
Police, n (%)
280 246 (7.
t!e3 (34.4%l !L04(3s.4%l t287 (37.8%l
:::
57 55 (1
1s83 (39.9%) 1629 (38.7%) 1639 (37.8%) 1879 (42.8%)
0 0 t\93 1879-- 767 (64.3%l r29t (68.7%l
- 8L(6.8%) ]49 (7.9%)
]-982(42.7%)
1982
L236 (62.4%l
7e4(s.8%l606 (30.6%)
9 (0.s%)
9 {0.s%)
LO44
12296 (39.o%)
5054
3294 (6s.2%l
424 (8.4%l
74s3128.7%l
3s (o.7%l
Healthcare worker, n (%) - 3s8 (30.0%) 489 (26.0%lOther, n (%) 6 (0.s%) 20(t.7%lUnknown, n (/o) - 1g (1.5%) L4 (O]%l

Date Range: OL|OU2OO6 - 72/37/2073Country: USA
Subset: Pediatric (age <=18 years)
Table 1e: Descriptive Statistics
year . i.] 2006 2007 2008 2009 2010 20t2 2013 OVERALI-2011226 163 177 220 21-7 207 1550
Untreated, n (%) 38 (16.8%) 38(23.3%1 28$8.3%1 32(78.7%) 36 (16.4%l 40 49 (24.6%) s2 (2s.7%l 313Treated, n (%) 188(83.2%l tzs (76.7%) ]-2s (87.7%) 139 (81.3%) 184 (83.6%) 77rß7.0%) lso (7s.4%l Lss (74.e%l 1237 (79.8%lAge
Treated Arrests Median (lQR)
Treated Arrests Mean (sd)
Untreated Arrests Median (lQR)
0.6 (s.8)
4.1 (6.0)
1.s (1s.6)
0.7 (s.8)
4.1 (6.0)
0.s (14.8)
s.6 (7.4)
0.6 (7.8)
4.2 (6.0)
L.3 (16.0)
7.2 (8.0)
0.8 (r.0.8)
5.2(6.710.8 (6.8)
4.3 (s.8)
0.6 (s.8)
4.2 (6.2)
2.0 (1s.0)
6.6 (7.s)
0.7 (6.8)
4.0 (s.8)
1.s (12.s)
s.4 (7.t)
0.8 (s.8)
4.2 (6.01
2.8 (16.t)
7.4 (7.81
0.s (7.3) 0.7 (6.8)
4.6 (6.41 4.3 (6.1)
2.s (7s.71 1.6 (14.8)
6.7 (7.31 6.3 (7.3)Untreated Arrests Mean (sd) 6.8 (7.5)
Male, n (%)
Treated n (%)
Untreated n (%)
Lrz(59.6%l26 (68.4%)
70 (s6.O%)
21(60.0%ls7 (4s.6%l
0 (o.o%)89 (64.0%)
74 (4s.2%l97 (64.7%l
27 (ss.!%)s3 (60.0%)
33 (63.s%)73t (sg.r%)
165 (s8.1%l
708 (58.7%) tgs (6]'4%l23 (63.9%1 zL(s2.s%l
Race
White, n (%)
Non-white, n (%)
Unknown, n (%)
s7 (30.3%l
74 (39.4%l
s7 (30.3%l
32(2s.6%ls4 (43.2%l
39 (3r.2%l
30 (24.0%)
27 (21.6%)
68 (s4.4%)
37 (26.6%)
27 (79.4%)
7s (s+.o%l
46 {2s.O%ls4 (29.3%)
84 (4s.7%l
ss (32.2%l
43 (2s.1%l
73 (42.7%l
s4 (36.0%)
48 (32.0%l
48 (32.0%l
6s (47.s%l 376 (3O.4%)
s7(32.9%l 378(30.6%l39 Qs.z%l 483 (3s.O%l
EthnicityHispanic, n (%)
Non-Hispanic, n (%)
Unknown, n (%)
79 l\7O.1%)
712 (se.6%')
s7 (30.3%l
e (7.2%l
77 (6t.6%)
39 (31..2%l
72 (s.6%)
4s (36.0%l
68 (s4.4%)
14 (7O.7%)
s0 (36.0%)
75 (s4.0%l
t7 (9.2%l
83 (4s.r%)
84 (4s.7%)
2t (72.3%)
77 (4s.O%)
73 (42.7%l
78 (12.0%)
84 {s6.0%)48(32.O%)
2s (18.7%1 73s (7L.2%)
87 (s6.t%) 61s (49.7%l
3s (2s.2%l 483 (39.0%)Cause of Arrest
No obvious cause, n (%)
Obvious cause, n (%)
tt6 (6L.7%1 100 (80.0%)
72 (38.3%) 2s (2O.O%)
708 (77.7%l 160 (87.0%)
3t (22.3%) 24 (13.0%)r23 (77.9%\ 702(68.0%l48(28.7%1 48(32.0%l
1t9 (76.8%1 974 (73.9%)86 (68.8%)
39 (31.2%l 36 (23.2%) 323 (26.7%lWitness Status
EMS, n (%)
Bystander, n (%)
None, n (%)
Unknown, n (%)
8 (4.3%l 3 (2.4%)
34 (18.1%1 29 (23.2%)
776 (61.7%) 64 (sr.2%l30 (16.0%) 29 (23.2%l
s (4.0%)
23 (t8.4%l
87(64.8%)
t6 (12.8%l
312.2%l
3t(22.3%)83 (s9.7%l
22(1,s.8%l
1t(6.0%l 3(7.8%\4t (22.3%',) 4r (24.0%)
t25 (67.9%) 72r (70.8%l
7 (3.8%l 6ß.s%l
7 (4.s%l 48 (3.s%l
32 (20.6%1 263 (2!.3%)
706 (68.4%) 799 (64.6%)
8 (s.3%)
32(2]-.3%l
to3 (68.7%)
7 (4.7%l 8(s.2%) t2s (1o.1%l
lnitial EMS Rhythm
wlvt,n(%)PEA, n (%)
Asystole, n (%)
No Shock/No Strip, n (%)
Cannot Determine, n (%)
6 (3.2%\
77 (9.0%l
127 (67.6%',)
s (2.7%l
26 (73.8%l
3 (2.4%l
t3 (r0.4%)
97(72.8%)r(0.8%l72(9.6%\
3 (2.4%l
16 (L2.8%)
82(6s.6%)3 (2.4%)
13 (10.4%)
7 (s.o%)
78 (72.9%\)
83 (s9.7%)
3 (2.2%l
6(4.3%l
13 (7.r%)
26(1,4.7%)
734 (72.8%)
3 {r.6%l6(3.3%l
7 (4.7%)
20 (1]-.7%)
728 (74.9%)
2(r.2%lsQ.e%l
7t (7.3%l
24 (16.0%l
tor (67.3%)
o (o.o%)
7 4.7%l
10 (6.s%)
26 (16.8%)
106 (68.4%)
2 (t.3%)
6ß.e%l
60 (4.s%l
760 (12.9%)
8s2 (68.e%l
te (L.s%)
8t (6.s%lBystander CPR
Attempted, n (%)
Who Attempted (available)76 (40.4%l
0
6t (48.8%l
0
60 (48.0%l
0
7t (s1..1%)
0
e2(s0.0%)
0
89 (s2.0%l
70
82(54.7%)
82
93 (60.0%) 624 (s1.A%l
93 245

Date Range: Ot/Ot/2006 - !2/3t/2O13Country: Canada
Subset: None
Table 1f: Descriptive Stat¡stics
year 2006 2007 2008 2009 20L2 20132010 2011 OVERALL
66\7 7t3t 725I 8149 9247 9880 10139 10529 68937
untreated,n(%l 2713(4t.0%l 2884(40.4%) 2954(40.7%1 355L(43.6%) 4tt6(44.s%l 4358(44.L%) 4635(4s.7%) 4852(46.1%1 30063(43.6%lrreated, n (%l 3904 (s9.0%l 4247 (s9.6%l 4297 (5s.3%l 4s981s6.4%) st25 lss.s%) ss22 (ss.g%l ss}4 (54.3%',) s677 (s3.9%l 38874 (s6.4%',)
Age
Treated Arrests Median (lQR)
Treated Arrests Mean (sd)
Untreated Arrests Median (lQR)
Untreated Arrests Mean (sd)
70.0 (2s.0) 70.0 (26.0) 6e.0 (24.0) 70.0 (2s.0)
66.0 (18.7) 66.6 (1s.3) 66.2 (18.8) 67.0 (18.s)
70.0 (28.0) 7O.O (27.01 70.0 (26.0) 69.0 (27.0)
6s.0 (26.0) 6e.0 (24.0) 6s.0 (2s.0) 6s.0 (2s.0) 70.0 (2s.0)
66.3 (1s.1) 66.3 (18.6) 66.7 (1s.0) 66.6 (1e.1) 66.s (18.s)
68.0 (27.0) 68.0 (27.0) 6s.0 (27.0) 6s.0 (26.8) 6s.0 (27.0)
66.7 (18.1) 66.6 (18.4) 66.8 (18.1) 66.4 (18.4) 66.s (18.1) 66.8 (17.9) 67.s (18.2) 67.6 (r7.91 67.1 {18.1)Male, n (%)
Treated n (%)
Untreated n (%)
2s37 (6s.0%',) 2692 (63.4%l
1606 (s9.2%) t4O4 (s9.8%l2824 (6s.8%l 2987 (6s.O%l
46 (6O.s%) s76 (s7.7%l3331 (6s.0%) 361s (6s.s%)
89s (61.6%) 2272 (60.s%l3s64 164.8%1 37OO (6s.2%) 2s2s! (65.0%l
2870 (60.6%) 3000 (61.8%) 12609 (60.s%)
Race
White, n (%)
Non-white, n (%)
Unknown, n (%)
0 (0.0%)
0 (0.0%)
0 {0.0%)0 (0.0%)
0 (0.0%)
0 (0.0%)
0 (0.0%)
0 (0.0%)0 (0.0%)
0 (0.0%)o (0.0%)
0 (0.0%)0 (0.0%)
0 (0.0%)0 (0.0%)
0 (0.0%)0 (0.0%)
0 (0.0%)
3904 (100.0%) 4247 (100.0%1 4297 (tOO.O%l 4s98 (100.0%) s12s (100.0%) ss22 (!oo.o%l ss04 (100.0%) s677 (too.o%l 38874 (100.0%)
EthnicityHispanic, n (%)
Non-Hispanic, n (%)
Unknown, n (%)
0 (0.0%) o (o.o%) o (o.o%)
0 (0.0%) 0 (0.0%) 0 (0.0%)
3904 (1"00.0%) 4247 (].OO.O%) 4297 l7OO.O%l
0 (0.0%) 0 (0.0%)
0 {0.0%) 0 (0.0%)
4s98 (100.0%) s12s (100.0%)
0 (0.0%) 0 (0.0%)
0 (0.0%) 0 (0.0%)
ss22 (roo.o%l ss04 (100.0%)
0 (0.0%) 0 (0.0%)
0 (0.0%) o (o.o%)
s677 (tOO.O%l 38874 (100.0%)
Cause of Arrest
No obvious cause, n (%) 3st7 (so.7%l 393s (92.7%1 4O6s (s4.6%l
Obvious cause, n (%) 367 (9.4%) 309 (7.3%l 227 (5.3%l
43ss (94.7%) 4872 (9s.1%\
23s (s.2%l 2s2(4s%ls088 (92.r.%) s0s4 (91.8%)
43t (7.8%l 448 (8.7%l
s232 (92.2%) 36118 (92.9%l
44s (7.8%l 2778 (7.0%)
Witness Status
EMS, n (%)
Bystander, n (%)
None, n (%)
Unknown, n (%)
387 (9.9%l 427 (r}.7%l7638 (42.0%) t73O (40.7%l
1847 (47.3%1 2O4O (48.0%l
32 (0.8%) 47 (7.1%)
4s3 (10.s%) 472(].0.3%l
1692 (39.4%1 1-819 (39.6%)
2732 (4s.6%l 2274 (4s.s%l
17 (0.4%l 30 (0.7%l
s7o (1L.1%l 63r(77.4%)!981 (38.7%1 2]-33 (38.6%l
2s24 (49.2%) 2730 (49.4%)
4s (o.s%l 2s (o.s%l
660 (72.0%) 670 (77.8%1 4270 (tt.O%)2O7O (37.6%1 2t6O (38.O%l 75223 (39.2%l
27s3 (sO.O%) 2834 (49.9%l 79134 (4s.2%l
27(0.4%l t3 (0.2%l 230 (0.6%)
lnitial EMS Rhythm
wlvt,n(%lPEA, n (%)
Asystole, n (%)
No Shock/No Strip, n (%)
Cannot Dete¡mine, n (%)
940 (24.1%\
728 (]'8.6%l
1s3s (3e.3%)
so3 (L2.9%)
s4 (t.4%)
990 (23.3%)
764 (18.O%l
t77s (4O.s%)
s7s (t3.s%)
81(1.s%)
TOO9 (23.s%l
869 (2O.2%)
r74s (40.6%)
47 (L.t%\)
s32 (t2.4%l
7044 (22.7%l
97L(21.t%)1830 (39.8%)
16s (3.6%)
476 (r0.4%)
1171(20.6%\
7344 (23.t%l
2678 (47.2%)
304 (s.4%l
30 (0.s%)
8676 (22.3%l
8046 (2O.7%)
76ss7 (42.6%l
330s (8.s%)
7318 (3.4%l
tt22 (27.9%) 1789 (27.s%)
7072 (t9.7%l t77O (27.2%)
2074 (40.s%l 2409 (43.6%l
747(t4.s%) sso (1.0.7%)
40 (0.8%) s0 (0.s%)
t2LL(22.0%)rr88(21.6%)2s67 (46.6%l
380 (6.9%)
ss (1.0%)
Bystander CPR
Aüempted, n (%)
Who Attempted
t23O (315%l t4t7 (33.4%)
00t489 (34.7%'t 16:j7 (3s.2%l
00L874 (36.6%1 27s3 (3s.7%)
0 1601
2164 (3s.3%l 2323 (4O.s%) 74307 (36.8%)
2164 2323 6088

Date Range: Ot/0]./2006 - t2l3tl2\r3Country: Canada
Subset No obvious cause (cardiac et¡ology)
Table 1g: Descr¡pt¡ve Statistics
year 2006 20a7 2009 2010 2017 2012 2013 OVERALT2008
5807 5492 4070 4356 4873 5054 5232 399725088Untreated, n (%) 2290 (39.40/"1 ts57 128.4%l s (o.r%l L (O.O%l 1(0.0%) 0 (0.0%) 0 (0.0%) oß.0%l 3854 (9.6%)
Treated, n (%) 3sr7 (60.6%l 393s 171.6%l 4o6s (99.9%1 43ss (100.0%) 4872(rOO.O%l s088(100.0%) s0s4 (100.0%) 5232(LOO.O%\ 361L8ß0.4%lAge
Treated Arrests Median (lqR)
Treated Arrests Mean (sd)
Untreated Arrests Median (lQR)
Untreated Arrests Mean (sd)
71.0 (23.0)
67.7 (L7.31
7r.o (26.01
68.2 (t7.31
7t.o (24.01
68.0 (17.9)
70.o (27.O\
67.e (t7-71
70.0 (Z4.Ol
67.2 (18.0)
63.0 (23.0)
70.6 (16.1)
71.0 (23.0)
68.0 (r7.71
8o.o (o.o)
80.0 (NaN)
70.0 (2s.0)
67.1 (18.4)
88.0 (0.0)
88.0 (NeN)
70.0 (24.0)
673 07.81NA (NA)
NaN (NaN)
70.0 (2s.0)
67.9 (18.1)
NA (NA)
NaN (NaN)
70.0 (24.0) 70.0 (24.0)
67.e (18.2) 67.6 (18.0)
NA (NA) 71.0 (27.01
NaN (NaN) 68.! (L7.41
Male, n (%)
Treated n (%)
untreated n (%)
2293 (65.2%\
1336 (s8.3%)
2490 (63.3%l
940 (60.4%l
2668 (5s.7%)
z(4o.o%l2833 (6s.!%l
0 (0.0%)3ßr(64.9%l
0 (0.0%)
33s6 (66.0%)
0 (NaN)3260 {64.s%)
0 (NaN)3407 (6s.r%l 23468 (6s.O%\
0 (NaN) 2278 ß9.I%lRace
White, n (%)
Non-white, n (%)
Unknown, n (%)
0 (0.0%)
0 (0.0%)0 (0.0%)
0 (0.0%)o (o.o%)
0 (0.0%)
406s (100.0%)
0 (0.0%)
o (o.o%)
o (o.o%)
0 (0.0%)0 (0.0%)
0 (0.0%)
0 (0.0%)
0 (0.0%)0 (0.0%)
0 (0.0%)0 (0.0%)
0 (0.0%)
3s17 (100.0%) 393s (100.0%) 43ss(100.0%) 4872(700.0%\ s088 (100.0%) s0s4 (100.0%) s232(LOO.O%) 36118(100.0%)Ethnicity
Hispanic, n (%)
Non-H¡spanic, n (%)
Unknown, n (%)
0 (0.0%)
0 (0.0%)0 (0.0%)
0 (0.0%)0 (0.0%)
0 (0.0%)
0 (0.0%)
0 (0.0%)o (o.o%)
0 (0.0%)0 (0.0%)
o (o.o%)
0 (0.0%)
0 (0.0%)o (o.o%)
o(o.o%\0 (0.0%)
0 (0.0%)
3sr7 {.1oo.o%l 3935 (100.0%) 406s (100.0%) 43ss (100.0%) 4872(roo.o%) s088 (100.0%) s0s4 (100.0%) 5232 (100.0%) 36118 (100.0%)
Cause of ArrestNo obvious cause, n (%) 3s17 (100.0%) 393s (100.0%) 406s (100.0%) 43ss (100.0%) 4872(tOO.O%l
Obvious cause, n (%) 0 (0.0%) 0 (0.0%) 0 (0.0%) 0 (0.0%) 0 (0.0%)
s088 (100.0%) s0s4 (100.0%)
0 (0.o%l 0 (0.0%)
sz3z (Loo.oo/"| 36118 (100.0%)
0 (0.0%) 0 (0.0%)
Witness Status
EMS, n (%)
Bystander, n (%)
None, n (%)
Unknown, n (%)
3s3 (10.0%)
1516 (43.1%l
7677 146.0%l
31 (0.e%)
400lro.2%l1649 (4L.9%l
tsaa $6.9%l4r(r.0%l
434 (!0.7%l
764s ( 9.s%l
1970 (48.s%l
t6 (0.4%l
4s6 (10.s%)
t762 (40.s%l
2109 148.4%l
28(0.6%l
556117.4%l
r9o9 (39.2%l
z3s8 (48.4%l
44(O.9%\
s82(t1.4%lt99s (39.2%l
2486 (48.9%)
2s (o.s%l
6t3 (t2.t%lL932 (38.2%l
z49O (49.3%l
79 ß.4%l
641G2.3%) 4O3s (t7.2%l
2031 (38.8%) 14439 (40.O%l
2s47(48.7%l ]-742].148.2%l
!3ß.2%\ 217 0.6%lln¡t¡al EMs Rhythm
wNF,nl%\PEA, n (%)
Asystole, n (%)
No Shock/No Str¡p, n (%)
Cannot Determine, n (%)
soe (2s.8%l
644 (18.3%l
1338 (38.0%)
4s3 (12.9%l
4s (!.3%l
974 (24.8%l
7o8(tg.o%l1s4s (39.3%)
s26(t3.4%\78(2.0%l
999 (24.6%'l
8L7 (20.r%l
1618 (39.8%)
44 (t.t%l499 (12.3%l
to26 (23.6%l
922 (Z!.2%\
1706 (39.2%l
1s3 (3.s%)
448(1O.3%l
7ro8122.7%\
s66 (1s.8%)
L942 (39.9%l
694 (74.2%l
38 (0.8%)
n7rQ3.0%\7062 (20.9%l
2t86 (43.0%',)
sz7 $o.4%l4s (0.9%l
7773 (23.2%l
LOA]- (2t.4o/.1
23LZ (4s.7%l
348(6.e%l49 (r.O%\
tLso (22.o%l 8s10 (23.6%)
1239 (23.7%1 7439 (2.0.6%\
2403 (4s.9%l 75Os0 (4r.7%l
277 ls.3%l 3022(8.4%)26(O.s%l L728(3.4%l
Bystander CPR
Attempted, n (%)
Who Attempted
Lay person, n (%)
Police, n (%)
Healthcare worker, n (%)
Other, n (%)
Unknown, n (%)
1118 (31.8%)
0
L3!2(33.3%l
0
].407134.5%l
0
1s36 (3s.3%)
0
7769 (36.3%l
0
2026(39.8%l
t4637tt9176.s%l
r70 (7.s%l
244 (t6.7%l
9 (0.6%\
6 (O. %',t
L977 139.!%lr977
1596 (80.7%)
t42 (7.2%l
224 (t!.3%\36 (1.8%)
e (o.s%)
2129 (4O.7%l
zt29!747 (87.1%l
74016.6%l
243 (tr. %l
23 (1.7%\
1(0.0%)
73268 (36.7%)
5569
446218O.7%l
3ez (7.o%l
717 (12.8%l
681t.2%)16 (0.3%)
Bystander AED Applied, n (%) 30 (0.9%) 49 í.2%l 37 (O.9%\ 64 (t.s%\ 69 lr.4o/o) 82í.6%J 64lt.3%l 95 (7.8%l 49O (t.4%lLocation of episode
Public, n (%)
Home, n (%)
Resident¡al Fac¡l¡ty, n (%)
s7L (!6.2%l
2637 l7s.O%l247 (7.O%l
629 (L6.O%l
2952 (75.O%',1
267 (6.8%\
680116.7%l
3Os7 (7s.2%J
]..89 (4.6%)
6s! (74.9%l
3373|\77.s%l
28416.5%'t
672 (r3.8%l
3832 (78.7%l
313 '6.4%l
786 (t5.4%\
3921 177.r%J
327 (6.4%\
699 (13.8%)
3950 (78.2%l
347 (6.9%l
818 (15.6%) ss06 (1s.2%)
4OZ5 176.9%1 27747 176.a%l
33416.4%1 230816.4%l

Date Range: OI/OL/2O06 - t2/37/2OI7Country: USA and Canada
Subset: None
Table th: Descriptive Statisticsyear 2006 20rt
r.3803 L3574 t47to 19391 19614 20392 1_35901
untreated, n (%) 6000 (43.s%) s94o (43.8%) 67s3 (4s.9%) TssO (46.r%) 8476 (47.0%) 9rs9 (47 .2%) 9304 (47.40/,) 9684 (47.s%l 62866 (46.3%lTreated,n(%) 7803(s6.s%l 7634(s6.2%) 79s7 (s4.t%) 81r8(s3.9%) 9s73(s3.o%l Loz3z(s2.8%) !o3!o(s2.6./"1 toTo}(s2.s%) 73o3s(s3.7%)Age
Treated Arrests Median (lQR)
Treated Arrests Mean (sd)
Untreated Arrests Median (lQR)
Untreated Arrests Mean (sd) 66.6 (18.s) 66.3 (18.8)
66.0 (27.0)
63.6 (2O.2)
69.0 (2e.0)
66.4 (18.8)
67.O (27.O)
64.4 (20.0)
6s.0 (2s.0)
66.2(]i9.2)
67.O (27.O)
64.4 (1e.s)
67.O (27.O1
66.1(19.L)
67.0 (27.O)
64.8 (19.4)
67.0 (28.0)
6s.7 (1e.1)
66.0 (27.0)
64.1 (20.0)
68.0 (2s.0)
66.6 (1e.0)
66.0 (2s.0)
64.4 (!e.4)
67.O (27.0)
66.0 (18.6)
66.0 (26.0)
64.6 (1e.6)
67.o (27.01
66.6 (L8.6)
67.0 (26.0) 67.0 (27.0)
64.s (1s.6) 64.4 (lsJ)67.O (27.01 68.0 (28.0)
Male, n (%)
Treated n (%)
untreated n (%)
4s34 (63.2%1 47ss (62.8%)
3491 (s8.2%) 286! (s8.6%ls0s7 (63.6%) s623 (63.8%)
3s4 (s6.7%\ 1s66 (s8.3%)ssss (62.6%) 6409 (62.7%) 646s (62.8%) 6768 (63.2%1 460s0 (63.1%)
2ss8 (s7.8%) 47s7 (s9.6%) s48s (s9.0%) s83s (60.3%) 273st (ss.o%)Race
White, n (%)
Nonwhite, n (%)
Unknown, n (%)
1s8s (20.3%) 1-296 (t7.O%l !2s2(7s.7%) t483 (!6.8%)
s74 (!2.s%) 72s (s.s%) 646 (8.!%) 74s (8.4%)
s244 (67.2%') s6t3 (735%) 60se (76.1%) 6s90 (74.7%)
Ls78 (t65%) !766 (L7.3%l
e38 (s.8%) r.004 (s.8%)
7Os7 (73.7%) 7462 (v2.e%)
2280 (22.1%1 26t2(24.4%) 13Ss2 (1s.0%)
!!4t (Lt.t%l !448 (L3.s%') 762! (1.0.4%)
6889 (66.8%) 6648 (62.1%) sts62 (70.6%)
EthnicityHispanic, n (%)
Non-white, n (%)
Unknown, n (%)
t42(!.8%) 774(1.s%)24L7 (31-O%) t9O7 (zs.O%',)
s244 (67.2%l s6!3 (73.s%)
eo (t.t%J los (1.2%)
t8o8 (22.7%) 2!22 (24.L%)
6Os9 (76.7%\ 6s9O (74.7%l
t7s (t.s%l t74 (!.7%)
2336 (24.4%) 2se6 (2s.4%\
7Os7 (73.7%) 7462 (72.9%l
!9s (1.s%) 264 (2.s%) !263 (!.7%)
322s (3!.3%) 3796 (3s.s%l 2O2O7 (27.7%)
688e (66.8%) 6648 (62.!%l sts62 (70.6%)
6987 (89.s%) 7Os7 (92.4%l
7ss (1o.2%l s6e (7.s%l7470 (s3.s%) 832]- (94.4%l
467 (s.s%) 474(sA%)s078 (s4.8%) s42t (s2.1%) s444 (st.6%) 9870 (s2.2%) 67648 (92.6%)
493 (s.!%',) 8O8 (7.9%) 863 (8.4%l 837 (7.8%) s3O6 (7.3o/,)
Ethnicity
Hispanic, n (%)
Non-Hispanic, n (%)
Witness Status
EMS, n (%)
Bystander, n (%)
None, n (%)
Unknown, n (%)
732(9.4%) 737 (9.7%) &st(r0.7%)30r,1 (38.6%) 2822 (37.0%) 29t7 (36.7%l
3437 (44.O%) 34ss (4s.8%l 3796 (47.1%',)
623 (8.0%l s72 (7.s%) 37s (4.7%)
984 (LL.2%l 1138 (11.s%)
3284 (37.2%) 3s44 (37.O%)
4093 (46.4%') 4607 (48.L%)
436 (4.9%) 278 (2.9%l
r1s8 (1.L.3%l !274 (t2.4%)
3862 (37.7%) 3739 (36.3%',1
so07 (48.e%) st2o (49.7%l
2O2(2.O%) !76 (1.7%)
t29t (!2.L%) 816s (]-L.2%l
3840 (3s.s%) 27OLs (37.0%)
s377 (s}.z%l 34932 (47.8%)
Ls7 (1.8%l 28ss (3.s%)
lnitial EMs Rhythm
wlvF,n(%lPEA, n (%)
Asystole, n (%)
No Shock/No Strip, n (%)
782s (23.4%)
7604 (20.6%)
3162 (Aj.s%l
s82 (7.s%)
!7O2 (22.3%)
ts3o (2o.o%)
3243 (42.s%l
643 (8.4%)
t792 (22.s%l
t7r8 (27.6%)
3426 (43.1%)
8s (t.L%)
2OL6 (27.1%)
2082(21-.7%l
427s (44.7%)
s27 (e.7%)
!e03 (21.6%)
2O2O (22.s%l
3878 (44.O%)
222(2.s%l
2167 (2L.2%)
228s (22.4%)
4710 (46.0%)
773 (7.6%)
22!3 (21.s%)
241s (23.s%)
4837 (46.9%)
s3s (s.z%l
2t44 (2O.O%l
2s8O (24.1%)
s189 (48.s%)
476 (4.4%l
Ls762(27.6%',)
L6242(22.2%)
32720 (44.8%)
4247 (s.8%)

Date Range: 01/0t/ 2006 - Lzl3tlzltlCountry: USA and Canada
Subset: No obvious cause (cardiac etiology)
Table 1i: Descriptive Stat¡sticsyear 2006 20],ozæ7 2008 2009 20tt 2Ðt2 20t3 OVËRALL
12000 10461 7970 8727 9474 9563 944'r'. 9870 77449untreated, n (%) sor3 (41.8%1 3404 (325%l 44o$.6%l 406 (4.7%l 396(4.2%l 142(L.s%l 0 (0.0%) 0 (0.0%) 9aotí2.7%lTreated, n (%) 6987 (s8.2%l 7057 (67.5%1 7470 (94.4%l 8321 (ss.3%) e078 (9s.8%) 9427 (ge.s%l 9444 (tO0.O%l 9870 (100.0%) 67648 (873%lAge
Treated Arrests Median (lQR)
Treated Arrests Mean (sd)
Untreated Arrests Median (lQR)
Untreated Arrests Mean (sd)
68.0 (26.0)
6s.4 (18.7)
70.0 (28.0)
67.6 (18.21
6e.0 (26.0)
6s.7 (19.0)
70.0 (28.0)
67.0 (18.7)
68.0 (2s.0)
6s.s (18.6)
67.0 (30.0)
67.8 (17.61
68.0 (2s.0)
6s.s (18.6)
69.0 (31.0)
68.s (18.6)
67.0 (26.0)
6s.0 (19.4)
69.0 (31.0)
59.4 (18.3)
67.0 (25.0)
6s.s (18.s)
72.O (28.01
71.6 (77.oJ
67.0 (2s.0)
6s.s (18.6)
NA (NA)
NaN (NaN)
68.0 (2s.0)
6s.8 (18.7)
NA (NA)
NaN (NaN)
68.0 (2s.0)
6s.6 (18.8)
70.0 (29.0)
67.6 (18.4)
Male, n (%)
Treated n (%) 4423 (63.3%1 442s (62.7%\ 4745 163.s%luntreated n (%) 289o(s7.7%l 2003 (s8.8%) 246(s6.3%)
s2s7 (63.7%l s681 (62.6%)
24A $9.4%\ 239 (67.0%\s92s (62.9%l s918 (62.7%\ 6277 (63.0%1 4263r (63.Oyo\
79 \s6.O%l 0 (NaN) 0 (NaN) 5697 (s8.2%l
Race
White, n (%)
Non-white, n (%)
Unknown, n (%)
t4t9 (2O.3%l 7784 (L6.8%l
877 (12.6%1 6s8 (9.3%)
469! (67.t%l szLs (73.9%l
1160 (ls.s%) 7368 (76.4%l
sgr1.g%l 7oL(8.4%l
s7L9(76.6%1 62s2(75.t%l
t489 (16.4%1 7ss2 (76.9%l
8s6 (s.s%) s33 (e.g%l
6693 (73.7%1 6896 (73.2%l
2077 (Zz.Oyo)
to48(!t.t%l6319 (66.9%)
24t8 (24.s%l 12707 (78.8%l
t34s (L3.6%l 7049 (7O.4%l
6to7(6l-.9%\ 47892(70.8%l
Ethnic¡ty
Hispanic, n (%)
Non-Hispanic, n (%)
Unknown, n (%)
774(7.6%1 7o2(t.4%l2782(37.2%1 7740(24.7%l4691(67.1%\ sz1sl73s%\
gt(t.t%l 93(1.7%1 767 (7.8%l
1670 (22.4%l 1976 (23.7%1 2278124.4%',)
s779 (76.6%1 62s2(7s.7%l 6693 (73.7%l
7s8(r.7%l 172(r.8%l2367 (zs.r%l 29s3 (3t.3%)
6896 (73.2%1 6319 (66.9%)
240(2.4%) 7727 (1.7%l
3s23 (3s.7%l 18629 (27.s%l
6to7(6L.9%l 47892(70.8%lCause of Arrest
No obvious cause, n (%) 6987 (100.0%)
Obvious cause, n (%) 0 (0.0%)
70s7 (100.0%) 7470 (1OO.O%\
o (o.o%) o (o.o%)
8321 (100.0%) 9078 (100.0%) 942r (7OO.O%| 9444 (100.0%) 9870 (100.0%) 67648 (100.0%)
o (0.0%) 0 (0.0%) 0 (0.0%) 0 (0.0%) 0 (o.o%) 0 (0.0%)
W¡tness Status
EMS, n (%)
Bystander, n (%)
None, n (%)
630 (s.o%)
2780(39.8%l
3O7O (43.r%l
677 (9.6%1 802110.7%1 93s (77.2%)
2672 (37 .gyol 28OZ (37.5%l 3168 (38.1%)
3764 (M.8%l 3s76 (47.7%\ 3810 (4s.8%)
543 (7.7%\ 3so(4.7%l 408(4.9%\
1088 (12.0%) t1s9 (:^7.2%l
34OO (37.5%l 3611 (38.3%)
4377 (47.5%\ 4s56 (t48.4%l
274 (3.0./"',) 795 (2.1%\
1t7Z (72.4%1 72Os (72.2%1 7s68 (r7.2%l
3482(36.s%l 3s96(36.4%l 2ss77(37.7%l462s (49.O%l 4879 (49.4%1 31877 (47.t%l
r6s (7.7%l 787 (7.9%\ 2689 (4.O%lUnknown, n (%) 567 (8.1%\
lnitial EMS Rhythm
wNF,n(%)PEA, n (%)
Asystole, n (%)
No Shock/No Strip, n (%)
Cannot Determine, n (%l
7777(25.3%1 1662(23.6%l1393 (19.9%) 7393 (79.7%l
2762(39.s%l 294014t.7%l
sr6(7.4%\ s9r(8.4%l
777s 123.8%1 7874 (22.s%l
1s88(2|.3%l L9O7(22.9%l
3174(425%1 3617143.4%l
78(t.O%l 206(2.s%l
7990 (21.9%l Zr25 (22.6%1 2143 (22.7%l
19s4(275%l 2062(2r.9%1 2!91(23.2%l4009 (44.2%1 4279 (4s.4%) 43s7 (46.t%l
872(s.6%l 7os (7.s%l 48s (s.2%)
2to3 (27.3%l rs443 (22.8%l
23s6 (23.9%1 14844 (27.9%l
4696147.6%1 29822(44.1%\43314.4%1 38s0 (s.8%)
32s (4.7%l 324 (4.6%l 682(9.7%l s48 (6.6%) ss (1.0%) 100 (1.1%) rr9 (1.3%l 79rc,8%l 2272(3.4%lBystander CPR
Attempted, n (%)
Who AttemptedLay person, n (%)
Police, n (%)
Healthcare worker, n (%l
Other, n (%)
2311(33.1%)
0
2416 (34.2%)
0
2688 (36.0%)
0
3779 (37.s%l
0
3398 (37.4%l
0
366s (38.9%)
2656
1886 (71.0%)
!9t (7.2%l
602(22.7%l
1s (0.6%)
38s6 (40.8%)
38s6
2887 (74.9%l
z9t (7.5%l
713 (18.s%)
s6 (1.s%)
23ß.6%l
4771(4!.7%l4rr7
2983 (72.6%l
334 (8.1%)
849 (2O.7%\
32(O.8%l
70rc.2%l
2s564(37.8%l10623
77s6 (73.O%l
8!6 (7.7%l
2164 (2O.4%l
103 (1.0%)
s7 ß.5%lUnknown,n(%) - 24(O.9%l
Locat¡on of episode
99 (7.4%l 1O7 (7.4%\ 98 (1.3%) r40 (1.7%l ts8(1.7%l 166 (1.8%) 760 tl.7%l 20s (2.7%l rr27 í.7%lBvstander AED Applied, n (%)

Date Range: OL|OL|ãOI3 - 12/3L/20L3Country: USA and Canada
Table 2: lncidence
Coundr,y OVERALL
Person-Years 7767584 L0264382 18031966
# of total Cardiac Arrests 9695 991r 19606
lncidence Rates per 100,000 person years
Overall
EMS Treated
EMS Untreated
724.8
63.8
6r..1
96.6
52.2
44.3
108.7
57.2
51.5
Gender
Male
Female
15L.8
97,5
L32.9
67.4
r47.180.3
Age
<18
18-39
40-64>64
10.1
33.5
737.3
553.5
87
467
10.1
33.5
108.1
501.5
Race
WhiteNon-White
44.4
s6.6
44.4
56.6
EthnicityHispanic
Not Hispanic
21,.4
71.7
2r.47r.7
Treated Cases only:
tnitial Rhythm wvFWitnessed
Non-witnessed
12.3
8.1
3.8
Lt.48.6
2.8
11.8
8.4
3.2
lnitial Rhythm PEA
Witnessed
Non-witnessed
L4.2
9.7
4,3
75.7
10.1
5.0
13,1
9.3
3.7
lnitial Rhythm Asystole
Witnessed
Non-witnessed
31.9
9.2
27.6
26.t7,3
18.8
28.6
8.1
20.0
EMS Witnessed 29.2 27.6 28.3
Bystander Witnessed 27.6 29.6
No obvious cause 51.0 54.3
Site
Alabama
Dallas
MilwaukeePittsburghPortland
Seattle/King County
EMS Assessed
106.0
130.0
191.3
IsL.275.2
122.4
EMS Treated32.5
74.6
9L.9
69.4
49.7
63.0

Date Range: OL/OL/201L - I2/31./20ttCountry: USA and Canada
Subset: None
Table 3a: Outcomes
Survival rate by treatment status, n (%)
EMS Assessed
EMS Treated
s31 (s.6%)
537 (71..3%')
486 (s.4%l rO77 (s.s%)
486 (10.3%1 1,017 (10.8%l
Location of discharge , n (o/o of survived)
Home
I npatient rehabilitation facilityAssisted Living
Nursing home
2s6 (48.2%l
ee (1J.L%)
18 (r.7%l
e3 (1s.3%)
24O (4s.4%l 4s6 (48.8%l
es (8.2%l ee (s.7%l
78 (1.9o/o) t8 (7.8%l
e3 (2.5%) s3 (e.1%)
Survival by Age Category, n (%)
<19
18-39
40-64>65
14 (8.4%l
36 (s.8%l
282 (14.9%)
ts7 (8.8%)
10 (t0.2%',)
38 (13.7%)
249 (rs.6%)
L87 (6.e%l
24 (s.L%)
74 (rl.s%)s31. (ts.z%l384 (7.7%)
Survival by Gender, n (%)
Female
Male
1.8s (s.7%) L28 (8.2%l
3s8 (r1..4%)
313 (e,0%)
Survival by Race, n (%)
WhiteNon-whiteUnknown
346 Í2.4%
22r (Lzs%)
92 {9.2%l2L8 (Lt.3%')
704 ft\s%
0 (NaN) 22I (tz.s%l0 (NaN) 92 (9.2o/o)
486 (10.3%) 7O4 (10.6%l
Survival rate by initial EMS rhythm, n (%)
VT/VF
PEA
Asystole
No Shock-No Strip
Cannot Determine
2e3 (30.O%l
tLe (L0.7%')
s3 (2.3%l
1,s (8.2%l
26 (38.2%)
307 (2s.s%l 600{.2e.7%l
s3 (8.3%) 2O2 (9.60/o)
2r (r.oo/ol 74 (7.7%l
2e (s.s%l 44 (6.2%l
e (te.6%) 35 (30.7%l
Survival rate by witness status, n (%)
Witnessed
Non-witnessed
3s2 (r7.4%)
129 (s.7%)
406 (17.2%) 7e8 (17.3%l
7e (3.4%l 2o8 (4.s%l
Survival rate by initial rhythm + witness status, n (%)
VT/VF + witnessed
VT/VF + unwitnessed
PEA + witnessed
PEA + unwitnessed
Asystole + witnessed
Asystole + unwitnessed
234 (35.0%l
s3 (18.6%)
74 (1O3%)
44 (1.1.s%)
3s (4.9%)
271{.34.5%)
36 (14.3%)
62 (8.e%l
20 (6.e%l
t7 (2.9%)
4 (0.3%)
sos (34.8%)
8e (16.6%)
136 (e.6%l
64 (9.7%)
s2 (4.O%l
22 (0.8%)
Survival rate by who started CPR, n (%)
Bystander CPR
EMS CPR
248 (13.7%l 23O (12.1%l
13s (6.0%)
478 (rz.e%)
326 (7.2%l191 (8.
Neurologic Status at discharge , n (% of available and survived)

Date Range: OU)t/2Olt - 12/31,/201,1
Country: USA and Canada
Subset: No obvious cause (cardiac etiology)
Table 3b: Outcomes
Country Canada
Survival rate by treatment status, n (%)
EMS Assessed
EMS Treated 484 (77.2%1 448 (70.3%) 932 (1.0.8%',)
Location of discharge, n (% of survived)
Home
lnpatient rehabilitation facilityAssisted Living
Nursing home
234 (48.3%')
e0 (11*o%l
L3 (1.4%)
83 (7s.3%l
226 (s0.4%)
eo (8.3%)
L3 (r.3%)
83 (2.0%l
460 (49.4%')
eo (e.7%l
73 (7.4%)
83 (8.e%)
Survival by Age Category, n (%)
<19
18-39
40-64>65
1.0 (8.3%)
24 (8.7%)
260 (1"4.8%)
18e (8.8%)
e (72.7%l
26 (r3.0%)
234 (1.6.0%)
178 (6.9%l
te (s.e%l
s0 (10.s%)
494 (7s.4%l
367 (7.8%l
Survival by Gender, n (%)
Female
Male
162 (s.2%)
322 (12.s%)716 (8.2%l 278 (8.7%l
332 (77.4%) 654 (77.9%'t
Survival by Race, n (%)
WhiteNon-whiteUnknown
200 (12.6%)
87 (e.3%)
Le7 (1.0.e%l
0 (NaN) 2oo (t2.6%)
0 (NaN) 87 (s.3%l
448 (10.3%) 64s (70.s%l
Survival rate by initial EMS rhythm, n (%)
VTIVF
PEA
Asr¡stole
No Shock-No Strip
Cannot Determine
286 (3}.Oo/ol
e8 (e.8%)
4s (2.2%l
73 (7.3%'t
20 (36.4%l
304 (2e.6%)
64 (7.1%l
17 (0.9o/o)
20 (4.3%)
I (ls.s%l
sgo (29.8%)
162 (8.s%l
62 (t.6%l
33 (5.to/ol
28 (2e.2%)
Survival rate by witness status, n (%)
Witnessed
Non-witnessed
36s (77.5%l
1,1,0 (5.3%l383 (77.s%l 748 (77.s%')
64 (3.0%l 774 (4.2%')
Survival rate by initial rhythm + witness status, n (%)
VT/Vt + witnessedVT/VF + unwitnessedPEA + witnessedPEA + unwitnessed
Asystole + witnessed
Asystole + unwitnessed
229 (34.9%)
st (78.7%)
64 (10.0%)
33 (r.0.1%)
37 (4.7%',)
74 (r.1%l
269 (34.7%',1
3s (1.4.2%)
s7 (8.1%'t
72 (4.6%l
ts (2.8%)
2 (0.2%',)
4s8 (34.8%l
86 (16.s%)
tLs (e.o%l
4s (7.7%)
46 (3.s%l
t6 (0.6%)
Survival rate by who started CPR, n (%)
Bystander CPR
EMS CPR
22s (L3.8%)
t76 (8.4%)
21.8 (1,2.s%) 443 (73.r%)
11e (s.8%) 2ss (7.1%l
Neurologic Status at discharge, n (% of available and survived)

Date Range: OL/OL/2O06 - t2/3L/2011,Country: USA
Subset: None
Table 3c: OutcomesYear 2008
Survival rate by treatment status, n (%)
EMS Assessed
EMS Treated
386 (s.4%l
386 (e.e%)
330 (s.1%) 433 (s.8%) 436 (s.3%l
33O (s.7%) 433 (L1.8%) 436 (10.3%)
Location of discharge , n (% of survived)
Home
lnpatient rehabilitation facilityAssisted Living
Nursing home
28 (7.3%',)
11. (2.8%l
1. (0.3%l
1.8 (4.7%)
s3 (16.1%)
te (s.8%)
o (o.o%)
3r (9.4%',)
186 (43.0%)
46 (70.6%)
7 (0.2%l
7s (r8.2%l
205 (47.0%')
s3 (12.2%l
7 (1.6%l
78 (r7.9%l
Survival by Age Category, n (%)
<18
18-39
40-64>65
t0 (s.6%l
39 (tt.e%)1,8e (72.s%l
t48 (7.9%')
I (6.7%l
34 (1.r.7%l
780 (L3.r%)
r07 (6.7%)
e (7.s%l
43 (74.6%l
21,8 (1,s.2%)
163 (e.t%l
1.4 (L0.8%)
4s (13.0%l
22s (r3.3%l
rsz (7.5%)
Survival by Gender, n (%)
Female
Male
122 (8.1%) 70o (7.8%) 1.33 (e.3%l 138 (8.7%')
264 (1J,0%) 23O $As%l 3OO (73.4%l 2e8 (r7.3%\
Survival by Race, n (%)
White
Non-white
Unknown
t4s (e.4%l r28 (e.e%l
64 (6.6%1 46 (6.3%l
173 (L2.e%l 7s6 (r7.4%l
r72 (13.7%l 167 (Lt.3%l
7s (7r.6%) 62 (8.3%l
186 (10.6%) 207 (t0.4%)
Survival rate by initial EMS rhythm, n (%)
VTIVF
PEA
Asystole
No Shock-No StripCannot Determine
22s (2s.4%l
69 (7.e%')
2s (L.s%)
s (tr.4%)31. (e.5%)
195 (27.4%I
6s (8.s%)
3r (2.0%l
to (14.7%)
1.s (s.7%)
2ss (32.6%',)
e3 (71.0%)
30 (1.8%)
7 (t8.4%)
22 (11..7%l
234 (27.2%)
1oo (e.s%)
46 (2.2%l
6 (1.0.s%l
1.3 (1.2.0%l
Survival rate by witness status, n (%)
Witnessed
Non-witnessed
291 (L6.9%'t 243 (17.3%)
72 (4.s%l 67 (4.6%)
337 (20.4%) 328 (16.6%)
74 (4.4%l 72 (4.0%)
Survival rate by initial rhythm + witness status, n (%)
VTIVF + witnessed
VT/VF + unwitnessedPEA + witnessed
PEA + unwitnessed
Asystole + witnessed
Asystole + unwitnessed
1,87 (3L.7%')
29 (7s.7%)
44 (8.6%l
20 (7.4%)
t4 (3.3%l
9 (1,.O%l
ts7 (33.e%l 2r3 (4o.4%l
2s (1s.4%l 32 (1.s.7%)
39 (9.0%') 62 (11'8%l
24 (s.2%) 2s (e.7%l
22 (s.6%) t7 (3.s%l
7 (0.8%) 12 (r.1%l
rs4132.6%l
3r (15.O%')
7t (to.e%l22 (7.r%l30 (4.8%l
e (0.8%)
Survival rate by who started CPR, n (%)
Bystander CPR
EMS CPR
766 (L2.6%l ].43 (72.O%) 7e7 (L{.so/ol Ls7 (Lt.s%)
188 (e.7%l 1,s6 (ro.7%l r47 (70.L%) L3e (8.2%l
Neurologic Status at discharge , n (% of available and survived)

2010 e011 OVERAIL
490 (5.60/ol s31 (s.6%) 2606 (s.s%)
4s0 (n.o%l s3L (1,L.3%l 2606 (7O.7%l
87 (17.8o/ol
t4 (2.e%l
o (0.0%)
27 (s.s%)
2s6 (48.2%l
se (tt.t%I9 (1,7%l
81(1s.3%)
81s (31.3%)
2O2 (7.8%l
1.8 (o.7%l
31,4 (L2.0%)
It (6.3%) L4 (8.4%l 66 (7.4%l
44 (11..e%l 36 (e.8%) 241, (L2.7%)
240 (73.6%) 282 (t4.e%l 7334 (13.8%')
tes (s.z%l Le7 (8.8%) e62 (8.3%l
160 (e.o%) LBs (e.7%) 838 (8.8%)
330 (L2.4%l 346 (72.4%1 1768 (17s%l
168 (t0.6%l 22L (12.5%l LO05 (r7.2o/ol
74 (7.s%l s2 (s.2%) 473 (8.2%\
248 (12.8%) 2L8 (tL.3%l 1188 (11.s%)
2s8 (28.e%l
r22 (t1,.4%l
6t (2.8%l
L4 (7.s%l
t2 (te.7%l
293 (3O.0%'t
7Le (1o.7%l
s3 (2.3%l
Ls (8.2%l
26 (38.2%')
L46O (28.6%l
s68 (e.e%)
246 (2.2%)
61 (10.0%)
ttg (Lr.6%l
372 {t7.s%ltog (s.2%)
3e2 (t7.4%) 7e57 (77.6%)
tze (s.7%) s22 (4.8%)
zoe (33.7%l
4s (t8.6%)
86 (L2.3%l
32 (10.3%l
37 (s.6%l
24 (L.7%l
234 (3s.0%l
53 (L8.6%)
74 (1O3%l
44 (7t.9o/ol
3s (4.e%l
L8 (1.2%)
tL94 (34,3%l
2re (76.7%l
376 (1,0.6%l
L67 (9.4%')
Lss (4.8%l
7e (7.r%l
2t4 (t2.4%l 248 (r3.7%) Ttse (72.8%)
r82 (8.6%1 1e1 (8.s%) t0o3 {e.2%l

Date Range: Ol,lOt/2O06 - !2/3!/20!7Country: USA
Subset: No obvious cause
Table 3d: Outcomes
Year 2005 2007 2010 20L7 OVERALL20092008
Survival rate by treatment status, n (%)
EMS Assessed
EMS Treated 33s (s.7%) 28e (s.3%l 394 (t!.6%) 3es (10.0%) 4s7 (10.9%) qaq lJ.zy") zzs+ 1to.su"¡Locat¡on of discharge, n (% of survived)
Home
I npatient rehab¡litation facilityAssisted Living
Nursing home
22(6.6%)
s (2.7%)
!(o3%lt6 (4.8%',)
48(16.6%l
t7 (s.s%l
o (0.0%)
28(s.7%)
!77 (44.s%)
46 (tt.7%)t(o.3%)
72(183%)
t94 (49.t%)
48(t2.2%l6 (t.s%\
69 (!75%)
82(77s%)L2(2.6%)
o (o.o%)
26 (s.7%l
234 (483%1 757 (32.2%',1
s3 (!!.o%) 185 (7.9%l
7 (1.4%) ls (0.6%l
74 (ts.3%) 28s (12.!%',)
Survival by Age Category, n (%)
<19
L8-39
40-64>65
3 (2.6%l
23 (tO.O%)
t70 (L2.6%l
139 (7.9%l
4(4.t%')2s (11..o%)
t62(tz.s%ls8 (6.4%)
3 (3.7o/o)
3s (!4.8%l
2O2(ts.O%l
754 (9.Oo/o\
7 (7.O%l
3e (t4.2%)
206 (t3.O%l
t43 (7.2%l
s (6.0%l
38(!2.s%)222(13.2%)
188 (s.1%)
10 (8.3%) 36 (s.4%l
24(8.7%) r84(!!.s%)260 (t4.8%) t222 (1.3.6%l
189 (8.8%) gtt (8.!%)
Survival by Gender, n (%)
Female
Male
1O2(7.6%l
233 (!O.e%l87 (7.3%',)
2O2(!O.4%l
tt7 (8.8%)
277 (t3.3%)12s (8.3%)
27O(n.O%\t44 (8.6%)
3t3 (12.4%)
162(9.2%') 737 (8.4%l
322 (t2.s%l 16!7 (!!.8%lSurvival by Race, n (%)
WhiteNon-whiteUnknown
73O (9.2o/")
so(s.7%)
tss (t3.2%)
106 (s.o%)
38 (s.8%)
t4s (LL.3%)
1s8 (13.6%)
68 (11.s%)
168 (10.2%)
1s1(1L.0%)
s7 (8.!%)
t87 (s.s%)
ts4(1o.3%)70 (7.8%l
233 (!2.8%',)
200 (t2.6%) 8ss (10.s%)
87 (e.3%) 37O(7.s%)
197 (tos%l 108s (11.3%)
Survival rate þy initial EMS rh¡hm, n (%)
\rr/VFPEA
Asystole
No Shock-No Strip
Cannot Determine
222(2s.8%)
44(s.9%)
t8(t.3%)6(s.s%)20(7.!%)
791(27.8%)
43 (6.3%)
2s (1.8%l
8(72.3%ltt(4.s%\
2s3 (32.6%)
72(93%l27 (7.7%l
7 (20.6%')
L8 (e.8%)
23O(27.!%)
88 (8.s%)
40 (2.t%l
4(7.s%)s (s.0%)
2s6 (2s.O%)
tot(!0.2%ls8(2.8%)
L2(6.7%l
8(74.0%)
286 (30.0%)
s8 (s.8%)
45 (2.2%)
t3 (7.3%l
20 (36.4%)
t438 (28.7o/ol
446 (8.6%)
2t3 (2.O%l
so (8.8%)
86 (e.3%)
Survival rate by w¡tness status, n (%)
Witnessed
Non-witnessed
262(t7.O%)
ss (3.e%)2!7 (L6.7%l
s6 (4.2%l306(20.1%)
68 (4.4%)3Os (16.4%l
6s (3.8%)3s3 (17.4%)
s4 (4.8%)36s (77.s%) t8t2 (77.s%)
110 (s.3%) 448 (4.s%)
Survival rate by initial rhythm + witness status, n (%)
W/VF + witnessed 18s (31.6%) lss (34.8%l 212(4O.s%) tso (32.4%l 208 (33.e%) 229 (34.9%) 1179 (34.6%)

Male t!(64.7%) 3s (62.s%l
Neurologic Status (MRS <=3) at discharge by Race, n (o/o of available and survived)
!69 (7s.t%',) !6(76.2%) ss3 (72.2%l
L79 (72.6%) 298 (70.8%)
44 (64.70/,) tt]. (64.2%)White
Non-white
Unknown
t(2s.o%) 4(so.o%)
0 (NaN) 4 (L00.0%)
82(69.s%\
3L(64.6%l
82(6s.s%l
85 (72.60/.1
30 (s8.8%)
11s (s8.3%)
7 (70.0%)
2$oa.o%l16 (160.0%)1s (37s.0%) 37 (462.s%)

Date Range: 0L/OL/2OO6 - t2/3L/2}tlCountry: USA
Subset: Pediatric (age <=18 years)
Table 3e: Outcomes
Year 2010 20tLSurvival rate by treatment status, n (%)
EMS Assessed
EMS Treated
to (4.4%l
Lo (s.3%ls (s.s%)
s (7.2%)
10 (6.s%)
10 (8.0%)
t6 (s.4%l
L6 (r]-s%lt4 (6.4%l
t4 (7.6%)
ts (7.L%) 74 (6.s%l
1s (8.8%) 74 (7.s%)
Location of discharge, n (Yo of survived)
Home
lnpatient rehabilitation facilityAssisted Living
Nursing home
2(2o.o%)
0 (0.0%)
o (o.o%)
0 (0.0%)
2(22.2%)
1..]1..1%)
0 (0.0%)
o (o.o%)
o (0.0%)
L(to.o%lo (0.0%)
0 (0.0%)
3 (18.8%)
t(6.3%lo (o.o%)
o (0.0%)
2 (L4.3%l
L(7.1%lo (0.0%)
0 (0.0%)
e (60.0%)
2(L3.3%l0 (0.0%)
2(13.3%l
18 (24.3%l
6 (8.1%)
0 (o.o%)
2(2.7%lSurvival by Age Category, n (%)
<18
18-39
40-64>65
1.0 (s.6%)
0 (0.0%)
0 (NaN)
0 (NaN)
8 (6.7%l
L(2o.o%l0 (NaN)
0 (NaN)
e (7.s%)
L(2o.o%)0 (NaN)
0 (NaN)
L4 (LO.8%l
2(22.2%l0 (NaN)
0 (NaN)
tL(6.3%)3 (30.0%)
0 (NaN)
0 (NaN)
t4 (8.4%)
1,(20.o%l
0 (NaN)
0 (NaN)
66 (7.4%l
8 (1e.0%)
0 (NaN)
0 (NaN)
Survival by Gender, n (%)
Female
Male
6 (8.0%)
4(3.6%l3 (s.s%)
6 (8.6%l4 (s.s%l
6 (10.s%)6(tz.O%)to (tt.2%l
8 (10.s%)
6 (s.6%l8 (\2.L%l 3s (e.0%)
7 (6.7%1 3s (7.2%l
Survival by Race, n (%)
WhiteNon-white
Unknown
2(3.s%)4(s.4%l4(7.O%\
s (1s.6%)
3 (s.6%)
1(2.6%l
0 (0.0%)
o (o.o%)
LO (1.4.7%l
s (13.s%)
L(3.7%l
Lo (t3.3%)
s (10.e%)
0 (0.0%)
e (ro.7%)
s (s.t%l 22 (8.6%l
L(23%l e (3.2%)
s (r2.3%l 43 (to.e%l
Survival rate by initial EMS rhythm, n (%)
\rr/VFPEA
Asystole
No Shock-No Strip
Cannot Determine
L(16.7%)2(LL.8%l4(3.r%lo (o.o%)
2 (7.7%l
1(33.3%)4 (3o.8%)
2(2.2%lo (o.o%)
t(8.3%l
1(33.3%)4(zs.o%l2(2.4%)o (o.o%)
2(Ls. %l
s (71.4%l
2 (LL.L%)
4(4.8%)0 (0.0%)
2 (33.3o/ol
s (38.s%)
4 (]-s.4%)
o (o.o%)
t (33.3%)
3 (s0.0%)
3 (42.s%l
3 (ls.0%)
6 (4.7%l
0 (0.0%)
2(4o.o%l
L6 (4t.o%lte {t7.3%)t8 (2.8%l
L(s.s%)L2 (L7.6%)
Survival rate by witness status, n (%)
Witnessed 6 (74.3%') 7 (2r.e%) to (3s.7%l Lr (32.4%l LO (Ls.z%l L7 (zs.O%l ss (23.7%l

<19
18-39
40-64>65
0 (NaN) 0 (Naltl) 0 (NaN)
0 (NaN) 0 (NaN) 0 (0.0%)
0 (NaN) 0 (NaN) 0 (NaN)
0 (NaN) 0 (NaN) 0 (NaN)
t(33.3%l2(7OO.O%|
0 (NaN)
0 (NaN)
0 (0.0%)
0 (NaN)
0 (NaN)
0 (NaN)
s (s0.0%)
1(100.0%)
0 (NaN)
0 (NaN)
6 (42.9yo1
3 (7s.O%l
0 (NaN)
0 (NaN)
Positive Neurologic Status (MRS <=3) at discharge by Gender, n (% of avaílable and survived)
0 (NaN) 0 (NaN) 0 (0.0%)
0 (NaN) 0 (NaN) 0 (NaN)
Female
Male0 (0.0%)
3 (7s.o%l0 (NaN)
o (o.o%)
4 (s7.r%l 4 (t44.4%)
2(50.o%l s (ss.6%)Neurologic Status (MRS <=S¡ at discharge by Race, n (% of available and survived)
White
Non-white0 (NaN) 0 (NaN) 0 (NaN)
0 (NaN) 0 (NaN) 0 (NaN)
0 (NaN)
1(100.0%)
2 (lnf)
0 (NaN)
0 (NaN)
0 (NaN)
3 (100.0%) 3 (100.0%)
0 (NaN) 1. (100.0%)
3 (100.0%) s (766.70/0lUnknown O(NaN) 0(NaN) O(NaN)

Date Range: O1/OL/2OO6 - t2/3!2ÙttCountry: USA
Subset: Pediatric (age <=18 years)
Table 3e: Outcomes
Year 20tLSurvival rate by treatment status, n (%)
EMS Assessed
EMS Treated
to (4.4%l
10 (s.3%)e (s.s%)
s (7.2%l10 (6.s%)
10 (8.0%)
t6 (e.4%l
1.6 (LL.s%)74 (6.4%)
t4 (7.6%\Ls (7.L%l 74 {6.s%lr.s (8.8%) 74 (7s%l
Location of discharge , n (% of survived)
Home
lnpatient rehabílitation facilityAssisted Living
2 (2O.O%') 2 (22.2%1 0 (0.0%) 3 (L8.8%) 2 (L4.3%l e (60.0%) 18 (243%l0 (0.0%) 7 (7L.1%l 1. (10.0%) L (6.3%) t (7.L%) 2 (13.3%1 6 (8.1%l
0 (0.0%) 0 (0.0%) 0 (0.0%) 0 (0.0%) 0 (0.0%) 0 (0.0%) 0 (0.0%)
Nursinghome 0(0.0%) 0(0.0%) 0(0.0%) 0(0.0%) 0(0.0%) 2(L3.3%l 2(2.7%)Survival by Age Category, n (%)
<18
18-39
40-64>65
10 (s.6%)
o (o.o%)
0 (NaN)
0 (NaN)
I (6.7%)
L(2o.o%l0 (NaN)
0 (NaN)
e (7.s%)
1.(2O.O%l
0 (NaN)
0 (NaN)
L4 (Lo.8%l
2(22.2%l0 (NaN)
0 (NaN)
1.L(6.3%l
3 (30.0%)
0 (NaN)
0 (NaN)
t4 (8.4%l
L(2O.O%l
0 (NaN)
0 (NaN)
66 (7.4%l
8 (le.0%)0 (NaN)
0 (NaN)
Survival by Gender, n (%)
Female
Male
6 (8.0%)
4 (3.60/ol
3 (s.s%)
6 (8.6%l4 (s.e%l
6 (10.s%)6 (Lz.o%l
LO (rL.2%l8 (10.s%)
6(s.6%l8 (12.r%l 3s (e.0%)
7 (6.7%1 3s (7.2%l
Survival by Race, n (%)
WhiteNon-white
Unknown
2 (3.s%)
4 (s.4%l
4 (7.O%l
s (ls.6%)
3 (s.6%l
1(2.6%l
o (o.o%)
o (o.o%)
to (1.4.7%l
s (L3.s%l
t (3.7%l
10 (13.3%)
s (10.s%)
0 (0.0%)
e (Lo.7%l
s (e.L%l 22 (8.6%l
r(2.3%) e (3.2%)
e (123%1 43 (to.e%lSurvival rate by initial EMS rhythm, n (%)
VTIVF
PEA
Asystole
No Shock-No Strip
Cannot Determine
L(L6.7%)
z $r.8%l4(3.7%lo (o.o%)
2 (7.7%l
L (33.3%l
4 (30.8vol
2(2.2%lo (o.o%)
L(8.3%l
L (33.3%)
4(zs.o%)2(2.4%lo (o.o%)
2 (L5.4o/")
s (71.4%)
2 (1,L.1%l
4 (4.8%l
0 (0.0%)
2 (33.3%l
s (38.s%)
4 (rs. %l
o (o.o%)
1.(33.3%)
3 (so.o%)
3 (42.e%l
3 (1s.0%)
6 (4.7%l
0 (0.0%)
2 (4o.o%l
t6 (41.o%l
L9 (r73%l18 (2.8%l
L(s.e%lL2 (L7.6%l
Survival rate by witness status, n (%)
Witnessed 6 (L4.3%l 7 (21..s%) to (3s.7%l tt (32.4%l LO (Le.z%l lL (zs.o%l ss (23.7%l

<Lg
L8-39
40-64>65
0 (NaN) 0 (NaN) 0 (NaN) 1 (33.3%) 0 (0.0%) s (s0.0%) 6 (42-s%l
0 (NaN) 0 (NaN) 0 (0.0%) 2 (too.o%l 0 (NaN) L (100.0%) 3 (7s.o%l
o (NaN) 0 (NaN) 0 (NaN) 0 (NaN) 0 (NaN) 0 (NaN) 0 (NaN)
0 (NaN) 0 (NaN) 0 (NaN) 0 (NaN) 0 (NaN) 0 (NaN) 0 (NaN)
Positive Neurologic Status (M RS <=3) at discharge by Gender, n (% of available and survived)
Female
Male
0 (NaN) 0 (NaN) 0 (0.0%)
0 (NaN) 0 (NaN) 0 (NaN)
0 (0.0%)
3 (7s.O%)
0 (NaN)
o (o.o%)
4 (s7.1%l 4 (44.4%l
2 (5o.o%l s (ss.6%)
Neurologic Status (MRS <=3) at discharge by Race, n (% of available and survived)
WhiteNon-whiteUnknown
0 (NaN) 0 (NaN) 0 (NaN) 0 (NaN) 0 (NaN) 3 (100.0%) 3 (100.0%)
0 (NaN) 0 (NaN) 0 (NaN) L (L00.0%) 0 (NaN) 0 (NaN) 1(L00.0%)
0 (NaN) 0 (NaN) 0 (NaN) 2 (lnf) 0 (NaN) 3 (100.0%) s (166.7%l

Date Range: OL/O1./2OO6 - t2/3t/2071,Country: Canada
Subset: None
Tab[e 3f: Outcomes
2010Survíval rate by treatment status, n (%)
EMS Assessed 2s2(3.8%) 334(4.7%1 322(4.4%) 344(4.2%1 477 (s.2%l 486(s.4%l 22ts(4.7%',1EMS rreated 2s2 (6.s%l 334 (7.e%l 322 (7.s%) 344 (7.s%l 477 (9.3%l 436 (10.3%) 22ts (8.2%l
Location of díscharge , n (% of survived)
Home
lnpatient rehabilitation facilityAssisted Living
Nursing home
L(O.4%)
0 (0.0%)
o (o.o%)
0 (0.0%)
30 (e.0%)
2(0.6%l
1(o.3%l
0 (0.0%)
2oo (62.1%l
27 (8.4%l
s (L.6%)
1"8 (s.6%)
te8 (s7.6%l
26 (7.6yo)
0 (0.0%)
12 (3.s%)
t(o.2%lo (0.0%)
o (o.o%)
o (o.o%)
24O (4e.4%l
40 (8.2%l
e (L.s%l
t2(2.s%)
670 (30.2%l
es (4.3%l
ts (o.7%l
42(L.s%lSurvival by Age Category, n (%)
<19
1_8-39
40-64>65
3 (3.6%l
ts (6.7%)
Lte (e.z%l
1.L4 (s.t%l
8 (7.8%l
32 (t3.t%lr,s3 (11_.8%)
t3s (s.4%l
6 (6.2%l
27 (Lo.7%l
1ss (11.3%)
728(5.1%)
to (L2.7%l
25 (9.7%',)
L62 (rL.I%lt46 (s.z%l
LL (e.3%l
4e (Ls. %l
2ss (1s.0%)
L62 (s.s%)
LO (t0.2%l38 (13.7%l
24s (ts.6%l
L87 (6.9%)
48 (8.3%)
L86 (LL.8%)
LOeT (L2.s%l
876 (s.s%)
Survíval by Gender, n (%)
Female
Male
7s (s.6%)
t77 (7.o%l8s (s.s%)
24e (s.2%)
87 (s.e%l
23s (8.3%l88 (s.s%) r37 (7.7%l L28 (8.2%l 600 (6.4%l
2s61,8.6%1 339 (LO.z%l 3s8 (tL.4%l L6t4 (e.z%l
Survival by Race, n (%)
WhiteNon-white
Unknown
0 (NaN)
0 (NaN)
2s2(6.s%l
0 (NaN)
0 (NaN)
334 (7.9%)
0 (NaN)
0 (NaN)
322 (7.s%l
0 (NaN)
0 (NaN)
344 (7.5%l
0 (NaN) 0 (NaN) 0 (NaN)
0 (NaN) 0 (NaN) 0 (NaN)
477 (e.3%) 486 (L0.3%) 22Ls (8.2%l
Survival rate by initial EMS rhythm, n (%)
Vr/VFPEA
Asystole
No Shock-No Strip
Cannot Determine
L7o (Lg.t%l27 (3.7%l
i.3 (0.8%)
s (L.0%)
10 (18.s%)
226 (22.8%l
43 (s.6%l
L5 (O.g%'t
L4 (2.4%l
ro (r2.3%l
22o (2L.8%l
38 (4.4%l
Ls (t.t%)3 (6.4%l
22(4.1%l
231. (22.1%)
s0 (s.1.%)
16 (0.e%)
6 (3.6%)
t6 (3.4%l
32e (2e.3%)
s4 (s.3%l
27 (L.3%)
24 (3.2%l
8 (20.o%l
307 (29.s%l
83 (8.3%)
2Llt.o%)2e (s.s%l
s (\s.6%l
t483 (24.L%)
2es (s.s%)
1-1L$.o%l8t(3.2%l7s (6.1%)
Survival rate by witness status, n (%)
Witnessed 216(LO.7%) 28s(1-3.2%1 26s(1-2.s%l 28r(r23%l 3e3(Ls. %l 406(L7.2%l ].8'sO(]-3.7%)

<1"9
18-39
40-64>65
0 (NaN) 0 (NaN) 1(100.0%)
0 (NaN) 6 (i.00.0%) 20 (83.3%l
0 (NaN) L2 (75.o%) t].s (82.L%l
0 (NaN) t2 (7s.o%l 8L (70.4%)
0 (NaN)
76 (s4.L%)
Lt4 (eo.s%l
87 (77.7%l
0 (NaN)
0 (NaN)
0 (NaN)
2(LOO.O%I
6 (L00.0%)
22 (84.6%l
1.43 (89.9yo)
L05 (8L.4o/o)
7 (too.o%l
64 (87.7%l
384 (87.L%l
287 (76.7%l
Positive Neurologic Status (MRS <=3) at discharge by Gender, n (% of available and survived)
Female
Male
0 (NaN) 9 (7s.o%') ss (74.3%l s4 (79.4%l
0 (NaN) 22 (81.s%) L64 (78.8%1 1.64 (87.2%l1 (100.0%) 72 (7e.L%l Lst (77.6%l
1 (r.00.0%) 206 (8s.2%l ss7.(8s.0%)
Neurologic Status (MRS <=3) at discharge by Race, n (% ot available and survived)
White
Non-whiteUnknown
0 (NaN) 0 (NaN) 0 (NaN)
0 (NaN) 0 (NaN) 0 (NaN)
0 (NaN) 31 (lnf) 219 (lnf)
0 (NaN)
0 (NaN)
218 (lnf)
0 (NaN)
0 (NaN)
2 (lnf)
0 (NaN)
0 (NaN)
278 (lnf)
0 (NaN)
0 (NaN)
748 (lnf)

Date Range: OtlOtl2OO6 - L2/3L/2OL1.
Country: Canada
Subset: No obvious cause (cardiac etiology)
Table 39: Outcomes
Year 2010 zALtSurvival rate by treatment status, n (%)
EMS Assessed
EMS Treated 23t (6.60/ol 3t2 (7.s%l 3t2 (7.7%l zzz v.øNl 460 (s.4%l 448 (L0.3%) 2Os6 (8.4%l
Location of discharge , n (% of survived)
Home
lnpatient rehabilitation facilityAssisted Living
7(0.4%lo (o.o%)
0 (0.0%)
28 (9.0%) 197 (63.L%l 1e4 (s8.3%) L (0.2%) 226 (s0.4%',) 647 (30.s%',)
2 (0.6%1 27 (8.7%l 24 (7.2%') 0 (0.0%) 37 (8.3%l eo (4.3%)
L (o.3%l s (1.6%) 0 (0.0%) 0 (0.0%) 6 (1.3%l t2 (0.6%l
Nursins home 0 (0.0%) 0 (0.0%) L7 (s,4%) 12 (3.6%) 0 (0.0%) s (2.o%) 38 (1.8%)
Survival by Age Category n (%)
<19
L8-39
40-64>65
L(2.0%)
LL(7.7%l
LtL(s.7%lLo8 (s.o%)
3(s.z%l26 (t4.s%)
].47 (1-2.3%l
L34 (s.4%l
s (6.7%l
2s (]-2.6%l
]_ss (1r".8%)
Lzs (s.L%l
9 (L3.2%) LO (L]-.2%)
22(tL5%) 43 (16.4%l
157 (IL.6%') 246 (15.3o/o)
L44 (s.3%) t6L(5.6%l
s (L2.7%) 37 (s.o%)
26 (L3.O%l r.s3 (r-3.0%)
234 (L6.O%) 10s0 (13.0%)
]-78 (6.s%) 8so (s.6%)
Survival by Gender, n (%)
Female
Male
6s (s.4%l
166 (7.2%l
80 (s.6%)
232(e.3%l
84 (6.0%l
228(8.s%l84 (s.s%l
24s (8.8%l
133 (7.8%) Lt6 (8.2%) s62 (6.s%l
326 (LO.3%) 332 (LL.4%) 1s33 (9.4%)
Survival by Race, n (%)
WhiteNon-whiteUnknown
0 (NaN)
0 (NaN)
23L (6.60/ol
0 (NaN)
0 (NaN)
3t2 (7.s%l
0 (NaN)
0 (NaN)
3L2(7.7%l
0 (NaN)
0 (NaN)
333 (7.6%l
0 (NaN)
0 (NaN)
460 (9.4o/ol
0 (NaN) 0 (NaN)
0 (NaN) 0 (NaN)
448 (r0.3%l 2Os6 (8.4%)
Survival rate by initial EMS rhythm, n (%)
Vr/VFPEA
Asystole
No Shock-No Strip
Cannot Determine
163 (17.9o/ol
24 (3.7%l
s (0.7%l
5 (L.10/o)
8{1-7.8%)
22O (22.6%)
37 (s.2%l
t4 (o.e%l
Lo (L.e%l
8 (10.3%)
2Le (27.s%l
3s (4.3%l
L6 (L.o%)
3 (6.8%l
20 (4.0%l
227 (22.1%l
46 (s.O%l
t4 (0.8%l
6(3.s%)t6 (3.6%)
324 (2s.2%l
so (s.z%l
26 (L3%l
23 (3.3o/ol
7 (18.4%)
304 (29.6%l
64 (7.1%l
L7 (o.e%l
20 (4.3%)
8(ls.s%l
t4s7 (24.L%)
256 (5.2%',1
s6(1,.o%l67 (2.9o/ol
67 (s.8%)
Survival rate by witness status, n (%)
Witnessed
Non-witnessed
L98 (10.6%) 271. (I3.2o/ol
3L (L.e%l 38 (2.1%l
266 (L2.go/ol 272 (]-2.3%)
46 (2.3%l s8 (2.8%l
383 (L7.s%) t77t (]-3.8%l
64 (3.o%l 3r3 (2.6%l
381_ (ls.s%)
76 (3.2%)

40-64>65
0 (NaN)
0 (NaN)
t2(7s.0%) tL3 (82.s%',)
Lt(73.3%1 80 (70.2%)
tt3 (s2.6%)
86(78.2%\
0 (NaN)
2(Loo.o%l137 (s2.6%l 37s (88.7%l
1"0L (83.s%) 280 (77.3%l
Positive Neurologic Status (MRS <=3) at discharge by Gender, n (% of available and survived)
Female
Male
0 (NaN) s (7s.0%l s4 (74.0%l
0 (NaN) 20 (80.0%) ]-.62 (7s.8%ls2 (80.0%)
162(88.s%lr. (L00.0%)
L (t_00.0%)
68 (82.e%l 1.84 (7s.0%l
1ss (sl.s%) s4o (86.4%)
Neurologic Status (MRS <=3) at discharge by Race, n (% of available and survived)
WhiteNon-white
Unknown
0 (NaN)
0 (NaN)
0 (NaN)
0 (NaN)
0 (NaN)
29 (lnf)
0 (NaN)
0 (NaN)
2L6 (lnf)
0 (NaN)
0 (NaN)
21a (lnf)
0 (NaN)
0 (NaN)
2 (lnf)
0 (NaN)
0 (NaN)
263 (lnf)
0 (NaN)
0 (NaN)
72a $rl

Date Range: OL/O1./2006 - L2/31/2OLL
Country: USA
Subset: No obvious cause
Table 3i: Outcomes
Year 20tL OVERALL
Survival rate by treatment status, n (%)
EMS Assessed
EMS Treated seo ts.røl aor ts.søl no rg.sv"l na ß.tNl st7 (to.t%l s32(L0.8%l 44so (s.4%)
Location of discharge , n (% of survived)
Home
lnpatient rehabilitation facility
Assisted Living
Nursing home
23 (4.1%l
e (1..6%l
!(o.2%l
76 (],2.6%)
ts (3.2%l
t (o.2o/ol
28 (4.7%l
374 (s3.Oo/ol 388 (s3.3%)
73 (t0.3%l 72 (s.s%)
6 (0.8%) 6 (0.8%)
89 (12.60/,1 8L(LL.L%|
460 (4s.4%) L4O4 (3L.6%)
eo (e.7%l 27s (6.2%l
L3 (1.4%) 27 (0.6%l
83 (s.1%)
72 (L.3%l
o (o.o%)
Survival by Age Category, n (%)
<19
1_8-39
40-64>65
L6 (2
4 (2.4%l 7 (4.s%l
34 (9.Lo/ol sL (],2.6%l
28r(LL.z%) 3Os (L2.6%l
8 (s.L%l L6 (s.s%)
60 (r_3.8%) 6t (L3.L%l
3s7 (13.4%1 363 (L2.3%l
323 (7.3%l
L9 (7.9%l t9 (9.9%l 73 (6.8o/o)
8L(L4.3%l so (1-0.s%) 337 (].2.4%l
468(L4.2%l 4e4(!s.4%l 2272(L3.3%l
247 (6 232(s.8%l 27e (6.7%l 367 (7.8%l t76L(6.7%l
Survival by Gender, n (%)
Female
Male
L67 (6.s%l
3se (e.o%)
L67 (6.4%l
434 (e.8%l
2O1. (7.4%l zc/s (6s%l 277 (8.2%) 278 (8.7%l L2ee (7.4%l
sOs (L0.6%) sLs (s.8%) 63e (11.2%1 6s4 (tt.s%) 31-s0 (10.s%)
Survival by Race, n (%)
WhiteNon-white
Unknown
t3o (s.z%l
so (s.7%l106 (e.0%)
38 (s.8%)
4s7 (8.8%l
1s8 (13.6%)
68 (1_1.s%)
48O (8.4%l
1.st(tL.o%ls7 (8.L%l
1s4 (to.3%l
70 (7.8%l
693 (1.O.4%)
2OO (12.6%)
87 (s.3%\
64s (LO.s%l
8se (10.e%)
37O (7s%l
386
38s (2L.7%l
68 (4.e%l
27 {t.O%lLL(2.1%)
s20ß.3% 3181 (9.
Survival rate by initial EMS rhythm, n (%)
VI/VFPEA
Asystole
No Shock-No Strip
Cannot Determine
4L1,(24.7%l
80 (s.7%l
3s (L.3%l
1_8 (3.0%)
L9 (5.9o/o)
472(26.6%)
Lo7 (6.7%)
43 (1,.4%l
to (12.8%l
4s7 (24.4%)
L34 (7.O%)
s4 (1,.s%)
LO (4.s%)
2s (4.6%)
s8o (2e.1%l
ts1,(7.7%)
84 (z.L%l
3s (4.0%)
Ls (ls.8%)
sso (29.8%l
L62 (8.s%l
62(L.6%)
33 (s.1%)
289s (26.2%)
7o2(6.s%)3os (1.s%)
L17 (4.O%l
7s3 (7.4%)
Survival rate by witness status, n (%)
Witnessed
Non-witnessed
28 (8.60/ol 38ß.6%
460 (L3.s%l 488 (74.6%) s72 (ts.s%l sgr (74.2%)
28(29.2%
748 (17.s%l 3s83 (1s.4%)
174 (4.2%l 76t (3.s%l734 (L6.4o/"1
170 (3.9o/o)LL4 (3.2%',) 123 (3.2%l

40-64
>65
LL (63.8%) 3s (64.8%) 22L (76.7%1 25O (83.1o/o)
4(40.O%l 26 (s6.s%) t42(62.0%1 1s0 (68.8%)
t8(66.7%l6 (so.o%)
294(84.2%) 82s (80.L%)
tgt (7L.3%l s1e (66.3%)
Positive Neurologic Status (MRS <=3) at discharge by Gender, n (% of available and survived)
s (s0.0%) te (s7.6%) Lo7 (63.7%l 1r.3 (68.e%)
331(8L.1%)LL (64.7%l ss (67. 304 (75.to/o)
t(2s.0%l 4 (s0.0%) 82(6e5%l 8s (72.6%l
0 (NaN) 4 (Ioo.o%l 3t (64.6%1 30 (s8.8%)
ts (37s.o%l 66 (82s.0%) 2e8 (2s2.5%l 329 (28t.2%l
7 (7O.O%l Ltg (72.60/01 298 (7O.8%l
2 (1OO.O%) 44 (64.7%l trr (64.2%l
18 (180.0%) 36s (222.6%) 10e1 (2ss.t%l
Lo (47.6%l
L7 (77.3%l
7s3 (72.s%)
375 (81.407 (67.t%)
LO93 (78.6%
WhiteNon-whiteUnknown
Neurologic Status (MRS <=3) at discharge by Race, n (% of available and survived)
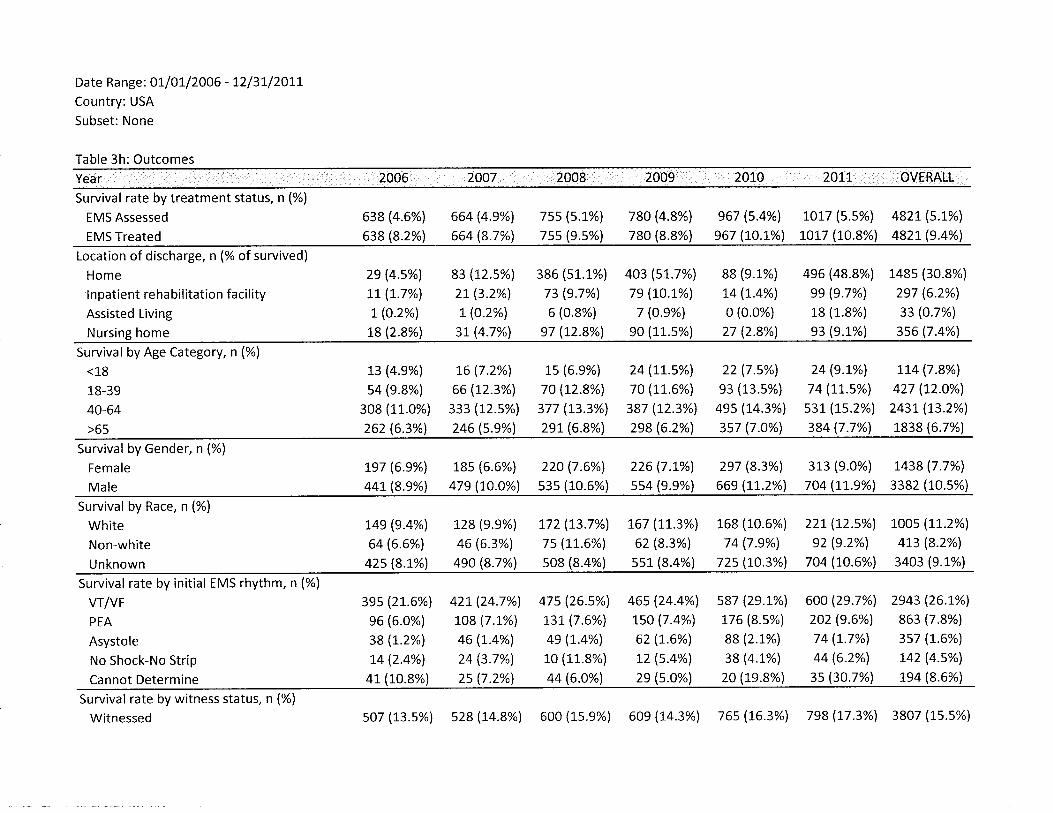
Date Range: OI/OL/2OO6 - L2/3L/2OL1.
Country: USA
Subset: None
Table 3h: Outcomes2007 aOLL
Survival rate by treatment status, n (%)
EMS Assessed
EMS Treated
638 (4.6%)
638 (8.2%l
664 (4.9%l
664 (8.7%)
7ss (s.L%)
7ss (e.s%l
78o (4.8%) e67 (s.4%l
780 (8.8%) s67 (ro.L%l1Or7 ls.s%) 482L(s.L%)
roLT (to.8%l 4821 (e.4%)
Location of discharge, n (% of survived)
Home
lnpatient rehabilitation facilityAssisted Living
2e (4.s%l 83 (Lzs%lLt (1.7%) 2L (3.2%l
L(0.2%) L(0.2%)
386 (s1-.L%)
73 (e.7%l
6 (0.8%)
s7 (L2.8%l
4o3 (sL.7%l
79 (tO.L%l
7 (O.s%l
e0 (11.s%)
88 (s.1%)
t4 (L.4%l
0 (0.0%)
27 (2.8%l
496 (48.8%|
99 (9.7%')
18 (1.8%)
s3 (e.t%)
148s (30.8%)
2e7 (6.2%l
33 (o.7%l
3s6 (7.4%lNursing home L8 (2.8%l 3L (4.7%l
Survival by Age Category, n (%)
<L8
18-39
40-64>65
L3 (4.9o/ol
s4 (s.8%l
308 (11.0%)
262 (6.30/o)
t6 (7.2%l
66 (t2.3%l
333 (12.s%l
246 (5.9o/ol
r.s (6.s%)
70 (r2.8%l
377 (13.3%l
2eL (6.8%)
24\r.s%)70 (1L.6%)
387 (L2.3%l
2s8(6.2%l
22 (7.s%l
e3 (13.s%)
4ss (14.3%l
3s7 (7.O%l
24 (s.t%)
74 (rt.s%')
s31. (\s.z%l384 (7.7%l
tt4 (7.8%l
427 (Lz.o%l
243L (L3.2%)
1838 (6.7%l
Survival by Gender, n (%)
Female
Male
Le7 (6.e%l r.8s (6.6%) 22O (7.6%l
44t(8.e%) 47s (tO.O%) s3s (1_0.6%)
226 (7.t%l 2s7 (8.3%l
ss4 (e.e%) 66e (1-L.2%l
313 (e.o%l 1438 (7.7%l
7O4 (1.t.s%) 3382 (10.s%)
Survival by Race, n (%)
White
Non-white
Unknown
74e (e.4%l L28 (s.e%l r72 (t3.7%l L67 (L13%l 168 (10.6%) 221(tz.s%l toos (LL.2%)
64 (6.6%) 46 (6,3%1 7s (LL.6%l 62 (8.3%l 74 (7.s%l s2 (e.zvol 4L3 (8.2%l
42s(8.L%l 49O(8.7%) s08(8.4%) sst(8.4%l 72s(r13%l 7o4(10.6%1 3403(e.L%)
Survival rate by initial EMS rhythm, n (%)
VTIVF
PEA
Asystole
No Shock-No Strip
Cannot Determine
3es (21..6%l
e6 (6.0%)
38(L.z%lt4 (2.4%)
4r (to.8yol
42L (24.7%l
tog (7.1%l
46 (L.4%l
24 (3.7%l
2s (7.2%)
47s (265%l]-3L (7.6%l
4e (r.4%)
1_0 (1L.8%)
44 (6.0%)
46s (24.4%l
tso (7.4%l
62 (7.6%)
L2(s.4%l2s (s.o%)
s87 (2s.1%)
176 (8.s%l
88 (2.1%l
38 (4.L%l
20 (te.8%l
600 (29.7%l
202 (s.6%l
74 (1,.7%)
44 (6.2%)
3s (3O.7%l
2e43 (26.L%)
863 (7.8%)
3s7 (1.6%)
1,42 (4.5%)
te4 (8.6%l
Survival rate by witness status, n (%)
Witnessed so7 (L3.s%) s28 (L4.8%l 600 (1s.9%) 609 (L4.3o/"1 76s (].6.3%1 798 (17.3%) 3807 (ls.s%)

<18
18-39
40-64>65
0 (NaN) 0 (NaN) L (L00.0%)
4 (8o.o%) Ls (s3.8%) s0 (83.3%)
L3 (68.4%1 37 (66.L%l 228 (76.8%l
4 (4o.o%) 27 (ss.t%l L4s (6L.2%l
L(33.3%l47 (83.e%)
2se (80.e%)
154(67.5%l
0 (0.0%)
3 (100.0%)
L8 (66.7%l
6 (s0.0%)
11(68.8%)43 (7s.6%l
3oe (82.2%l
1e6 (6e.s%)
13 (6t.s%l
L62 (83.s%l
864 (78.e%l
s32 (65.0%l
Positive Neurologic Status (MRS <=3) at discharge by Gender, n (% of available and survived)
Female
Male
6 (s0.0%) Le (ss.e%) LLo (62.e%) tzL (68.4%)
ts (68.2%1 6L (6e.3%) 316 (74.e%l 34t (7e.L%lLO (47.6yo) 167 (7O.2%l 433 (6s.9%l
17 (77.3%l 3s6(8o.2%l 7146(77.s%l
Neurologic Status (MRS <=3) at discharge by Race, n (% of available and survived)
WhiteNon-whiteUnknown
3 (s0.0%) 7 t$3.6%l eo (7o.e%l s4(73.4%l1 (1.00.0%) 4 (100.0%) 32 (64.0%1 32 (ss.3%)
L7 (283.3%1 69 (627.3%1 3O4 (23e.4%) 336 (262.s%l
7 (JO.O%) t3t (72.o%l 332 (7t.6%l2 (too.o%l 4s (63.4yo1 rt6 (63.7%l
18 (180.0%) 387 (2L2.6%) 1131 (243.8%l

Date Range: 0L/or/2o1,1, - r2/3t/2o1.L
Country: USA and Canada
Subset: None
Table 4: CPR Process dataCanada OVERALL
n treated 4703 4724 9427
CPR Process available % 75.6% 673% 71.4%
CPR Fraction1
n
Mean (sd)2
Median (lQR)2
3562
0.78 (0.1s)
3242
0.74 (0.1s)
0.77 (o.ts)
6804
0.76 (0.1s)
Compression Rate
0.81 (0.le)
350s
110.7 (17.8')
110.0 (18.2)
o.7e (0.1e)
3320 682s
113.2 (16.1) 111.e (17.0)
112.4 (1e.61 111.0 (1e.1)
nt
Mean (sd)2
Median (lQR)2
Compression DepthL
n
Mean (sd)2
Median (lQR)2
r489
38.2 (t1..4)
38.2 (13.0)
1854 3343
37.0 (11.S) 37.s (1.r.71
36.6 (14.3) 37.4 (13.8)
Pre-shock Pause3
n
Mean (sd)
Median (lQR)
4t8L6.4 (2s.41
13.s (1s.6)
3L7 735
:.6.7 (L2,3) 16.s (20.8)
16.3 (12.3) 1s.o (1s.0)
Post-shock Pause3
n
Mean (sd)
Median (lQR)
397
7.s (e.2)
s.o (6.0)
302 699
7.s (13.0) 7.s (11.0)
s.o (3.4) s.o (s.o)
L - number of individuals with at least 1 minute of CPR Process measures
2 - First 10 minutes or until ROSC
3 - number of individuals with at least 1 shock pause recorded

Date Range: 0I/0L/20LI - I2/31/20LLCountry: USA and Canada
Subset: Registry episodes prior to CCC/ALPS start
Table 5: lntervention Data
Hypothermia
Continued into or started in ED, o/o
% of admitted to ED
% of admitted to hospital
Continued into or started in Hospital, %1
76.6%
40.9Yo
4L.6%
t2.Io/o
31..8%
44.8%
14s%
37.5o/o
42.80/o
Cardiac catheterization done 26.4% 27.6% 26s%
Percuta neous coronary intervention
% with cardiac catheterization done 59.O4/o 67.6% 623%
% of admitted to hospital 15.6% L8'7% L6.7%;
tcD lmplant, %¿ 24.7% 23.5% 24'2%
-%of those admitted at Hospital
' - % of thase discharged from Hospital

tion characteristics, incidence and survival
201.0 population (in thousands
Percent of Total
Treated lncidence per 100,000

Table 7: OHCA cases by EMS and bystander initiated CPR and survival rates by site
-
survived Total Rate
Site 1
EMS started CPR
Bystander CPR
TotalPercent of bystander CPR
Site 2
EMS started CPR
Bystander CPR
TotalPercent of bystander CPR
Site 3
EMS started CPR
Bystander CPR
Total
Percent of bystander CPR
Site 4
T2
6
163 7.4%
110 5.s%
273
40.3%
33
26
68s 4.8%
4r3 63%1,098
37.6%
44
19
s59 7.9%
164 Lt.6%723
22.7%
EMS started CPR
Bystander CPR
TotalPercent of
L4
t7
26
68
181
190
371
5L.2%
7.7%
8s%
Site 5
EMS started CPR
Bystander CPR
TotalPercent of bystander CPR
208 L2.5%
292 r3.0%
500
s8.4%
Site 6
EMS started CPR
Bystander CPR
Total
Percent of bystander CPR
454
639
1,093
s8.5%
62
L42
t3.7%22.2%