current analysis on SMPS - IEEE Web Hosting
19
Touch current analysis on SMPS designed for energy efficiency regulations Presented by: William Meng/孟昭德 Date: 2011/09/23
Transcript of current analysis on SMPS - IEEE Web Hosting

Touch current analysis on SMPS designed for energy efficiency regulations
Presented by: William Meng/孟昭德
Date: 2011/09/23

how many times have you heard that “it’s not the volts that’ll kill you, but the
amps”?
nothing but ‘closed loop’
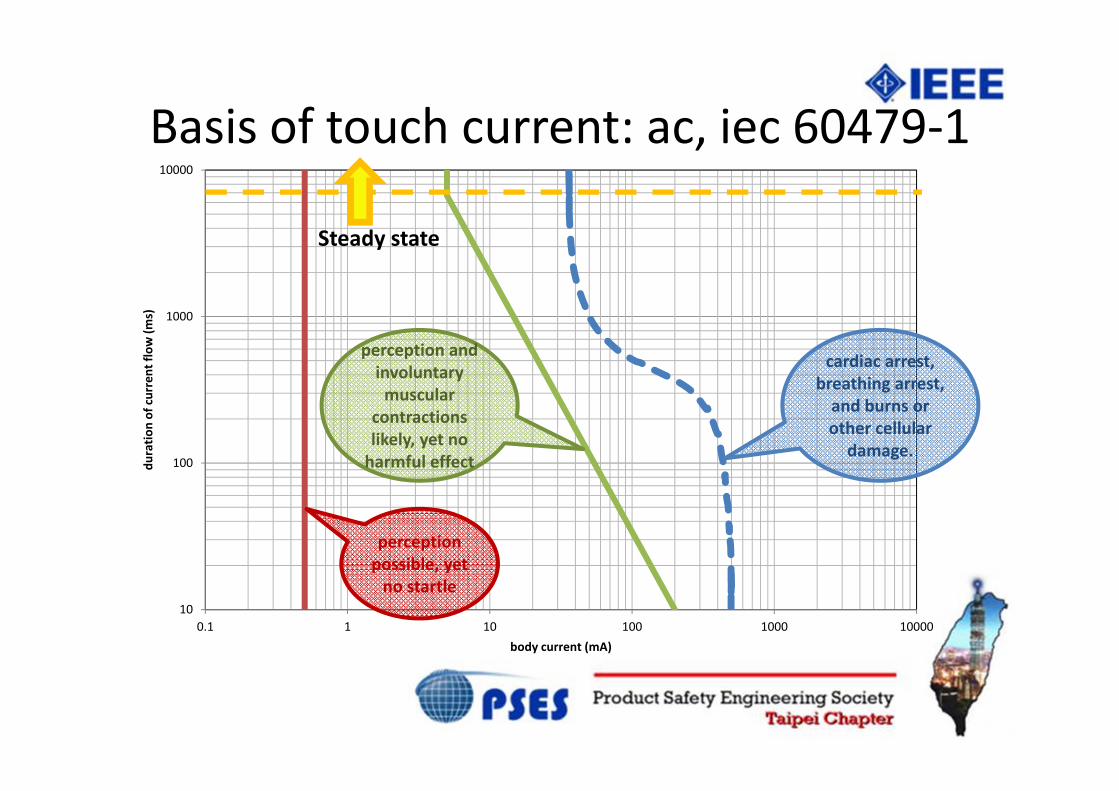
Basis of touch current: ac, iec 60479‐1
10
100
1000
10000
0.1 1 10 100 1000 10000
duratio
n of current flow
(ms)
body current (mA)
perception possible, yet no startle
perception and involuntary muscular
contractions likely, yet no harmful effect
cardiac arrest, breathing arrest,and burns or other cellular damage.
Steady state
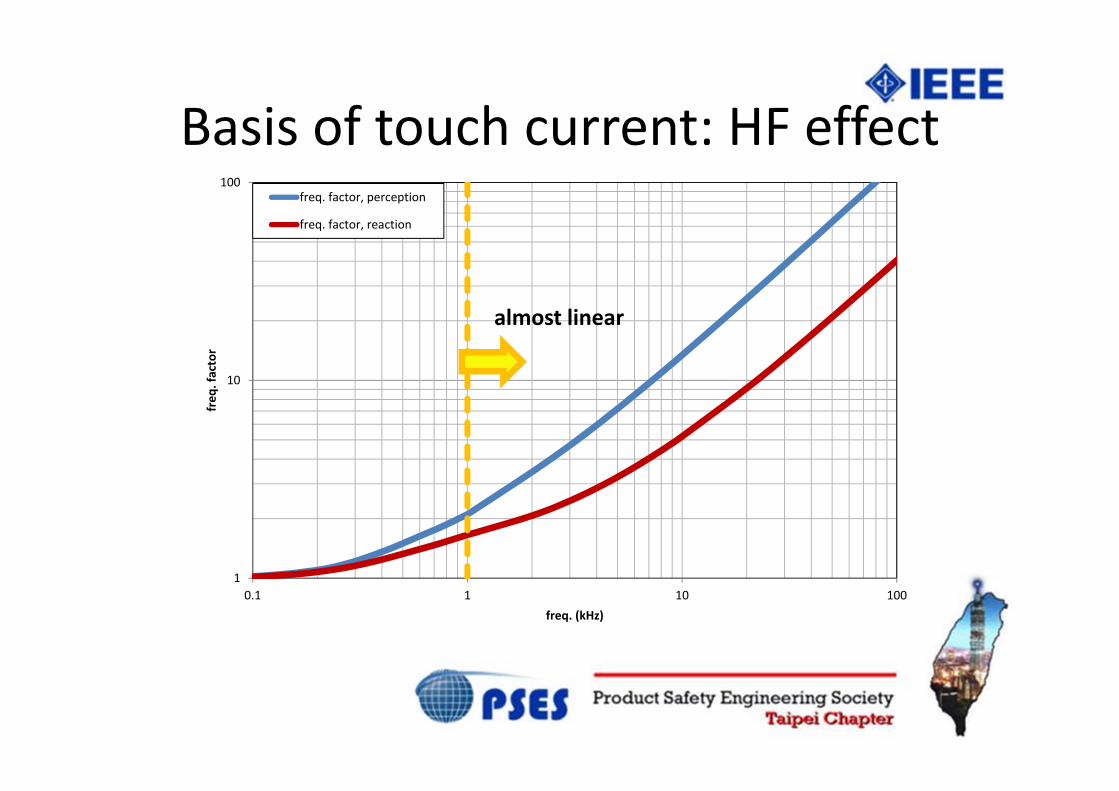
Basis of touch current: HF effect
1
10
100
0.1 1 10 100
freq
. factor
freq. (kHz)
freq. factor, perception
freq. factor, reaction
almost linear

measurement network by iec 60990, for perception
1500Ω
500Ω
0.22 uF
10,000Ω
0.22 uF U2
Test terminals
Weighted (for perception/ reaction) touch current = U2/500 (peak value)
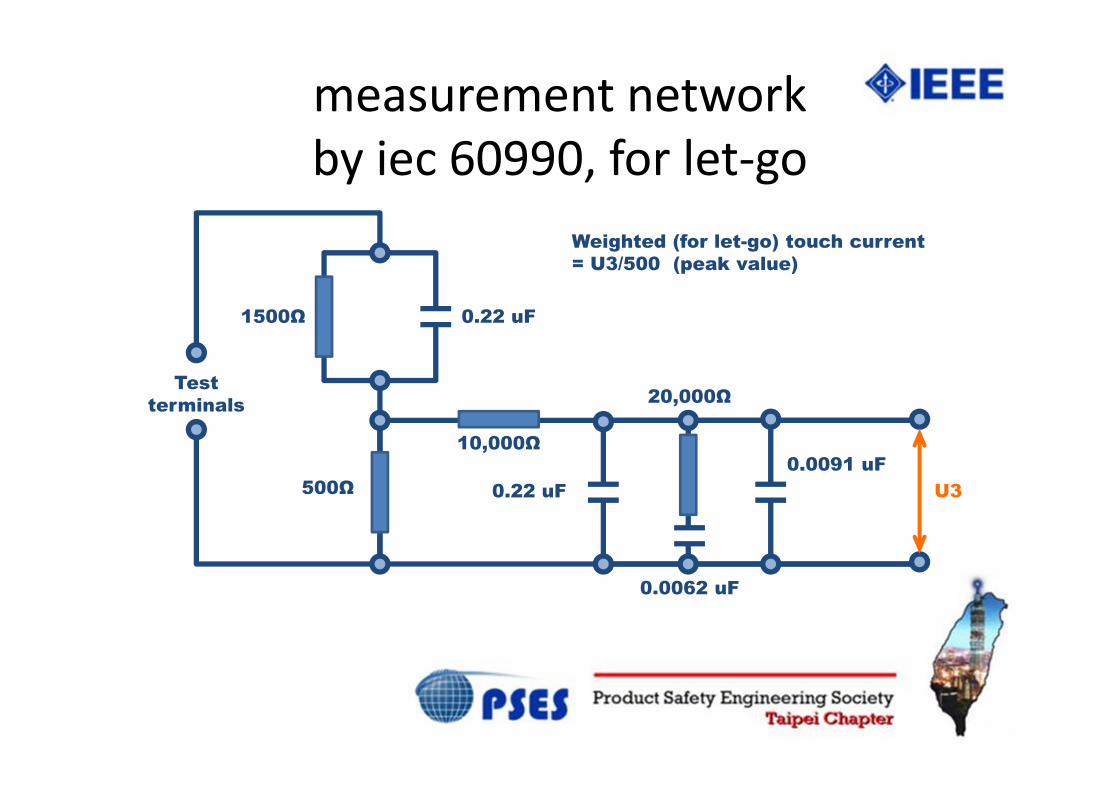
measurement network by iec 60990, for let‐go
1500Ω
500Ω
0.22 uF
10,000Ω
0.22 uF U3
Test terminals
Weighted (for let-go) touch current = U3/500 (peak value)
20,000Ω
0.0062 uF
0.0091 uF

0.5
1
1.5
2
2.5
10 100 1,000 10,000 100,000 1,000,000
U3/U2
Frequency (Hz)
Difference between Fig. 4 and Fig. 5
approx. 2.42 for freq.
higher than 20,000 Hz

EMI and touch current
CSE
CPSACVDS
PWM Control and Feedback
CY

EMI and touch current
CSE
CPSACVDS
PWM Control and Feedback
CY

Touch current of an SMPS
PWM and Feedback I : Leakage current
through filter Y‐cap
I : Leakage current through bridging Y‐cap
I : Leakage current through insulation
I : Leakage current through winding capacitance
Accessible conductive parts
Insulation

Set‐up of experiment
EUT(SMPS)
V+
V-
L
N
PE
Measuring network(U2/U3)
Electric load
264 V, 60 Hz
OscilloscopeTektronix: TDS3032B, DOP7104
Chroma: 63030Prodigit: 3311F

Samples: EPSOutput(W) Topology PFC Filter Y‐cap
(PF)Bridging Y‐cap (PF)
Efficiency level
15 Flyback None None 680 x 1
90 Flyback active None 2200 x 1
120 Flyback active None 1000 x 2
180 Resonant active 2200 x 2 2200 x 2
*Loading conditions: 0%, 25%, 50%, 75%, 100% of max. nameplate current
V

Samples: PC powersOutput(W) Topology PFC Filter Y‐cap
(PF)Bridging Y‐cap (PF)
Efficiency level
300 Dual‐switchforward + flyback
active 2200 x 21000 x 2 2200 x 1350
400300 Dual‐switch
forward + flyback
active 2200 x 21000 x 2 2200 x 1 none350
400Loading conditions: 0%, 25%, 50%, 75%, 100% of max. nameplate currentFlyback: transformer for standby power (+5Vsb)

Result: EPS
0%
20%
40%
60%
80%
100%
120%
0% 25% 50% 75% 100%
U2, pk U2, rms U3, pk U3, rms
0%
40%
80%
120%
160%
200%
0% 25% 50% 75% 100%
U2, pk U2, rms U3, pk U3, rms
0%20%40%60%80%100%120%
0% 25% 50% 75% 100%
U2, pk U2, rms U3, pk U3, rms
0%20%40%60%80%100%120%
0% 25% 50% 75% 100%
U2, pk U2, rms U3, pk U3, rms

Result: PC powers
0.6
0.8
1
1.2
0 0.2 0.5 1
300W, 80+, U2, pk 300W, 80+, U2, rms
300W, 80+, U3, pk 300W, 80+, U3, rms
0.6
0.8
1
1.2
0 0.2 0.5 1
300W, non‐80+, U2, pk 300W, non‐80+, U2, rms
300W, non‐80+, U3, pk 300W, non‐80+, U3, rms
0.6
0.8
1
1.2
0 0.2 0.5 1
350W, 80+, U2, pk 350W, 80+, U2, rms
350W, 80+, U3, pk 350W, 80+, U3, rms
0.6
0.8
1
1.2
0 0.2 0.5 1
350W, non‐80+, U2, pk 350W, non‐80+, U2, rms
350W, non‐80+, U3, pk 350W, non‐80+, U3, rms
0.6
0.8
1
1.2
0 0.2 0.5 1
400W, 80+, U2, pk 400W, 80+, U2, rms
400W, 80+, U3, pk 400W, 80+, U3, rms
0.6
0.8
1
1.2
0 0.2 0.5 1
400W, non‐80+, U2, pk 400W, non‐80+, U2, rms
400W, non‐80+, U3, pk 400W, non‐80+, U3, rms
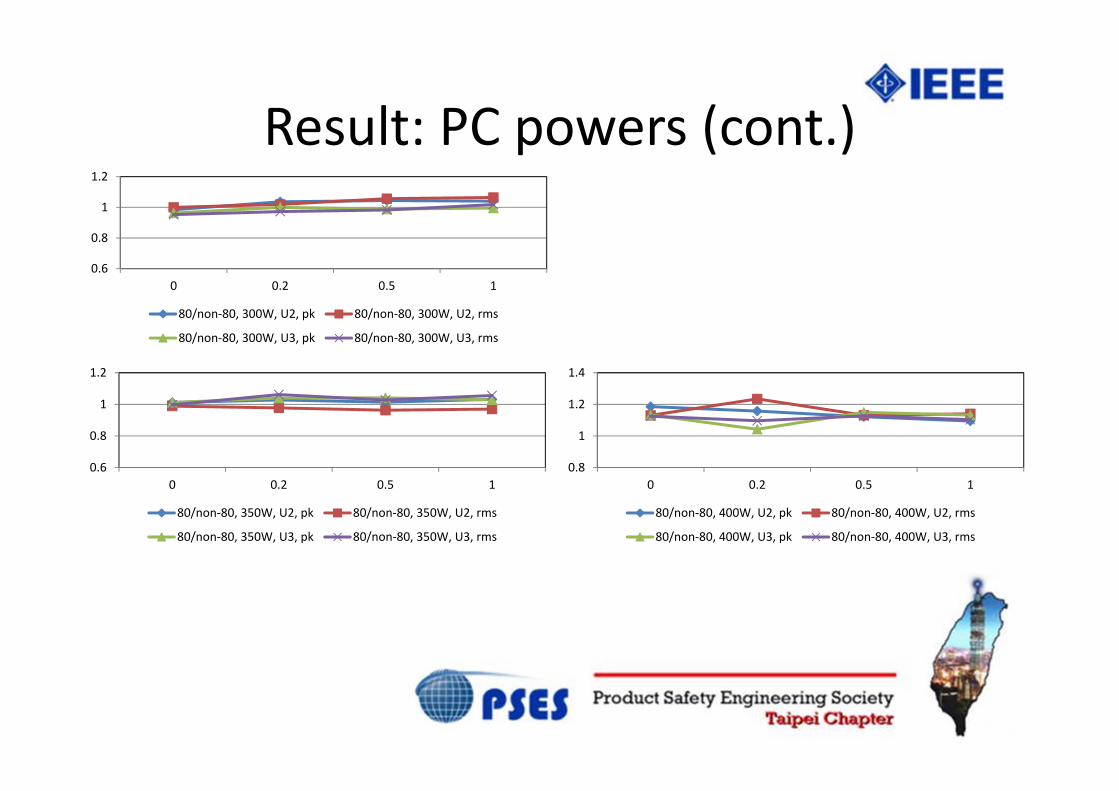
Result: PC powers (cont.)
0.6
0.8
1
1.2
0 0.2 0.5 1
80/non‐80, 300W, U2, pk 80/non‐80, 300W, U2, rms
80/non‐80, 300W, U3, pk 80/non‐80, 300W, U3, rms
0.6
0.8
1
1.2
0 0.2 0.5 1
80/non‐80, 350W, U2, pk 80/non‐80, 350W, U2, rms
80/non‐80, 350W, U3, pk 80/non‐80, 350W, U3, rms
0.8
1
1.2
1.4
0 0.2 0.5 1
80/non‐80, 400W, U2, pk 80/non‐80, 400W, U2, rms
80/non‐80, 400W, U3, pk 80/non‐80, 400W, U3, rms
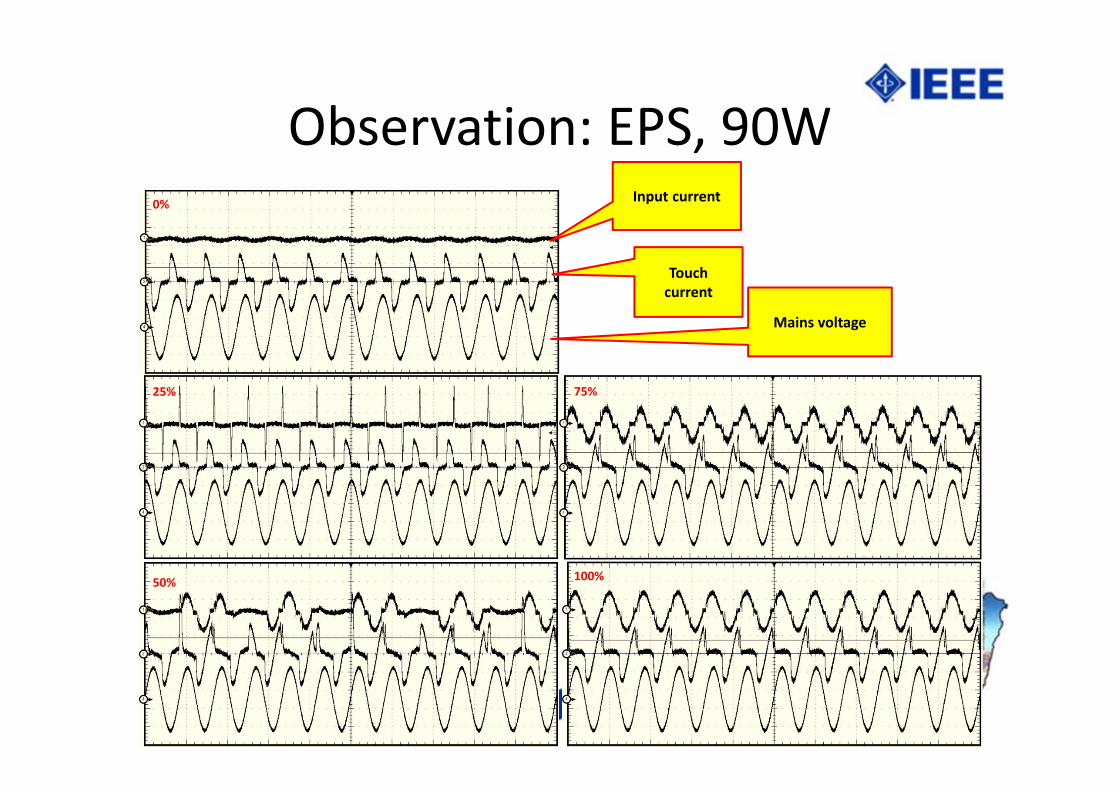
Observation: EPS, 90WInput current
Touchcurrent
Mains voltage
0%
25%
50%
75%
100%

Hypothesis: only bridging Y is influenced by loading
0
50
100
150
200
250
300
0% 25% 50% 75% 100%
TC (m
A)
U2, no CY
U2, 680P
U2, 1000P
U2, 1680P
U2, 2000P
U2, 2680P
0
50
100
150
200
250
300
0 500 1000 1500 2000 2500 3000
touch curren
t (mA)
Y‐Cap (PF)
U2, 0%
U2, 25%
U2, 50%
U2, 75%
U2, 100%

Recommendation
• Touch current shall be measured with the EuTloaded
• Peak measurement is more appropriate than rms measurement
• Keep the EuT completed!!