


Currency Trader 0805
45
CHINESE YAWN CHINESE YAWN CHINA REVALUES, MARKETS SHRUG: What’s next? • SECOND-HALF DOLLAR OUTLOOK: Will the buck retain its pluck? • TRADING STRATEGIES: The new carry trade • BRIT POUND sell-off pattern • NEW DAILY FX INDEX • UNDERSTANDING the parabolic indicator
description
trading strategies, FX index, parabolic indicator
Transcript of Currency Trader 0805

CHINESE YAWNCHINESE YAWNCHINA REVALUES, MARKETS SHRUG:
What’s next?• SECOND-HALF
DOLLAR OUTLOOK: Will the buck retain its pluck?
• TRADING STRATEGIES: The new carry trade
• BRIT POUND sell-off pattern
• NEW DAILY FX INDEX
• UNDERSTANDING the parabolic indicator
Contributors . . . . . . . . . . . . . . . . . . . . .6
Letters . . . . . . . . . . . . . . . . . . . . . . . . . .8
Forex Resources . . . . . . . . . . . . . . . . .8
Industry NewsChina abandons yuan peg . . . . . . . . . . .9China uncouples its currency from the U.S.dollar — sort of.By Carlise Peterson
EBS creates new trading platform . . . .11
Global MarketsU.S. dollar: Does the buck stop here? . . . . . . . . . .12Will the dollar continue to surprise in the second half of 2005?By Currency Trader Staff
Near-term British pound vulnerability . . . . . . . . . . . . . .16Interest rates, debt, and housing drive Britishpound outlook for the upcoming months.By Tim Clayton
Spot CheckBritish pound . . . . . . . . . . . . . . . . . . .20The pound has tumbled vs. the dollar as oflate, but does that mean it’s setting up for arebound?By Currency Trader Staff
Big Picture . . . . . . . . . . . . . . . . . . . . .22Detecting the professionals’ footprints:Lessons of the Chinese revaluationWhat China’s currency revaluation can teachus about the way the forex market works.By Barbara Rockefeller
Currency Strategies . . . . . . . . . . . . .28Dollar-yen: The year’s hottest carry tradeHow to play the U.S. dollar/Japanese yeninterest-rate relationship.By Kathy Lien
Indicator Basics . . . . . . . . . . . . . . . .32Parabolic stopHow to calculate and interpret this mechanicalstop-loss and trading approach.By Currency Trader Staff
continued on p. 4
CONTENTS
2 August 2005 • CURRENCY TRADER

4 August 2005 • CURRENCY TRADER
CONTENTS
Have a question about something you’ve seen in Currency Trader?
Submit your editorial queries or comments to
Looking for an advertiser?Consult the list below and click on the company name for a direct link to the ad in this month’s
issue of Currency Trader.
Index of Advertisers
Currency Futures . . . . . . . . . . . . . .36Barclay Group launches new forex indexMarket barometer tracks currency traders on adaily basis. By Currency Trader staff
International Market Summary . . .38
Global News Briefs . . . . . . . . . . . . .40
Events . . . . . . . . . . . . . . . . . . . . . . . . .41
Global Economic Calendar . . . . . . .42
Forex Trade Journal . . . . . . . . . . . .43
Key Concepts and Definitions . . . .44
FXCM Refco
Gain Capital
Investorflix
WorldCupAdvisor.com
MetaStock

Editor-in-chief: Mark [email protected]
Managing editor: Molly [email protected]
Associate editor: Carlise Peterson [email protected]
Associate editor: David Bukey [email protected]
Contributing editor: Jeff [email protected]
Editorial assistant andWebmaster: Kesha Green
Art director: Laura [email protected]
President: Phil [email protected]
Publisher,Ad sales East Coast and Midwest:
Ad sales West Coast and Southwest only:
Allison [email protected]
Classified ad sales: Mark [email protected]
Volume 2, Issue 8. Currency Trader is published monthly by TechInfo, Inc., 150 S. Wacker Drive, Suite 880, Chicago, IL 60606. Copyright © 2005TechInfo, Inc. All rights reserved. Information in this publication may not bestored or reproduced in any form without written permission from the publisher.
The information in Currency Trader magazine is intended for educational pur-poses only. It is not meant to recommend, promote or in any way imply theeffectiveness of any trading system, strategy or approach. Traders are advisedto do their own research and testing to determine the validity of a trading idea.Trading and investing carry a high level of risk. Past performance does notguarantee future results.
For all subscriber services:www.currencytradermag.com
A publication of Active Trader®
CONTRIBUTORS
6 August 2005 • CURRENCY TRADER
CONTRIBUTORS
� Barbara Rockefeller (www.rts-forex.com) is aninternational economist with a focus on foreign exchange.She has worked as a forecaster, trader, and consultant atCitibank and other financial institutions, and currently pub-lishes two daily reports on foreign exchange. Rockefeller isthe author of Technical Analysis for Dummies (2004), 24/7Trading Around the Clock, Around the World (John Wiley &Sons, 2000), The Global Trader (John Wiley & Sons, 2001), andHow to Invest Internationally, published in Japan in 1999. Abook tentatively titled How to Trade FX is in the works.
� Kathy Lien is a chief strategist atFXCM, where she is responsible forresearch and analysis for DailyFX.com,including technical and fundamentalresearch reports, market commentaries,and trading strategies. She was an asso-ciate at JP Morgan Chase, where sheworked for more than three years incredit derivatives, cross markets, and foreign exchangetrading. Lien’s experience encompasses trading both in andout of the forex market, including interest rate derivatives,bonds, equities, and futures. She has written for variousindustry publications and news outlets, including CBSMarketWatch, and she is frequently quoted on Bloombergand Reuters. She is also author of the forthcoming book DayTrading The Currency Market (John Wiley & Sons).
� Tim Clayton is an international economist specializingin the global currency markets, macroeconomics, and inter-est rates for close to 20 years. For the past six years he hasbeen head of economics at UK-based currency specialistsInvestica Ltd. In that role, he oversees the production ofInvestica’s currency reports including daily market analy-sis.


FOREX RESOURCES
8 CURRENCY TRADER • August 2005
LETTERS
FOREX RESOURCES
COESfxTM’s partnership with NetPicks Forex enables NetPicks customers to trade on the COESfx Level 1 TradingPlatform. NetPicks Forex customers trading on COESfx will be able to work with live executable prices, making each par-ticipant, in effect, their own market maker. The COESfx electronic network enables automatic execution of the NetPicksstrategy. Also, all participants on the COESfx network will have the ability to try NetPicks Forex for a free, three-week trialof their Forex Trading Systems. For more information, see the companies’ Web sites: www.coesfx.com andwww.NetPicksforex.com.
In addition, COESfx Inc. has added 10 new currency pairs to its Web-based Electronic Currency Network (ECN), nearly dou-bling the amount of currencies available to retail and institutional investors. The new currency pairs include EUR/CAD,EUR/AUD, AUD/CAD, GBP/AUD, GBP/CAD, GBP/CHF, CHF/JPY, CAD/JPY, AUD/JPY, and AUD/CHF. Spot gold is alsobeing offered on the COESfx ECN — the first in a wide range of spot tradable commodities to be added to the platform.
Interbank FX (www.interbankfx.com) and Equis International (www.equis.com) have partnered to enhanceMetaStock Pro FX, the new real-time version of MetaStock specifically created for forex trading. MetaStock Pro FX usesadvanced charting and technical indicators to help investors analyze the forex market. Interbank FX has developed a pro-prietary execution engine interface called Pro FX Trader 2.0 that is incorporated into the MetaStock Pro FX software. Theintegration allows MetaStock customers the ability to trade live or demo accounts directly from MetaStock Pro FX soft-ware. MetaStock customers can execute from live streaming prices. The Interbank FX engine includes automated trailingstops, wireless trading from PDA devices, direct Interbank dealing to world money center banks, and guaranteed liquidi-ty for up to $10,000,000 per execution. Money managers utilizing MetaStock Pro will also have access to the Interbank FXPAMM 3.0.
Spot forex volume
Iuse [retail forex broker] for trading. They offer freecharting packages but their charts do not display vol-ume. They said that there is no way to show volume in
the charts because trading takes places in many differentplaces throughout the world.
However, there is volume displayed in Figure 5 on page37 of the January 2005 issue of Currency Trader. Also, there isvolume displayed in “Teaching the RSI new tricks” onpages 36 to 39 of the May 2005 issue. Could you pleaseexplain what this volume is?
— Helio J. Leal
It is true that it is impossible to include actual volume for spotforex. The chart in the January issue is mislabeled. The bars belowthe price series in that chart represent an indicator that is not rel-evant to the particular trading approach, but which the authorincluded in the chart. We should have deleted the indicator. Ourapologies for the confusion.
The volume shown in the charts in “Teaching the RSI newtricks” (Currency Trader, May 2005) is called “tick volume,”and it’s essentially an approximation supplied by the quote ven-dor. Basically, the number and size of price changes are used toreflect volume: Every time there is a price change, either an up tickor a down tick, the tick volume increases by 1; if the price changesby 5 pips, the tick volume climbs 5, and so on.
Scarce options info
Iwas wondering if you could point to where I could goto learn more about forex options. Is there a goodbook on the subject you recommend? What other
resources are there at my disposal (i.e., Web sites,newsletters, or training seminars)?
— Steve
Information about spot forex options is scarce becausethese trades are a breed apart (see “Forex options,”Currency Trader, June 2005 and “Currency Basics:Forex options,” Currency Trader, March 2005), and veryfew retail forex brokers offer them. Options on currencyfutures are much more readily accessible to retailtraders.

August 2005 • CURRENCY TRADER 9
MARKET NEWS BY CARLISE PETERSON
O n July 21, the People’s Bank of China(PBOC) announced it was abandoning itspolicy of pegging the value of its currency,the remninbi , or yuan, to the U.S. dollar at
a fixed rate. From now on the yuan will be linked to a bas-ket of as-yet unnamed currencies (which will include thedollar) and allowed to trade in a daily band of plus orminus 0.3 percent.
The move was an immediate 2.1 percent appreciation inthe value of the yuan, from the 8.28 yuan-per-dollar rate that
had prevailed for the past decade, to 8.11 yuan-per-dollar.Although the move was widely praised among govern-
ments and economists as the first step toward greater flexi-bility in China’s forex regime, many analysts saw it mostlyas a political move aimed mostly at appeasing the U.S. andother trading partners.
As expected, the revaluation of the yuan initially raisedthe value of Asian currencies, including the yen vs. the dol-lar. However, these moves were generally short lived (see“Initial market reaction to Chinese revaluation muddled”).
Some analysts doubt China will reval-ue the yuan again any time soon.
“It seems little further appreciation ofthe yuan is likely in the near-term, andwhile some will continue to focus onbasket components and their weights,we doubt that will provide much guid-ance to movements in the yuan — or inthe Euro/dollar or dollar/yen, for thatmatter,” says Mark Austin, global headof currency strategy at HSBC bank.
Glenn Stevens, managing director ofGain Capital, believes the revaluationmoves China in the right direction, muchlike the Mexican peso adjustmentapproximately 10 years ago, whichunpegged the peso from the dollar andallowed it to float freely. He likens thisannouncement to lifting the top off a potof boiling water: While it temporarilyrelieves some immediate pressure,things are still hot.
Most forex watchers seem to be hedg-ing their bets regarding the longer-termimpact of the move.
According to U.K.-based research firmFXToday, “the Chinese move to adjustthe yuan will tend to dominate in theshort term, even though the move is actu-ally fairly limited. Volatility is likely to bea key feature, especially as short specula-tive yen positions were extreme and thiswill have a wider dollar impact.”
China abandons yuan peg
People’s Bank of China statement
Introducing it as a step to “establish and improve the socialist marketeconomic system in China,” on July 21, 2005, the People’s Bank ofChina issued a short statement regarding its new foreign exchange
policy. The highlights:
1. The exchange rate of the U.S. dollar against the remninbi (RMB) will be adjusted to 8.11 yuan per U.S. dollar (a 2-percent downward adjustment from the former rate of 8.28).
2. China will use a “managed floating exchange rate regime based on market supply and demand,” whereby the RMB will no longer be pegged to the U.S. dollar and will instead be valued against a basket of currencies.
3. The daily U.S. dollar/RMB rate will be allowed to float within a ±0.3 percent band around the “central parity” published by the PBOC, and the prices of other currencies against the RMB will be able to move within certain bands to be announced by the PBOC. The PBOC will adjust the RMB exchange rate band “when necessary according to market development as well as the economic and financial situation.”
The full text of the announcement can be found at www.pbc.gov.cn/english/.
Traders and analysts weigh in on the possible impact of the Chinese yuan revaluation
on the world’s foreign exchange market.
continued on p. 10

10 CURRENCY TRADER • August 2005
The reactions of the dollar index, dollar/yen rate, the S&P 500 E-Mini futures, and Euro/dollar rate (clockwise from upperleft) were fairly muted in the first days following the Chinese renminbi revaluation.
FIGURE A — MUCH NOTHING ABOUT ADO?
Source: TradeStation
T he markets didn’t seem to know what to make ofChina’s decision to adjust its currency on July 21.The initial reaction pretty much played out accord-
ing to conventional wisdom regarding the event, but themove had no momentum; traders seemed to digest the nar-row scope of the revaluation and place it in context ofbroader market action and world events.
Figure A shows some of the immediate reaction toChina’s announcement, which occurred around 6 a.m. ET.The dollar index chart (DXY, upper left) shows the buckdropped (challenging its July low) before bouncing back toclose near the middle of its range for the day. It then fol-lowed with three days of higher highs and higher lows.
The U.S. dollar/Japanese yen (USD/JPY, upper right)rate fell hard on the news and stayed down for the remain-der of the New York trading session on July 21, but it beganmarching steadily higher the next morning.
The Euro/U.S dollar (EUR/USD, bottom left) initially got arise out of the news, but it sold off steadily before mounting
a rally in the late morning in New York, then selling off againto close near where it started. Interestingly, it sold offthrough July 26 — counter to what many had predicted,given projected dollar weakness after a yuan revaluation.
The September E-Mini S&P futures (ES, lower right) reflect-ed the stock market’s initial enthusiasm over the news, but likethe EUR/USD rate, the contract reversed to the downsidebefore regaining its footing in the regular day session (after8:30 a.m. CT) trading hours. However, late in the trading ses-sion, the contract retreated to close toward the bottom of itsrange. Three days later, it was essentially marching in place.
The July 21 market action was somewhat clouded by thebreaking news of new bomb threats in London, two weeksafter the July 7 terrorist attacks that rocked that city. TheBritish pound (not shown) initially rallied against the dollaron the news of Chinese revaluation, but sold off when thenews of the explosions broke. However, the market stabi-lized and, by 1:30 p.m. in New York trading, it had ralliednearly to its high of the day.�
Initial market reaction to Chinese revaluation muddled
MARKET NEWS continued
CURRENCY TRADER • August 2005 11
On July 25, the People’s Bank of China said overnightthat foreign media reports calling Beijing’s long-awaitedboost to its currency last week an “initial adjustment”were incorrect. The statement from China, the main focusfor investors, appears to cool expectations of further yuanstrength and attendant appreciation in Asian currencies atthe expense of the dollar.
“The much-ballyhooed RMB revaluation has come andgone with little perceptible change in major currencyrates,” says Brian Dolan, director of research at GainCapital. “In fact, the revaluation is increasingly beingviewed as a non-event, since the scale of the adjustmentwas the absolute minimum expected and the PBOC doesnot appear to be willing to allow [it] to actually float with-in the purported 0.3-percent daily band.
“In the three days of trading since the revaluation to8.1100, the USD/RMB rate has not been below 8.1097, andthe daily range has been around 0.02 percent. This sug-gests that the PBOC has simply adjusted the RMB slight-ly higher, but that they will continue to manage it as afixed-rate peg.”
Dolan adds that the PBOC actions so far indicate theJuly 21 adjustment was a one-time revaluation and that nofurther adjustments are contem-plated in the “foreseeable future.”
“They are especially concernedthat any rush to allow the yuan tofloat, even if it’s a ‘crawling’ adjust-ment within the 0.3 percent dailyband, would expose the yuan tospeculative forces beyond thePBOC’s control,” he says. “Furtheradjustments are likely to be welldown the road and smaller than themarket’s expectations. The PBOChas also noted that this revaluationwas deliberately small to allowChinese firms to gradually adjust toa stronger currency.”
Dolan also says this move sug-gests that continued revaluationspeculation in the short-term is like-ly to be “fruitless,” and that themarket has already reverted to thethemes that were driving currenciesprior to the revaluation, such aswidening U.S. interest rate andgrowth differentials that favor thedollar, and political uncertainty inJapan. �
EBS creates new trading plat form
E BS has come out with an automated tradingprogram for the spot forex trading community.EBS Spot Ai provides direct electronic access
between the customer’s trading systems and the globalforex community trading on the EBS Spot system usingautomated programming interface (API) technology. Theprogram includes risk management and algorithm-based trading such as momentum trading, moving aver-age, and arbitrage models.
The service is suitable for electronic trading and fortraders who want to accomplish high frequency tradesautomatically. It is available for both the interbank trad-ing community and other professional traders (includinghedge funds, fund managers, and commodity tradingadvisors).
EBS developed a customer test facility, the EBS Lab,which enables customers to fine-tune programs beforeimplementing them for real money by testing connectiv-ity, timing, and price integrity, and using EBS Spot mar-ket data to analyze trade program performance.
Chinese yuan revaluation continued from p. 9
HIT YOUR MARK!Advertise in
Active Trader and Currency Trader Magazines
Contact Bob DormanAd sales East Coast
(312) 775-5421
Allison EllisAd sales West Coast
(626) 497-9195
Mark SegerAccount Executive
[email protected](312) 377-9435

R ewind to late 2004. Currency forecasterswere having a field day with doom andgloom scenarios for the deteriorating U.S.greenback. Asian central banks were buying
massive amounts of U.S. Treasuries and market watcherswarned that a financial house of cards was in jeopardy. Theevils of the “twin deficits” (trade and budget) would con-tinue to erode the value of the U.S. dollar, they warned.
As soon as revelers rang in the new year, however, a verydifferent picture began to emerge. Since the opening bell of
2005, U.S. dollar bulls have reasserted control of themarket (Figure 1). From a multi-year peak vs. the
Euro at $1.36 in December 2004, dollar bulls pro-pelled the greenback higher during the first
six months of the year, to a low, around$1.18 in early July (Figure 2).
Whether the buck’s surprising strengthpersists for the remainder of the year hingesupon several economic factors in the U.S. andabroad.
Dumping dollar shorts Currency analysts and economists point toa number of factors that sparked the bull-ishness in the U.S. currency since thebeginning of 2005. One aspect of the mar-ket in late 2004 was that it was simplyweighted down by dollar-short posi-tions. Everyone who had wanted to getshort had already done so, and therewere no more dollar bears to fuel a con-tinuation of the downtrend.
“People were all positioned in the samedirection,” says Sean Callow, senior cur-rency strategist at Westpac InstitutionalBank. “[They] had loaded up on Eurosand were expecting it to gain more.There was an overextension.”
The trade imbalance in the U.S., amajor concern for many currency watch-
ers in late 2004, still hasn’t gone away. TheU.S. current account deficit widened in the
first quarter of 2005 to $195 billion from $188.4billion in the fourth quarter of 2004. But for now,
forex traders have shifted their focus to other factors.
GLOBAL MARKETS
U.S. dollar:Does the buck stop here?
Defying prevailing sentiment, the U.S. dollar
staged a robust rally in the first half of 2005.
What have been the major forces behind this
move — and can it last?
12 August 2005 • CURRENCY TRADER
BY CURRENCY TRADER STAFF

CURRENCY TRADER • August 2005 13
“We are a consuming nation,” saysBrian Dolan, director of research atGain Capital. “We produce very littlein relation to what we consume andthat’s not going to change. We willcontinue to consume at an excessivepace for the next six to nine months.There is very little to suggest [thetrade deficit] is going to be a criticalfactor for the forex market.”
“People in the market had beenhearing about how the U.S. tradedeficit is out of control and the onlyway to fix it is for the U.S. dollar to godown,” adds Jim Glassman, senioreconomist at J.P. Morgan Chase. “But[they] started to realize the reason thetrade deficit was so large was becausethe rest of the world was under per-forming.”
Glassman downplayed concernsthat China or other Asian centralbanks will stop buying U.S.Treasuries.
“They are buying to keep their cur-rencies stable, so that Liz Claiborneand Wal-Mart will continue to viewChina as an attractive place to buildapparel factories,” he says. “If Chinachose to funnel surplus dollars intothe yen or some other currency, therenminbi would rise against the dollarand you are no longer attractive.”
Global growth differentialsIndeed, in the first half of this year pos-itive global growth rate differentialsfavored the U.S., and traders began toshift their focus onto the economicnumbers emerging from the U.S. andthe Euro zone. Currently, slow growthcontinues to plague the Euro zone,while Japan is still struggling toemerge from its battle with deflation.
As global money managers beganscouring various markets for the bestreturn, views on Europe and the Eurozone turned negative throughout thefirst half of the year. The spotlight on Europe ahead of sev-eral key constitutional referendums turned out to be a neg-ative factor for the Euro and encouraged additionalstrength in the U.S. dollar.
The failure by the French to approve the European Union
constitution in a key referendum was followed by anotherresounding “no” vote in the Netherlands in late spring.That news helped launch a new up leg in the dollar throughthe psychologically significant $1.25 area.
continued on p. 14
Euro/U.S. dollar (EUR/USD), weekly
The dollar’s strength is reflected in the EUR/USD rate recently testing lows frommore than a year ago.
FIGURE 2 — EUR/USD
Source: TradeStation
U.S. dollar index (DXY), daily
Despite doom-and-gloom forecasts in late 2004, the U.S. dollar posted a robustrally in the first half of 2005.
FIGURE 1 — DOLLAR COMES ALIVE IN 2005
Source: TradeStation

14 August 2005 • CURRENCY TRADER
“People began to see that the emperor wasn’t wearingany clothes,” Glassman says. “The structural reform isgoing very slowly in Europe and there is resistance to it.”
With the Euro zone expected to post gross domestic prod-uct (GDP) readings around 1.5 percent, vs. 3.5 to 4.0 percentin the U.S. for 2005, traders began to focus on the likely bet-ter returns from the U.S. capital markets.
“At the end of the day, investors are free to put theirmoney anywhere,” Glassman says. “They tend to believethe best returns will come from the regions that are growingthe fastest.”
Looking at the global market from a growth standpoint,"right now, the U.S. is the only game in town," Dolan says.
Second half U.S. economic outlookFor the most part, economists paint a rosy outlook for theU.S. in the second half. First quarter GDP delivered animpressive 3.8-percent reading, while estimates for the sec-ond quarter are a bit lower in the 3.2-percent region.However, looking to the second half, Jonathan Basile, econ-omist at Credit Suisse First Boston, expects growth to rise toaround 3.7 percent.
“We are looking for a bounce-back in economic activityfrom a slower quarter of growth in the second quarter,”Basile says.
He pointed to a mainly auto-related inventory adjust-ment in the U.S. as a factor weighing on growth in the sec-ond quarter. But, overall, Basile forecast a healthy and sus-tainable rate of spending and growth from both businessesand consumers.
“In recent weeks, everybody is more optimistic about thesecond half in the U.S.,” Glassman says. “People thoughtthe economy was slowing down, but now they are seeingthat it had more momentum than [they] originallythought.”
Inflation doesn’t appear to be a problem, despite thehigher crude oil prices, economists say. Basile forecasts coreinflation finishing out the year at around a 2.25-percentannual rate.
Job growth has been steady in the U.S., with non-farmpayrolls averaging around an 180,000 gain for the last sixmonths. In June, non-farm payrolls grew 146,000, while theoverall unemployment rate fell 0.1 percent to 5.0 percent,the lowest level since August of 2001.
“It would take a slowing in business investment to takesome of the wind out of the labor market, and I don’t expectthat to happen,” Basile says.
U.S. Fed deliveredThe Federal Open Market Committee (FOMC) continued itsrate hike campaign throughout 2005. As of its June 30 meet-ing, the FOMC had nudged short-term rates higher at thelast nine consecutive meetings, bringing the overnight FedFunds rate to 3.25 percent, while the discount rate stands at4.25 percent. Statements from U.S. Fed officials have sug-
gested that no pause will likely be seen in the rate hike out-look, with most forecasters targeting a 4.0-percent FedFunds rate by year-end.
The FOMC will meet on Aug. 9 and Sept. 20. While mar-ket players were not surprised by the rate hikes, some ana-lysts suggested the market had underestimated the overallbullish impact on the dollar, from an interest rate differen-tial standpoint. Bullish interest rate differentials shouldcontinue to underpin the U.S. in the second half, most ana-lysts say.
Looking ahead“I expect a retest of the $1.18 area and for the Euro/dollarto push lower,” says Tim Mazanec, senior foreign exchangestrategist at the Investors Bank & Trust. “Although we maybe in the very early stages of structural change in Europe,the uncertainty over elections this autumn and other uncer-tainties, together with low growth, should be bearish for theEuro.”
He points to the $1.1730 area as a medium-term target fortraders to monitor. If that level cracks, it could open thedoor to the $1.12 zone, he says. Dolan also highlights rough-ly the same area.
“If $1.1750 breaks, the dollar has potential to the$1.1350/1.1300 area,” he says.
On the upside, Mazanec sees the $1.2440 area as key. “The Euro needs to stay below that level for traders to
remain confident in the dollar rally,” he says. “Tradingabove it would likely usher in further Euro gains. So, unlesswe trade above $1.2440, sell rallies.”
Glassman held the most bullish view on the dollar. “I would not be shocked if the Euro retreated to $1.10 or
parity [over the intermediate to longer-term],” he says. “Itdidn’t make sense that the Euro was rising when that regionis under performing everyone. I personally believe it belongsat 50 cents. But, it would take a long time to get there.”
Wild cards to watchWhile a positive economic outlook for the second half andbullish interest rate differentials offer optimism for dollarbulls, there are always a number of wild card scenarios thattraders need to be on guard against. Traders should be on thelookout for weaker-than-expected economic data, whichcould stall expectations of continued Fed tightening, analystssay. Or, if a protracted political battle in Washington, D.C.develops over potential Supreme Court nominees, it couldweigh on the U.S. dollar in the short-term, analysts say.
But, aside from unexpected negative events, Glassman isoptimistic.
"If the third quarter shapes up the way people expect withpretty strong numbers, I think there is a little more room foroptimism and a little more room to run on the dollar," hesays. �
Questions or comments? Click here.
GLOBAL MARKETS continued

THE EASIER WAY TO SUBSCRIBE — GO TO:
▼ Trading Strategies and Ideas▼ Technical and Fundamental Analysis▼ Trading Technology▼ Trading as a Business▼ Industry News▼ and much more!
▼ at www.activetradermag.com —the quick and efficient way
▼ In the U.S.: $59.40 for a 1-year subscription (12 issues) or $99.00 for a 2-year subscription (24 issues)That’s a savings of $19.80!
▼ In Canada: $83.40* for a 1-year subscription (12 issues) or $140.00* for a 2-year subscription (24 issues)That’s a savings of $26.80!
▼ Internationally: $95.40* for a 1-year subscription (12 issues) or $160.00* for a 2-year subscription (24 issues)That’s a savings of $30.80!*U.S. dollars
▼ mail a check payable to: Active Trader MagazineP.O. Box 657 Mt. Morris, IL 61054-0567
▼ call 800-341-9384
▼ or use the response card in this issue
www.activetradermag.comBecome a Better Trader
Every Month with:
Go toactivetradermag.com
and click on “Subscribe”
—or call (800) 341-9384

16 August 2005 • CURRENCY TRADER
T here are good reasons to be concerned aboutthe UK second-half economic outlook.Interest rate cuts are realistic, possibly asearly as August. It is also possible the UK
economy will suffer a vicious circle if debt concerns forcegovernment spending cuts and a downward spiral in houseprices.
In the near term, interest-rate expectations remain impor-tant: The narrowing of the UK’s interest rate premium, as theU.S. continues to increase rates while the Bank of England(BOE) cuts rates, will tend to weaken the pound. Also, thepound historically has been vulnerable to sharp moves whenthere is a definitive shift in market sentiment on the curren-cy.
Although the pound will certainly be very vulnerable ifthe yield premium on short-term UK investments disap-pears altogether, the U.S. economy exhibits many of thesame vulnerabilities, particularly over the issues of debt,housing prices, and current account vulnerability. This sim-ilarity should lessen the threat of sharp UK currency losses,although over-shooting will be a risk.
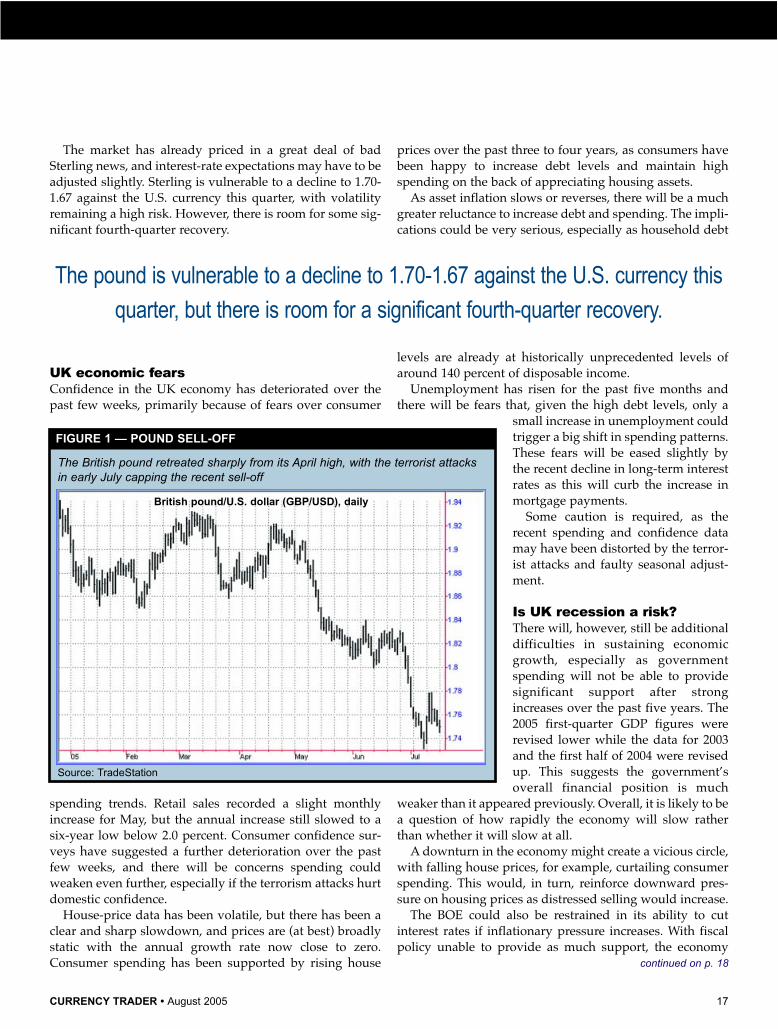
Sharp dropThe pound traded above 1.90 vs. the U.S. dollar in the sec-ond week of May, but has declined sharply since. UK eco-nomic fears were compounded by the London terroristattacks, which on July 7 pushed Sterling down sharply tojust above 1.73 (Figure 1). It quickly rallied back to 1.77 asits risk premium fell slightly and the dollar was subjected toa corrective retreat. As of July 18, the pound had weakenedagain to below 1.75. Figure 2 provides a longer-term pictureof the pound/dollar rate.
GLOBAL MARKETS
Near-term British pound vulnerability
Shared economic vulnerabilities in the U.S. and UK
reduce the odds of a dramatic move in the GBP/USD rate.
BY TIM CLAYTON
CURRENCY TRADER • August 2005 17
The market has already priced in a great deal of badSterling news, and interest-rate expectations may have to beadjusted slightly. Sterling is vulnerable to a decline to 1.70-1.67 against the U.S. currency this quarter, with volatilityremaining a high risk. However, there is room for some sig-nificant fourth-quarter recovery.
UK economic fearsConfidence in the UK economy has deteriorated over thepast few weeks, primarily because of fears over consumer
spending trends. Retail sales recorded a slight monthlyincrease for May, but the annual increase still slowed to asix-year low below 2.0 percent. Consumer confidence sur-veys have suggested a further deterioration over the pastfew weeks, and there will be concerns spending couldweaken even further, especially if the terrorism attacks hurtdomestic confidence.
House-price data has been volatile, but there has been aclear and sharp slowdown, and prices are (at best) broadlystatic with the annual growth rate now close to zero.Consumer spending has been supported by rising house
prices over the past three to four years, as consumers havebeen happy to increase debt levels and maintain highspending on the back of appreciating housing assets.
As asset inflation slows or reverses, there will be a muchgreater reluctance to increase debt and spending. The impli-cations could be very serious, especially as household debt
levels are already at historically unprecedented levels ofaround 140 percent of disposable income.
Unemployment has risen for the past five months andthere will be fears that, given the high debt levels, only a
small increase in unemployment couldtrigger a big shift in spending patterns.These fears will be eased slightly bythe recent decline in long-term interestrates as this will curb the increase inmortgage payments.
Some caution is required, as therecent spending and confidence datamay have been distorted by the terror-ist attacks and faulty seasonal adjust-ment.
Is UK recession a risk?There will, however, still be additionaldifficulties in sustaining economicgrowth, especially as governmentspending will not be able to providesignificant support after strongincreases over the past five years. The2005 first-quarter GDP figures wererevised lower while the data for 2003and the first half of 2004 were revisedup. This suggests the government’soverall financial position is much
weaker than it appeared previously. Overall, it is likely to bea question of how rapidly the economy will slow ratherthan whether it will slow at all.
A downturn in the economy might create a vicious circle,with falling house prices, for example, curtailing consumerspending. This would, in turn, reinforce downward pres-sure on housing prices as distressed selling would increase.
The BOE could also be restrained in its ability to cutinterest rates if inflationary pressure increases. With fiscalpolicy unable to provide as much support, the economy
continued on p. 18
British pound/U.S. dollar (GBP/USD), daily
The British pound retreated sharply from its April high, with the terrorist attacksin early July capping the recent sell-off
FIGURE 1 — POUND SELL-OFF
Source: TradeStation
The pound is vulnerable to a decline to 1.70-1.67 against the U.S. currency this
quarter, but there is room for a significant fourth-quarter recovery.

18 August 2005 • CURRENCY TRADER
could easily slide into recession. The more likely outcome is the housing bubble will
deflate slowly over a period of years. This could prevent afull-scale recession, but would increase the risk of below-trend growth over a sustained period.
The pound will lose interestrate edgeInterest rate trends will inevitably beimportant for Sterling, especially withfurther market speculation overaggressive Bank of England rate cuts.At the June Monetary policy meeting,two members of the nine-person com-mittee called for a rate cut and,although rates were left on hold inJuly, markets are expecting at least tworate cuts over the remainder of 2005.
The BOE is likely to be cautious,especially as there will be fears overinflationary pressure resulting fromhigh energy prices and the weakercurrency. Input prices at the producerlevel rose at the fastest annual rate inmore than 20 years in June with fur-ther strong rises probable for July. Theconsumer inflation rate also increasedfrom 1.9 percent to the 2.0 percent tar-get level in June.
U.S. interest rates are likely to risefurther over the next two months and it is certainly possibleUK rates could fall to meet U.S. rates at around 4.0 percentby early 2006. (The U.S. Federal Reserve pushed U.S. ratesto 3.25 percent at the end of June and is likely to increaserates to 3.5 percent in August.) Although it is more likelythe pound will retain a small premium vs. the U.S. dollar,there will definitely be reduced interest rate support.
UK interest rates were more than 3.5 percent higher thanU.S. rates 12 months ago, and a substantial narrowing of theyield gap would pose a very tough test for the pound con-fidence. As mentioned, Sterling is traditionally vulnerableto big moves when there is a decisive shift in confidence.
The U.S. economic data has remained firm, but there willbe considerable risks associated with high oil prices. TheU.S. economy could slow later in the third quarter and theFed is likely to consider a pause in the tightening processafter its September or November meetings. If there is apause and U.S. rates appear to have peaked, the pound willbe much less vulnerable to selling pressure.
Oil surplus eases trade fearsIn regard to purchasing power, the pound is still slightly over-valued on a trade-weighted basis, although the situation is
not extreme against the dollar; Sterling is certainly more com-fortable now than it was at levels above 1.90. The trade deficitnarrowed slightly to 4.96 billion pounds in May from anupwardly-revised 5.13 billion the previous month. The under-
lying trade concerns will become more significant if underly-ing Sterling confidence deteriorates.
The pound is no longer a petrocurrency, but the UK is stillrunning a net surplus on the oil account, which will supportSterling to some extent if oil prices stay high. This will beparticularly important given rising oil prices, which willput renewed upward pressure on the U.S. trade deficit.
U.S. weaknesses could cushion fallThe underlying UK current account deficit in the region of3 percent of GDP is a source of medium-term concern. TheU.S. economy is, however, also vulnerable because of highdebt levels and a wide current account deficit (the 2005shortfall is likely to be at least 6 percent of GDP).
In this environment, the pound should be cushionedfrom a sharp decline against the U.S. currency, particularlywith central banks unwilling to increase dollar reserve lev-els further. Overall, the similarity of fundamentals betweenthe U.S. and UK should help limit substantial pound/dollarmoves, although they cannot be ruled out.�
For information on the author see p. 6.Questions or comments? Click here.
GLOBAL MARKETS continued
British pound/U.S. dollar (GBP/USD), weekly
In July, the pound dropped below its 2004 lows to its lowest level vs. the U.S.dollar since December 2003.
FIGURE 2 — LONGER-TERM PICTURE
Source: TradeStation

Options Trader is a monthly, full-feature electronic magazine covering trading strategies, systems, market analysis, news and commentary for options traders.
Sign up now for a free subscription. Register at www.optionstradermag.com. All you need to register is an email address.
Each month you can download the current issue from the Internet using technology that combines the high-quality look and feel of a print magazine with the interactive features of Web content.
Subscribe now!www.optionstradermag.com
Sign up now for a FREEsubscription!

20 August 2005 • CURRENCY TRADER
Having made a 13-yearhigh vs. the U.S. dollarat the end of 2004(Figure 1), the British
pound has quickly retreated to levelsnot seen since December 2003. As ofJuly 21, the GBP/USD rate haddropped to 1.7269, which constituteda 10-percent decline over the past 14weeks — a drop the currency pair hadnot matched since 1993.
The decline was, unfortunatelypunctuated by two terrorist attacks inLondon that mark the July lows inFigure 2. In both instances the poundfought back quickly and gamely(especially after the July 21 episodeturned out to be more of a botchedcopy cat attack), so the question onmany forex traders’ minds waswhether Britain’s travails had pushedthe pound to a negative sentimentextreme, in which case the currencywas due for a rebound.
Although in the very near-term thatseems possible (the GBP/USD rate ral-lied strongly on Aug. 1), the larger fac-tors don’t indicate much poundstrength in the GBP/USD rate over thenext few months. “Near-term Britishpound vulnerability” reviews many ofthe fundamental economic issuesweighing on the pound. In addition,the following price analysis shows thepound has performed poorly when ithas been in similar circumstances inthe past.
There have been 38 previousinstances since October 1985 of theGBP/USD rate dropping 10 percent or
SPOT CHECK
After see-sawing the first few months of the year, the GBP/USD rate sold off in earnest in May and June. The pound has declined 10 percent vs. the dollar from December 2004 to July 2005.
Source: TradeStation
Britishpound
The pound has tumbled vs.
the dollar as of late, but does
that mean it’s setting up for
a rebound?
BY CURRENCY TRADER STAFF
FIGURE 1 — TEN-PERCENT SLIDE
The pound initially rebounded strongly after the London terrorist attack on July 7, but it soon turned down again and reached a new low just before the botched bombings on July 21.
Source: TradeStation
FIGURE 2 — JULY LOWS
British pound/U.S. dollar (GBP/USD), daily
British pound/U.S. dollar (GBP/USD), 120-minute

CURRENCY TRADER • August 2005 21
more over a 14-week period (as mentioned, thelast one was in 1993). Table 1 shows the week-to-week performance for the 12 weeks followingthese sell-offs. Not only are both the average andmedian declines negative at every weekly inter-val (which suggests the statistics are stable), thepercent of weeks closing lower (“%<0”) wasonly once less than 60 percent (week 5), andtopped 70 percent in weeks 10 and 11.
However, this negative pattern began toweaken noticeably in week 17 (not shown), andweeks 18 through 20 all had better odds of clos-ing higher than lower, and the average andmedian moves were all positive.
Figure 3 charts the average largest up moves(LUM) and average largest down moves (LDM)for the 12 weeks shown in Table 1. Although bytechnical analysis standards the market was stilloversold on July 26 (the GBP/USD was hoveringaround 1.7400), this longer-term analysis sug-gests British pound bulls should be cautiousover the next several weeks.
It remains to be seen what long-term effectsthe July 21 Chinese currency revaluation willhave (see “China abandons yuan peg” and “Detecting theprofessionals’ footprints: Lessons of the Chinese revalua-tion”), but in the first few days after the event the major cur-
rency pairs seemed to have reverted to their prior trends.Unless the buck suddenly collapses, the currentpound/dollar dynamic seems intact.�
For each of the 12 weeks after 10-percent declines, the GBP/USD ratemade bigger moves to the downside than the upside.
Median largest up move
Median largest down move
4.00%
3.00%
2.00%
1.00%
0.00%
-1.00%
-2.00%
-.300%
-4.00%
-5.00%
-6.00%
-7.00%
Ave
rage
gai
n/lo
ss
1 2 3 4 5 6 7 8 9 10 11 12
Week following 14-week, 10-percent decline (38 prior instances)
Pound/dollar: Median up moves vs. down moves
FIGURE 3 — MEDIAN UP MOVES VS. DOWN MOVES
After declining 10-percent or more over a 14-week period (as was the case on July 22, 2005), the British pound/U.S. dollarrate tended to keep declining over the next 12 weeks. By week 10, the currency pair was lower 71.05 percent of the time,and on average had moved 4.96 percent lower.
TABLE 1 — GBP/USD AFTER 14-WEEK, 10-PERCENT SELL-OFFS
Week 1 LUM LDM W2 LUM LDM W3 LUM LDMAverage -0.21% 1.03% -1.17% -0.68% 1.49% -1.97% -0.92% 1.85% -2.69%Median -0.57% 0.67% -1.13% -0.99% 0.92% -1.74% -1.44% 1.11% -2.38%Standard deviation 1.89% 1.24% 0.91% 2.63% 1.56% 1.58% 3.35% 1.95% 2.18%%<0 60.53% 60.53% 63.16%
W4 LUM LDM W5 LUM LDM W6 LUM LDMAverage -1.23% 2.11% -3.18% -1.41% 2.42% -3.59% -1.50% 2.67% -3.94%Median -1.23% 1.68% -2.63% -1.32% 1.86% -3.05% -1.44% 2.24% -3.49%Standard deviation 3.91% 2.03% 2.66% 4.11% 2.25% 2.89% 4.45% 2.34% 2.98%%<0 60.53% 57.89% 63.16%
W7 LUM LDM W8 LUM LDM W9 LUM LDMAverage -1.63% 2.84% -4.22% -1.68% 2.99% -4.49% -1.61% 3.17% -4.70%Median -1.52% 2.47% -3.84% -1.92% 2.80% -4.51% -1.45% 2.80% -4.52%Standard deviation 4.48% 2.46% 3.04% 4.53% 2.46% 3.14% 4.35% 2.44% 3.19%%<0 60.53% 60.53% 57.89%
W10 LUM LDM W11 LUM LDM W12 LUM LDMAverage -1.67% 3.68% -4.96% -1.60% 3.35% -5.06% -1.41% 3.51% -5.22%Median -1.57% 3.33% -4.92% -1.70% 3.03% -5.26% -1.46% 3.06% -5.60%Standard deviation 4.39% 2.24% 3.05% 4.62% 2.56% 3.12% 4.86% 2.65% 3.14%%<0 71.05% 71.05% 65.79%
Legend: LDM (largest down move) — largest move from the closing price of the pattern to the intraday lowest low.
LUM (largest up move) — largest move from the closing price of the pattern to the intraday highest high.

22 August 2005 • CURRENCY TRADER
How can you know what the professionals aredoing in the spot market? At first glance, theanswer is, “You can’t.” Transactions executedby banks for their clients (or their own
accounts) are confidential, and we don’t even learn the size oftrades; volume is not reported in spot forex as it is in equities.
Professional traders at banks and brokers like Citibank,Deutsche Bank, UBS, and other huge institutions have theinside track on where the “real money” is going. They canthen follow it or, in some instances (if they see it coming),front-run it.
What is real money? Real money clients are major multi-
THE BIG PICTURE
Detecting the professionals’ footprints:
Lessons of the Chinese revaluationOn paper, the Chinese renminbi revaluation is a historic event. But the market’s initial reaction
was fairly muted (if intriguing). Find out how things could play out in the forex
market in the new world of Chinese forex participation.
BY BARBARA ROCKEFELLER

CURRENCY TRADER • August 2005 23
national corporations, global investment houses, centralbanks, and other official institutions. These clients are con-sidered “real money” because they have true underlyingbusiness reasons to buy or sell currencies.
For example, let’s say you are the manager of a globalmutual fund that requires you to have 30 percent of yourfunds invested in Japanese stocks. New investor moneycomes in, and now you have to buy shares in every stocklisted in the Nikkei 225 Stock Index.
To do that, you must buy Japanese yen. Now let’s say theNikkei is reconfigured to add a few new stocks and drop afew old ones. You need to sell the stocks being kicked off thelist and buy the ones being added to it, and the ones beingadded are usually more expensive, contributing to a biggerdemand for yen. If you are the yen trader at a major bankand you are keeping track of the reconfiguration of theNikkei Stock Index, you know that your fund managerswill be buying yen and you can stock up ahead of time.
Then there is the “hot money.” Hot-money traders don’thave an underlying business reason to be doing the trades;
their trades are purely speculative. It’s called hot moneybecause it’s fickle and often short-term in nature. This istraded by speculators such has hedge funds, commoditytrading advisors, high-net worth individuals — or the guysitting just a few desks away who is trading for the bank’sown portfolio, as are his cohorts at the other major banksand brokers. Traders who trade the bank’s own money arecalled “prop” traders, for “proprietary.” Not all proptraders are in-and-out artists, but some are.
Nobody knows the ratio of real money to hot money.Most traders say hot money is a bigger proportion of totaltrading than real money, but real money is the better bet tofollow — if your client is making the trade, others in thesame business are probably making the same trade, andthus you are going to get a price trend (or at least a longer-lasting price move). In fact, the real money will providemarket “support” in some cases. In the extreme case of cen-tral bank intervention, the real money is very real and thesupport level is well-advertised.
That’s the first clue to finding the professionals’ foot-prints — support and resistance, which can be a specific
price right down the fourth decimal place, or a general area10 to 20 points on either side.
Real-money traders often have a timing choice, and theywill be consistent buyers at what they consider a low, orconsistent sellers at what they consider a high. Speculatorsalso estimate support and resistance levels, which arealways mentioned in the endless stream of market com-mentaries available in print and on the Internet. MarketNews, Reuters, Bloomberg, and the sites of banks, brokers,and advisors chew over support and resistance levels everyfew hours, since support and resistance are (usually) mov-ing targets.
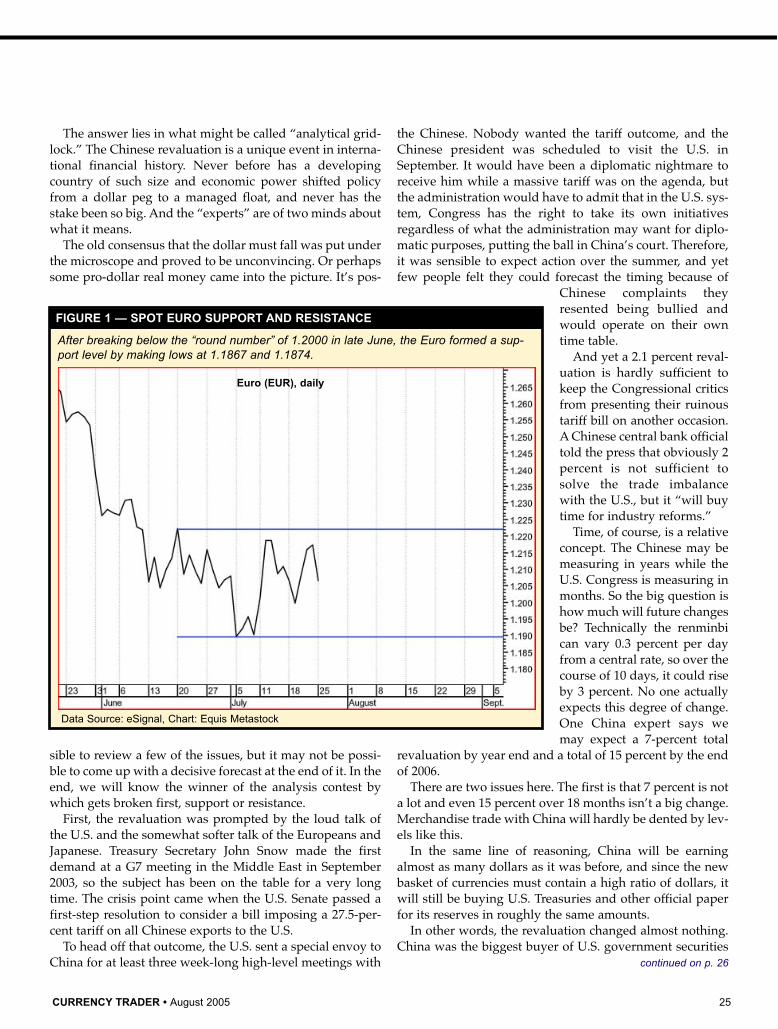
Support, resistance, and footprints Sometimes, however, support and resistance are fixed —almost always a “historic” high or low that was notewor-thy for having been the highest or lowest in a long time. Forexample, on June 24 the Euro/U.S. dollar rate (EUR/USD)passed down through the round number 1.2000 to a low of1.1983, the lowest low since the week of Sept. 3, 2004 (10
months). The market had been watching the round number for a
while, wondering if it constituted some form of magic sup-port, as round numbers sometimes do. The breakout below1.2000 (see Figure 1) implied further Euro losses. Sureenough, on July 5 the Euro hit a fresh low of 1.1867, but onJuly 8 it managed to make a low of only 1.1874 — a mereseven-point difference, but it was not a lower low, whichdidn’t escape anyone’s notice. Moreover, the bar configura-tion of those few days was not favorable to a further Eurodrop: On the date of the lowest low, the close was higherthan the open and the previous day’s close, which provedto be the configuration for most of the next five days.
This was a signal to professionals that a bottom wasforming around the support area of 1.1867-1.1874, and ifyou can’t sell it for a gain, you should buy. You might saythe stage was set for the Euro to rise and the dollar to fall,but at the same time resistance was well-established at theprevious highs around 1.2225.
The next move in this little saga was the mysterious risecontinued on p. 24
When a big move is certain to come on an announcement,
even governments can find it too tempting to resist making a few fast bucks.
24 August 2005 • CURRENCY TRADER
in the Euro on July 20. Between 1 and 3 p.m. ET — whenEuropean traders have already gone home and the U.S.market is almost finished for the day — the Euro flewupward from 1.2042 to 1.2156 by 3 p.m., an enormous moveat any time, and downright astonishing for the time of day.
Everyone was caught by surprise and scratching theirheads in wonderment — yes, there was commentary fromFederal Reserve Chairman Alan Greenspan’s semi-annualtestimony to Congress, but he didn’t actually say anythingnew and certainly nothing dollar-negative. What reallyhappened? One story had it that orders to sell dollars and
buy Swiss francs and Euros were coming out ofSwitzerland, and perhaps from an official institution. Westill didn’t know why the orders had been placed, but thesize of the move as well as the timing pointed to a real-money source rather than a mere speculator.
The next morning the real news broke — China wasrevaluing the renminbi against the dollar by 2.1 percent andinstituting a managed float based on a new and undisclosedbasket of currencies. When the Chinese revaluation reportcame out, the Euro rose against the dollar immediately,from 1.2139 to 1.2255. The dollar/yen rate tumbled from112.31 to 110.34 within the first hour. For a short while, atleast, it looked like resistance was broken and the Euro wasoff to the races.
In the nearly two years the Chinese revaluation was onthe radar screen, two forex forecasts had become the con-sensus. First, the yen would strengthen in line (or more)with the renminbi, since China is now Japan’s leading tradepartner. Second, it was curtains for the dollar, meaning theEuro would rise. The dollar should fall because the relief inthe U.S. trade deficit would be small unless China revaluedby 30 to 40 percent, which was politically impossible, andbecause a shift to pricing the renminbi against a basket ofcurrencies instead of just the dollar would reduce the needfor the People’s Bank of China to buy U.S. Treasuries. Adrop in demand for Treasuries would cause the price to falland the yield to rise, which sounds good until you realizehigher yields could burst the housing bubble (or “froth,” asGreenspan describes it). With the U.S. consumer reducing(or at least not increasing) spending, the U.S. economywould stumble, growth would fall, and the Fed would bethinking about cutting rates some three to six months afterthe event.
Sure enough, the day after the Chinese revaluation, the
yield on the 10-year T-note soared to 4.276 percent on theassumption foreign demand for Treasuries would fall. Noone knows if this is the correct interpretation of events.There’s no evidence of lower demand, and even if officialdemand falls, private demand may be a perfectly adequatesubstitute. Remember, much of the foreign capital inflowinto U.S. government paper comes from the UK andCaribbean havens, where the banks are “fronting” for thereal customers. They may be Middle East oil sheiks — ornewly rich Chinese businessmen.
Were the dramatic moves in the Swiss franc and Euroahead of the announcement evidence the Chinese revalua-tion was leaked ahead of time? And if it was leaked, whydid the Euro rise, and not the yen? After all, the yen madean even bigger move after the release.
We will never know if the puzzling Euro rise was theresult of a pre-announcement leak, and if so, who wasbehind it. Perhaps the Chinese themselves bought someEuros, or Chinese officials with private accounts. Becausethe Chinese were emulating the Monetary Authority ofSingapore’s methodology, maybe it was the MAS. SinceHong Kong and the U.S. were alerted ahead of time, theymight have been the source of the buying, too.
For all we know, other central banks (and therefore theirgovernment officials) were told as well, not to mention theIMF and the Bank for International Settlements, which werecertainly part of the pre-revaluation decision process. Whena big move is certain to come on an announcement, it’s tootempting to resist making a few fast bucks, even if you’re agovernment. One possible reason why the yen didn’t moveis because Japanese Ministry of Finance has been threaten-ing for some time that it would intervene if it saw the yenmove inappropriately.
An event like this comes along very rarely, but when itdoes, you want to be able to jump on the bandwagon,because there’s usually “real money” behind it. The ear-marks of such a move is that it is large, unexplained and inthe opposite direction of the existing trend. In the case of thetrading ahead of the Chinese revaluation, the time of daycontributed to the mystery.
How will it play out?From experience, a big real-money move like this will con-tinue in the same direction, breaking the previous trend andinvalidating the old support levels. But this time the Eurohigh over previous resistance was only an anomaly, and itdoesn’t show up on Figure 1 because the chart was taken asa 5 a.m. ET snapshot of the currency market, excluding dailyhighs and lows. If it was a real-money move, it fizzled; bythe next day, the price was back in the old range. The cur-rencies failed to hang on to gains and the Swiss franc, Euro,and yen all fell back in the first few days after the announce-ment. This is quite confusing. Where’s the follow-through?
THE BIG PICTURE continued
China’s goal is not to revalue; it’s to
build a sustainable forex regime.
CURRENCY TRADER • August 2005 25
The answer lies in what might be called “analytical grid-lock.” The Chinese revaluation is a unique event in interna-tional financial history. Never before has a developingcountry of such size and economic power shifted policyfrom a dollar peg to a managed float, and never has thestake been so big. And the “experts” are of two minds aboutwhat it means.
The old consensus that the dollar must fall was put underthe microscope and proved to be unconvincing. Or perhapssome pro-dollar real money came into the picture. It’s pos-
sible to review a few of the issues, but it may not be possi-ble to come up with a decisive forecast at the end of it. In theend, we will know the winner of the analysis contest bywhich gets broken first, support or resistance.
First, the revaluation was prompted by the loud talk ofthe U.S. and the somewhat softer talk of the Europeans andJapanese. Treasury Secretary John Snow made the firstdemand at a G7 meeting in the Middle East in September2003, so the subject has been on the table for a very longtime. The crisis point came when the U.S. Senate passed afirst-step resolution to consider a bill imposing a 27.5-per-cent tariff on all Chinese exports to the U.S.
To head off that outcome, the U.S. sent a special envoy toChina for at least three week-long high-level meetings with
the Chinese. Nobody wanted the tariff outcome, and theChinese president was scheduled to visit the U.S. inSeptember. It would have been a diplomatic nightmare toreceive him while a massive tariff was on the agenda, butthe administration would have to admit that in the U.S. sys-tem, Congress has the right to take its own initiativesregardless of what the administration may want for diplo-matic purposes, putting the ball in China’s court. Therefore,it was sensible to expect action over the summer, and yetfew people felt they could forecast the timing because of
Chinese complaints theyresented being bullied andwould operate on their owntime table.
And yet a 2.1 percent reval-uation is hardly sufficient tokeep the Congressional criticsfrom presenting their ruinoustariff bill on another occasion.A Chinese central bank officialtold the press that obviously 2percent is not sufficient tosolve the trade imbalancewith the U.S., but it “will buytime for industry reforms.”
Time, of course, is a relativeconcept. The Chinese may bemeasuring in years while theU.S. Congress is measuring inmonths. So the big question ishow much will future changesbe? Technically the renminbican vary 0.3 percent per dayfrom a central rate, so over thecourse of 10 days, it could riseby 3 percent. No one actuallyexpects this degree of change.One China expert says wemay expect a 7-percent total
revaluation by year end and a total of 15 percent by the endof 2006.
There are two issues here. The first is that 7 percent is nota lot and even 15 percent over 18 months isn’t a big change.Merchandise trade with China will hardly be dented by lev-els like this.
In the same line of reasoning, China will be earningalmost as many dollars as it was before, and since the newbasket of currencies must contain a high ratio of dollars, itwill still be buying U.S. Treasuries and other official paperfor its reserves in roughly the same amounts.
In other words, the revaluation changed almost nothing.China was the biggest buyer of U.S. government securities
continued on p. 26
Euro (EUR), daily
After breaking below the “round number” of 1.2000 in late June, the Euro formed a sup-port level by making lows at 1.1867 and 1.1874.
FIGURE 1 — SPOT EURO SUPPORT AND RESISTANCE
Data Source: eSignal, Chart: Equis Metastock

26 August 2005 • CURRENCY TRADER
in the 12 months ending May 2005, when its accumulatedTreasuries totaled $243.5 billion, the second biggest officialholder after Japan. Asian central banks and privateinvestors owned more than half of the $2.03 trillion ofTreasuries held by foreigners, out of the roughly $4.03 tril-lion in marketable U.S. securities outstanding. Whether therevaluation is 2.1 percent or 15 percent, China is still a majorplayer in the capital flow picture. They have the same stakein preserving the value of their asset, which we call theGolden Goose argument (see “The Golden Goose Rule,”Currency Trader, February 2005).
The dollar is still going to be a big piece of the reserve piein China. First, we don’t assume the Chinese would haveleft reserve diversification until after the revaluation. Buteven if they did, the undisclosed basket of currencies thatwill be the basis of the new floating renminbi must consistlargely (probably about 50 percent) of dollars or dollar-pegged currencies such as the Hong Kong dollar. The needfor serious diversification on a transaction basis is low. Theonly reason to diversify much or to talk about diversifica-
tion would be political — to “punish” the U.S. for someother action in the military or diplomatic sphere.
It took a lot of wind out of speculative sails to acknowl-edge these points. Not much has changed. The U.S. will stillbe running massive trade deficits with China, and Chinawill still be holding massive amounts of U.S. paper.
One other thing is becoming clear: By depriving specula-tors of a fat, one-time gain, China is only inspiring them —and probably a new group of speculators, to boot. Hot moneycapital inflows can only rise. Because the Chinese are verysmart about how markets work, you have to wonder if this isnot their intention. They complain about the inflationaryeffect of inflows, but for some interim period, inflows must bewhat they want. Developing economies always want capitalinflow, and China has had it in spades over the past threeyears. This is not really different from the powerhouse U.S.economy funded by European capital inflows in the 1800s.
If hot-money inflows into China grow bigger as the rateis seen to be managed at too tame a level, the Chinese cancontinue to sterilize them by buying up the dollars and then
THE BIG PICTURE continued

CURRENCY TRADER • August 2005 27
investing them in Treasuries, as before; the yield on the 10-year bond can remain constrained. The current thinking isthat rates would be about 1 percent higher were it not forforeign (including Chinese) demand for U.S. paper. Thehousing market is safe from precipitous rate increases.
But hot capital flowing into China can spill over toTaiwan, S. Korea, and elsewhere, in a speculative effort toget them to unpeg, too. This means outright dollar sales, sothe net effect is dollar-negative. In fact, according to thisview, the dollar must fall because the 2.1-percent revalua-tion is too skimpy. It needs to be more like 30 to 40 percentto stop the interest-rate/dollar game and establish stablerelationships.
Therefore, the Chinese choice of a token 2.1 percent reval-uation is not a stabilizing influence on the global imbalance,but potentially a destabilizing one — and discord withinthe Chinese government about the extent and timing ofadditional moves is a frightening prospect.
Do the Chinese really have a plan, and what is it? TheChinese announcement contained magnificent statements
to the effect that China seeks “to enable the market to fullyplay its role in resource allocation,” but China’s goal is notto revalue, it’s to build a sustainable forex regime. It is inthis sense that what’s in China’s best interest is not neces-sarily what’s in the interests of the rest of the world.
Because the Chinese central bank reserves to itself theright to adjust the renminbi band whenever and however itchooses, we now have the tiresome task of following thepace and extent of upcoming renminbi price changes andhow they affect trade and capital flows, if any.
Clearly the benchmark Euro/dollar exchange rate can’tstay stuck forever in the range shown in Figure 1, but untilwe have a better view of the Chinese thinking on the sub-ject — and actions speak louder than words — the maincurrencies are hostage to indecisiveness and range-trading.Keep your eyes peeled for the breakout of either the sup-port or resistance line.�
For information on the author see p. 6.Questions or comments? Click here.
28 August 2005 • CURRENCY TRADER
W hen trading currencies, you’re essential-ly dealing with the relationshipsbetween countries and their economies.The interest rate differential between
countries plays a pivotal role in deciding which currenciesto buy and which to sell.
Markets that offer the highest returns on investmentattract the most capital. In the world of international capitalflows, nations that offer the highest interest rates (alongwith solid credit ratings) will generally attract the most cap-ital and create the most demand for their currencies. Whenyou buy a currency, you earn its interest, while you are obli-gated to pay interest when you sell a currency.
The carry trade is designed to capitalize on the relation-ship between two countries’ interest rates and currencies. Ina nutshell, a carry trade involves buying (or lending) a cur-rency with a high interest rate while selling (or borrowing)a currency with a low interest rate — hence netting a posi-tive interest rate differential. For more information on themechanics of the carry trade, see “Getting a lift from thecarry trade,” Currency Trader, October 2004, p. 32.)
Although earning interest rate differentials on the degreeof 2 to 4 percent may not seem very compelling, the highleverage available in the forex market makes the carry tradean extremely attractive strategy in the right circumstances.Using 10 to 1 leverage (1-percent margin), that 2- to 4-per-
cent interest rate differential becomes a potential 20- to 40-percent profit. Of course, leverage comes with risk, whichmeans losses will be exaggerated the same way as profits.
Another benefit of the carry trade is the added potentialfor capital appreciation — i.e., in the form of price gains ifthe currency you are long gains ground against the curren-cy you are short. The key to the carry trade is determiningwhich countries and currencies offer the most favorablerelationship. Recent history has shown how quickly thingscan change in this respect.
Out with the old, in with the newThroughout 2002, 2003, and part of 2004, the Australian dol-lar (AUD), New Zealand dollar (NZD), and British pound(GBP) were the most popular currencies to buy for carrytrades because these countries offered some of the highestinterest rates in the world. (Their central banks were thefirst to raise rates when the global economy slowed downafter the tech bubble burst in 2000.)
The Japanese yen (JPY), Swiss franc (CHF), and U.S. dol-lar (USD), on the other hand, were the most popular cur-rencies to sell in carry trades because these countries hadsome of the lowest interest rates. The U.S. and Switzerlandwere, in fact, two of the last major countries to raise rates,while Japan still maintains a zero interest rate policy.
The most popular carry trades included AUD/JPY,
TRADING STRATEGIES
Dollar-yen:The year’s hottest carry trade
The buck was on the short side of many carry trades last year, but the current interest rate hike cycle
offers the opportunity to go long the dollar and short the yen.
BY KATHY LIEN

CURRENCY TRADER • August 2005 29
GBP/JPY, GBP/CHF, AUD/USD, and NZD/USD. Carrytraders were able to benefit from interest income as well ascapital appreciation as other traders piled into the sametrades. However, all good things eventually come to an end,and for most of 2005 these currency pairs either sold off orremained range-bound — to the frustration of many carrytraders.
Yet hope is not completely lost for those who still want toget involved in carry trades. The U.S. dollar/Japanese yen(USD/JPY) currency pair has emerged as the hottest carrytrade of 2005. The popularity of this pair as the new carrytrade has even triumphed over any concerns about theJapanese yen rallying on the back of Chinese revaluation.USD/JPY did rally on the announcement, but most losseswere quickly recouped as the market shifted its attentionback to interest rates.
It’s all about the interest rates For carry trades, the most important question to ask is,“Where are interest rates headed?” The carry trades that are
likely to profit in the future are not necessarily the ones thatalready have high interest rate differentials, but rather theones that are setting up to have increasingly higher interestrates going forward. The USD/JPY currency pair fits thisdescription perfectly.
Since June 2004 the U.S. Federal Reserve has increasedinterest rates by 250 basis points, from a 45-year low of 1percent to the current rate (as of July 31) of 3.25 percent. Theonly other major countries with tradable currencies thathave increased interest rates this year are Australia andNew Zealand — and they have hiked rates only once thisyear, compared to four times for the U.S.
The U.S.’s campaign of aggressively raising interest rateshas led to a sharp dollar rally since the beginning of theyear. Figure 1 illustrates the strength of the dollar rally:USD/JPY has soared more than 1,000 pips (points) sinceJanuary; against the Euro, the dollar has rallied 1,600 pips.
There are many ways to explain this rally, but the mostimportant catalyst is interest rates. The U.S. dollar went
continued on p. 30
U.S. dollar/Japanese yen (USD/JPY), daily
The dollar has rallied strongly vs. the yen in 2005 (especially since May), as the Federal Reserve has hiked interest rates 2.5points since last June.
FIGURE 1 — DOLLAR/YEN (USD/JPY) RATE
Source: eSignal (www.esignal.com)

30 August 2005 • CURRENCY TRADER
from being one of the highest-yielding currencies in theworld during the Internet boom (with interest rates as highas 6.5 percent in June 2000) to one of the lowest-yieldingcurrencies in the world when interest rates were subse-quently slashed to 1 percent. This caused a huge flow ofmoney out of dollar-denominated investments, a phenome-non that was exacerbated by capital leaving the U.S. fol-lowing the tech collapse in 2000.
Many hedge funds and speculators at the time sold thedollar, hoping for widening interest rate differentialsbetween the greenback and other currencies. These tradersmade out very well: Most carry trades, such as theAUD/USD and NZD/USD, appreciated more than 35 per-cent in less than two years (see Figure 2). Over the past year,the same speculators are covering their short-dollar trades,hence causing the dollar to rally strongly.
In the case of the EUR/USD, the currency pair went fromoffering a positive interest rate differential of 1.25 percent inMarch 2003 to now offering a negative interest rate differ-ential of 1.25 percent. This provides a perfect reason toexplain why those who were long the EUR/USD as a carrytrade have either closed or reversed their positions. With atleast two to three more interest rate hikes expected from theFederal Reserve (while most other central banks are expect-ed to do nothing), the dollar is still being supported bytraders looking to go long the currency pair for carry.
The yen is the perfect currency to short vs. the U.S. dollar
in a carry trade because of Japan’s zerointerest rate policy. In fact, the yenhappens to be the favorite currency fortraders to sell against in a carry tradebecause for the most part, traders arepaying next to nothing for borrowingthe currency. The Bank of Japan (BOJ)continues to stand pat on rates. Withmixed growth and deflation still a real-ity at this point, the BOJ feels nourgency to raise rates and threatenJapan’s still feeble economic recovery.
This is especially relevant in the cur-rent environment of skyrocketing oilprices. Japan imports 99 percent oftheir oil (the U.S. imports about 50 per-cent). Their lack of domestic sources ofenergy and their need to import vastamounts of crude oil, natural gas, andother energy resources make them par-ticularly sensitive to changes in oilprices. If crude continues to rise, it willsap global demand and weaken pur-chases of Japanese exports. If oil pricesremain firm, the yen should continueto selloff, which would be very benefi-cial for USD/JPY carry traders who are
looking for both increasing interest rate differentials andcapital appreciation.
The fine print: Trade risksThe yield in the USD/JPY currency pair has gone from 2.25percent in the beginning of the year to 3.25 percent as of July— with the possibility of going to 4 percent by November.This has made USD/JPY the hottest carry trade of the year.As long as the U.S. remains on track to raise rates whileJapan’s rates remain unchanged, USD/JPY will continue toaccelerate.
However, there are risks USD/JPY carry traders need toknow about. Because the USD/JPY carry trade is contingentupon a continual tightening campaign by the FederalReserve, traders need to watch the trend of U.S. economicdata to ensure it supports the case for higher rates. Forexample, if U.S. economic data begins to turn sour becauseof weaker consumer demand (in the face of higher oilprices), the Fed may be forced to stop raising rates soonerrather than later, potentially capping interest rates at 3.75percent instead of 4 percent.
Another possible risk is to the Japanese yen. China hasannounced on July 21 it was moving to a managed floatagainst a basket of currencies, revaluing the yuan by a sur-prisingly small 2 percent. There is speculation that furtherrevaluation may occur down the road, given the nominalsize of the latest revaluation.
TRADING STRATEGIES continued
Australian dollar/U.S. dollar (AUD/USD), weekly
Australian dollar/Japanese yen (AUD/JPY), weekly
Carry trades that performed well in previous years included long positions in theAustralian dollar/U.S. dollar rate (top) and the Australian dollar/Japanese yenrate (bottom). However, over the past year, these currency pairs have movedmostly sideways.
Source: TradeStation
FIGURE 2 — CARRY TRADES OF 2003-2004
CURRENCY TRADER • August 2005 31
China, however, refuted their own statement by sayingthat even though Central Bank Governor Zhou Xiaochuansaid this was an “initial 2-percent adjustment” and that theywill gradually continue to reform the country’s exchangerate system, it was wrong to think that this was a first stepthat “warrants further actions in the future.” China stressedthat “gradualism” is key and from the looks of it, they seemto be trying to convince the markets that gradualism will bedone over the course of months or even years.
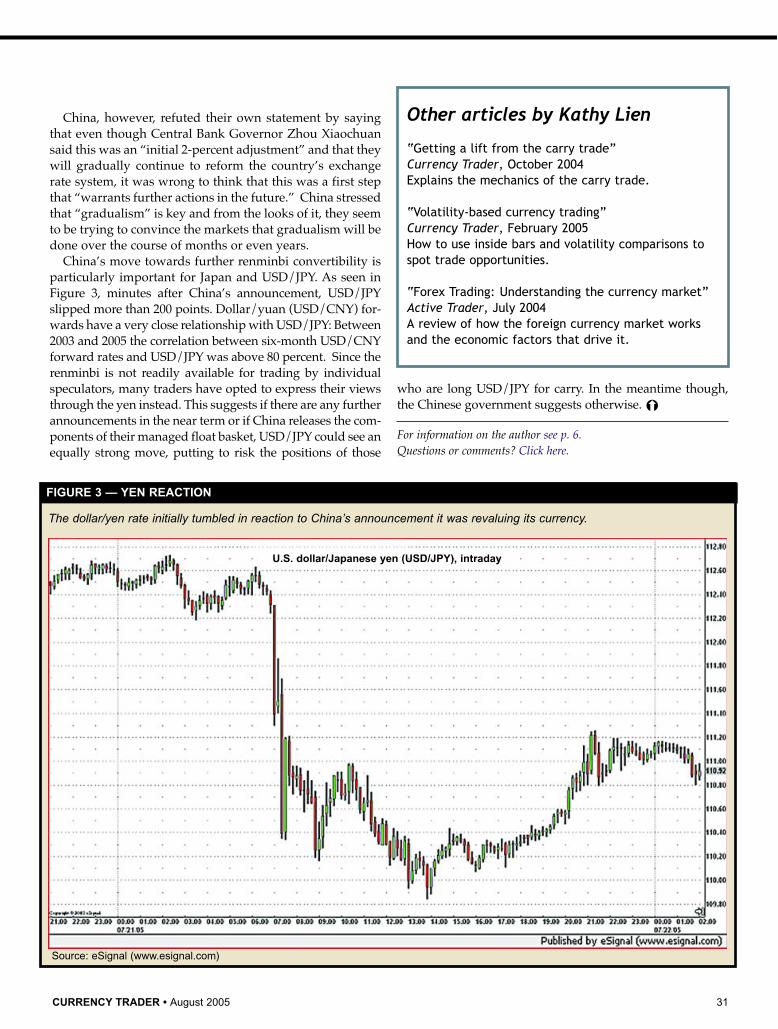
China’s move towards further renminbi convertibility isparticularly important for Japan and USD/JPY. As seen inFigure 3, minutes after China’s announcement, USD/JPYslipped more than 200 points. Dollar/yuan (USD/CNY) for-wards have a very close relationship with USD/JPY: Between2003 and 2005 the correlation between six-month USD/CNYforward rates and USD/JPY was above 80 percent. Since therenminbi is not readily available for trading by individualspeculators, many traders have opted to express their viewsthrough the yen instead. This suggests if there are any furtherannouncements in the near term or if China releases the com-ponents of their managed float basket, USD/JPY could see anequally strong move, putting to risk the positions of those
who are long USD/JPY for carry. In the meantime though,the Chinese government suggests otherwise. �
For information on the author see p. 6.Questions or comments? Click here.
Other articles by Kathy Lien
“Getting a lift from the carry trade”Currency Trader, October 2004Explains the mechanics of the carry trade.
“Volatility-based currency trading”Currency Trader, February 2005How to use inside bars and volatility comparisons tospot trade opportunities.
“Forex Trading: Understanding the currency market”Active Trader, July 2004 A review of how the foreign currency market worksand the economic factors that drive it.
U.S. dollar/Japanese yen (USD/JPY), intraday
The dollar/yen rate initially tumbled in reaction to China’s announcement it was revaluing its currency.
FIGURE 3 — YEN REACTION
Source: eSignal (www.esignal.com)

32 August 2005 • CURRENCY TRADER
T he parabolic stop is a trailing stop techniquedeveloped by Welles Wilder and explained in hisbook New Concepts in Technical Trading (TrendResearch, 1978). It’s the primary component of
what he calls the “Parabolic Time/Price” trading system. The basic principle behind the parabolic stop is a calcula-
tion that automatically raises (in the case of a long trade) orlowers (in the case of a short trade) a stop-loss order thatprotects existing profits in a trade.
For simplicity, the following discussion is given in termsof long trades — the rules are inverted for short trades.
CalculationThe formula for calculating the parabolic stop level fortomorrow’s trading day (when using daily price bars) is:
Ptomorrow = Ptoday + AF * (EPtrade - Ptoday)
where
Ptoday = Today’s parabolic stopvalueAF = Acceleration factor; thedefault value which begins at .02and increases by .02 increments(for each bar that establishes anew high during the trade) to amaximum of .20EP = Extreme price since thetrade was initiated (highest highif long, lowest low if short)
To walk through the calculations,assume a long trade was establishedyesterday in the Euro/U.S. dollar rate(EUR/USD) at 1.1965, with an initialstop-loss of 1.1870 that is still in effecttoday. Today’s high of 1.2084 washigher than yesterday’s high, whichmeans it is the extreme price (EP in theprevious formula) since the tradebegan. This changes the formulaslightly:
Ptomorrow = Ptoday + AF * (Htoday - Ptoday)
where
Htoday = Today’s high (the extreme price)
Because this is the first day of the calculation, there is noparabolic stop level. This means we must use the initial stopfor the trade (1.1870) as Ptoday in the formula. Plugging inthese values results in:
Ptomorrow = 1.1870 + .02 * (1.2084 - 1.1870)Ptomorrow = 1.1870 + .0004 = 1.1874
If tomorrow EUR/USD rallies to a new high of 1.2250, theparabolic stop level for the following day would be:
INDICATOR BASICS
The red dots mark the parabolic stop levels, which in this case switch from protecting a short position in early July to protecting a long position when themarket turns higher.
FIGURE 1 — PARABOLIC STOP
Source: TradeStation
Parabolic stopThe “parabolic” indicator/system is a mechanical method for applying a trailing stop and following trends.
BY CURRENCY TRADER STAFF

CURRENCY TRADER • August 2005 33
Ptomorrow = 1.1874 + .04 * (1.2250 - 1.1874)Ptomorrow = 1.1874 + .0015 = 1.1889
Notice here the acceleration factor increased from .02 to.04 and the previous day’s parabolic value is now used inthe formula. The greater the acceleration factor, the more“tightly” the stop will track prices. The AF increases by .02only for a bar that establishes a new EP (high price) in thetrade. If the stock had not made a new high, the previoushigh of 1.2084 would have been used as the EP and the AFwould have remained at .02.
Figure 1 shows the parabolic indicator applied to dailyprices of the EUR/USD rate.
Interpretation and useThe parabolic stop is a mechanical way of implementing a“trailing stop” — a stop order that follows behind a trade,progressively rising with the market in a winning long tradeand declining with the market in a winning short trade.
It gives a trade more room to “breathe” in the first sever-al bars of its lifetime and subsequently trails the positioncloser and closer until the trade is stopped out.
As mentioned, the parabolic stop isactually the basis of Wilder’s parabolictrading system, a mechanical strategythat is always in the market, long orshort. He referred to the parabolic stoplevels as stop-and-reverse (SAR)points, because when a position wasstopped out, another trade in theopposite direction was established atthe same time. For example, if youwere long one lot of a currency pairand hit the SAR point, you would selltwo lots — one to liquidate the longtrade and another to establish a newshort position.
However, this type of calculationdoes not need to be used in stop-and-reverse fashion — that is, it can beused solely as an exit technique andnot an entry technique.
Figure 2 shows the parabolic on achart of daily Japanese yen futures.Testing the parabolic stop-and-reversesystem with the default AF setting of.02 on five years of daily yen futuresprices through July 21, 2005 producedthe trade performance shown in Table1.
Key pointsAs the acceleration factor increases, the stop moves pro-gressively closer to price. However, once the accelerationfactor has increased to .20, it cannot go higher, meaning thestop will not move closer to the price series after that point.(Some analysis software allows you to adjust the accelera-
In addition to the parabolic stop points, the arrows show trades based on pricemoving above and below these levels. The parabolic stop uses an “accelera-tion factor” to move the stop increasingly closer to the price trend as time pass-es. Thus, trades are given more room to breathe early in their lives, and lessas profits accumulate.
FIGURE 2 — PARABOLIC STOP
Source: TradeStation
Testing the default parabolic parameters on five years ofdaily yen prices (and deducting $30 per trade for commis-sion and slippage) produced overall profitable results,although short trades lost money. The annualized returnwas 2.14 percent.
TABLE 1 — PARABOLIC SYSTEM ON JAPANESE YEN FUTURES (7-21-00 TO 7-21-05)
Source: Test conducted on TradeStation
All Long Short trades trades trades
Net Profit $8,902.50 $10,687.50 -$1,785.00
Number of Trades 91 45 46
Percent profitable 40.66% 44.44% 36.96%
continued on p. 34

34 August 2005 • CURRENCY TRADER
tion factor limit.)The parabolic stop always moves in the direction of the
trade; if it is rising with a long trade, it will never be lowerthan the previous day’s stop value, even if price movesdown.
Wilder’s parabolic system was essentially a trend-follow-ing system that sought to capture intermediate to longer-term price moves in trending markets.
The parabolic stop approach does not adjust for volatili-ty. For example, it doesn’t give a trade more room to fluctu-ate when market volatility increases. This may cause a tradeto be stopped out prematurely.
Bottom lineThe parabolic stop is a mechanical trailing stop strategy thatmoves a stop closer to price at an accelerated rate as timepasses. The concept of “tightening stops” to lock in profitsas a trade progresses is not a unique one, but Wilder’s sys-tematic approach to the process has been used as the basisfor a number of trading strategies that attempt to automat-ically capture trends.�
Questions or comments? Click here.
INDICATOR BASICS continued
Related reading
“Parabolic time-price (PTP) system”by Volker Knapp (Active Trader, December 2004)This Active Trader System Lab tests a system basedon the Parabolic Stop and Reverse (SAR) indicatorpublished by Welles Wilder in his 1978 book, NewConcepts in Technical Trading Systems.
“Improving the curve: The Parabolic plus noise-filter system”by Dennis Meyers (Active Trader, May 2002)In this Advanced Strategies article, the author designsand tests a system that adds filters to make the para-bolic system more robust and reliable.
You can purchase and download past Active Trader arti-cles at www.activetradermag.com/purchase_articles.htm
Purchase past Active Trader articles!Purchase and download back articles
directly from the Active Trader Web site.
Search for articles by • Subject • Author
• Article Name • Issue
Pay by credit card and download directly to
your computer — no waiting!
$4.95Shopping made easy!
and less
Check out "Article Download
of the Week" feature for special discounts
on select articles.

36 August 2005 • CURRENCY TRADER
CURRENCY FUTURES
The information does NOT constitute trade signals. It is intended only to provide a brief synopsis of each market’sliquidity, direction, and levels of momentum and volatility. See the legend for explanations of the different fields.
This information is for educational purposes only. Currency Trader provides this data in good faith, but cannot guarantee its accuracy or timeliness. Currency Trader assumesno responsibility for the use of this information. Currency Trader does not recommend buying or selling any market, nor does it solicit orders to buy or sell any market. There isa high level of risk in trading, especially for traders who use leverage. The reader assumes all responsibility for his or her actions in the market.
LEGEND:Sym: Ticker symbol.Vol: 30-day average daily volume, in thousands.OI: 30-day open interest, in thousands.10-day move: The percentage price move from theclose 10 days ago to today’s close.20-day move: The percentage price move from theclose 20 days ago to today’s close.60-day move: The percentage price move from theclose 60 days ago to today’s close.
The “% rank” fields for each time window (10-daymoves, 20-day moves, etc.) show the percentile rank ofthe most recent move to a certain number of the previ-ous moves of the same size and in the same direction.For example, the % rank for 10-day move shows howthe most recent 10-day move compares to the pasttwenty 10-day moves; for the 20-day move, the % rankfield shows how the most recent 20-day move com-pares to the past sixty 20-day moves; for the 60-daymove, the % rank field shows how the most recent 60-day move compares to the past one-hundred-twenty 60-day moves. A reading of 100% means the current read-
ing is larger than all the past readings, while a readingof 0% means the current reading is lower than the previ-ous readings. These figures provide perspective fordetermining how relatively large or small the mostrecent price move is compared to past price moves.Volatility ratio/% rank: The ratio is the short-termvolatility (10-day standard deviation of prices) divided bythe long-term volatility (100-day standard deviation ofprices). The % rank is the percentile rank of the volatilityratio over the past 60 days.
CURRENCY FUTURES SNAPSHOT as of 7/20/05
After a good 2003 (11.08 percent) and a so-so 2004(2.36 percent), commodity trading advisors(CTAs) focusing on currencies arestruggling to keep their heads
above water, according to the Barclay Group(www.barclaygrp.com), which tracks CTA andhedge fund performance.
As of July 27 (with more than 98 percent offunds reporting), the Barclay Currency TraderIndex was down .80 percent on the year. Theindex’s June return was up 1.65 percent.
However, currency traders were not neces-sarily underperforming other CTAs. Barclay’soverall CTA index was down 1.33 percentthrough June, and only three (Agricultural,Discretionary, and Financial/Metal) of its sixsub-indices were in the black.
Traders and investors looking for more informationabout currency fund managers will now have a more time-
ly tool at their disposal. In late July the Barclay Grouplaunched a new forex barometer — the BTOP FX Index
(“Barclay Top 50%”), a “currency traders” indexthat provides daily net rates of return for thelargest currency managers.
The Barclay Group updates the BTOP FXIndex daily, posting the previous day’s data onits Web site by 10:30 a.m. CT. (Daily returnssince the beginning of 2005 can be downloadedin Excel format.)
In the company’s press release, Barclay’spresident Sol Waksman pointed to the contin-ued growth and importance of currency trad-ing in the decision to launch the new index,which complements the firm’s existing
Currency Traders Index and tracks monthlyreturns in the currency sector.
“Given its size and given the increased interest in overlaystrategies among institutional investors, the global currency
Contract Pit Elec Exch Vol OI 10-day % 20-day % 60-day % Volatility sym sym move rank move rank move rank ratio/% rank
Eurocurrency EC 6E CME 133.4 137.5 1.90% 100% -0.24% 4% -6.30% 72% .18 / 7%Japanese yen JY 6J CME 43.2 127.2 -0.58% 11% -4.25% 91% -6.10% 100% .22 / 7%British pound BP 6B CME 27.8 68.4 -0.81% 24% -4.73% 98% -8.82% 99% .21 / 13%Canadian dollar CD 6C CME 27.6 69.2 1.31% 35% 0.77% 23% 1.48% 47% .39 / 42%Swiss franc SF 6S CME 26.6 71.5 1.27% 100% -1.70% 18% -7.42% 85% .17 / 7%Australian dollar AD 6A CME 17.0 64.2 2.29% 100% -2.88% 78% -3.00% 53% .44 / 40%Mexican peso MP 6M CME 11.6 98.2 1.72% 90% 2.05% 74% 4.08% 91% .38 / 70%U.S. dollar index DX NYBOT 2.7 27.7 -1.16% 100% 1.32% 25% 6.46% 81% .20 / 3%Euro / Japanese yen EJ NYBOT 1.2 10.7 2.52% 100% 4.20% 100% -0.19% 7% .31 / 48%Euro / Swiss franc RZ NYBOT 0.9 16.4 0.63% 45% 1.51% 88% 1.19% 68% .57 / 58%Note: Average volume and open interest data includes both pit and side-by-side electronic contracts (where applicable). Price activity is based on pit-traded contracts.
Currency fund managers treading water in 2005
Barclay Group launches new forex indexBY CURRENCY TRADER STAFF

CURRENCY TRADER • August 2005 37
markets are an area of opportunity for investors seeking todiversify their risk exposures and sources of alpha,”Waksman says. “We believe the Barclay BTOP FX Index willincrease transparency in this fertile investment arena.”
The release also states the BTOP FX Index is designed to“replicate the overall composition of the currency sector ofthe managed futures industry,” including trading style andmarket exposure. Historical returns for the BTOP FX have acorrelation of 0.87 with the Barclay Currency Traders Index,although the new index has a couple of unique characteris-tics.
“The BTOP FX will allow us to publish daily rates ofreturn on a timely basis,” Waksman says. “Also, this indexis potentially investable. Neither of these two possibilitieswere available with the Barclay Currency Traders Index.”
According to Barclay’s, the BTOP FX Index includes thelargest (as measured by assets under management)investable currency trading programs. In each calendaryear the index’s currency trading programs will represent“no less than 50 percent of the investable assets of the
Barclay Currency Traders Universe.” Participating pro-grams can trade either currency futures or spot forex.
The BTOP FX index daily rate of return on July 26 was+.52 percent, while the July month-to-date return was -.13percent and the 2005 year-to-date return was +.57 percent— a figure that stood in contrast to the larger CurrencyTraders Index YTD return of -.80.�
NYBOT currency futures volume increases
The “other” exchange that trades currency futures —the New York Board of Trade (NYBOT) — may not bea threat to the Chicago Mercantile Exchange, but it hascontinued to expand trading volume in 2005. Total vol-ume in the U.S. Dollar Index (USDX) futures and vari-ous currency pair futures (including the Euro/yen)reached 412,943 contracts in June — 48 percent morethan June 2004.

38 August 2005 • CURRENCY TRADER
INTERNATIONAL MARKET SUMMARY
Currentprice vs. 1-month 3-month 6-month 52-week 52-week Previous
Rank* Country Currency U.S. dollar gain/loss gain/loss gain/loss high low rank
1 South African 0.1519 1.51% -9.28% -11.06% 0.1783 0.1427 11rand
2 Canadian 0.821 1.16% 1.12% 0.48% 0.8532 0.7469 1dollar
3 Singapore 0.6029 0.93% -0.70% -1.61% 0.6186 0.5778 9dollar
4 Indian 0.02307 0.13% 0.74% 0.65% 0.02317 0.02145 6rupee
5 Hong Kong 0.1287 0.00% 0.31% 0.39% 0.1288 0.128 5dollar
6 Russian 0.03483 -0.26% -3.65% -2.58% 0.03643 0.03414 12rouble
7 Euro 1.2065 -0.34% -8.31% -8.26% 1.3667 1.1866 15
8 Thai 0.02419 -0.66% -4.80% -7.57% 0.02621 0.02362 13baht
9 Brazilian 0.417 -0.82% 5.47% 10.48% 0.4298 0.325 3real
10 Australian 0.7633 -0.83% -2.48% -0.90% 0.7988 0.6852 2dollar
11 Swedish 0.1278 -0.94% -11.58% -12.75% 0.152 0.1253 16krona
12 Taiwanese 0.0316 -1.01% -0.82% 0.47% 0.03253 0.02801 7dollar
13 Swiss 0.7716 -1.76% -9.77% -9.56% 0.8879 0.7642 14franc
14 Japanese 0.008989 -2.01% -5.60% -8.43% 0.00983 0.00879 10yen
15 New Zealand 0.6869 -2.72% -6.67% -4.05% 0.7464 0.6255 8dollar
16 British 1.7381 -4.95% -10.21% -8.23% 1.955 1.7271 4pound
As of July 25, 2005 *based on one-month gain/loss
FOREX (vs. U.S. DOLLAR)
INTEREST RATES
Rank Country Rate July 25 1-month 3-month 6-month Previous1 UK Short sterling 95.72 0.15% 0.68% 0.55% 52 Japan Government bond 140.69 -0.09% 0.73% 1.20% 33 Australia 3-year bonds 94.76 -0.15% 0.14% N/A 44 Germany BUND 122.66 -0.63% 2.18% 3.35% 15 U.S. 10-year T-note 111.09 -1.96% 0.07% -0.19% 2

CURRENCY TRADER • August 2005 39
Rank Country 2004 Ratio* 2003 2005+
1 Hong Kong 15.872 9.6 16.182 16.254
2 Taiwan 19.013 6.2 29.266 22.619
3 Japan 3.7 3.7 136.238 157.223
4 Germany 96.411 3.6 51.755 110.467
5 Canada 26.044 2.6 17.048 28.299
6 Denmark 3.459 1.4 6.337 5.043
7 France -5.41 -0.3 4.987 -9.854
8 Italy -24.818 -1.5 -21.942 -23.906
Rank Country 2004 Ratio* 2003 2005+
9 UK -47.044 -2.2 -30.627 0.53
10 Spain -49.159 -5.0 -23.553 -54.304
11 U.S. -665.938 -5.7 -530.669 -724.49
12 New Zealand -6.042 -6.2 -3.284 -6.919
13 Australia -39.389 -6.4 -30.242 -38.934
Totals in billions of U.S. dollars*Account balance in percent of GDP +Estimate
Source: International Monetary Fund, World Economic OutlookDatabase, April 2005
1-month 3-month 6-month 52-week 52-weekRank Country Index July 25 gain/loss gain/loss gain/loss high low Previous
1 Mexico IPC 14135.24 5.91% 12.44% 8.97% 14367.2 9789.42 62 Germany Xetra Dax 4842.7 5.70% 12.30% 12.57% 4865.72 3618.58 93 France CAC 40 4422.12 5.03% 9.70% 12.21% 4465.9 3452.41 114 India BSE 30 7505.6 4.76% 15.03% 17.89% 7526.88 5022.29 25 Italy MIBTel 25675 4.53% 6.65% 6.39% 25719 19733 136 Switzerland Swiss Market 6503.9 4.32% 9.29% 11.34% 6556.6 5264.5 127 Hong Kong Hang Seng 14794.03 3.81% 7.06% 8.18% 14841.58 12084.68 48 Singapore Straits Times 2309.61 3.72% 7.46% 10.56% 2343.69 1842.37 79 UK FTSE 100 5270.7 3.64% 7.70% 8.11% 5283.9 4283 10
10 Canada S&P/TSX composite 10362.55 3.54% 9.13% 11.94% 10383.83 8116.15 311 U.S. S&P 500 1229.03 3.05% 5.45% 4.93% 1238.36 1060.72 1512 Australia All ordinaries 4335.6 3.04% 7.52% 6.44% 4350 3479.3 513 Japan Nikkei 225 11762.65 1.92% 5.86% 4.13% 11975.46 10545.89 814 Brazil Bovespa 24531 -1.57% -2.86% 1.36% 29584 21056 1415 Egypt CMA 1769.58 -1.83% 11.88% 22.98% 1813.44 935.12 1
Currency 1-month 3-month 6-month 52-week 52-weekRank pair Symbol July 25 gain/loss gain/loss gain/loss high low Previous
1 Canada $ / Pound CAD/GBP 0.4725 5.82% 10.29% 8.04% 0.4725 0.4079 92 Real / Pound BRL/GBP 0.24 3.96% 14.25% 17.29% 0.2453 0.1766 113 Aussie $ / Pound AUD/GBP 0.4393 3.94% 7.03% 6.76% 0.4398 0.3837 124 Canada $ / Yen CAD/JPY 91.3472 3.10% 6.35% 8.21% 92.7187 82.5659 65 Franc / Pound CHF/GBP 0.4438 2.97% 0.36% -1.26% 0.4647 0.4274 196 Euro / Yen EUR/JPY 134.23 1.65% -2.56% 0.15% 141.59 130.6 187 Canada $ / Euro CAD/EUR 0.6806 1.47% 8.70% 8.07% 0.686 0.6008 18 Real / Yen BRL/JPY 46.4012 1.16% 10.46% 17.43% 48.1289 35.7463 89 Aussie $ / Yen AUD/JPY 84.853 1.08% 2.86% 6.86% 85.669 75.19 7
10 Aussie $ / Franc AUD/CHF 0.9896 0.93% 6.65% 7.90% 0.9925 0.8635 411 Franc / Yen CHF/JPY 85.8565 0.24% -3.96% -1.04% 91.6645 85.1568 1712 Real / Aussie $ BRL/AUD 0.5471 0.07% 7.82% 11.33% 0.5722 0.4583 1413 Real / Euro BRL/EUR 0.3457 -0.49% 12.70% 17.30% 0.3557 0.2677 314 Aussie $ / Euro AUD/EUR 0.6327 -0.52% 5.37% 6.78% 0.6424 0.5643 215 Franc / Euro CHF/EUR 0.6395 -1.45% -1.38% -1.19% 0.6632 0.6382 1316 Real / Canada $ BRL/CAD 0.5083 -1.97% 4.41% 10.05% 0.5306 0.4212 1617 Aussie $ / Canada $ AUD/CAD 0.9303 -1.99% -3.63% -1.39% 0.9837 0.8863 1518 Pound / Yen GBP/JPY 193.42 -2.85% -4.36% 0.20% 205.94 189.5 1019 Franc / Canada $ CHF/CAD 0.9405 -2.92% -11.00% -10.08% 1.0778 0.9364 2020 Pound / Euro GBP/EUR 1.4416 -4.56% -1.71% 0.09% 1.52 1.4057 5
NON-U.S. DOLLAR FOREX CROSS RATES
GLOBAL STOCK INDICES
ACCOUNT BALANCE

GLOBAL NEWS BRIEFS
CURRENCY TRADER • August 2005 40
ASIA & THE SOUTH PACIFIC
AFRICA
AMERICAS
EUROPE � The U.S. House of Representatives passed a tradeagreement with six South American countries — CostaRica, the Dominican Republic, El Salvador, Guatemala,Honduras, and Nicaragua — that will eliminate tariffs onU.S. exports to those countries. The Central American FreeTrade Agreement (CAFTA) passed by a slim 217-215 mar-gin, and U.S. President George Bush has previously said hewill sign the bill.
� Canada’s unemployment rate fell to 6.7 percent, its low-est level in five years, as gains in full-time jobs among adultwomen and strength in construction employment fueledthe fallback. The rate is .7 percent lower than in June 2004.
� Canada’s June GDP was 0.3 percent higher than theMay totals, surprising economists who predicted a 0.1-per-cent growth. According to Statistics Canada, the gain wasattributed to greater exploration in the energy sector andmore investment-related production.
� Brazil’s June unemployment rate fell 0.6 percent fromMay to 10.2, its biggest drop of the year. That number isalso 2 percent lower than June 2004. Mining and quarrying,manufacturing, and public services provided 101,000 newjobs.
� Minutes of the Brazilian central bank’s previous meet-ing indicate the bank will not adjust interest rates until it isconvinced the country’s inflation has subsided. Brazil’sSelic, the overnight lending rate, remained at 19.75 percentafter nine months of rate increases designed to curb infla-tion.
� Argentinian President Nestor Kirchner told citizensArgentina would pay the International Monetary Fund $14billion to loosen sanctions the IMF currently has on thecountry. The country has restructured a payment plan forthe more than $100 billion it owes, although economists sayKirchner’s plan is pure rhetoric, as Argentina does not havethat kind of money.
� Australia’s unemployment rate for June fell 0.1 percentcompared to the previous month and dropped 0.6 percentfrom June 2004.
� India’s first-quarter GDP rose by 11.7 percent over thesame quarter in 2004, falling 1.1 percent compared to Q4.
� Hong Kong’s preliminary jobless rate remained at 5.7percent from April to June, a 1.2-percent increase from thesame period in 2004.
� Japan’s June jobless rate remained stable at 4.4 percent,a 0.2-percent decrease over June 2004.
� China’s trade surplus is expected to top $80 billion in2005, according to a government official. China’s 2004 tradesurplus was $32 billion, but a huge growth in exports hasalready given the Chinese a $39 billion surplus through thefirst six months of 2005.
� July consumer prices in the 12 countries that use theEuro increased 2.1 percent from June and 2.2 percent from ayear ago, putting inflation at its highest level in sevenmonths. This inflation level makes it unlikely the EuropeanCentral Bank will cut interest rates, which have remainedunchanged at 2 percent since June 2003.
� France’s May unemployment rate remained at 10.2 per-cent, a 0.2-percent increase over May 2004.
� Germany’s June jobless rate dropped 0.3 percent to 11.3percent compared to the previous month, an increase of 1.1percent on the same month in 2004.
� The March-May jobless rate in the UK remained stableat 4.8 percent, but fell 0.1 percent from the same period ayear earlier.
� South Africa’s jobless rate rose 0.3 percent to 26.5 per-cent from September 2004 to March 2005 as compared to theprevious six months. The rate fell 1.4 percent from the sameperiod a year earlier. Since last year, the agriculture indus-try added 107, 000 jobs and trade added a similar number.

CURRENCY TRADER • August 2005 41
EVENTS
Event: FXCM & eSignal Forex Trading Seminars:
The Comeback of the Greenback — Will the Dollar Continue
to Rise?
Speakers: Kathy Lein and Boris Schlossberg
Cost: Free
For more information: See below for all dates and
locations; or visit www.fxcm.com/free-fx-seminar.jsp.com
Date: Aug. 13, noon-4 p.m.
Location: Doubletree Hotel at the Seattle, Wash. airport
Date: Aug. 20, 9 a.m.-1 p.m.
Location: West Chester Marriott, Tarrytown, N.Y.
Date: Oct. 1, 9 a.m.-1 p.m.
Location: JW Marriott Hotel, Miami, Fla.
Date: Sept. 10, 9 a.m.-1 p.m.
Location: Renaissance Dallas-Richardson Hotel,
Richardson, Texas
•
Event: Market Technicians Association Chicago chapter
meeting
Date: Aug. 17, 5-7 p.m.
Location: 227 W. Monroe, Suite 1850, Chicago, Ill.
Cost: $10-15 to cover food
RSVP: Contact Ross Leinweber at (847) 849-8236 or
•
Event: Minyans in the Mountains 2005 Retreat
Date: Aug. 18-21
Cost: $1,700
Location: Ojai Valley Inn & Spa (near Santa Barbara,
Calif.)
Keynote speakers: Jeff Saut, chief investment strate-
gist, Raymond James & Associates; and Steve Shobin,
vice chairman and chief investment strategist, AmeriCap
Advisers, LLC
For more information: Call (800) 830-6687 or visit
www.mimretreat.com
Event: Fibonacci Trader workshops
Date: Sept. 11-13
Location: Denver, Colo.
Presenters: Dennis Bolze and Yuri Shramenko
For more information: Visit www.fibonaccitrader.com
•
Event: TradeStationWorld Conference and Expo
Date: Sept. 29-Oct. 2
Location: The Venetian Resort-Hotel-Casino, Las Vegas,
Nev.
Keynote speakers: William R. Cruz, Linda Bradford
Raschke, and Stan Dash
For more information: E-mail
[email protected] or visit
www.tradestationworld.com
•
Event: Forex Trading Expo
Date: Nov. 19-20
Location: Mandalay Bay, Las Vegas, Nev.
For more information: Visit
www.forextradingexpo.com.com
•
Event: The Traders Expo Las Vegas
Date: Dec. 13-16
Location: Paris Resort, Las Vegas, Nev.
For more information: Call (800) 970-4355 or visit
www.tradersexpo.com
•
Event: The 22nd Annual World Cup Trading Championship
Entrants will compete in separate stock, futures, and forex
divisions for prizes, Bull & Bear trophies and a possible staff
position on the worldcupadvisor.com team.
Date: Through 2005
For more information: Log on to
www.robbingstrading.com

42 August 2005 • CURRENCY TRADER
Monday Tuesday Wednesday Thursday Friday Saturday
GLOBAL ECONOMIC CALENDAR MONTH
8Australia: Officialreserve assets;statement on mon-etary policy
9U.S.: Wholesaleinventories;FOMC meetingGermany:Foreign trade
10Japan: Corporategoods price index
11U.S.: Retail sales
Japan: Balanceof payments
12U.S.: Trade balanceJapan: Monetary surveyGermany:BankruptciesItaly: Balance of payments
16Germany: PPI
17U.S.: PPI
Canada:Wholesale trade
The information on this page is subject to change. Currency Trader is not responsible for the accuracy of calendar dates beyond press time.
Monday Tuesday Wednesday Thursday Friday Saturday
GLOBAL ECONOMIC CALENDAR AUGUST/SEPTEMBER
18U.S.: Leading indicators
Great Britain:Capital issues
19Germany: PPI
15U.S.: CPI
Canada:Manufacturing survey
20
24U.S.: Durablegoods
Japan: Corporateservice price index
13
22Canada: Retailtrade
23Germany:National accounts
Canada: Leadingindicators
26Canada: CPI
25Canada:Employment
Germany:Employment
2Japan: Monetarybase
Australia: Index ofcommodity prices
3Great Britain:Monetary PolicyCommitteemeeting
4ECB: Governing CouncilmeetingGreat Britain: MonetaryPolicy Committee meetingGermany: Orders receivedand manufacturingturnover
5U.S.:Employment
Germany:Productionindex
1U.S.: ISM reporton business
Japan: Accountbalances
6
30Canada:Trade balance
31U.S.: GDPGermany: Retail turnover; employmentCanada: GDPAustralia: International reserves andforeign currency liquidityItaly: International reserves and foreigncurrency liquidity
1U.S.: ISM report on businessECB: Governing CouncilmeetingJapan: Account balancesAustralia: Index of commodity prices
2U.S.:Employment
Japan:Monetarybase
29 3
6Germany: PPI
7Great Britain:Capital issues
Canada:Wholesale trade;leading indicators
5
27
CPI: Consumer Price Index
ECB: European Central Bank
GDP: Gross Domestic Product
FOMC: Federal Open Market
Committee
ISM: Institute for SupplyManagement
PPI: Producer Price Index
Legend

EDITOR’S NOTE
August 2005 • CURRENCY TRADER 43
Date Rate Entry Initial Initial IRR Exit Date P/L LOP LOL Trade stop target length
7/6/05 SFU05 .7728 .7640 .7940 2.4 .7874 7/12/05 +.0146 .0187 -.0039 4 days(1.9%)
TRADE SUMMARY
Legend: IRR — initial reward/risk ratio (initial target amount/initial stop amount); LOP — largest open profit (maximum available profitduring lifetime of trade); LOL — largest open loss (maximum potential loss during life of trade).
FOREX TRADE JOURNAL
A second shot of the Swiss franc…
TRADE
Date: Wednesday, July 6, 2005.
Entry: Long September 2005 Swiss francfutures (SFU05) at .7728.
Reason(s) for trade/setup: This tradeis a second attempt at capitalizing on theconditions described in last month’s tradediary, which resulted in a short trade in theU.S. dollar/Swiss franc (USD/CHF) spotrate on June 29: “On June 24, the USD/CHFrate marked its eighth consecutive week ofhigher highs — a period during which itgained more than 600 points. Similar pat-terns in the past have been followed bydown moves over the next couple of weeks,although testing showed the distinct poten-tial for future gains on a longer-term basis.”
That trade was stopped out four dayslater at the initial stop-loss point of 1.3045(see smaller chart of USD/CHF). However,the day after that trade was exited, we re-entered — this time in the Swiss francfutures, which called for a long position.
Initial stop: .7640, .0053 points below thelow of the day preceding the entry day.Having been wrong once on the timing ofthe trade, we want to limit the risk on thissecond attempt as much as possible.
Initial target: .7940, around 10 points below the late-Junehigh.
RESULT
Exit: .7874.
Reason for exit: Took profits when the market made awide-range bar that capped a three-day up move.
Profit/loss:+.0146 (1.9 percent).
Trade executed ac-cording to plan? No.
Lesson(s): The marketfollowed its expected pathin the short term, and weexited in the spirit of thetrade plan, but because wedidn’t follow the plan to a“t,” we’ve marked this aninstance of not followingthe trade plan.
However, the timing of the exit was fortunate (it captured78 percent of the eventual extent of the up move): The mar-ket reversed the next day, and has since failed to match thehigh of the exit day. We exited because the currency was inthe process of making its strongest up move in severalweeks and we expected at least a small correction to follow.In essence, the market fulfilled the move anticipated by theanalysis, so the decision to sell before the planned exit levelwas not rash. It amounted to placing the trade plan in thecontext of unfolding market events.�
Source: TradeStation

44 August 2005 • CURRENCY TRADER
KEY CONCEPTS AND DEFINITIONS
Bob DormanAd sales East Coast and [email protected]
(312) 775-5421
Allison EllisAd sales West Coast and Southwest
[email protected](626) 497-9195
Mark SegerAccount Executive
[email protected](312) 377-9435
Three good tools for targeting customers . . .
— CONTACT —
Managed float: A managed-float currency falls somewhere between a fully floating currency and a fixed-rate
currency. The government of a managed-float currency uses capital controls and other measures (including inter-
vention) to keep the value of its currency within a fixed range of levels against other currencies; it changes the range
over time according to its own wishes. Therefore, a managed-float currency can vary within the current government-
set range, and the government can change the range from time to time, but the foreign exchange market cannot push
the currency outside the range. The foreign exchange market for a managed-float currency is heavily regulated.
Central bank intervention: When a country’s government uses its central bank to buy or sell its own cur-
rency in the foreign exchange market to push its valuation to a desired level or to prevent it from reaching an unde-
sirable level.
Average and median: The mean (or average) of a set of values is the sum of the values divided by the num-
ber of values in the set. If a set consists of 10 numbers, add them and divide by 10 to get the mean.
A statistical weakness of the mean is that it can be distorted by exceptionally large or small values. For example,
the mean of 1, 2, 3, 4, 5, 6, 7, and 200 is 28.5 (228/8). Take away 200, and the mean of the remaining seven num-
bers is 4, which is much more representative of the numbers in this set than 28.5.
The median can help gauge how representative a mean really is. The median of a data set is its middle value (when
the set has an odd number of elements) or the mean of the middle two elements (when the set has an even number
of elements). The median is less susceptible than the mean to distortion from extreme, non-representative values.
The median of 1, 2, 3, 4, 5, 6, 7, and 200 is 4.5 ((4+5)/2), which is much more in line with the majority of numbers in
the set.

THIS MONTH’S ADVERTISERS
Click on these boxes to link directly to these advertiser’s web sites
CURRENCY TRADER • August 2005 45


![Currency Trader Magazine (08-2006) [Finance Forex Trading Review Analysis Commentary]](https://static.fdocuments.us/doc/165x107/577cc5601a28aba7119c316c/currency-trader-magazine-08-2006-finance-forex-trading-review-analysis-commentary.jpg)