Currency Report Card May 2021
25
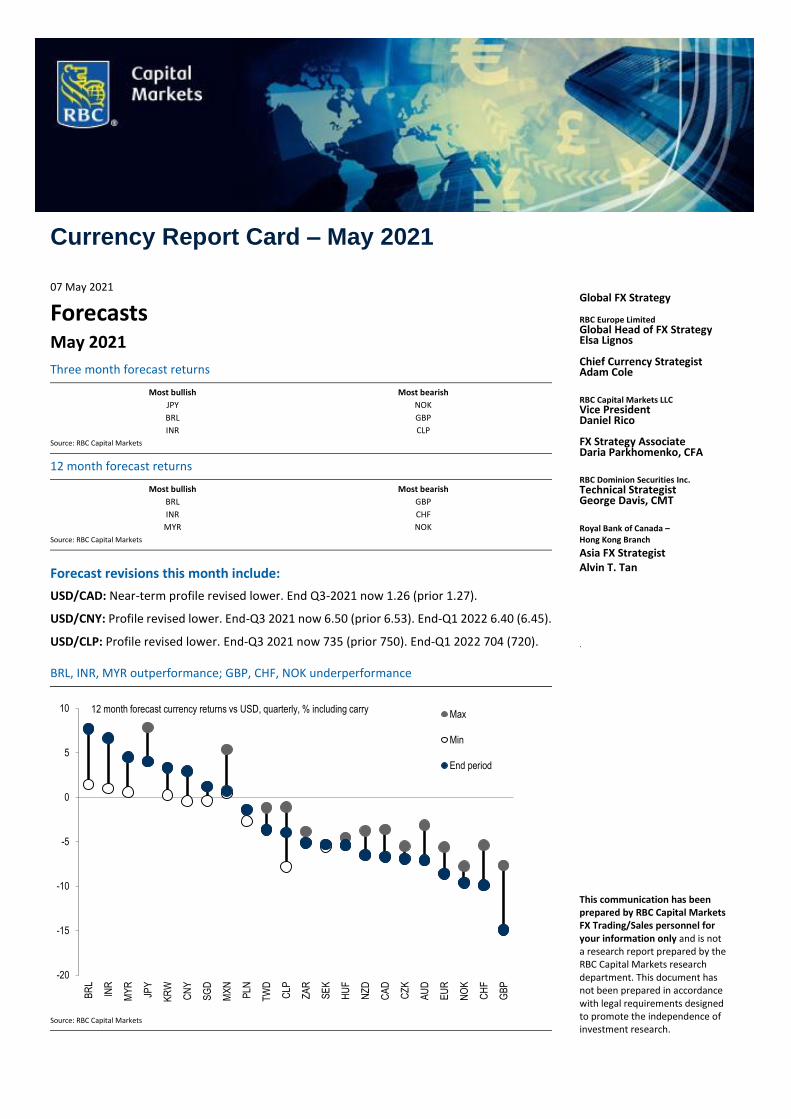
Currency Report Card – May 2021 07 May 2021 Forecasts May 2021 Three month forecast returns Most bullish Most bearish JPY NOK BRL GBP INR CLP Source: RBC Capital Markets 12 month forecast returns Most bullish Most bearish BRL GBP INR CHF MYR NOK Source: RBC Capital Markets Forecast revisions this month include: USD/CAD: Near-term profile revised lower. End Q3-2021 now 1.26 (prior 1.27). USD/CNY: Profile revised lower. End-Q3 2021 now 6.50 (prior 6.53). End-Q1 2022 6.40 (6.45). USD/CLP: Profile revised lower. End-Q3 2021 now 735 (prior 750). End-Q1 2022 704 (720). BRL, INR, MYR outperformance; GBP, CHF, NOK underperformance Source: RBC Capital Markets Global FX Strategy RBC Europe Limited Global Head of FX Strategy Elsa Lignos Chief Currency Strategist Adam Cole RBC Capital Markets LLC Vice President Daniel Rico FX Strategy Associate Daria Parkhomenko, CFA RBC Dominion Securities Inc. Technical Strategist George Davis, CMT Royal Bank of Canada – Hong Kong Branch Asia FX Strategist Alvin T. Tan . This communication has been prepared by RBC Capital Markets FX Trading/Sales personnel for your information only and is not a research report prepared by the RBC Capital Markets research department. This document has not been prepared in accordance with legal requirements designed to promote the independence of investment research. -20 -15 -10 -5 0 5 10 BRL INR MYR JPY KRW CNY SGD MXN PLN TWD CLP ZAR SEK HUF NZD CAD CZK AUD EUR NOK CHF GBP Max Min End period 12 month forecast currency returns vs USD, quarterly, % including carry
Transcript of Currency Report Card May 2021
Currency Report Card – May 2021
07 May 2021
Forecasts May 2021
Three month forecast returns
Most bullish Most bearish
JPY NOK
BRL GBP
INR CLP
Source: RBC Capital Markets
12 month forecast returns
Most bullish Most bearish
BRL GBP
INR CHF
MYR NOK
Source: RBC Capital Markets
Forecast revisions this month include:
USD/CAD: Near-term profile revised lower. End Q3-2021 now 1.26 (prior 1.27).
USD/CNY: Profile revised lower. End-Q3 2021 now 6.50 (prior 6.53). End-Q1 2022 6.40 (6.45).
USD/CLP: Profile revised lower. End-Q3 2021 now 735 (prior 750). End-Q1 2022 704 (720).
BRL, INR, MYR outperformance; GBP, CHF, NOK underperformance
Source: RBC Capital Markets
Global FX Strategy RBC Europe Limited Global Head of FX Strategy Elsa Lignos Chief Currency Strategist Adam Cole RBC Capital Markets LLC Vice President Daniel Rico FX Strategy Associate Daria Parkhomenko, CFA RBC Dominion Securities Inc. Technical Strategist George Davis, CMT Royal Bank of Canada – Hong Kong Branch
Asia FX Strategist Alvin T. Tan
.
This communication has been prepared by RBC Capital Markets FX Trading/Sales personnel for your information only and is not a research report prepared by the RBC Capital Markets research department. This document has not been prepared in accordance with legal requirements designed to promote the independence of investment research.
-20
-15
-10
-5
0
5
10
BR
L
INR
MY
R
JPY
KR
W
CN
Y
SG
D
MX
N
PLN
TW
D
CLP
ZA
R
SE
K
HU
F
NZ
D
CA
D
CZ
K
AU
D
EU
R
NO
K
CH
F
GB
P
Max
Min
End period
12 month forecast currency returns vs USD, quarterly, % including carry

Currency Report Card
07 May 2021 2
Table of contents
US Dollar ............................................................................................................................. 3 Euro .................................................................................................................................... 4 Japanese Yen ...................................................................................................................... 5 Sterling ................................................................................................................................ 6 Swiss Franc.......................................................................................................................... 7 Swedish Krona & Norwegian Krone .................................................................................... 8 Canadian Dollar .............................................................................................................. 9 Australian Dollar ............................................................................................................... 10 New Zealand Dollar .......................................................................................................... 11 Chinese Yuan ................................................................................................................ 12 Indian Rupee ..................................................................................................................... 13 South Korean Won............................................................................................................ 14 Taiwanese Dollar & Singapore Dollar ............................................................................... 15 Malaysia Ringgit ........................................................................................................... 16 South African Rand ....................................................................................................... 17 Polish Zloty ................................................................................................................... 18 Hungarian Forint & Czech Koruna ................................................................................ 19 Brazilian Real .................................................................................................................... 20 Mexican Peso .................................................................................................................... 21 Chilean Peso ..................................................................................................................... 22
Forecasts ........................................................................................................................... 23
Disclaimer ......................................................................................................................... 25
Currency Report Card
07 May 2021 3
US Dollar Adam Cole
1-3 Month Outlook – Reverting to moderate uptrend
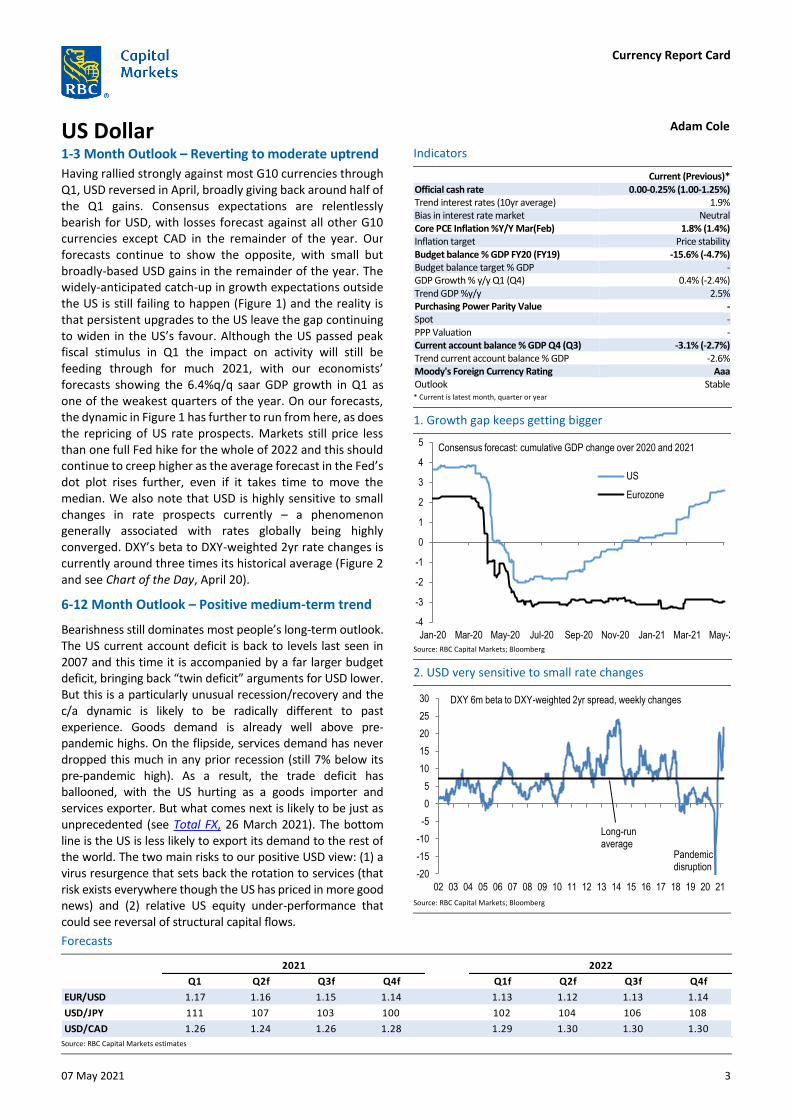
Having rallied strongly against most G10 currencies through Q1, USD reversed in April, broadly giving back around half of the Q1 gains. Consensus expectations are relentlessly bearish for USD, with losses forecast against all other G10 currencies except CAD in the remainder of the year. Our forecasts continue to show the opposite, with small but broadly-based USD gains in the remainder of the year. The widely-anticipated catch-up in growth expectations outside the US is still failing to happen (Figure 1) and the reality is that persistent upgrades to the US leave the gap continuing to widen in the US’s favour. Although the US passed peak fiscal stimulus in Q1 the impact on activity will still be feeding through for much 2021, with our economists’ forecasts showing the 6.4%q/q saar GDP growth in Q1 as one of the weakest quarters of the year. On our forecasts, the dynamic in Figure 1 has further to run from here, as does the repricing of US rate prospects. Markets still price less than one full Fed hike for the whole of 2022 and this should continue to creep higher as the average forecast in the Fed’s dot plot rises further, even if it takes time to move the median. We also note that USD is highly sensitive to small changes in rate prospects currently – a phenomenon generally associated with rates globally being highly converged. DXY’s beta to DXY-weighted 2yr rate changes is currently around three times its historical average (Figure 2 and see Chart of the Day, April 20).
6-12 Month Outlook – Positive medium-term trend
Bearishness still dominates most people’s long-term outlook. The US current account deficit is back to levels last seen in 2007 and this time it is accompanied by a far larger budget deficit, bringing back “twin deficit” arguments for USD lower. But this is a particularly unusual recession/recovery and the c/a dynamic is likely to be radically different to past experience. Goods demand is already well above pre-pandemic highs. On the flipside, services demand has never dropped this much in any prior recession (still 7% below its pre-pandemic high). As a result, the trade deficit has ballooned, with the US hurting as a goods importer and services exporter. But what comes next is likely to be just as unprecedented (see Total FX, 26 March 2021). The bottom line is the US is less likely to export its demand to the rest of the world. The two main risks to our positive USD view: (1) a virus resurgence that sets back the rotation to services (that risk exists everywhere though the US has priced in more good news) and (2) relative US equity under-performance that could see reversal of structural capital flows.
Indicators
Current (Previous)* Official cash rate 0.00-0.25% (1.00-1.25%) Trend interest rates (10yr average) 1.9% Bias in interest rate market Neutral Core PCE Inflation %Y/Y Mar(Feb) 1.8% (1.4%) Inflation target Price stability Budget balance % GDP FY20 (FY19) -15.6% (-4.7%) Budget balance target % GDP - GDP Growth % y/y Q1 (Q4) 0.4% (-2.4%) Trend GDP %y/y 2.5% Purchasing Power Parity Value - Spot - PPP Valuation - Current account balance % GDP Q4 (Q3) -3.1% (-2.7%) Trend current account balance % GDP -2.6% Moody's Foreign Currency Rating Aaa Outlook Stable * Current is latest month, quarter or year
Source: RBC Capital Markets; Bloomberg
1. Growth gap keeps getting bigger
2. USD very sensitive to small rate changes
Source: RBC Capital Markets; Bloomberg
Forecasts
Source: RBC Capital Markets estimates
Q1 Q2f Q3f Q4f Q1f Q2f Q3f Q4f
EUR/USD 1.17 1.16 1.15 1.14 1.13 1.12 1.13 1.14
USD/JPY 111 107 103 100 102 104 106 108
USD/CAD 1.26 1.24 1.26 1.28 1.29 1.30 1.30 1.30
2021 2022
-4
-3
-2
-1
0
1
2
3
4
5
Jan-20 Mar-20 May-20 Jul-20 Sep-20 Nov-20 Jan-21 Mar-21 May-21
US
Eurozone
Consensus forecast: cumulative GDP change over 2020 and 2021
-20
-15
-10
-5
0
5
10
15
20
25
30
02 03 04 05 06 07 08 09 10 11 12 13 14 15 16 17 18 19 20 21
Long-run average
DXY 6m beta to DXY-weighted 2yr spread, weekly changes
Pandemic disruption
Currency Report Card
07 May 2021 4
Euro Elsa Lignos
1-3 Month Outlook – Maintaining our outlook
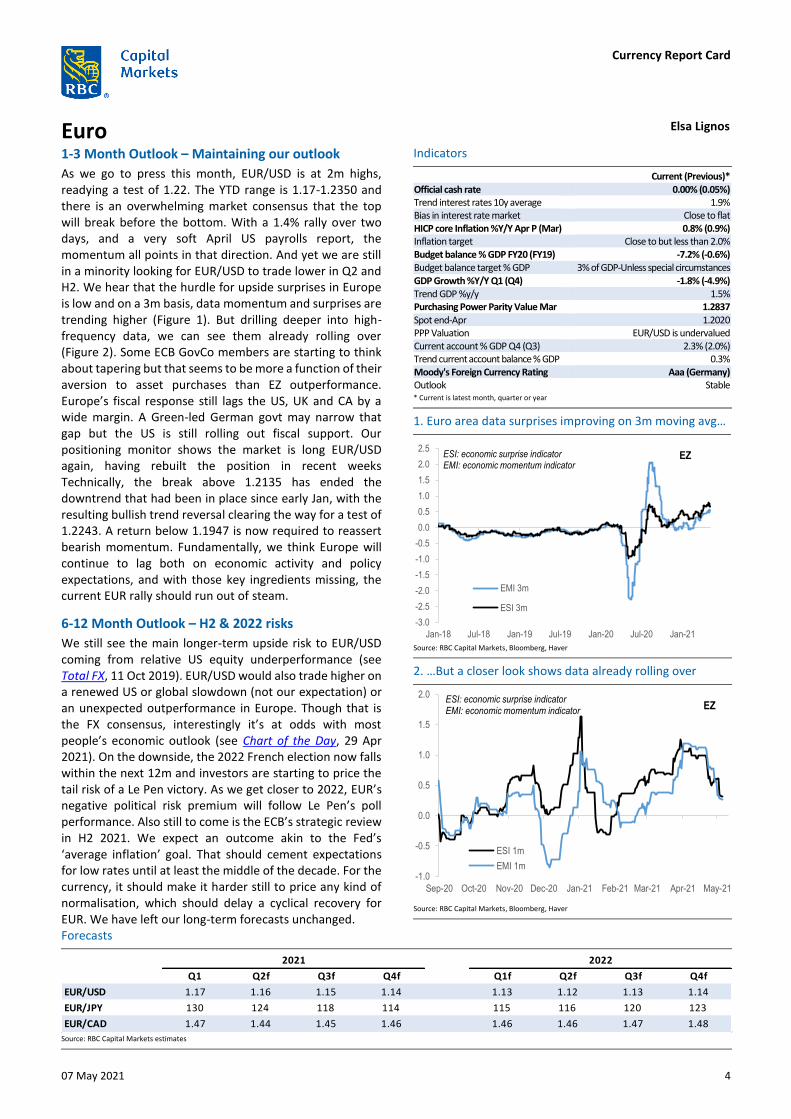
As we go to press this month, EUR/USD is at 2m highs, readying a test of 1.22. The YTD range is 1.17-1.2350 and there is an overwhelming market consensus that the top will break before the bottom. With a 1.4% rally over two days, and a very soft April US payrolls report, the momentum all points in that direction. And yet we are still in a minority looking for EUR/USD to trade lower in Q2 and H2. We hear that the hurdle for upside surprises in Europe is low and on a 3m basis, data momentum and surprises are trending higher (Figure 1). But drilling deeper into high-frequency data, we can see them already rolling over (Figure 2). Some ECB GovCo members are starting to think about tapering but that seems to be more a function of their aversion to asset purchases than EZ outperformance. Europe’s fiscal response still lags the US, UK and CA by a wide margin. A Green-led German govt may narrow that gap but the US is still rolling out fiscal support. Our positioning monitor shows the market is long EUR/USD again, having rebuilt the position in recent weeks Technically, the break above 1.2135 has ended the downtrend that had been in place since early Jan, with the resulting bullish trend reversal clearing the way for a test of 1.2243. A return below 1.1947 is now required to reassert bearish momentum. Fundamentally, we think Europe will continue to lag both on economic activity and policy expectations, and with those key ingredients missing, the current EUR rally should run out of steam.
6-12 Month Outlook – H2 & 2022 risks
We still see the main longer-term upside risk to EUR/USD coming from relative US equity underperformance (see Total FX, 11 Oct 2019). EUR/USD would also trade higher on a renewed US or global slowdown (not our expectation) or an unexpected outperformance in Europe. Though that is the FX consensus, interestingly it’s at odds with most people’s economic outlook (see Chart of the Day, 29 Apr 2021). On the downside, the 2022 French election now falls within the next 12m and investors are starting to price the tail risk of a Le Pen victory. As we get closer to 2022, EUR’s negative political risk premium will follow Le Pen’s poll performance. Also still to come is the ECB’s strategic review in H2 2021. We expect an outcome akin to the Fed’s ‘average inflation’ goal. That should cement expectations for low rates until at least the middle of the decade. For the currency, it should make it harder still to price any kind of normalisation, which should delay a cyclical recovery for EUR. We have left our long-term forecasts unchanged.
Indicators
Current (Previous)* Official cash rate 0.00% (0.05%) Trend interest rates 10y average 1.9% Bias in interest rate market Close to flat HICP core Inflation %Y/Y Apr P (Mar) 0.8% (0.9%) Inflation target Close to but less than 2.0% Budget balance % GDP FY20 (FY19) -7.2% (-0.6%) Budget balance target % GDP 3% of GDP-Unless special circumstances GDP Growth %Y/Y Q1 (Q4) -1.8% (-4.9%) Trend GDP %y/y 1.5% Purchasing Power Parity Value Mar 1.2837 Spot end-Apr 1.2020 PPP Valuation EUR/USD is undervalued Current account % GDP Q4 (Q3) 2.3% (2.0%) Trend current account balance % GDP 0.3% Moody's Foreign Currency Rating Aaa (Germany) Outlook Stable * Current is latest month, quarter or year
Source: RBC Capital Markets, Bloomberg, Haver
1. Euro area data surprises improving on 3m moving avg…
2. …But a closer look shows data already rolling over
Source: RBC Capital Markets, Bloomberg, Haver
Forecasts
Source: RBC Capital Markets estimates
Q1 Q2f Q3f Q4f Q1f Q2f Q3f Q4f
EUR/USD 1.17 1.16 1.15 1.14 1.13 1.12 1.13 1.14
EUR/JPY 130 124 118 114 115 116 120 123
EUR/CAD 1.47 1.44 1.45 1.46 1.46 1.46 1.47 1.48
20222021
-3.0
-2.5
-2.0
-1.5
-1.0
-0.5
0.0
0.5
1.0
1.5
2.0
2.5
Jan-18 Jul-18 Jan-19 Jul-19 Jan-20 Jul-20 Jan-21
EMI 3m
ESI 3m
EZESI: economic surprise indicatorEMI: economic momentum indicator
-1.0
-0.5
0.0
0.5
1.0
1.5
2.0
Sep-20 Oct-20 Nov-20 Dec-20 Jan-21 Feb-21 Mar-21 Apr-21 May-21
ESI 1m
EMI 1m
EZESI: economic surprise indicatorEMI: economic momentum indicator
Currency Report Card
07 May 2021 5
Japanese Yen Adam Cole
1-3 Month Outlook – USD/JPY downtrend resumes
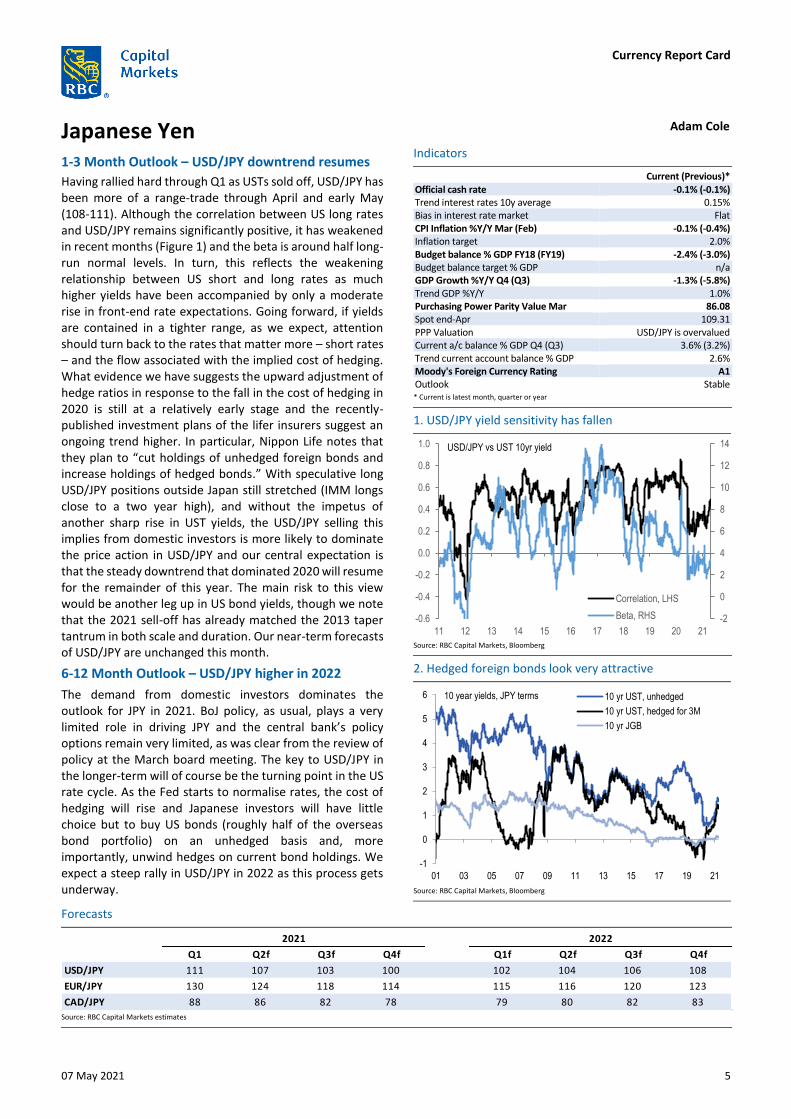
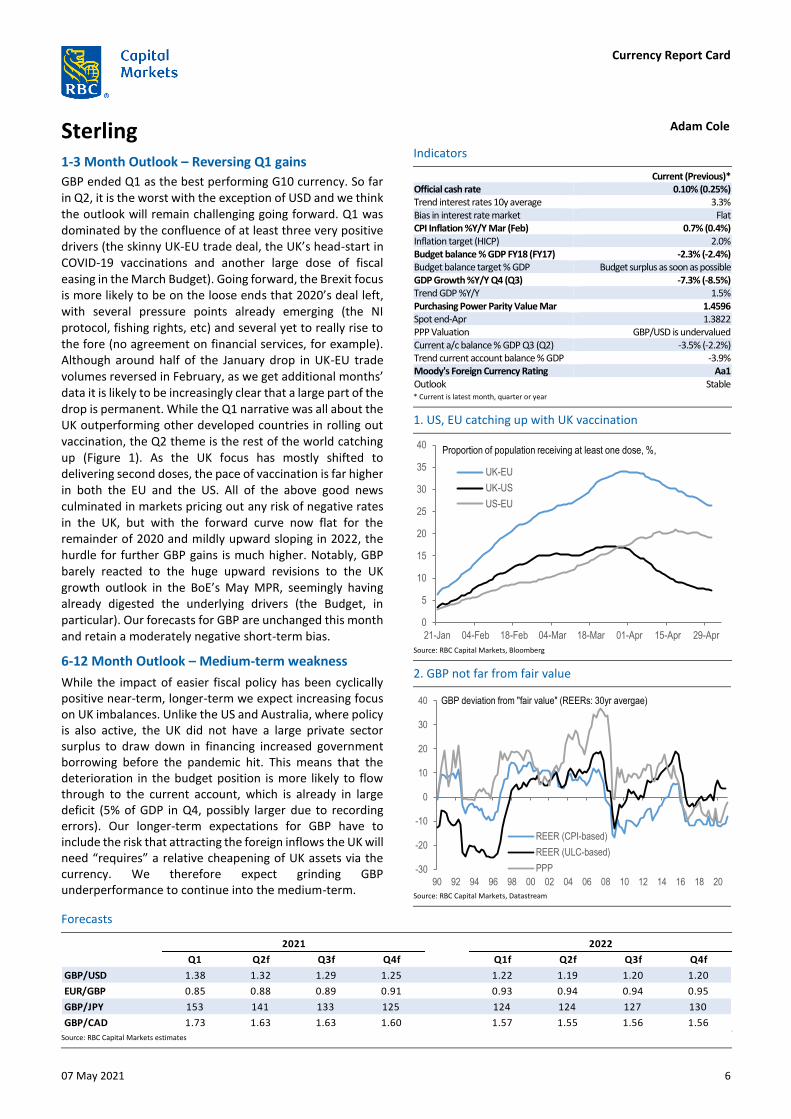
Having rallied hard through Q1 as USTs sold off, USD/JPY has been more of a range-trade through April and early May (108-111). Although the correlation between US long rates and USD/JPY remains significantly positive, it has weakened in recent months (Figure 1) and the beta is around half long-run normal levels. In turn, this reflects the weakening relationship between US short and long rates as much higher yields have been accompanied by only a moderate rise in front-end rate expectations. Going forward, if yields are contained in a tighter range, as we expect, attention should turn back to the rates that matter more – short rates – and the flow associated with the implied cost of hedging. What evidence we have suggests the upward adjustment of hedge ratios in response to the fall in the cost of hedging in 2020 is still at a relatively early stage and the recently-published investment plans of the lifer insurers suggest an ongoing trend higher. In particular, Nippon Life notes that they plan to “cut holdings of unhedged foreign bonds and increase holdings of hedged bonds.” With speculative long USD/JPY positions outside Japan still stretched (IMM longs close to a two year high), and without the impetus of another sharp rise in UST yields, the USD/JPY selling this implies from domestic investors is more likely to dominate the price action in USD/JPY and our central expectation is that the steady downtrend that dominated 2020 will resume for the remainder of this year. The main risk to this view would be another leg up in US bond yields, though we note that the 2021 sell-off has already matched the 2013 taper tantrum in both scale and duration. Our near-term forecasts of USD/JPY are unchanged this month.
6-12 Month Outlook – USD/JPY higher in 2022
The demand from domestic investors dominates the outlook for JPY in 2021. BoJ policy, as usual, plays a very limited role in driving JPY and the central bank’s policy options remain very limited, as was clear from the review of policy at the March board meeting. The key to USD/JPY in the longer-term will of course be the turning point in the US rate cycle. As the Fed starts to normalise rates, the cost of hedging will rise and Japanese investors will have little choice but to buy US bonds (roughly half of the overseas bond portfolio) on an unhedged basis and, more importantly, unwind hedges on current bond holdings. We expect a steep rally in USD/JPY in 2022 as this process gets underway.
Indicators
Current (Previous)* Official cash rate -0.1% (-0.1%) Trend interest rates 10y average 0.15% Bias in interest rate market Flat CPI Inflation %Y/Y Mar (Feb) -0.1% (-0.4%) Inflation target 2.0% Budget balance % GDP FY18 (FY19) -2.4% (-3.0%) Budget balance target % GDP n/a GDP Growth %Y/Y Q4 (Q3) -1.3% (-5.8%) Trend GDP %Y/Y 1.0% Purchasing Power Parity Value Mar 86.08 Spot end-Apr 109.31 PPP Valuation USD/JPY is overvalued Current a/c balance % GDP Q4 (Q3) 3.6% (3.2%) Trend current account balance % GDP 2.6% Moody's Foreign Currency Rating A1 Outlook Stable * Current is latest month, quarter or year
Source: RBC Capital Markets, Bloomberg
1. USD/JPY yield sensitivity has fallen
2. Hedged foreign bonds look very attractive
Source: RBC Capital Markets, Bloomberg
Forecasts
Source: RBC Capital Markets estimates
Q1 Q2f Q3f Q4f Q1f Q2f Q3f Q4f
USD/JPY 111 107 103 100 102 104 106 108
EUR/JPY 130 124 118 114 115 116 120 123
CAD/JPY 88 86 82 78 79 80 82 83
20222021
-2
0
2
4
6
8
10
12
14
-0.6
-0.4
-0.2
0.0
0.2
0.4
0.6
0.8
1.0
11 12 13 14 15 16 17 18 19 20 21
Correlation, LHS
Beta, RHS
USD/JPY vs UST 10yr yield
-1
0
1
2
3
4
5
6
01 03 05 07 09 11 13 15 17 19 21
10 yr UST, unhedged
10 yr UST, hedged for 3M
10 yr JGB
10 year yields, JPY terms
Currency Report Card
07 May 2021 6
Sterling Adam Cole
1-3 Month Outlook – Reversing Q1 gains
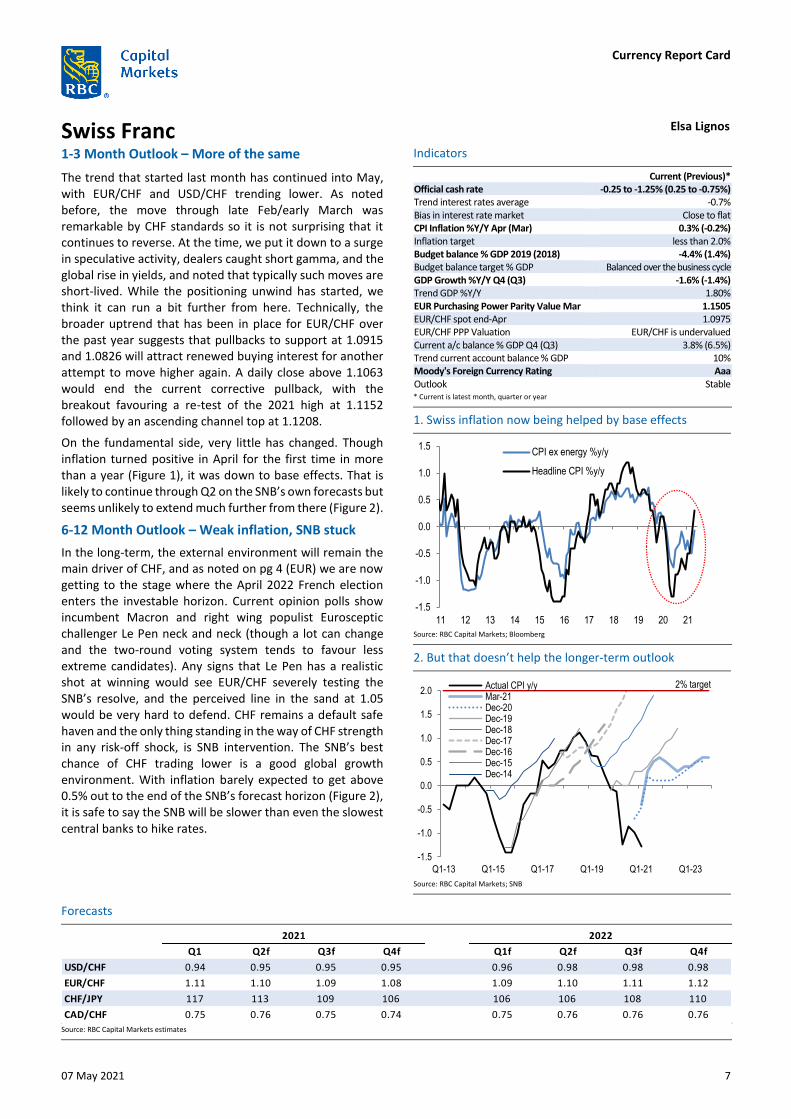
GBP ended Q1 as the best performing G10 currency. So far in Q2, it is the worst with the exception of USD and we think the outlook will remain challenging going forward. Q1 was dominated by the confluence of at least three very positive drivers (the skinny UK-EU trade deal, the UK’s head-start in COVID-19 vaccinations and another large dose of fiscal easing in the March Budget). Going forward, the Brexit focus is more likely to be on the loose ends that 2020’s deal left, with several pressure points already emerging (the NI protocol, fishing rights, etc) and several yet to really rise to the fore (no agreement on financial services, for example). Although around half of the January drop in UK-EU trade volumes reversed in February, as we get additional months’ data it is likely to be increasingly clear that a large part of the drop is permanent. While the Q1 narrative was all about the UK outperforming other developed countries in rolling out vaccination, the Q2 theme is the rest of the world catching up (Figure 1). As the UK focus has mostly shifted to delivering second doses, the pace of vaccination is far higher in both the EU and the US. All of the above good news culminated in markets pricing out any risk of negative rates in the UK, but with the forward curve now flat for the remainder of 2020 and mildly upward sloping in 2022, the hurdle for further GBP gains is much higher. Notably, GBP barely reacted to the huge upward revisions to the UK growth outlook in the BoE’s May MPR, seemingly having already digested the underlying drivers (the Budget, in particular). Our forecasts for GBP are unchanged this month and retain a moderately negative short-term bias.
6-12 Month Outlook – Medium-term weakness
While the impact of easier fiscal policy has been cyclically positive near-term, longer-term we expect increasing focus on UK imbalances. Unlike the US and Australia, where policy is also active, the UK did not have a large private sector surplus to draw down in financing increased government borrowing before the pandemic hit. This means that the deterioration in the budget position is more likely to flow through to the current account, which is already in large deficit (5% of GDP in Q4, possibly larger due to recording errors). Our longer-term expectations for GBP have to include the risk that attracting the foreign inflows the UK will need “requires” a relative cheapening of UK assets via the currency. We therefore expect grinding GBP underperformance to continue into the medium-term.
Indicators
Current (Previous)* Official cash rate 0.10% (0.25%) Trend interest rates 10y average 3.3% Bias in interest rate market Flat CPI Inflation %Y/Y Mar (Feb) 0.7% (0.4%) Inflation target (HICP) 2.0% Budget balance % GDP FY18 (FY17) -2.3% (-2.4%) Budget balance target % GDP Budget surplus as soon as possible GDP Growth %Y/Y Q4 (Q3) -7.3% (-8.5%) Trend GDP %Y/Y 1.5% Purchasing Power Parity Value Mar 1.4596 Spot end-Apr 1.3822 PPP Valuation GBP/USD is undervalued Current a/c balance % GDP Q3 (Q2) -3.5% (-2.2%) Trend current account balance % GDP -3.9% Moody's Foreign Currency Rating Aa1 Outlook Stable * Current is latest month, quarter or year
Source: RBC Capital Markets, Bloomberg
1. US, EU catching up with UK vaccination
2. GBP not far from fair value
Source: RBC Capital Markets, Datastream
Forecasts
Source: RBC Capital Markets estimates
Q1 Q2f Q3f Q4f Q1f Q2f Q3f Q4f
GBP/USD 1.38 1.32 1.29 1.25 1.22 1.19 1.20 1.20
EUR/GBP 0.85 0.88 0.89 0.91 0.93 0.94 0.94 0.95
GBP/JPY 153 141 133 125 124 124 127 130
GBP/CAD 1.73 1.63 1.63 1.60 1.57 1.55 1.56 1.56
20222021
0
5
10
15
20
25
30
35
40
21-Jan 04-Feb 18-Feb 04-Mar 18-Mar 01-Apr 15-Apr 29-Apr
UK-EU
UK-US
US-EU
Proportion of population receiving at least one dose, %,
-30
-20
-10
0
10
20
30
40
90 92 94 96 98 00 02 04 06 08 10 12 14 16 18 20
REER (CPI-based)
REER (ULC-based)
PPP
GBP deviation from "fair value" (REERs: 30yr avergae)
Currency Report Card
07 May 2021 7
Swiss Franc Elsa Lignos
1-3 Month Outlook – More of the same
The trend that started last month has continued into May, with EUR/CHF and USD/CHF trending lower. As noted before, the move through late Feb/early March was remarkable by CHF standards so it is not surprising that it continues to reverse. At the time, we put it down to a surge in speculative activity, dealers caught short gamma, and the global rise in yields, and noted that typically such moves are short-lived. While the positioning unwind has started, we think it can run a bit further from here. Technically, the broader uptrend that has been in place for EUR/CHF over the past year suggests that pullbacks to support at 1.0915 and 1.0826 will attract renewed buying interest for another attempt to move higher again. A daily close above 1.1063 would end the current corrective pullback, with the breakout favouring a re-test of the 2021 high at 1.1152 followed by an ascending channel top at 1.1208.
On the fundamental side, very little has changed. Though inflation turned positive in April for the first time in more than a year (Figure 1), it was down to base effects. That is likely to continue through Q2 on the SNB’s own forecasts but seems unlikely to extend much further from there (Figure 2).
6-12 Month Outlook – Weak inflation, SNB stuck
In the long-term, the external environment will remain the main driver of CHF, and as noted on pg 4 (EUR) we are now getting to the stage where the April 2022 French election enters the investable horizon. Current opinion polls show incumbent Macron and right wing populist Eurosceptic challenger Le Pen neck and neck (though a lot can change and the two-round voting system tends to favour less extreme candidates). Any signs that Le Pen has a realistic shot at winning would see EUR/CHF severely testing the SNB’s resolve, and the perceived line in the sand at 1.05 would be very hard to defend. CHF remains a default safe haven and the only thing standing in the way of CHF strength in any risk-off shock, is SNB intervention. The SNB’s best chance of CHF trading lower is a good global growth environment. With inflation barely expected to get above 0.5% out to the end of the SNB’s forecast horizon (Figure 2), it is safe to say the SNB will be slower than even the slowest central banks to hike rates.
Indicators
Current (Previous)* Official cash rate -0.25 to -1.25% (0.25 to -0.75%) Trend interest rates average -0.7% Bias in interest rate market Close to flat CPI Inflation %Y/Y Apr (Mar) 0.3% (-0.2%) Inflation target less than 2.0% Budget balance % GDP 2019 (2018) -4.4% (1.4%) Budget balance target % GDP Balanced over the business cycle GDP Growth %Y/Y Q4 (Q3) -1.6% (-1.4%) Trend GDP %Y/Y 1.80% EUR Purchasing Power Parity Value Mar 1.1505 EUR/CHF spot end-Apr 1.0975 EUR/CHF PPP Valuation EUR/CHF is undervalued Current a/c balance % GDP Q4 (Q3) 3.8% (6.5%) Trend current account balance % GDP 10% Moody's Foreign Currency Rating Aaa Outlook Stable * Current is latest month, quarter or year
Source: RBC Capital Markets; Bloomberg
1. Swiss inflation now being helped by base effects
2. But that doesn’t help the longer-term outlook
Source: RBC Capital Markets; SNB
Forecasts
Source: RBC Capital Markets estimates
Q1 Q2f Q3f Q4f Q1f Q2f Q3f Q4f
USD/CHF 0.94 0.95 0.95 0.95 0.96 0.98 0.98 0.98
EUR/CHF 1.11 1.10 1.09 1.08 1.09 1.10 1.11 1.12
CHF/JPY 117 113 109 106 106 106 108 110
CAD/CHF 0.75 0.76 0.75 0.74 0.75 0.76 0.76 0.76
2021 2022
-1.5
-1.0
-0.5
0.0
0.5
1.0
1.5
11 12 13 14 15 16 17 18 19 20 21
CPI ex energy %y/y
Headline CPI %y/y
-1.5
-1.0
-0.5
0.0
0.5
1.0
1.5
2.0
Q1-13 Q1-15 Q1-17 Q1-19 Q1-21 Q1-23
Actual CPI y/yMar-21Dec-20Dec-19Dec-18Dec-17Dec-16Dec-15Dec-14
2% target
Currency Report Card
07 May 2021 8
Swedish Krona & Norwegian Krone Adam Cole
Swedish Krona – Holding the YTD range
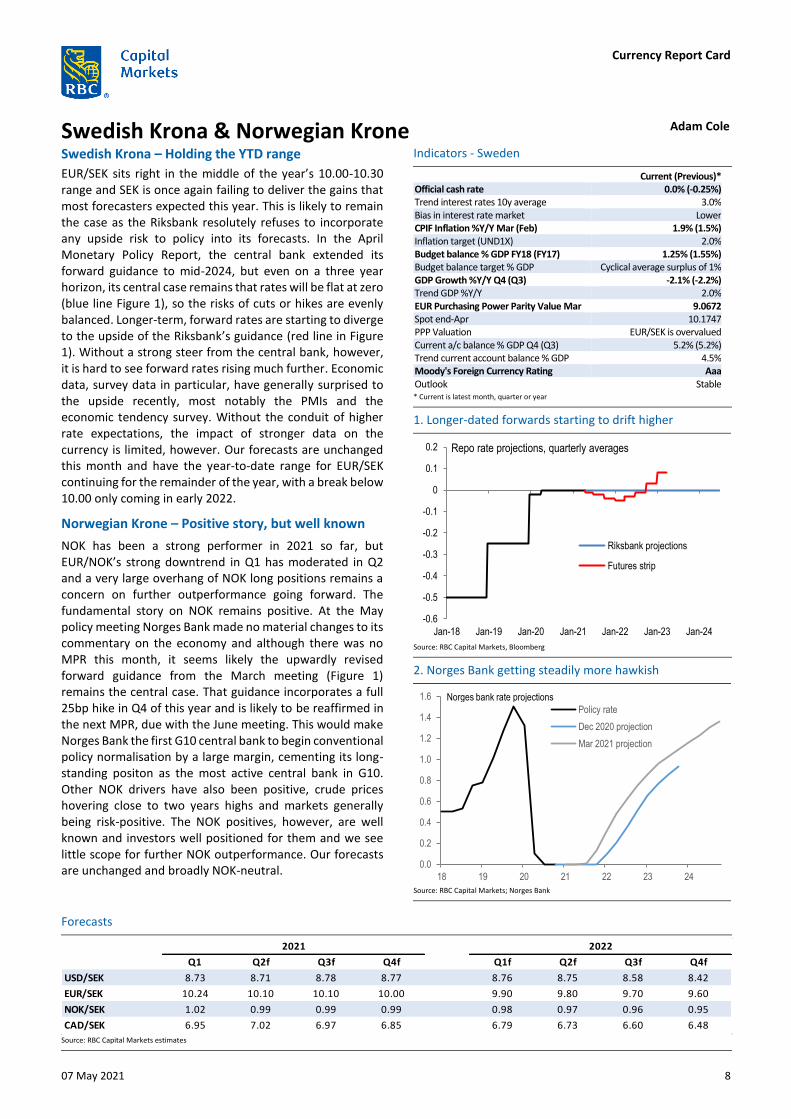
EUR/SEK sits right in the middle of the year’s 10.00-10.30 range and SEK is once again failing to deliver the gains that most forecasters expected this year. This is likely to remain the case as the Riksbank resolutely refuses to incorporate any upside risk to policy into its forecasts. In the April Monetary Policy Report, the central bank extended its forward guidance to mid-2024, but even on a three year horizon, its central case remains that rates will be flat at zero (blue line Figure 1), so the risks of cuts or hikes are evenly balanced. Longer-term, forward rates are starting to diverge to the upside of the Riksbank’s guidance (red line in Figure 1). Without a strong steer from the central bank, however, it is hard to see forward rates rising much further. Economic data, survey data in particular, have generally surprised to the upside recently, most notably the PMIs and the economic tendency survey. Without the conduit of higher rate expectations, the impact of stronger data on the currency is limited, however. Our forecasts are unchanged this month and have the year-to-date range for EUR/SEK continuing for the remainder of the year, with a break below 10.00 only coming in early 2022.
Norwegian Krone – Positive story, but well known
NOK has been a strong performer in 2021 so far, but EUR/NOK’s strong downtrend in Q1 has moderated in Q2 and a very large overhang of NOK long positions remains a concern on further outperformance going forward. The fundamental story on NOK remains positive. At the May policy meeting Norges Bank made no material changes to its commentary on the economy and although there was no MPR this month, it seems likely the upwardly revised forward guidance from the March meeting (Figure 1) remains the central case. That guidance incorporates a full 25bp hike in Q4 of this year and is likely to be reaffirmed in the next MPR, due with the June meeting. This would make Norges Bank the first G10 central bank to begin conventional policy normalisation by a large margin, cementing its long-standing positon as the most active central bank in G10. Other NOK drivers have also been positive, crude prices hovering close to two years highs and markets generally being risk-positive. The NOK positives, however, are well known and investors well positioned for them and we see little scope for further NOK outperformance. Our forecasts are unchanged and broadly NOK-neutral.
Indicators - Sweden
Current (Previous)* Official cash rate 0.0% (-0.25%) Trend interest rates 10y average 3.0% Bias in interest rate market Lower CPIF Inflation %Y/Y Mar (Feb) 1.9% (1.5%) Inflation target (UND1X) 2.0% Budget balance % GDP FY18 (FY17) 1.25% (1.55%) Budget balance target % GDP Cyclical average surplus of 1% GDP Growth %Y/Y Q4 (Q3) -2.1% (-2.2%) Trend GDP %Y/Y 2.0% EUR Purchasing Power Parity Value Mar 9.0672 Spot end-Apr 10.1747 PPP Valuation EUR/SEK is overvalued Current a/c balance % GDP Q4 (Q3) 5.2% (5.2%) Trend current account balance % GDP 4.5% Moody's Foreign Currency Rating Aaa Outlook Stable * Current is latest month, quarter or year
Source: RBC Capital Markets, Bloomberg
1. Longer-dated forwards starting to drift higher
2. Norges Bank getting steadily more hawkish
Source: RBC Capital Markets; Norges Bank
Forecasts
Source: RBC Capital Markets estimates
Q1 Q2f Q3f Q4f Q1f Q2f Q3f Q4f
USD/SEK 8.73 8.71 8.78 8.77 8.76 8.75 8.58 8.42
EUR/SEK 10.24 10.10 10.10 10.00 9.90 9.80 9.70 9.60
NOK/SEK 1.02 0.99 0.99 0.99 0.98 0.97 0.96 0.95
CAD/SEK 6.95 7.02 6.97 6.85 6.79 6.73 6.60 6.48
20222021
-0.6
-0.5
-0.4
-0.3
-0.2
-0.1
0
0.1
0.2
Jan-18 Jan-19 Jan-20 Jan-21 Jan-22 Jan-23 Jan-24
Riksbank projections
Futures strip
Repo rate projections, quarterly averages
0.0
0.2
0.4
0.6
0.8
1.0
1.2
1.4
1.6
18 19 20 21 22 23 24
Policy rate
Dec 2020 projection
Mar 2021 projection
Norges bank rate projections
Currency Report Card
07 May 2021 9
Canadian Dollar George Davis 1-3 Month Outlook – BoC taper to support CAD
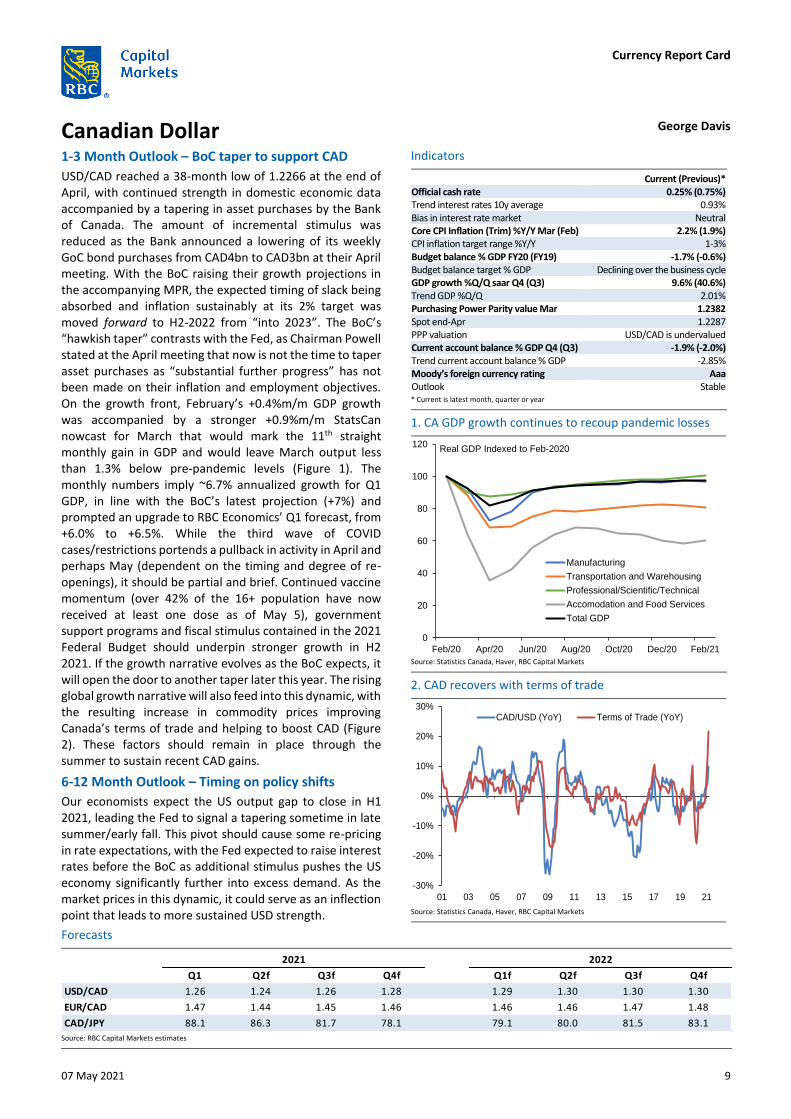
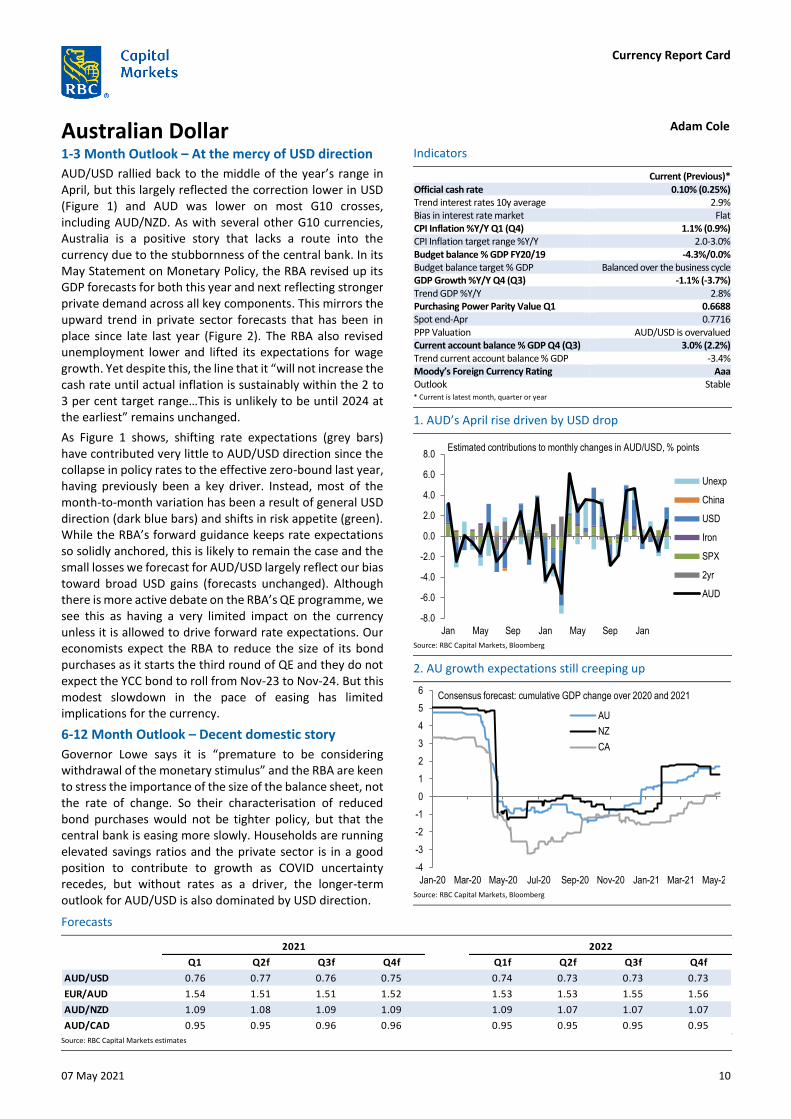
USD/CAD reached a 38-month low of 1.2266 at the end of April, with continued strength in domestic economic data accompanied by a tapering in asset purchases by the Bank of Canada. The amount of incremental stimulus was reduced as the Bank announced a lowering of its weekly GoC bond purchases from CAD4bn to CAD3bn at their April meeting. With the BoC raising their growth projections in the accompanying MPR, the expected timing of slack being absorbed and inflation sustainably at its 2% target was moved forward to H2-2022 from “into 2023”. The BoC’s “hawkish taper” contrasts with the Fed, as Chairman Powell stated at the April meeting that now is not the time to taper asset purchases as “substantial further progress” has not been made on their inflation and employment objectives. On the growth front, February’s +0.4%m/m GDP growth was accompanied by a stronger +0.9%m/m StatsCan nowcast for March that would mark the 11th straight monthly gain in GDP and would leave March output less than 1.3% below pre-pandemic levels (Figure 1). The monthly numbers imply ~6.7% annualized growth for Q1 GDP, in line with the BoC’s latest projection (+7%) and prompted an upgrade to RBC Economics’ Q1 forecast, from +6.0% to +6.5%. While the third wave of COVID cases/restrictions portends a pullback in activity in April and perhaps May (dependent on the timing and degree of re-openings), it should be partial and brief. Continued vaccine momentum (over 42% of the 16+ population have now received at least one dose as of May 5), government support programs and fiscal stimulus contained in the 2021 Federal Budget should underpin stronger growth in H2 2021. If the growth narrative evolves as the BoC expects, it will open the door to another taper later this year. The rising global growth narrative will also feed into this dynamic, with the resulting increase in commodity prices improving Canada’s terms of trade and helping to boost CAD (Figure 2). These factors should remain in place through the summer to sustain recent CAD gains.
6-12 Month Outlook – Timing on policy shifts
Our economists expect the US output gap to close in H1 2021, leading the Fed to signal a tapering sometime in late summer/early fall. This pivot should cause some re-pricing in rate expectations, with the Fed expected to raise interest rates before the BoC as additional stimulus pushes the US economy significantly further into excess demand. As the market prices in this dynamic, it could serve as an inflection point that leads to more sustained USD strength.
Indicators
Current (Previous)* Official cash rate 0.25% (0.75%) Trend interest rates 10y average 0.93% Bias in interest rate market Neutral Core CPI Inflation (Trim) %Y/Y Mar (Feb) 2.2% (1.9%) CPI inflation target range %Y/Y 1-3% Budget balance % GDP FY20 (FY19) -1.7% (-0.6%) Budget balance target % GDP Declining over the business cycle GDP growth %Q/Q saar Q4 (Q3) 9.6% (40.6%) Trend GDP %Q/Q 2.01% Purchasing Power Parity value Mar 1.2382 Spot end-Apr 1.2287 PPP valuation USD/CAD is undervalued Current account balance % GDP Q4 (Q3) -1.9% (-2.0%) Trend current account balance % GDP -2.85% Moody’s foreign currency rating Aaa Outlook Stable * Current is latest month, quarter or year
Source: Statistics Canada, Haver, RBC Capital Markets
1. CA GDP growth continues to recoup pandemic losses
2. CAD recovers with terms of trade
Source: Statistics Canada, Haver, RBC Capital Markets
Forecasts
Source: RBC Capital Markets estimates
Q1 Q2f Q3f Q4f Q1f Q2f Q3f Q4f
USD/CAD 1.26 1.24 1.26 1.28 1.29 1.30 1.30 1.30
EUR/CAD 1.47 1.44 1.45 1.46 1.46 1.46 1.47 1.48
CAD/JPY 88.1 86.3 81.7 78.1 79.1 80.0 81.5 83.1
20222021
0
20
40
60
80
100
120
Feb/20 Apr/20 Jun/20 Aug/20 Oct/20 Dec/20 Feb/21
Manufacturing
Transportation and Warehousing
Professional/Scientific/Technical
Accomodation and Food Services
Total GDP
Real GDP Indexed to Feb-2020
-30%
-20%
-10%
0%
10%
20%
30%
01 03 05 07 09 11 13 15 17 19 21
CAD/USD (YoY) Terms of Trade (YoY)
Currency Report Card
07 May 2021 10
Australian Dollar Adam Cole
1-3 Month Outlook – At the mercy of USD direction
AUD/USD rallied back to the middle of the year’s range in April, but this largely reflected the correction lower in USD (Figure 1) and AUD was lower on most G10 crosses, including AUD/NZD. As with several other G10 currencies, Australia is a positive story that lacks a route into the currency due to the stubbornness of the central bank. In its May Statement on Monetary Policy, the RBA revised up its GDP forecasts for both this year and next reflecting stronger private demand across all key components. This mirrors the upward trend in private sector forecasts that has been in place since late last year (Figure 2). The RBA also revised unemployment lower and lifted its expectations for wage growth. Yet despite this, the line that it “will not increase the cash rate until actual inflation is sustainably within the 2 to 3 per cent target range…This is unlikely to be until 2024 at the earliest” remains unchanged.
As Figure 1 shows, shifting rate expectations (grey bars) have contributed very little to AUD/USD direction since the collapse in policy rates to the effective zero-bound last year, having previously been a key driver. Instead, most of the month-to-month variation has been a result of general USD direction (dark blue bars) and shifts in risk appetite (green). While the RBA’s forward guidance keeps rate expectations so solidly anchored, this is likely to remain the case and the small losses we forecast for AUD/USD largely reflect our bias toward broad USD gains (forecasts unchanged). Although there is more active debate on the RBA’s QE programme, we see this as having a very limited impact on the currency unless it is allowed to drive forward rate expectations. Our economists expect the RBA to reduce the size of its bond purchases as it starts the third round of QE and they do not expect the YCC bond to roll from Nov-23 to Nov-24. But this modest slowdown in the pace of easing has limited implications for the currency.
6-12 Month Outlook – Decent domestic story
Governor Lowe says it is “premature to be considering withdrawal of the monetary stimulus” and the RBA are keen to stress the importance of the size of the balance sheet, not the rate of change. So their characterisation of reduced bond purchases would not be tighter policy, but that the central bank is easing more slowly. Households are running elevated savings ratios and the private sector is in a good position to contribute to growth as COVID uncertainty recedes, but without rates as a driver, the longer-term outlook for AUD/USD is also dominated by USD direction.
Indicators
Current (Previous)* Official cash rate 0.10% (0.25%) Trend interest rates 10y average 2.9% Bias in interest rate market Flat CPI Inflation %Y/Y Q1 (Q4) 1.1% (0.9%) CPI Inflation target range %Y/Y 2.0-3.0% Budget balance % GDP FY20/19 -4.3%/0.0% Budget balance target % GDP Balanced over the business cycle GDP Growth %Y/Y Q4 (Q3) -1.1% (-3.7%) Trend GDP %Y/Y 2.8% Purchasing Power Parity Value Q1 0.6688 Spot end-Apr 0.7716 PPP Valuation AUD/USD is overvalued Current account balance % GDP Q4 (Q3) 3.0% (2.2%) Trend current account balance % GDP -3.4% Moody’s Foreign Currency Rating Aaa Outlook Stable * Current is latest month, quarter or year
Source: RBC Capital Markets, Bloomberg
1. AUD’s April rise driven by USD drop
2. AU growth expectations still creeping up
Source: RBC Capital Markets, Bloomberg
Forecasts
Source: RBC Capital Markets estimates
Q1 Q2f Q3f Q4f Q1f Q2f Q3f Q4f
AUD/USD 0.76 0.77 0.76 0.75 0.74 0.73 0.73 0.73
EUR/AUD 1.54 1.51 1.51 1.52 1.53 1.53 1.55 1.56
AUD/NZD 1.09 1.08 1.09 1.09 1.09 1.07 1.07 1.07
AUD/CAD 0.95 0.95 0.96 0.96 0.95 0.95 0.95 0.95
20222021
-8.0
-6.0
-4.0
-2.0
0.0
2.0
4.0
6.0
8.0
Jan May Sep Jan May Sep Jan
Unexp
China
USD
Iron
SPX
2yr
AUD
Estimated contributions to monthly changes in AUD/USD, % points
-4
-3
-2
-1
0
1
2
3
4
5
6
Jan-20 Mar-20 May-20 Jul-20 Sep-20 Nov-20 Jan-21 Mar-21 May-21
AU
NZ
CA
Consensus forecast: cumulative GDP change over 2020 and 2021
Currency Report Card
07 May 2021 11
New Zealand Dollar Adam Cole
1-3 Month Outlook – At risk from housing measures
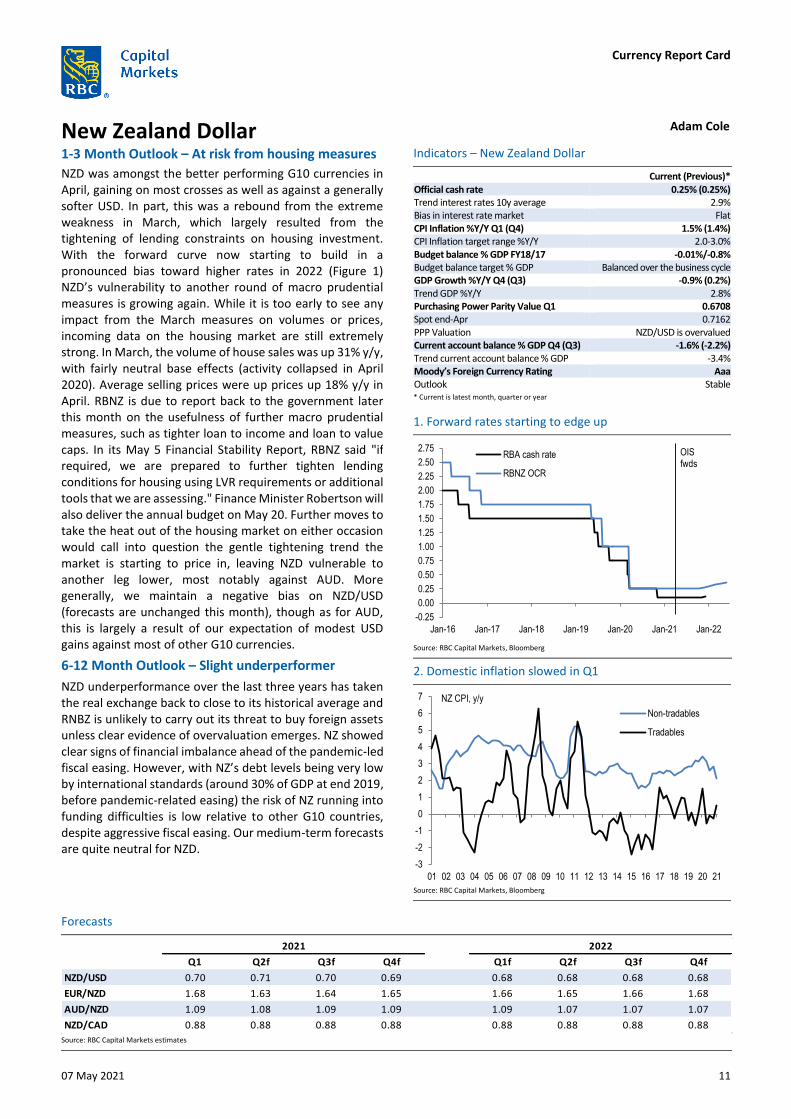
NZD was amongst the better performing G10 currencies in April, gaining on most crosses as well as against a generally softer USD. In part, this was a rebound from the extreme weakness in March, which largely resulted from the tightening of lending constraints on housing investment. With the forward curve now starting to build in a pronounced bias toward higher rates in 2022 (Figure 1) NZD’s vulnerability to another round of macro prudential measures is growing again. While it is too early to see any impact from the March measures on volumes or prices, incoming data on the housing market are still extremely strong. In March, the volume of house sales was up 31% y/y, with fairly neutral base effects (activity collapsed in April 2020). Average selling prices were up prices up 18% y/y in April. RBNZ is due to report back to the government later this month on the usefulness of further macro prudential measures, such as tighter loan to income and loan to value caps. In its May 5 Financial Stability Report, RBNZ said "if required, we are prepared to further tighten lending conditions for housing using LVR requirements or additional tools that we are assessing." Finance Minister Robertson will also deliver the annual budget on May 20. Further moves to take the heat out of the housing market on either occasion would call into question the gentle tightening trend the market is starting to price in, leaving NZD vulnerable to another leg lower, most notably against AUD. More generally, we maintain a negative bias on NZD/USD (forecasts are unchanged this month), though as for AUD, this is largely a result of our expectation of modest USD gains against most of other G10 currencies.
6-12 Month Outlook – Slight underperformer
NZD underperformance over the last three years has taken the real exchange back to close to its historical average and RNBZ is unlikely to carry out its threat to buy foreign assets unless clear evidence of overvaluation emerges. NZ showed clear signs of financial imbalance ahead of the pandemic-led fiscal easing. However, with NZ’s debt levels being very low by international standards (around 30% of GDP at end 2019, before pandemic-related easing) the risk of NZ running into funding difficulties is low relative to other G10 countries, despite aggressive fiscal easing. Our medium-term forecasts are quite neutral for NZD.
Indicators – New Zealand Dollar
Current (Previous)* Official cash rate 0.25% (0.25%) Trend interest rates 10y average 2.9% Bias in interest rate market Flat CPI Inflation %Y/Y Q1 (Q4) 1.5% (1.4%) CPI Inflation target range %Y/Y 2.0-3.0% Budget balance % GDP FY18/17 -0.01%/-0.8% Budget balance target % GDP Balanced over the business cycle GDP Growth %Y/Y Q4 (Q3) -0.9% (0.2%) Trend GDP %Y/Y 2.8% Purchasing Power Parity Value Q1 0.6708 Spot end-Apr 0.7162 PPP Valuation NZD/USD is overvalued Current account balance % GDP Q4 (Q3) -1.6% (-2.2%) Trend current account balance % GDP -3.4% Moody’s Foreign Currency Rating Aaa Outlook Stable * Current is latest month, quarter or year
Source: RBC Capital Markets, Bloomberg
1. Forward rates starting to edge up
2. Domestic inflation slowed in Q1
Source: RBC Capital Markets, Bloomberg
Forecasts
Source: RBC Capital Markets estimates
Q1 Q2f Q3f Q4f Q1f Q2f Q3f Q4f
NZD/USD 0.70 0.71 0.70 0.69 0.68 0.68 0.68 0.68
EUR/NZD 1.68 1.63 1.64 1.65 1.66 1.65 1.66 1.68
AUD/NZD 1.09 1.08 1.09 1.09 1.09 1.07 1.07 1.07
NZD/CAD 0.88 0.88 0.88 0.88 0.88 0.88 0.88 0.88
20222021
-0.25
0.00
0.25
0.50
0.75
1.00
1.25
1.50
1.75
2.00
2.25
2.50
2.75
Jan-16 Jan-17 Jan-18 Jan-19 Jan-20 Jan-21 Jan-22
RBA cash rate
RBNZ OCR
OIS fwds
-3
-2
-1
0
1
2
3
4
5
6
7
01 02 03 04 05 06 07 08 09 10 11 12 13 14 15 16 17 18 19 20 21
Non-tradables
Tradables
NZ CPI, y/y
Currency Report Card
07 May 2021 12
Chinese Yuan Alvin T. Tan 1-3 Month Outlook – Supported by fundamentals
China’s cyclical growth momentum likely peaked in the first quarter, largely due to base effects. The policy focus has shifted back towards deleveraging. Tightening credit provision and fiscal spending are gradually weighing down the growth momentum. Policymakers nonetheless remain cautious and are keen not to overtighten.
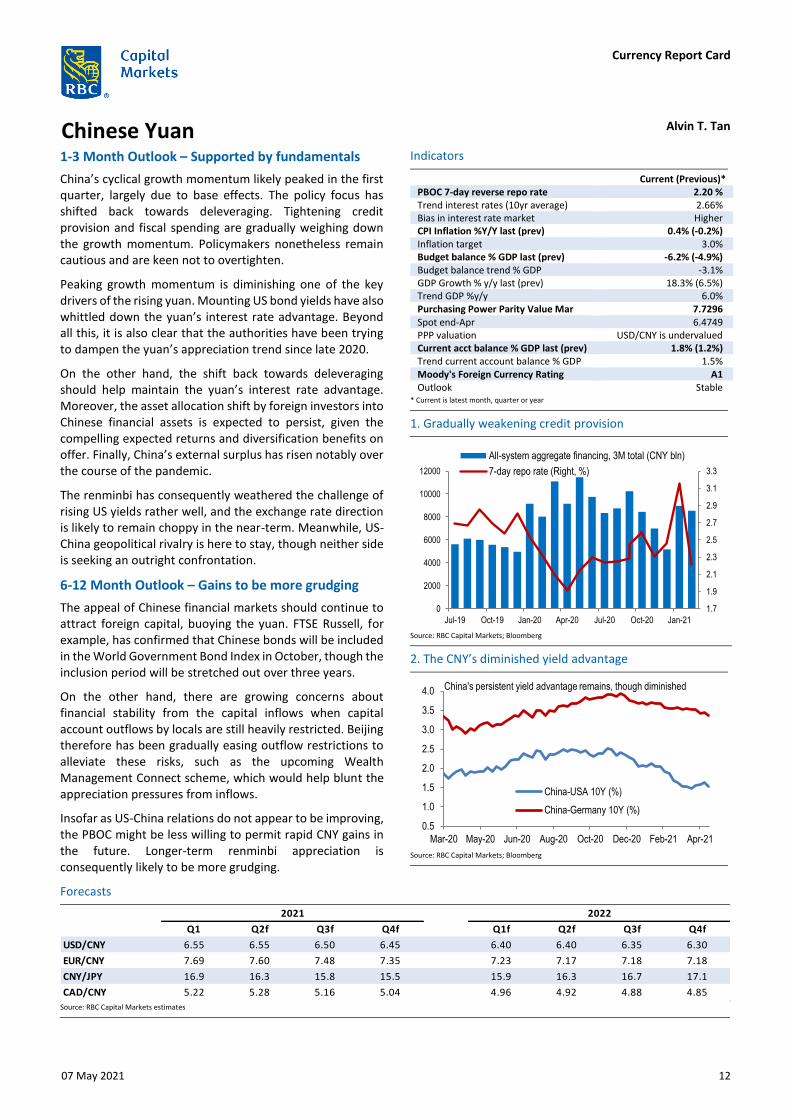
Peaking growth momentum is diminishing one of the key drivers of the rising yuan. Mounting US bond yields have also whittled down the yuan’s interest rate advantage. Beyond all this, it is also clear that the authorities have been trying to dampen the yuan’s appreciation trend since late 2020.
On the other hand, the shift back towards deleveraging should help maintain the yuan’s interest rate advantage. Moreover, the asset allocation shift by foreign investors into Chinese financial assets is expected to persist, given the compelling expected returns and diversification benefits on offer. Finally, China’s external surplus has risen notably over the course of the pandemic.
The renminbi has consequently weathered the challenge of rising US yields rather well, and the exchange rate direction is likely to remain choppy in the near-term. Meanwhile, US-China geopolitical rivalry is here to stay, though neither side is seeking an outright confrontation.
6-12 Month Outlook – Gains to be more grudging
The appeal of Chinese financial markets should continue to attract foreign capital, buoying the yuan. FTSE Russell, for example, has confirmed that Chinese bonds will be included in the World Government Bond Index in October, though the inclusion period will be stretched out over three years.
On the other hand, there are growing concerns about financial stability from the capital inflows when capital account outflows by locals are still heavily restricted. Beijing therefore has been gradually easing outflow restrictions to alleviate these risks, such as the upcoming Wealth Management Connect scheme, which would help blunt the appreciation pressures from inflows.
Insofar as US-China relations do not appear to be improving, the PBOC might be less willing to permit rapid CNY gains in the future. Longer-term renminbi appreciation is consequently likely to be more grudging.
Indicators
Current (Previous)* PBOC 7-day reverse repo rate 2.20 % Trend interest rates (10yr average) 2.66% Bias in interest rate market Higher CPI Inflation %Y/Y last (prev) 0.4% (-0.2%) Inflation target 3.0% Budget balance % GDP last (prev) -6.2% (-4.9%) Budget balance trend % GDP -3.1% GDP Growth % y/y last (prev) 18.3% (6.5%) Trend GDP %y/y 6.0% Purchasing Power Parity Value Mar 7.7296 Spot end-Apr 6.4749 PPP valuation USD/CNY is undervalued Current acct balance % GDP last (prev) 1.8% (1.2%) Trend current account balance % GDP 1.5% Moody's Foreign Currency Rating A1 Outlook Stable
* Current is latest month, quarter or year
Source: RBC Capital Markets; Bloomberg
1. Gradually weakening credit provision
2. The CNY’s diminished yield advantage
Source: RBC Capital Markets; Bloomberg
Forecasts
Source: RBC Capital Markets estimates
Q1 Q2f Q3f Q4f Q1f Q2f Q3f Q4f
USD/CNY 6.55 6.55 6.50 6.45 6.40 6.40 6.35 6.30
EUR/CNY 7.69 7.60 7.48 7.35 7.23 7.17 7.18 7.18
CNY/JPY 16.9 16.3 15.8 15.5 15.9 16.3 16.7 17.1
CAD/CNY 5.22 5.28 5.16 5.04 4.96 4.92 4.88 4.85
20222021
1.7
1.9
2.1
2.3
2.5
2.7
2.9
3.1
3.3
0
2000
4000
6000
8000
10000
12000
Jul-19 Oct-19 Jan-20 Apr-20 Jul-20 Oct-20 Jan-21
All-system aggregate financing, 3M total (CNY bln)
7-day repo rate (Right, %)
0.5
1.0
1.5
2.0
2.5
3.0
3.5
4.0
Mar-20 May-20 Jun-20 Aug-20 Oct-20 Dec-20 Feb-21 Apr-21
China-USA 10Y (%)
China-Germany 10Y (%)
China's persistent yield advantage remains, though diminished
Currency Report Card
07 May 2021 13
Indian Rupee Alvin T. Tan
1-3 Month Outlook – Revived growth risks
India’s Covid-19 situation has undergone a volte-face in a little less than two months. The country how finds itself as the epicentre of the global pandemic, and this has undercut expectations of a strong economic recovery. New Delhi’s unwillingness to declare a national lockdown is limiting the growth impact, though at tragic cost.
The RBI has been notable in its policy activism, but it refused to launch a formal pre-defined QE program until last April, when bond yields threatened to push higher. But even then, the new G-SAP program was supposed to be limited to just the current quarter. The risks to growth will translate into a larger fiscal borrowing target, so further RBI support will be necessary. The RBI is therefore likely to extend and enlarge its QE program beyond the current quarter.
Persistent monetary easing measures in India will be in stark contrast to steady policy across most other Asian countries. The rupee is expected to remain a laggard within the Asia FX complex as a result.
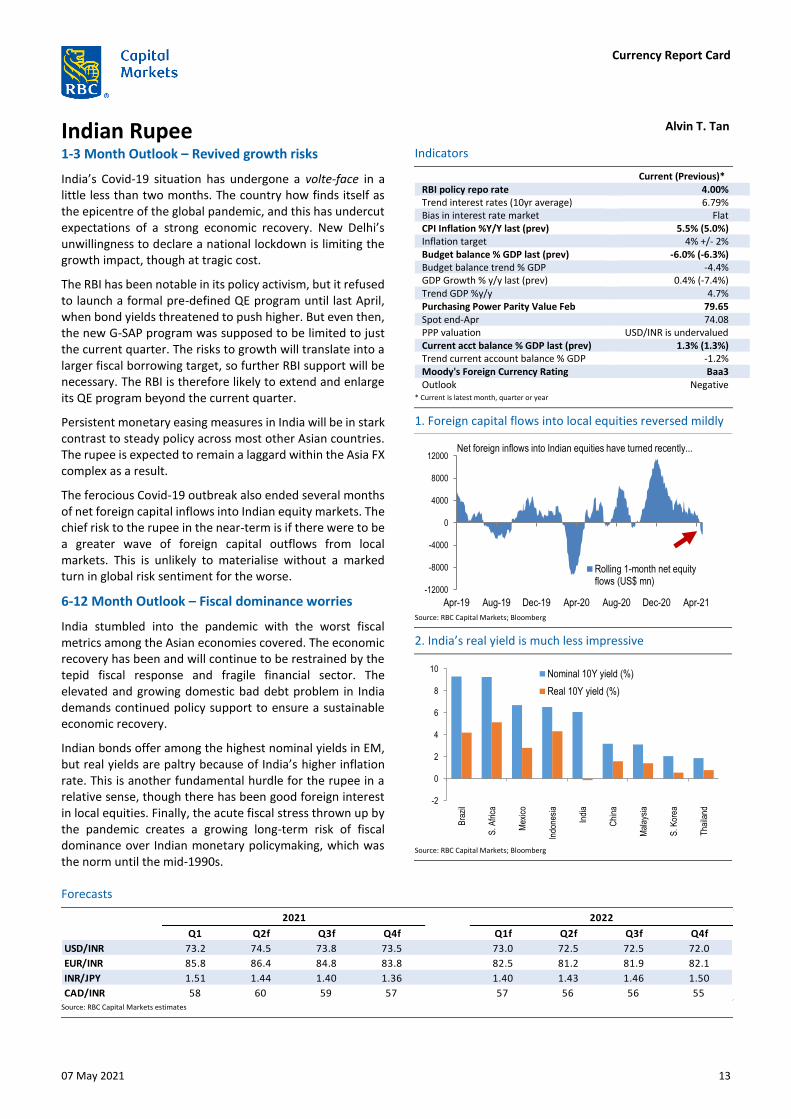
The ferocious Covid-19 outbreak also ended several months of net foreign capital inflows into Indian equity markets. The chief risk to the rupee in the near-term is if there were to be a greater wave of foreign capital outflows from local markets. This is unlikely to materialise without a marked turn in global risk sentiment for the worse.
6-12 Month Outlook – Fiscal dominance worries
India stumbled into the pandemic with the worst fiscal metrics among the Asian economies covered. The economic recovery has been and will continue to be restrained by the tepid fiscal response and fragile financial sector. The elevated and growing domestic bad debt problem in India demands continued policy support to ensure a sustainable economic recovery.
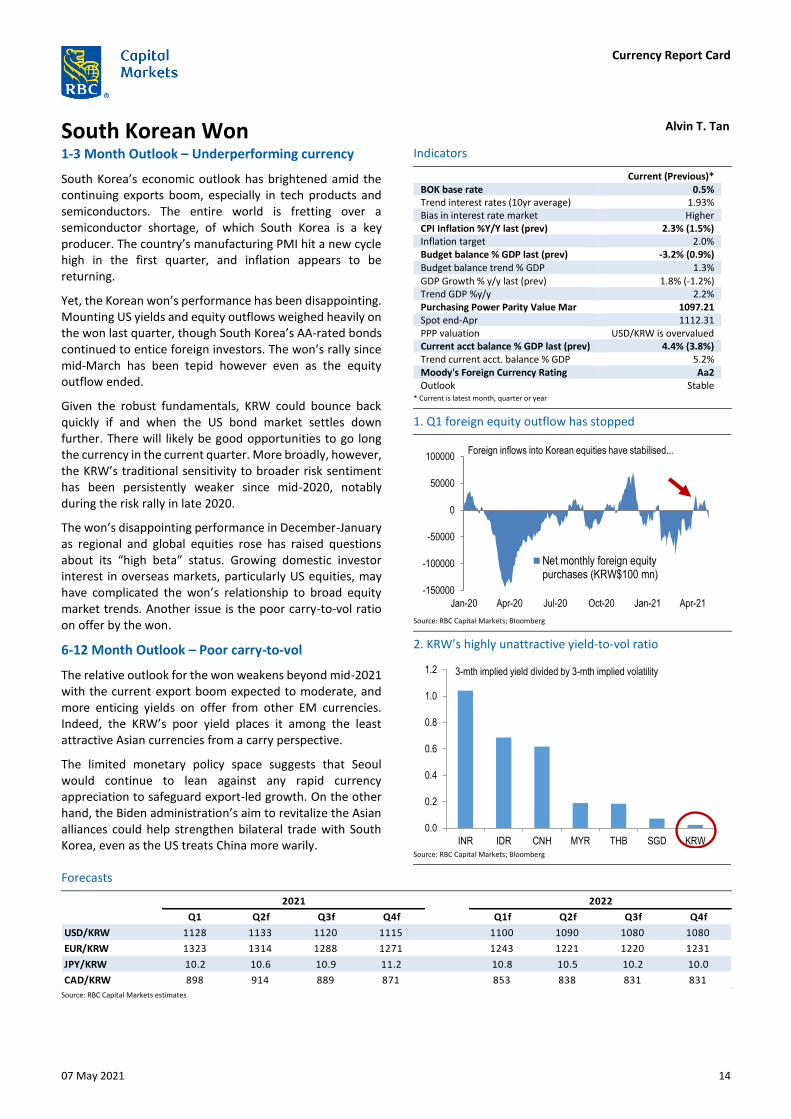
Indian bonds offer among the highest nominal yields in EM, but real yields are paltry because of India’s higher inflation rate. This is another fundamental hurdle for the rupee in a relative sense, though there has been good foreign interest in local equities. Finally, the acute fiscal stress thrown up by the pandemic creates a growing long-term risk of fiscal dominance over Indian monetary policymaking, which was the norm until the mid-1990s.
Indicators
Current (Previous)* RBI policy repo rate 4.00% Trend interest rates (10yr average) 6.79% Bias in interest rate market Flat CPI Inflation %Y/Y last (prev) 5.5% (5.0%) Inflation target 4% +/- 2% Budget balance % GDP last (prev) -6.0% (-6.3%) Budget balance trend % GDP -4.4% GDP Growth % y/y last (prev) 0.4% (-7.4%) Trend GDP %y/y 4.7% Purchasing Power Parity Value Feb 79.65 Spot end-Apr 74.08 PPP valuation USD/INR is undervalued Current acct balance % GDP last (prev) 1.3% (1.3%) Trend current account balance % GDP -1.2% Moody's Foreign Currency Rating Baa3 Outlook Negative
* Current is latest month, quarter or year
1. Foreign capital flows into local equities reversed mildly
Source: RBC Capital Markets; Bloomberg
2. India’s real yield is much less impressive
Source: RBC Capital Markets; Bloomberg
Forecasts
Source: RBC Capital Markets estimates
Q1 Q2f Q3f Q4f Q1f Q2f Q3f Q4f
USD/INR 73.2 74.5 73.8 73.5 73.0 72.5 72.5 72.0
EUR/INR 85.8 86.4 84.8 83.8 82.5 81.2 81.9 82.1
INR/JPY 1.51 1.44 1.40 1.36 1.40 1.43 1.46 1.50
CAD/INR 58 60 59 57 57 56 56 55
2021 2022
-12000
-8000
-4000
0
4000
8000
12000
Apr-19 Aug-19 Dec-19 Apr-20 Aug-20 Dec-20 Apr-21
Rolling 1-month net equityflows (US$ mn)
Net foreign inflows into Indian equities have turned recently...
-2
0
2
4
6
8
10
Bra
zil
S. A
fric
a
Mex
ico
Indo
nesi
a
Indi
a
Chi
na
Mal
aysi
a
S. K
orea
Tha
iland
Nominal 10Y yield (%)
Real 10Y yield (%)
Currency Report Card
07 May 2021 14
South Korean Won Alvin T. Tan
1-3 Month Outlook – Underperforming currency
South Korea’s economic outlook has brightened amid the continuing exports boom, especially in tech products and semiconductors. The entire world is fretting over a semiconductor shortage, of which South Korea is a key producer. The country’s manufacturing PMI hit a new cycle high in the first quarter, and inflation appears to be returning.
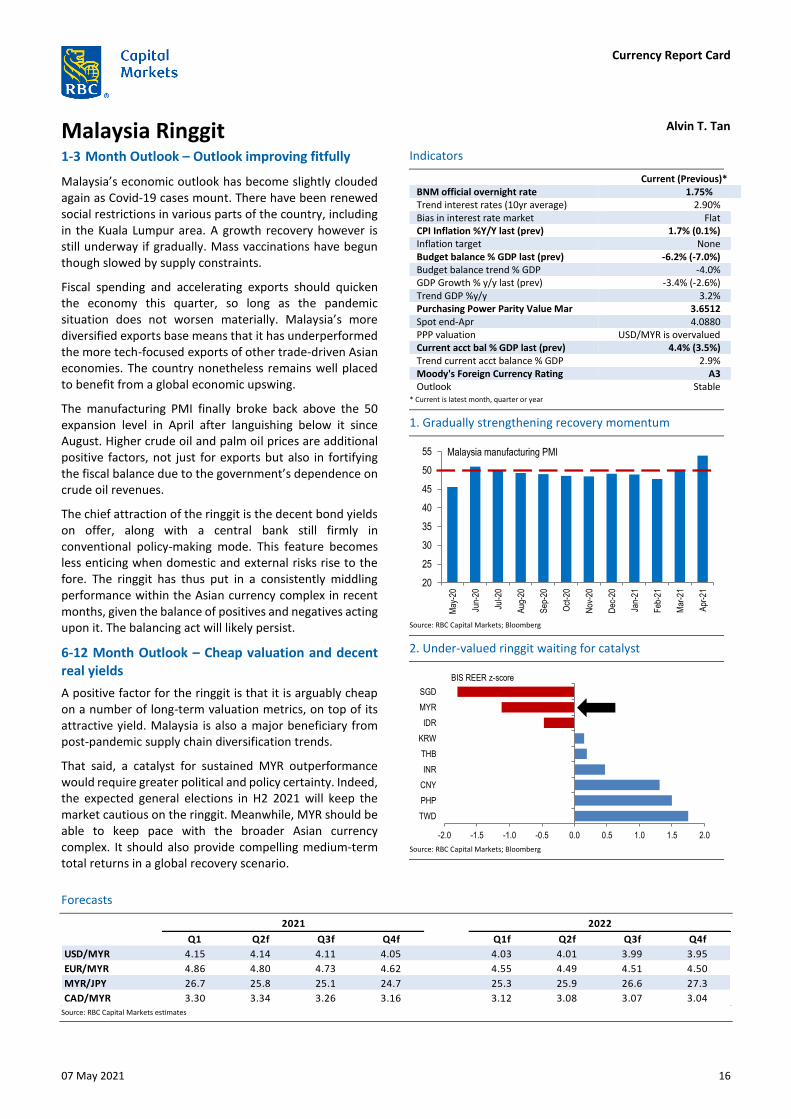
Yet, the Korean won’s performance has been disappointing. Mounting US yields and equity outflows weighed heavily on the won last quarter, though South Korea’s AA-rated bonds continued to entice foreign investors. The won’s rally since mid-March has been tepid however even as the equity outflow ended.
Given the robust fundamentals, KRW could bounce back quickly if and when the US bond market settles down further. There will likely be good opportunities to go long the currency in the current quarter. More broadly, however, the KRW’s traditional sensitivity to broader risk sentiment has been persistently weaker since mid-2020, notably during the risk rally in late 2020.
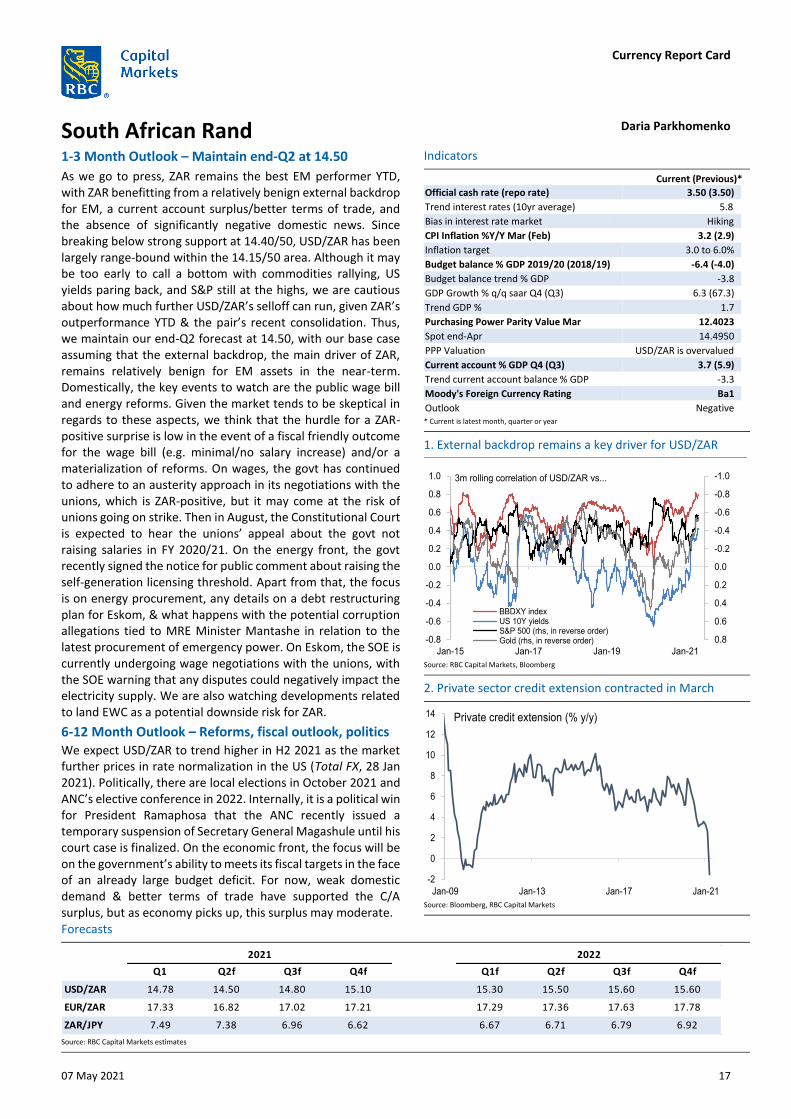
The won’s disappointing performance in December-January as regional and global equities rose has raised questions about its “high beta” status. Growing domestic investor interest in overseas markets, particularly US equities, may have complicated the won’s relationship to broad equity market trends. Another issue is the poor carry-to-vol ratio on offer by the won.
6-12 Month Outlook – Poor carry-to-vol
The relative outlook for the won weakens beyond mid-2021 with the current export boom expected to moderate, and more enticing yields on offer from other EM currencies. Indeed, the KRW’s poor yield places it among the least attractive Asian currencies from a carry perspective.
The limited monetary policy space suggests that Seoul would continue to lean against any rapid currency appreciation to safeguard export-led growth. On the other hand, the Biden administration’s aim to revitalize the Asian alliances could help strengthen bilateral trade with South Korea, even as the US treats China more warily.
Indicators
Current (Previous)* BOK base rate 0.5% Trend interest rates (10yr average) 1.93% Bias in interest rate market Higher CPI Inflation %Y/Y last (prev) 2.3% (1.5%) Inflation target 2.0% Budget balance % GDP last (prev) -3.2% (0.9%) Budget balance trend % GDP 1.3%
GDP Growth % y/y last (prev) 1.8% (-1.2%) Trend GDP %y/y 2.2% Purchasing Power Parity Value Mar 1097.21 Spot end-Apr 1112.31 PPP valuation USD/KRW is overvalued Current acct balance % GDP last (prev) 4.4% (3.8%) Trend current acct. balance % GDP 5.2% Moody's Foreign Currency Rating Aa2 Outlook Stable
* Current is latest month, quarter or year
Source: RBC Capital Markets; BIoomberg
1. Q1 foreign equity outflow has stopped
2. KRW’s highly unattractive yield-to-vol ratio
Source: RBC Capital Markets; Bloomberg
Forecasts
Source: RBC Capital Markets estimates
Q1 Q2f Q3f Q4f Q1f Q2f Q3f Q4f
USD/KRW 1128 1133 1120 1115 1100 1090 1080 1080
EUR/KRW 1323 1314 1288 1271 1243 1221 1220 1231
JPY/KRW 10.2 10.6 10.9 11.2 10.8 10.5 10.2 10.0
CAD/KRW 898 914 889 871 853 838 831 831
20222021
-150000
-100000
-50000
0
50000
100000
Jan-20 Apr-20 Jul-20 Oct-20 Jan-21 Apr-21
Net monthly foreign equitypurchases (KRW$100 mn)
Foreign inflows into Korean equities have stabilised...
0.0
0.2
0.4
0.6
0.8
1.0
1.2
INR IDR CNH MYR THB SGD KRW
3-mth implied yield divided by 3-mth implied volatility

Currency Report Card
07 May 2021 15
Taiwanese Dollar & Singapore Dollar Alvin T. Tan
Taiwan Dollar – Stronger if not for the CBC
The Taiwan dollar’s current uptrend has lasted almost two years. The currency enjoys powerful fundamental supports, namely a sizeable current account surplus and the economy’s large tech sector, which has benefitted from pandemic-driven global demand. Exports growth has accelerated further at the start of the year.
The currency’s steady appreciation against the US dollar hit a snag in March amid general EM currency weakness triggered by higher US interest rates. The implied negative yields on the TWD NDF rate facilitated the selloff, but the currency bounced back convincingly in April.
There appears to be a growing policy debate about whether the CBC should allow TWD to appreciate naturally, rather than continue fighting the strong fundamental pressures. Another complicating factor is whether the tech-led exports boom will persist as the world gradually returns to “normal”. In any event, the CBC may be expected to continue to resist rapid appreciation pressures in the near-term.
Singapore Dollar – “Zero appreciation” still in play
Singapore’s recovery has broadened and quickened pace. The global growth recovery provides a fundamental underpinning to the local recovery. However, the still un-settled pandemic situation in Southeast Asia requires Singapore to remain vigilant.
The SGD has long been a low carry currency, but Singaporean assets are attractive for those seeking quality. Its government bonds are now among the highest-yielding of the AAA club. Nonetheless, the MAS will continue to assist the growth recovery by leaning against a sustained rise in the trade-weighted SGD through its “zero appreciation” policy. The SGD has performed approximately in the middle of the pack of Asian FX in each of the past three quarters.
Rising house prices are becoming a policy concern again, but will be dealt with through macro-prudential policies. There is some speculation about whether MAS will shift policy in October, but the decision will be highly data-dependent. SGD will continue to march along with the broader Asian currency complex.
Indicators
Current (Previous)* CBC discount rate 1.125% Trend interest rates (10yr average) 1.58% Bias in interest rate market Flat CPI Inflation %Y/Y last (prev) 2.1% (1.2%) Inflation target None Budget balance % GDP last (prev) 0.5% (0.1%) Budget balance trend % GDP -0.8% GDP Growth % y/y last (prev) 8.2% (5.1%) Trend GDP %y/y 2.9% Purchasing Power Parity Value Mar 27.07 Spot end-Apr 27.90 PPP valuation USD/TWD is overvalued Current account balance % GDP last (prev) 13.9% (12.8%) Trend current account balance % GDP 12.6% Moody's Foreign Currency Rating Aa3 Outlook Positive
* Current is latest month, quarter or year
Source: RBC Capital Markets; Bloomberg
1. Taiwan’s export-led growth powers on
2. Singapore’s broadening recovery
Source: RBC Capital Markets; Bloomberg
Forecasts
Source: RBC Capital Markets estimates
Q1 Q2f Q3f Q4f Q1f Q2f Q3f Q4f
USD/TWD 28.50 28.00 27.90 27.80 27.70 27.60 27.50 27.50
EUR/TWD 33.43 32.48 32.09 31.69 31.30 30.91 31.08 31.35
TWD/JPY 3.9 3.8 3.7 3.6 3.7 3.8 3.9 3.9
CAD/TWD 22.69 22.58 22.14 35.58 35.73 35.88 35.75 35.75
2021 2022
0
10
20
30
40
50
60
Jun-20 Aug-20 Oct-20 Dec-20 Feb-21
to USA
to mainland China
Booming Taiwan exports (% y/y)
20
25
30
35
40
45
50
55
Jul-20 Sep-20 Nov-20 Jan-21 Mar-21
Markit whole economy PMI
Manufacturing PMI
Currency Report Card
07 May 2021 16
Malaysia Ringgit Alvin T. Tan 1-3 Month Outlook – Outlook improving fitfully
Malaysia’s economic outlook has become slightly clouded again as Covid-19 cases mount. There have been renewed social restrictions in various parts of the country, including in the Kuala Lumpur area. A growth recovery however is still underway if gradually. Mass vaccinations have begun though slowed by supply constraints.
Fiscal spending and accelerating exports should quicken the economy this quarter, so long as the pandemic situation does not worsen materially. Malaysia’s more diversified exports base means that it has underperformed the more tech-focused exports of other trade-driven Asian economies. The country nonetheless remains well placed to benefit from a global economic upswing.
The manufacturing PMI finally broke back above the 50 expansion level in April after languishing below it since August. Higher crude oil and palm oil prices are additional positive factors, not just for exports but also in fortifying the fiscal balance due to the government’s dependence on crude oil revenues.
The chief attraction of the ringgit is the decent bond yields on offer, along with a central bank still firmly in conventional policy-making mode. This feature becomes less enticing when domestic and external risks rise to the fore. The ringgit has thus put in a consistently middling performance within the Asian currency complex in recent months, given the balance of positives and negatives acting upon it. The balancing act will likely persist.
6-12 Month Outlook – Cheap valuation and decent real yields
A positive factor for the ringgit is that it is arguably cheap on a number of long-term valuation metrics, on top of its attractive yield. Malaysia is also a major beneficiary from post-pandemic supply chain diversification trends.
That said, a catalyst for sustained MYR outperformance would require greater political and policy certainty. Indeed, the expected general elections in H2 2021 will keep the market cautious on the ringgit. Meanwhile, MYR should be able to keep pace with the broader Asian currency complex. It should also provide compelling medium-term total returns in a global recovery scenario.
Indicators
Current (Previous)* BNM official overnight rate 1.75% Trend interest rates (10yr average) 2.90% Bias in interest rate market Flat CPI Inflation %Y/Y last (prev) 1.7% (0.1%) Inflation target None Budget balance % GDP last (prev) -6.2% (-7.0%) Budget balance trend % GDP -4.0% GDP Growth % y/y last (prev) -3.4% (-2.6%) Trend GDP %y/y 3.2% Purchasing Power Parity Value Mar 3.6512 Spot end-Apr 4.0880 PPP valuation USD/MYR is overvalued Current acct bal % GDP last (prev) 4.4% (3.5%) Trend current acct balance % GDP 2.9% Moody's Foreign Currency Rating A3 Outlook Stable
* Current is latest month, quarter or year
Source: RBC Capital Markets; Bloomberg
1. Gradually strengthening recovery momentum
2. Under-valued ringgit waiting for catalyst
Source: RBC Capital Markets; Bloomberg
Forecasts
Source: RBC Capital Markets estimates
Q1 Q2f Q3f Q4f Q1f Q2f Q3f Q4f
USD/MYR 4.15 4.14 4.11 4.05 4.03 4.01 3.99 3.95
EUR/MYR 4.86 4.80 4.73 4.62 4.55 4.49 4.51 4.50
MYR/JPY 26.7 25.8 25.1 24.7 25.3 25.9 26.6 27.3
CAD/MYR 3.30 3.34 3.26 3.16 3.12 3.08 3.07 3.04
2021 2022
20
25
30
35
40
45
50
55M
ay-2
0
Jun-
20
Jul-2
0
Aug
-20
Sep
-20
Oct
-20
Nov
-20
Dec
-20
Jan-
21
Feb
-21
Mar
-21
Apr
-21
Malaysia manufacturing PMI
-2.0 -1.5 -1.0 -0.5 0.0 0.5 1.0 1.5 2.0
TWD
PHP
CNY
INR
THB
KRW
IDR
MYR
SGD
BIS REER z-score
Currency Report Card
07 May 2021 17
South African Rand Daria Parkhomenko 1-3 Month Outlook – Maintain end-Q2 at 14.50
As we go to press, ZAR remains the best EM performer YTD, with ZAR benefitting from a relatively benign external backdrop for EM, a current account surplus/better terms of trade, and the absence of significantly negative domestic news. Since breaking below strong support at 14.40/50, USD/ZAR has been largely range-bound within the 14.15/50 area. Although it may be too early to call a bottom with commodities rallying, US yields paring back, and S&P still at the highs, we are cautious about how much further USD/ZAR’s selloff can run, given ZAR’s outperformance YTD & the pair’s recent consolidation. Thus, we maintain our end-Q2 forecast at 14.50, with our base case assuming that the external backdrop, the main driver of ZAR, remains relatively benign for EM assets in the near-term. Domestically, the key events to watch are the public wage bill and energy reforms. Given the market tends to be skeptical in regards to these aspects, we think that the hurdle for a ZAR-positive surprise is low in the event of a fiscal friendly outcome for the wage bill (e.g. minimal/no salary increase) and/or a materialization of reforms. On wages, the govt has continued to adhere to an austerity approach in its negotiations with the unions, which is ZAR-positive, but it may come at the risk of unions going on strike. Then in August, the Constitutional Court is expected to hear the unions’ appeal about the govt not raising salaries in FY 2020/21. On the energy front, the govt recently signed the notice for public comment about raising the self-generation licensing threshold. Apart from that, the focus is on energy procurement, any details on a debt restructuring plan for Eskom, & what happens with the potential corruption allegations tied to MRE Minister Mantashe in relation to the latest procurement of emergency power. On Eskom, the SOE is currently undergoing wage negotiations with the unions, with the SOE warning that any disputes could negatively impact the electricity supply. We are also watching developments related to land EWC as a potential downside risk for ZAR.
6-12 Month Outlook – Reforms, fiscal outlook, politics
We expect USD/ZAR to trend higher in H2 2021 as the market further prices in rate normalization in the US (Total FX, 28 Jan 2021). Politically, there are local elections in October 2021 and ANC’s elective conference in 2022. Internally, it is a political win for President Ramaphosa that the ANC recently issued a temporary suspension of Secretary General Magashule until his court case is finalized. On the economic front, the focus will be on the government’s ability to meets its fiscal targets in the face of an already large budget deficit. For now, weak domestic demand & better terms of trade have supported the C/A surplus, but as economy picks up, this surplus may moderate.
Indicators
Current (Previous)*
Official cash rate (repo rate) 3.50 (3.50)
Trend interest rates (10yr average) 5.8
Bias in interest rate market Hiking
CPI Inflation %Y/Y Mar (Feb) 3.2 (2.9)
Inflation target 3.0 to 6.0%
Budget balance % GDP 2019/20 (2018/19) -6.4 (-4.0)
Budget balance trend % GDP -3.8
GDP Growth % q/q saar Q4 (Q3) 6.3 (67.3)
Trend GDP % 1.7
Purchasing Power Parity Value Mar 12.4023
Spot end-Apr 14.4950
PPP Valuation USD/ZAR is overvalued
Current account % GDP Q4 (Q3) 3.7 (5.9)
Trend current account balance % GDP -3.3
Moody's Foreign Currency Rating Ba1
Outlook Negative * Current is latest month, quarter or year
Source: RBC Capital Markets, Bloomberg
1. External backdrop remains a key driver for USD/ZAR
2. Private sector credit extension contracted in March
Source: Bloomberg, RBC Capital Markets
Forecasts
Source: RBC Capital Markets estimates
Q1 Q2f Q3f Q4f Q1f Q2f Q3f Q4f
USD/ZAR 14.78 14.50 14.80 15.10 15.30 15.50 15.60 15.60
EUR/ZAR 17.33 16.82 17.02 17.21 17.29 17.36 17.63 17.78
ZAR/JPY 7.49 7.38 6.96 6.62 6.67 6.71 6.79 6.92
2021 2022
-1.0
-0.8
-0.6
-0.4
-0.2
0.0
0.2
0.4
0.6
0.8-0.8
-0.6
-0.4
-0.2
0.0
0.2
0.4
0.6
0.8
1.0
Jan-15 Jan-17 Jan-19 Jan-21
BBDXY indexUS 10Y yieldsS&P 500 (rhs, in reverse order)Gold (rhs, in reverse order)
3m rolling correlation of USD/ZAR vs...
-2
0
2
4
6
8
10
12
14
Jan-09 Jan-13 Jan-17 Jan-21
Private credit extension (% y/y)
Currency Report Card
07 May 2021 18
Polish Zloty Daria Parkhomenko 1-3 Month Outlook – Inflation, FX mortgages
As of writing, PLN is one of the top EM currencies this quarter so far, though YTD, PLN is still down against its peers (HUF & CZK) and EUR/PLN is close to flat. PLN’s outperformance this quarter has likely been driven by the market taking profit on its short PLN positioning (especially in early April) after EUR/PLN reached its multi-year high of 4.6800 in late March. Going forward, our forecasts assume limited gains for PLN vs EUR in the short-term, with a more pronounced appreciation in the second half of the year.
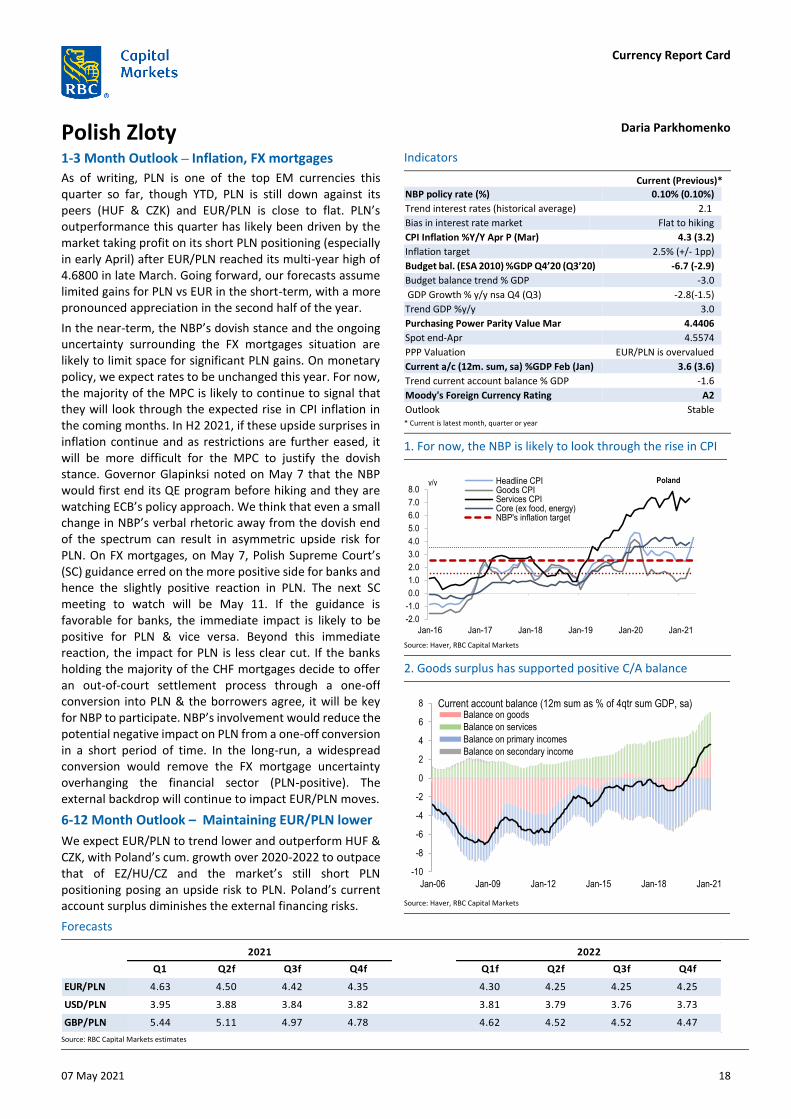
In the near-term, the NBP’s dovish stance and the ongoing uncertainty surrounding the FX mortgages situation are likely to limit space for significant PLN gains. On monetary policy, we expect rates to be unchanged this year. For now, the majority of the MPC is likely to continue to signal that they will look through the expected rise in CPI inflation in the coming months. In H2 2021, if these upside surprises in inflation continue and as restrictions are further eased, it will be more difficult for the MPC to justify the dovish stance. Governor Glapinksi noted on May 7 that the NBP would first end its QE program before hiking and they are watching ECB’s policy approach. We think that even a small change in NBP’s verbal rhetoric away from the dovish end of the spectrum can result in asymmetric upside risk for PLN. On FX mortgages, on May 7, Polish Supreme Court’s (SC) guidance erred on the more positive side for banks and hence the slightly positive reaction in PLN. The next SC meeting to watch will be May 11. If the guidance is favorable for banks, the immediate impact is likely to be positive for PLN & vice versa. Beyond this immediate reaction, the impact for PLN is less clear cut. If the banks holding the majority of the CHF mortgages decide to offer an out-of-court settlement process through a one-off conversion into PLN & the borrowers agree, it will be key for NBP to participate. NBP’s involvement would reduce the potential negative impact on PLN from a one-off conversion in a short period of time. In the long-run, a widespread conversion would remove the FX mortgage uncertainty overhanging the financial sector (PLN-positive). The external backdrop will continue to impact EUR/PLN moves.
6-12 Month Outlook – Maintaining EUR/PLN lower
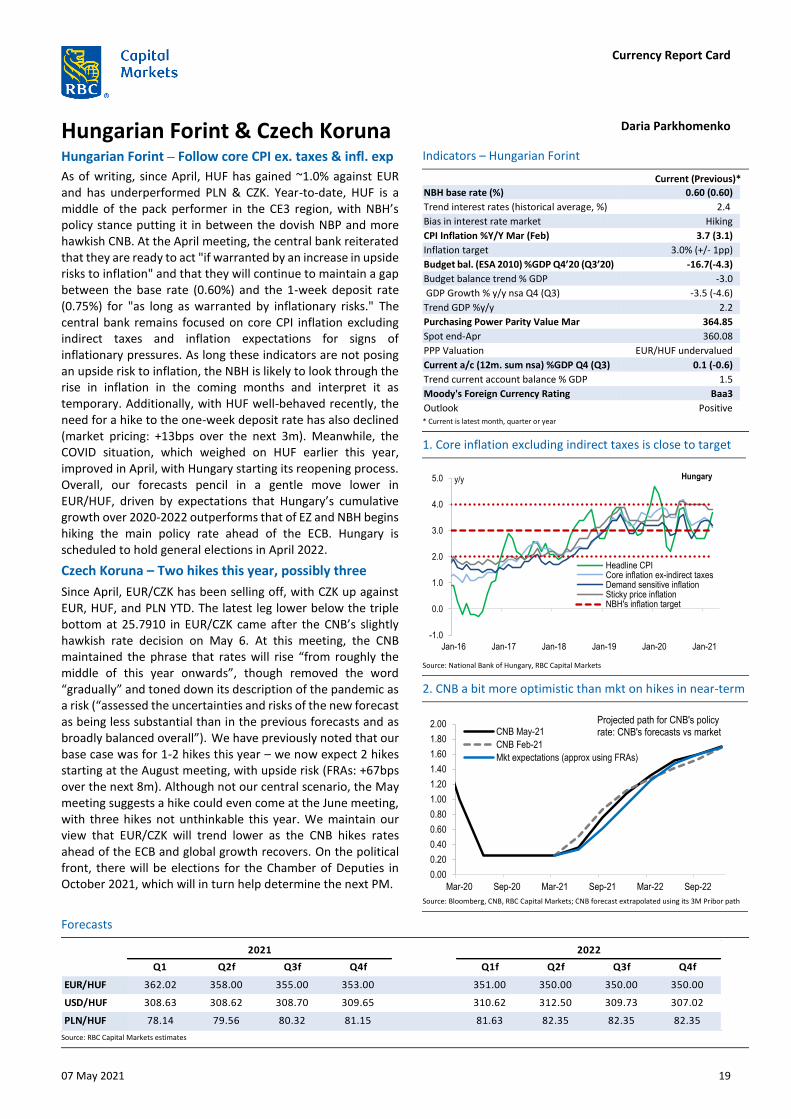
We expect EUR/PLN to trend lower and outperform HUF & CZK, with Poland’s cum. growth over 2020-2022 to outpace that of EZ/HU/CZ and the market’s still short PLN positioning posing an upside risk to PLN. Poland’s current account surplus diminishes the external financing risks.
Indicators
Current (Previous)*
NBP policy rate (%) 0.10% (0.10%)
Trend interest rates (historical average) 2.1
Bias in interest rate market Flat to hiking
CPI Inflation %Y/Y Apr P (Mar) 4.3 (3.2)
Inflation target 2.5% (+/- 1pp)
Budget bal. (ESA 2010) %GDP Q4’20 (Q3’20) -6.7 (-2.9)
Budget balance trend % GDP -3.0
GDP Growth % y/y nsa Q4 (Q3) -2.8(-1.5)
Trend GDP %y/y 3.0
Purchasing Power Parity Value Mar 4.4406
Spot end-Apr 4.5574
PPP Valuation EUR/PLN is overvalued
Current a/c (12m. sum, sa) %GDP Feb (Jan) 3.6 (3.6)
Trend current account balance % GDP -1.6
Moody's Foreign Currency Rating A2
Outlook Stable * Current is latest month, quarter or year
Source: Haver, RBC Capital Markets
1. For now, the NBP is likely to look through the rise in CPI
2. Goods surplus has supported positive C/A balance
Source: Haver, RBC Capital Markets
Forecasts
Source: RBC Capital Markets estimates
Q1 Q2f Q3f Q4f Q1f Q2f Q3f Q4f
EUR/PLN 4.63 4.50 4.42 4.35 4.30 4.25 4.25 4.25
USD/PLN 3.95 3.88 3.84 3.82 3.81 3.79 3.76 3.73
GBP/PLN 5.44 5.11 4.97 4.78 4.62 4.52 4.52 4.47
2021 2022
-2.0
-1.0
0.0
1.0
2.0
3.0
4.0
5.0
6.0
7.0
8.0
Jan-16 Jan-17 Jan-18 Jan-19 Jan-20 Jan-21
Headline CPIGoods CPIServices CPICore (ex food, energy)NBP's inflation target
y/y Poland
-10
-8
-6
-4
-2
0
2
4
6
8
Jan-06 Jan-09 Jan-12 Jan-15 Jan-18 Jan-21
Balance on goods
Balance on services
Balance on primary incomes
Balance on secondary income
Current account balance (12m sum as % of 4qtr sum GDP, sa)
Currency Report Card
07 May 2021 19
Hungarian Forint & Czech Koruna Daria Parkhomenko Hungarian Forint – Follow core CPI ex. taxes & infl. exp
As of writing, since April, HUF has gained ~1.0% against EUR and has underperformed PLN & CZK. Year-to-date, HUF is a middle of the pack performer in the CE3 region, with NBH’s policy stance putting it in between the dovish NBP and more hawkish CNB. At the April meeting, the central bank reiterated that they are ready to act "if warranted by an increase in upside risks to inflation" and that they will continue to maintain a gap between the base rate (0.60%) and the 1-week deposit rate (0.75%) for "as long as warranted by inflationary risks." The central bank remains focused on core CPI inflation excluding indirect taxes and inflation expectations for signs of inflationary pressures. As long these indicators are not posing an upside risk to inflation, the NBH is likely to look through the rise in inflation in the coming months and interpret it as temporary. Additionally, with HUF well-behaved recently, the need for a hike to the one-week deposit rate has also declined (market pricing: +13bps over the next 3m). Meanwhile, the COVID situation, which weighed on HUF earlier this year, improved in April, with Hungary starting its reopening process. Overall, our forecasts pencil in a gentle move lower in EUR/HUF, driven by expectations that Hungary’s cumulative growth over 2020-2022 outperforms that of EZ and NBH begins hiking the main policy rate ahead of the ECB. Hungary is scheduled to hold general elections in April 2022.
Czech Koruna – Two hikes this year, possibly three
Since April, EUR/CZK has been selling off, with CZK up against EUR, HUF, and PLN YTD. The latest leg lower below the triple bottom at 25.7910 in EUR/CZK came after the CNB’s slightly hawkish rate decision on May 6. At this meeting, the CNB maintained the phrase that rates will rise “from roughly the middle of this year onwards”, though removed the word “gradually” and toned down its description of the pandemic as a risk (“assessed the uncertainties and risks of the new forecast as being less substantial than in the previous forecasts and as broadly balanced overall”). We have previously noted that our base case was for 1-2 hikes this year – we now expect 2 hikes starting at the August meeting, with upside risk (FRAs: +67bps over the next 8m). Although not our central scenario, the May meeting suggests a hike could even come at the June meeting, with three hikes not unthinkable this year. We maintain our view that EUR/CZK will trend lower as the CNB hikes rates ahead of the ECB and global growth recovers. On the political front, there will be elections for the Chamber of Deputies in October 2021, which will in turn help determine the next PM.
Indicators – Hungarian Forint
Current (Previous)*
NBH base rate (%) 0.60 (0.60)
Trend interest rates (historical average, %) 2.4
Bias in interest rate market Hiking
CPI Inflation %Y/Y Mar (Feb) 3.7 (3.1)
Inflation target 3.0% (+/- 1pp)
Budget bal. (ESA 2010) %GDP Q4’20 (Q3’20) -16.7(-4.3)
Budget balance trend % GDP -3.0
GDP Growth % y/y nsa Q4 (Q3) -3.5 (-4.6)
Trend GDP %y/y 2.2
Purchasing Power Parity Value Mar 364.85
Spot end-Apr 360.08
PPP Valuation EUR/HUF undervalued
Current a/c (12m. sum nsa) %GDP Q4 (Q3) 0.1 (-0.6)
Trend current account balance % GDP 1.5
Moody's Foreign Currency Rating Baa3
Outlook Positive * Current is latest month, quarter or year
Source: National Bank of Hungary, RBC Capital Markets
1. Core inflation excluding indirect taxes is close to target
2. CNB a bit more optimistic than mkt on hikes in near-term
Source: Bloomberg, CNB, RBC Capital Markets; CNB forecast extrapolated using its 3M Pribor path
Forecasts
Source: RBC Capital Markets estimates
Q1 Q2f Q3f Q4f Q1f Q2f Q3f Q4f
EUR/HUF 362.02 358.00 355.00 353.00 351.00 350.00 350.00 350.00
USD/HUF 308.63 308.62 308.70 309.65 310.62 312.50 309.73 307.02
PLN/HUF 78.14 79.56 80.32 81.15 81.63 82.35 82.35 82.35
2021 2022
-1.0
0.0
1.0
2.0
3.0
4.0
5.0
Jan-16 Jan-17 Jan-18 Jan-19 Jan-20 Jan-21
Headline CPICore inflation ex-indirect taxesDemand sensitive inflationSticky price inflationNBH's inflation target
y/y Hungary
0.00
0.20
0.40
0.60
0.80
1.00
1.20
1.40
1.60
1.80
2.00
Mar-20 Sep-20 Mar-21 Sep-21 Mar-22 Sep-22
CNB May-21
CNB Feb-21
Mkt expectations (approx using FRAs)
Projected path for CNB's policy rate: CNB's forecasts vs market
Currency Report Card
07 May 2021 20
Brazilian Real Daniel Rico
1-3 Month Outlook – fiscal reform?
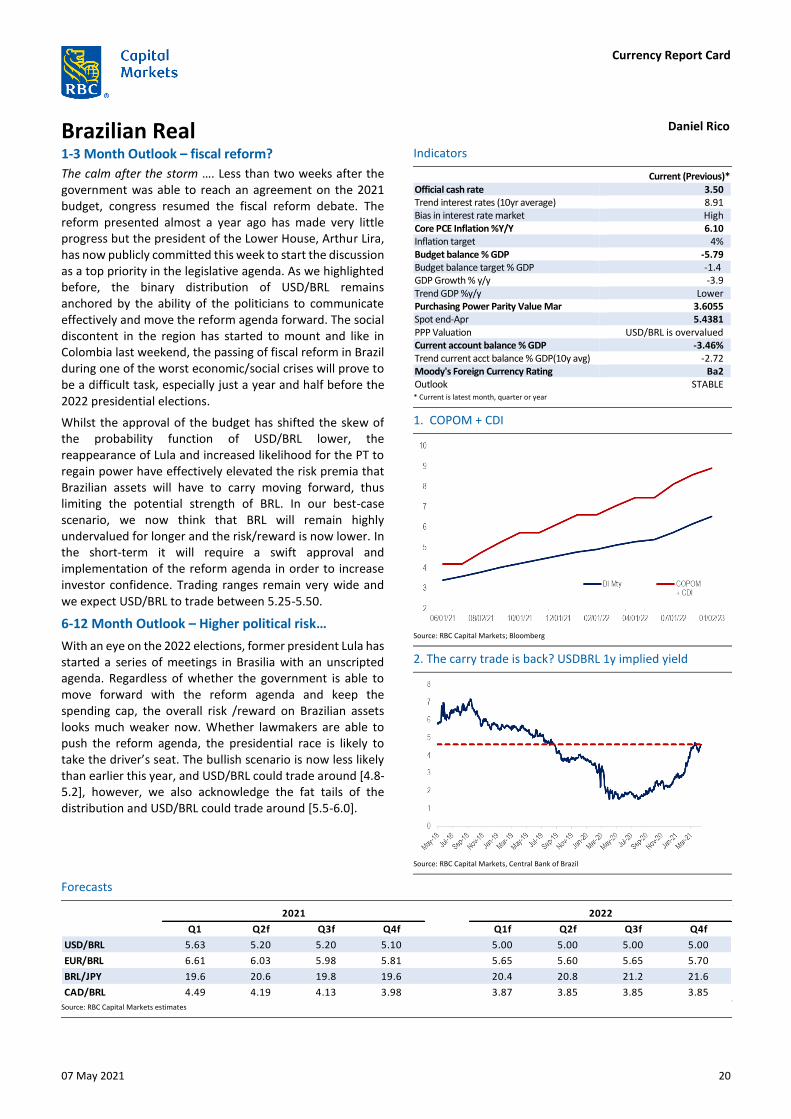
The calm after the storm …. Less than two weeks after the government was able to reach an agreement on the 2021 budget, congress resumed the fiscal reform debate. The reform presented almost a year ago has made very little progress but the president of the Lower House, Arthur Lira, has now publicly committed this week to start the discussion as a top priority in the legislative agenda. As we highlighted before, the binary distribution of USD/BRL remains anchored by the ability of the politicians to communicate effectively and move the reform agenda forward. The social discontent in the region has started to mount and like in Colombia last weekend, the passing of fiscal reform in Brazil during one of the worst economic/social crises will prove to be a difficult task, especially just a year and half before the 2022 presidential elections.
Whilst the approval of the budget has shifted the skew of the probability function of USD/BRL lower, the reappearance of Lula and increased likelihood for the PT to regain power have effectively elevated the risk premia that Brazilian assets will have to carry moving forward, thus limiting the potential strength of BRL. In our best-case scenario, we now think that BRL will remain highly undervalued for longer and the risk/reward is now lower. In the short-term it will require a swift approval and implementation of the reform agenda in order to increase investor confidence. Trading ranges remain very wide and we expect USD/BRL to trade between 5.25-5.50.
6-12 Month Outlook – Higher political risk…
With an eye on the 2022 elections, former president Lula has started a series of meetings in Brasilia with an unscripted agenda. Regardless of whether the government is able to move forward with the reform agenda and keep the spending cap, the overall risk /reward on Brazilian assets looks much weaker now. Whether lawmakers are able to push the reform agenda, the presidential race is likely to take the driver’s seat. The bullish scenario is now less likely than earlier this year, and USD/BRL could trade around [4.8-5.2], however, we also acknowledge the fat tails of the distribution and USD/BRL could trade around [5.5-6.0].
Indicators
Current (Previous)* Official cash rate 3.50 Trend interest rates (10yr average) 8.91 Bias in interest rate market High Core PCE Inflation %Y/Y 6.10 Inflation target 4% Budget balance % GDP -5.79 Budget balance target % GDP -1.4 GDP Growth % y/y -3.9 Trend GDP %y/y Lower Purchasing Power Parity Value Mar 3.6055 Spot end-Apr 5.4381 PPP Valuation USD/BRL is overvalued Current account balance % GDP -3.46% Trend current acct balance % GDP(10y avg) -2.72 Moody's Foreign Currency Rating Ba2 Outlook STABLE * Current is latest month, quarter or year
Source: RBC Capital Markets; Bloomberg
1. COPOM + CDI
2. The carry trade is back? USDBRL 1y implied yield
Source: RBC Capital Markets, Central Bank of Brazil
Forecasts
Source: RBC Capital Markets estimates
Q1 Q2f Q3f Q4f Q1f Q2f Q3f Q4f
USD/BRL 5.63 5.20 5.20 5.10 5.00 5.00 5.00 5.00
EUR/BRL 6.61 6.03 5.98 5.81 5.65 5.60 5.65 5.70
BRL/JPY 19.6 20.6 19.8 19.6 20.4 20.8 21.2 21.6
CAD/BRL 4.49 4.19 4.13 3.98 3.87 3.85 3.85 3.85
20222021
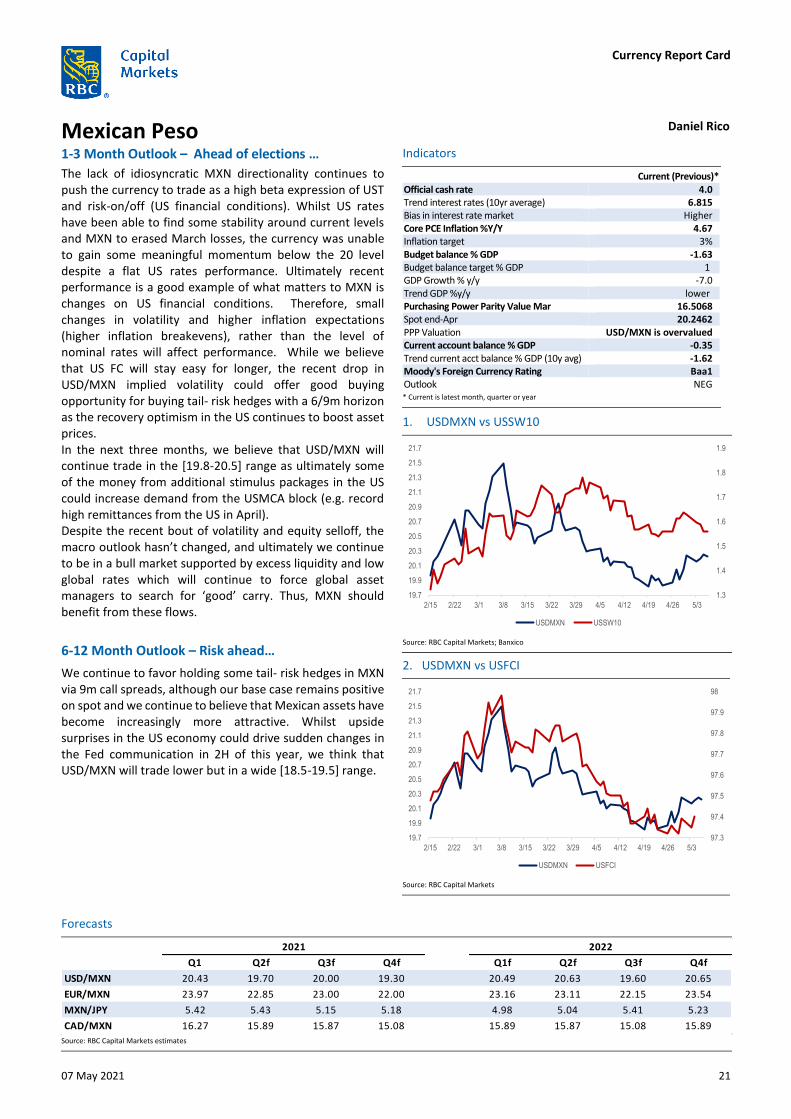
Currency Report Card
07 May 2021 21
Mexican Peso Daniel Rico
1-3 Month Outlook – Ahead of elections …
The lack of idiosyncratic MXN directionality continues to push the currency to trade as a high beta expression of UST and risk-on/off (US financial conditions). Whilst US rates have been able to find some stability around current levels and MXN to erased March losses, the currency was unable to gain some meaningful momentum below the 20 level despite a flat US rates performance. Ultimately recent performance is a good example of what matters to MXN is changes on US financial conditions. Therefore, small changes in volatility and higher inflation expectations (higher inflation breakevens), rather than the level of nominal rates will affect performance. While we believe that US FC will stay easy for longer, the recent drop in USD/MXN implied volatility could offer good buying opportunity for buying tail- risk hedges with a 6/9m horizon as the recovery optimism in the US continues to boost asset prices. In the next three months, we believe that USD/MXN will continue trade in the [19.8-20.5] range as ultimately some of the money from additional stimulus packages in the US could increase demand from the USMCA block (e.g. record high remittances from the US in April). Despite the recent bout of volatility and equity selloff, the macro outlook hasn’t changed, and ultimately we continue to be in a bull market supported by excess liquidity and low global rates which will continue to force global asset managers to search for ‘good’ carry. Thus, MXN should benefit from these flows.
6-12 Month Outlook – Risk ahead…
We continue to favor holding some tail- risk hedges in MXN via 9m call spreads, although our base case remains positive on spot and we continue to believe that Mexican assets have become increasingly more attractive. Whilst upside surprises in the US economy could drive sudden changes in the Fed communication in 2H of this year, we think that USD/MXN will trade lower but in a wide [18.5-19.5] range.
Indicators
Current (Previous)* Official cash rate 4.0 Trend interest rates (10yr average) 6.815 Bias in interest rate market Higher Core PCE Inflation %Y/Y 4.67 Inflation target 3% Budget balance % GDP -1.63 Budget balance target % GDP 1 GDP Growth % y/y -7.0 Trend GDP %y/y lower Purchasing Power Parity Value Mar 16.5068 Spot end-Apr 20.2462 PPP Valuation USD/MXN is overvalued Current account balance % GDP -0.35 Trend current acct balance % GDP (10y avg) -1.62 Moody's Foreign Currency Rating Baa1 Outlook NEG * Current is latest month, quarter or year
1. USDMXN vs USSW10
Source: RBC Capital Markets; Banxico
2. USDMXN vs USFCI
Source: RBC Capital Markets
Forecasts
Source: RBC Capital Markets estimates
1.3
1.4
1.5
1.6
1.7
1.8
1.9
19.7
19.9
20.1
20.3
20.5
20.7
20.9
21.1
21.3
21.5
21.7
2/15 2/22 3/1 3/8 3/15 3/22 3/29 4/5 4/12 4/19 4/26 5/3
USDMXN USSW10
Q1 Q2f Q3f Q4f Q1f Q2f Q3f Q4f
USD/MXN 20.43 19.70 20.00 19.30 20.49 20.63 19.60 20.65
EUR/MXN 23.97 22.85 23.00 22.00 23.16 23.11 22.15 23.54
MXN/JPY 5.42 5.43 5.15 5.18 4.98 5.04 5.41 5.23
CAD/MXN 16.27 15.89 15.87 15.08 15.89 15.87 15.08 15.89
20222021
97.3
97.4
97.5
97.6
97.7
97.8
97.9
98
19.7
19.9
20.1
20.3
20.5
20.7
20.9
21.1
21.3
21.5
21.7
2/15 2/22 3/1 3/8 3/15 3/22 3/29 4/5 4/12 4/19 4/26 5/3
USDMXN USFCI

Currency Report Card
07 May 2021 22
Chilean Peso Daniel Rico
1-3 Month Outlook – What is next…
The government demonstrated its weakness as the Supreme Court rejected its proposal for approval of the third pension fund and annuities business withdrawal. Local assets suffered in anticipation of large forced selling pressure from pension funds and liquidation of duration assets by insurance companies. The IPSA index dropped as much as 10% while BTUCL 30 have lost over 12% of value in price terms, conversely CLP is the best performing currency in the region. We can try to explain the divergence between local assets and CLP by the stellar copper performance and the recent stability of the dollar, but the real explanatory variable is just an overhanging dollar-selling flows from not only pension funds but by the government as it continues to liquidate dollars to fund the 2021 budget. The upcoming election of the constitutional assembly is the next step to write the new constitution, voted on in October 2020, a process that attempts to mitigate the large popular discontent and social protests. Now the question is what will be the faith of CLP when the pension funds and insurance companies’ flows are done? Will local assets catch-up with CLP or CLP to local assets? Given the current construct we cannot yet eliminate the possibility of a 4th withdrawal, but given the positive economic backdrop boosted by high copper prices we think that politicians will now be focused on the November presidential elections. Thus, in the short term, additional dollar selling from the pension funds could lower the trading range to [690-725] with a skew which will remain in the low end of the range.
6-12 Month Outlook – New President, No Constitution
We continue to believe that it will take several years and a strong political commitment to restore confidence in the Chilean private sector and to adjust macro-economic variables, but we also acknowledge that the global macro picture has become very supportive for CLP as expectations of China’s growth continue to drive copper prices higher. The erosion of public finances will not improve before 2024 and the high fiscal deficit is likely to persist for the next two to three years. Chile will need an undervalued currency for much longer in order to compensate for these uncertainties and higher debt levels. While our outlook looks more positive as we don’t see CLP back above 800s, we think that USD/CLP should eventually find its way above 750 level.
‘s Indicators
Current (Previous)* Official cash rate 0.5 Trend interest rates (10yr average) 3.54 Bias in interest rate market Higher Core PCE Inflation %Y/Y 2.9 Inflation target 3% Budget balance % GDP -2.86 Budget balance target % GDP - GDP Growth % y/y -9.1 Trend GDP %y/y (10y average) 2 .0 Purchasing Power Parity Value Mar 648.45 Spot end-Apr 710.45 PPP Valuation USD/CLP is overvalued Current account balance % GDP -3.73 Trend current acct balance % GDP (10y avg) -2.3 Moody's Foreign Currency Rating A1 Outlook NEG * Current is latest month, quarter or year
1. BTUCLP 2030 - YTM
Source: RBC Capital Markets
2. IPSA Index TR
Source: RBC Capital Markets
Forecasts
Source: RBC Capital Markets estimates
Q1 Q2f Q3f Q4f Q1f Q2f Q3f Q4f
USD/CLP 720 720 735 750 704 724 738 693
EUR/CLP 845 835 845 855 795 811 834 789
JPY/CLP 19.6 20.6 19.8 19.6 20.4 20.8 21.2 21.6
CAD/CLP 574 581 583 586 545 557 568 533
20222021
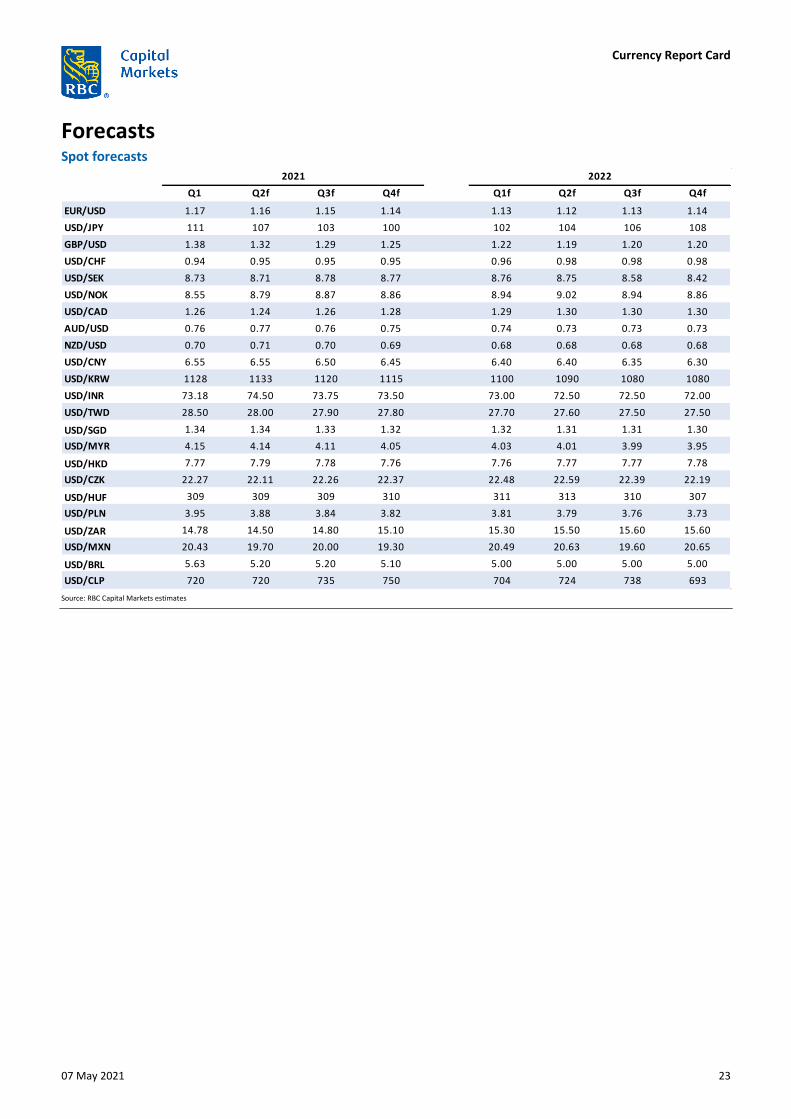
Currency Report Card
07 May 2021 23
Forecasts Spot forecasts
Source: RBC Capital Markets estimates
Q1 Q2f Q3f Q4f Q1f Q2f Q3f Q4f
EUR/USD 1.17 1.16 1.15 1.14 1.13 1.12 1.13 1.14
USD/JPY 111 107 103 100 102 104 106 108
GBP/USD 1.38 1.32 1.29 1.25 1.22 1.19 1.20 1.20
USD/CHF 0.94 0.95 0.95 0.95 0.96 0.98 0.98 0.98
USD/SEK 8.73 8.71 8.78 8.77 8.76 8.75 8.58 8.42
USD/NOK 8.55 8.79 8.87 8.86 8.94 9.02 8.94 8.86
USD/CAD 1.26 1.24 1.26 1.28 1.29 1.30 1.30 1.30
AUD/USD 0.76 0.77 0.76 0.75 0.74 0.73 0.73 0.73
NZD/USD 0.70 0.71 0.70 0.69 0.68 0.68 0.68 0.68
USD/CNY 6.55 6.55 6.50 6.45 6.40 6.40 6.35 6.30
USD/KRW 1128 1133 1120 1115 1100 1090 1080 1080
USD/INR 73.18 74.50 73.75 73.50 73.00 72.50 72.50 72.00
USD/TWD 28.50 28.00 27.90 27.80 27.70 27.60 27.50 27.50
USD/SGD 1.34 1.34 1.33 1.32 1.32 1.31 1.31 1.30
USD/MYR 4.15 4.14 4.11 4.05 4.03 4.01 3.99 3.95
USD/HKD 7.77 7.79 7.78 7.76 7.76 7.77 7.77 7.78
USD/CZK 22.27 22.11 22.26 22.37 22.48 22.59 22.39 22.19
USD/HUF 309 309 309 310 311 313 310 307
USD/PLN 3.95 3.88 3.84 3.82 3.81 3.79 3.76 3.73
USD/ZAR 14.78 14.50 14.80 15.10 15.30 15.50 15.60 15.60
USD/MXN 20.43 19.70 20.00 19.30 20.49 20.63 19.60 20.65
USD/BRL 5.63 5.20 5.20 5.10 5.00 5.00 5.00 5.00
USD/CLP 720 720 735 750 704 724 738 693
2021 2022
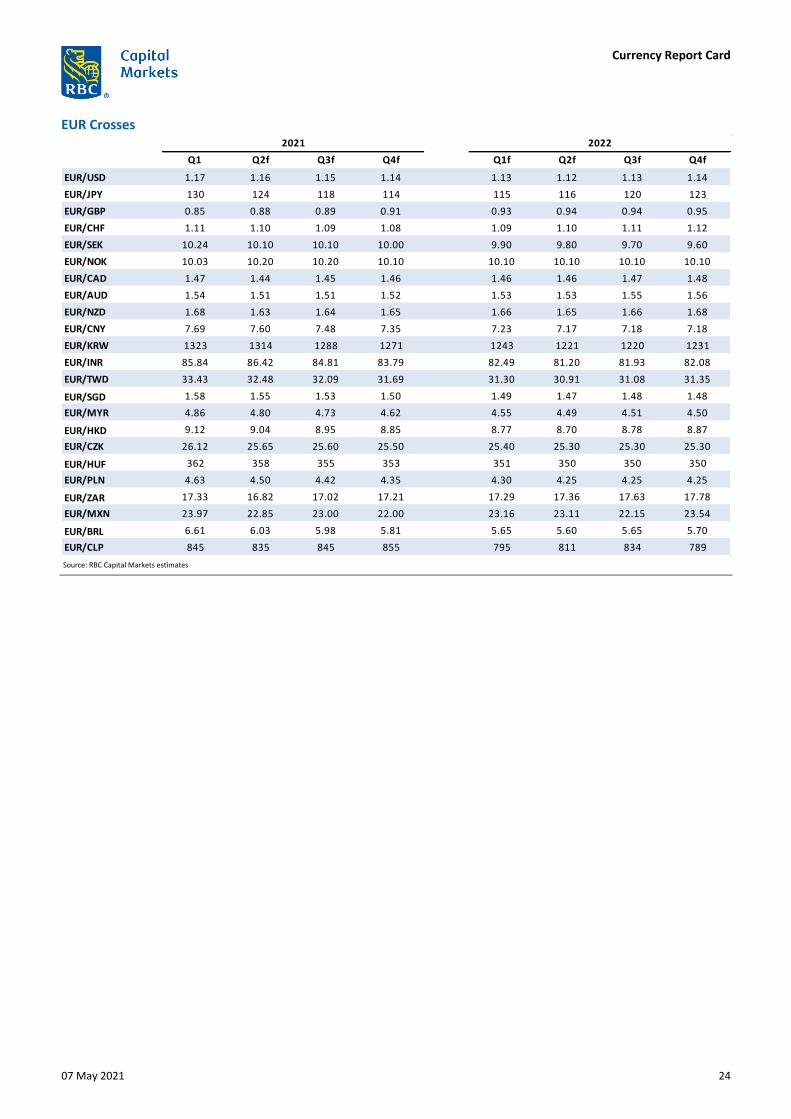
Currency Report Card
07 May 2021 24
EUR Crosses
Source: RBC Capital Markets estimates
Q1 Q2f Q3f Q4f Q1f Q2f Q3f Q4f
EUR/USD 1.17 1.16 1.15 1.14 1.13 1.12 1.13 1.14
EUR/JPY 130 124 118 114 115 116 120 123
EUR/GBP 0.85 0.88 0.89 0.91 0.93 0.94 0.94 0.95
EUR/CHF 1.11 1.10 1.09 1.08 1.09 1.10 1.11 1.12
EUR/SEK 10.24 10.10 10.10 10.00 9.90 9.80 9.70 9.60
EUR/NOK 10.03 10.20 10.20 10.10 10.10 10.10 10.10 10.10
EUR/CAD 1.47 1.44 1.45 1.46 1.46 1.46 1.47 1.48
EUR/AUD 1.54 1.51 1.51 1.52 1.53 1.53 1.55 1.56
EUR/NZD 1.68 1.63 1.64 1.65 1.66 1.65 1.66 1.68
EUR/CNY 7.69 7.60 7.48 7.35 7.23 7.17 7.18 7.18
EUR/KRW 1323 1314 1288 1271 1243 1221 1220 1231
EUR/INR 85.84 86.42 84.81 83.79 82.49 81.20 81.93 82.08
EUR/TWD 33.43 32.48 32.09 31.69 31.30 30.91 31.08 31.35
EUR/SGD 1.58 1.55 1.53 1.50 1.49 1.47 1.48 1.48
EUR/MYR 4.86 4.80 4.73 4.62 4.55 4.49 4.51 4.50
EUR/HKD 9.12 9.04 8.95 8.85 8.77 8.70 8.78 8.87
EUR/CZK 26.12 25.65 25.60 25.50 25.40 25.30 25.30 25.30
EUR/HUF 362 358 355 353 351 350 350 350
EUR/PLN 4.63 4.50 4.42 4.35 4.30 4.25 4.25 4.25
EUR/ZAR 17.33 16.82 17.02 17.21 17.29 17.36 17.63 17.78
EUR/MXN 23.97 22.85 23.00 22.00 23.16 23.11 22.15 23.54
EUR/BRL 6.61 6.03 5.98 5.81 5.65 5.60 5.65 5.70
EUR/CLP 845 835 845 855 795 811 834 789
2021 2022
Currency Report Card
07 May 2021 25
Disclaimer IMPORTANT DISCLOSURE: THIS COMMUNICATION HAS BEEN GENERATED BY AN EMPLOYEE OF RBCCM AND IS BEING CONVEYED TO YOU AS A SOLICITATION (FOR PURPOSES OF 17 CFR §§1.71(a)-(c) AND 23.605) FOR ENTERING INTO A DERIVATIVES TRANSACTION. This communication has been prepared by RBC Capital Markets (“RBCCM”) sales personnel for institutional clients and your information only and is not a research report prepared by the RBCCM Research Department. Unless otherwise specified, the views expressed herein are the author’s and may differ from the views of RBCCM’s Research Department and from the views of others within RBCCM. The information in the body of this communication is intended to provide general company and/or market commentary, is not intended to provide a sufficient basis for an investment decision and should not be considered a research report. This material may include references to recently published research notes and reports by RBCCM’s Research Department. Complete research notes and reports, including important conflicts disclosures, are available at www.rbcinsight.com. You should assume that trading desks at RBCCM or its affiliates makes markets and/or hold positions, and may have conducted underwriting or other investment banking work in any of the securities referenced herein. Information contained herein has been compiled by RBCCM from sources believed to be reliable, but no representation or warranty, express or implied, is made as to its accuracy, completeness or correctness. Every province in Canada, state in the U.S., and most countries throughout the world have their own laws regulating the types of securities and other investment products which may be offered to their residents, as well as the process for doing so. As a result, the securities discussed in this communication may not be eligible for sale in some jurisdictions. To the full extent permitted by law neither RBCCM nor any of its affiliates or any other person accepts any liability whatsoever for any direct, or indirect or consequential loss or damage arising from any use of the information contained herein. No matter contained in this communication may be reproduced or copied by any means without the prior consent of RBCCM.
RBC Capital Markets is the global brand name for the capital markets business of Royal Bank of Canada and its affiliates. United States: This communication has been approved by RBC Capital Markets, LLC (member FINRA, NYSE, SIPC), which is a U.S. registered broker-dealer and which accepts responsibility for this communication and its dissemination in the United States. Any U.S. recipient of this communication that is not a registered broker-dealer or a bank acting in a broker or dealer capacity and that wishes further information regarding, or to effect any transaction in, any of the securities discussed in this communication, should contact and place orders with RBC Capital Markets, LLC. This communication is not a research report or a product of RBCCM's Research Department. Canada: RBC Dominion Securities Inc. (member IIROC and CIPF). France: RBC Paris Branch, RBC Capital Markets (Europe) GmbH Paris Branch are regulated by the Autorité de Contrôle Prudentiel et de Résolution and the Autorité des Marchés Financiers. Germany: This publication has been approved by RBC Capital Markets (Europe) GmbH, which is a company authorized by BaFin. United Kingdom: This publication has been approved by RBC Europe Limited, which is authorized by the Prudential Regulation Authority (“PRA”) and regulated by the Financial Conduct Authority and PRA. Hong Kong: Royal Bank of Canada, Hong Kong Branch is regulated by the Hong Kong Securities and Futures Commission and the Hong Kong Monetary Authority. The document is distributed only to persons who satisfy the definition of “professional investors” as defined in the Securities and Futures Ordinance (Cap. 571 of Hong Kong) and any rules made under that Ordinance. Australia: Royal Bank of Canada, Sydney Branch (regulated by the Australian Securities & Investments Commission and the Australian Prudential Regulation Authority; AFSL 246521; ABN 86 076 940 880). This document is distributed only to persons who satisfy the definition of wholesale client for the purposes of the Corporations Act 2001 and not intended for distribution to retail clients. Japan: Securities business (as defined under the Financial Instruments and Exchange Law) in Japan will be carried out by RBC Capital Markets (Japan) Ltd. in compliance with all applicable laws and regulations. RBC Capital Markets (Japan) Ltd. is a Financial Instrument Dealer registered with the Kanto Financial Bureau (Kinsho #203) and a member of Japan Securities Dealers Association (“JSDA”) and the Financial Futures Association of Japan (“FFAJ”). Banking business (as defined under the Banking Law) in Japan will be carried out by Royal Bank of Canada, Tokyo Branch in compliance with applicable laws and regulations. Singapore: Royal Bank of Canada, Singapore Branch (regulated by the Monetary Authority of Singapore). The document is distributed only to persons who satisfy the definition of institutional investors as defined in the Securities and Futures Act (Chapter 289 of Singapore).
For non-institutional investors in the U.S., Canada, nothing in this report constitutes legal, accounting or tax advice or individually tailored investment advice. This material is prepared for general circulation to clients and has been prepared without regard to the individual financial circumstances and objectives of persons who receive it. Past performance is not a guide to future performance, future returns are not guaranteed, and a loss of original capital may occur. Interest rates, market conditions, special offers, tax ruling and other investment factors are subject to change. You are advised to seek independent advice from your financial adviser before purchasing any product or if you are in doubt about any of the contents of this document. If you do not obtain independent advice, you should consider whether the product is suitable for you.
To persons receiving this from RBC Wealth Management Asia: This document has been prepared by RBC Capital Markets. It is made available to you by Royal Bank of Canada, Singapore Branch in Singapore, Royal Bank of Canada, Hong Kong Branch in Hong Kong and/or RBC Investment Services (Asia) Limited in Hong Kong (“RBC Wealth Management Asia”). This is not a research report and commentary contained herein should not be considered to be research. This material is not for distribution in Singapore to investors who are not “accredited investors”, as defined in the Securities and Futures Act (Cap. 289) of Singapore and in Hong Kong, to investors who are not “professional investors”, as defined in the Securities and Futures Ordinance (Cap. 571 of Hong Kong) and any rules made under that Ordinance. This material has been prepared for general circulation and does not take into account the objectives, financial situation, or needs of any recipient. The information and opinions contained in this document has been obtained from sources believed to be reliable and neither RBC Wealth Management Asia nor its related companies or affiliates (collectively, “RBC”) make any representation or warranty as to its adequacy, completeness, accuracy or timeliness for any particular purpose. You are advised to seek independent advice from a financial adviser before purchasing any product. Any past performance, projection, forecast or simulation of results is not necessarily indicative of the future or likely performance of any investment. RBC accepts no liability whatsoever for any direct, indirect or consequential losses or damages arising from or in connection with the use or reliance of this material or its contents. The information herein is not intended for distribution to, or use by, any person or entity in any jurisdiction or country where such distribution or use would be contrary to law or regulation. If you are in doubt about any of the contents of this document, you should obtain independent professional advice.
This content relies on tracking technologies to monitor, understand and improve our electronic communication and your online experience, to customize marketing, and to track your usage of RBC content, websites and services. Tracking technology may identify when you visit specific RBC content and may be shared with third parties involved in customizing RBC marketing on RBC or digital channels. RBC does not sell your information to third parties, nor do we track your interaction with a third party website. For more information, see our privacy policy at http://www.rbc.com/privacysecurity/ca/index.html.
® Registered trademark of Royal Bank of Canada. Used under license. © 2021. All rights reserved.


![One World, One Currency Thomas Cook India Launches 'One Currency' Card [Company Update]](https://static.fdocuments.us/doc/165x107/577ca7191a28abea748c31e6/one-world-one-currency-thomas-cook-india-launches-one-currency-card.jpg)