Currency management: Considerations for the … management: Considerations for the equity ......
22
Vanguard research September 2010 Currency management: Considerations for the equity hedging decision Author Karin Peterson LaBarge, Ph.D., CFP ® Executive summary. When investors buy global equities, they also acquire exposure to foreign currency and should decide whether and how to manage that exposure. Many real-world factors—including risk tolerance, costs, time horizon, and investor expertise—play a role in the currency hedging decision. Before choosing a currency-management strategy, it is very important for investors to define their primary objective—risk management or return enhancement— and then remain consistent with that objective throughout the design, implementation, and evaluation phases. Implementing a “risk-management” strategy, but then evaluating it by its return impact, is a self-defeating approach. This paper uses familiar portfolio evaluation concepts to help investors consider the currency-management decision. When an investor’s primary motivation is risk management of a global-equity portfolio, applying portfolio theory implies Connect with Vanguard > vanguard.com > global.vanguard.com (non-U.S. investors)
Transcript of Currency management: Considerations for the … management: Considerations for the equity ......

Vanguard research September 2010
Currency management: Considerations for the equity hedging decision
AuthorKarin Peterson LaBarge, Ph.D., CFP®
Executive summary. When investors buy global equities, they also acquire exposure to foreign currency and should decide whether and how to manage that exposure. Many real-world factors—including risk tolerance, costs, time horizon, and investor expertise—play a role in the currency hedging decision. Before choosing a currency-management strategy, it is very important for investors to define their primary objective—risk management or return enhancement—and then remain consistent with that objective throughout the design, implementation, and evaluation phases. Implementing a “risk-management” strategy, but then evaluating it by its return impact, is a self-defeating approach.
This paper uses familiar portfolio evaluation concepts to help investors consider the currency-management decision. When an investor’s primary motivation is risk management of a global-equity portfolio, applying portfolio theory implies
Connect with Vanguard > vanguard.com> global.vanguard.com (non-U.S. investors)

Amid the ever-increasing integration of economies and financial markets around the world, many investors now own a global basket of assets (Philips, 2009). But, in addition to the potential diversification benefits from inter-national investing, asset portfolios also acquire an exposure to foreign currency. This exposure presents opportunities for increased return as well as the potential for added volatility.
This paper focuses on the considerations in the currency-management decision for investors whose primary objective is to reduce the risk of a global-equity portfolio. After briefly discussing some real-world factors that investors should consider in the currency decision, we review the theory behind the currency-risk-management framework and highlight
the importance of the equity–currency correlation. We then describe the data and methodology used to evaluate the theory and present the empirical results for unhedged and hedged portfolios represented by Morgan Stanley Capital International (MSCI) World indexes.
We also compare the risk-management results of applying a simple tactical hedging strategy with those of the fully hedged portfolio. Finally, given that the first-order consideration for many investors implementing a currency hedge program is whether or not the hedge had a positive or negative impact on returns, we examine risk-adjusted returns (i.e. information ratios) for the fully hedged portfolios.
2
adjusting the currency exposure based on the sign and strength of the equity–currency correlation. To minimize portfolio risk, the currency-management prescription is to maintain, or obtain, exposure to currencies that have negative correlations with equities and to avoid, or minimize, exposure to positively correlated currencies.
However, when we evaluated five major currencies, we found that, counter intuitively, currency hedging of a global equity portfolio provided only modest risk-reduction benefits. In fact, for an Australian-dollar-based investor, an unhedged equity portfolio had lower risk than that of a fully hedged portfolio. Thus, if the costs of a currency-management program are nontrivial, any positive benefits will very likely be negated. Further, given the high volatility in the data, hedging of foreign-currency exposure did not produce any statistically significant value-added from a risk-adjusted-return standpoint.
Notes on risk: All investments are subject to risk. Foreign investing involves additional risks including currency fluctuations and political uncertainty. Stocks of companies in emerging markets are generally more risky than stocks of companies in developed countries. Diversification does not ensure a profit or protect against a loss in a declining market. Past performance is not a guarantee of future returns. The performance of an index is not an exact representation of any particular investment, as you cannot invest directly in an index.

1 Currency-management costs include transaction costs as well as monitoring costs. Market participants do not agree on the significance of these costs. “Those who favor currency hedging believe that it lowers portfolio risk and that the cost of hedging is inconsequential. Those who oppose currency hedging believe that it does not reduce risk sufficiently to justify its cost” (Kritzman, 1993).
2 Many investors express an interest in currency management after a period of domestic currency appreciation. A weak domestic currency generally has a positive impact on an unhedged portfolio’s return. By contrast, a strong domestic currency, such as the Australian dollar in much of the last decade, has the opposite effect since it means fewer Australian dollars in exchange for the weaker foreign currency.
3
Approaching the currency- management decision
Global investors—regardless of their home country—must make several important decisions regarding currency management. Some of the important factors for investors to consider include: personal time horizon and risk tolerance; currency hedging costs;1 level of expertise in forecasting both the direction of currency movements and the currencies’ interrelationships with other assets;2 and the ability to efficiently implement the desired currency strategy. See the accompanying box on “Real-world considerations for the currency-management decision,” on page 4, for more discussion.
The primary consideration influencing the currency-management decision is the investor’s objective regarding any acquired currency exposure: Some investors strive to maximize return, while others look to minimize risk. Return-maximizing currency strategies, often known as alpha-generation strategies, may be pursued in concert with the underlying asset portfolio or as a separate, currency-only strategy. (Alpha represents a portfolio’s, or strategy’s, risk-adjusted excess return.) By contrast, risk-management strategies are typically undertaken to manage the risk inherent in an internationally diversified asset portfolio. These strategies may seek to lower overall portfolio volatility or to protect the portfolio against a fall in value. See the accompanying box on “Currency-management approaches,” on pages 5 and 6, for more discussion.
Whether the goal is return enhancement or risk management, investors should be clear and consistent in their currency-management motives so that their techniques and assessment of results do not change midstream. Statman (2005) stated “Currency hedges are advocated for the reduction of risk, yet they are often used for the enhancement of returns.” Implementing a “risk-management” strategy, but then evaluating it by its return impact, is a self-defeating approach.
Given the myriad challenges involved in the attempt to forecast exchange rates (Wang, 2008; Davis, Aliaga-Díaz, and Thomas, 2010), the main focus of this paper is on risk management—rather than return enhancement—for a portfolio of inter-national equities. Although much risk-management research has focused on managing the currency exposure in equity portfolios, some work has also investigated risk management for fixed income portfolios. Solnik (1991) found that currency risk “is a significant part of the total risk of a foreign bond portfolio but only a small part of the total risk of a stock portfolio.” Campbell, Serfaty-de Medeiros, and Viceira (2007) reported generally “weak” correlations of currency and global bond returns as well as a negative bond-currency correlation for the U.S. dollar. They concluded that, consistent with common institutional practice, “international bond investors should fully hedge the currency exposure implicit in their bond portfolios.”

4
Real-world considerations for the currency-management decision
Currency-management strategies typically involve the use of forward contracts on foreign currencies, a bilateral transaction in which the seller agrees to deliver a pre-specified amount of foreign currency to the buyer at some future time. Since the terms of forward contracts are not standardized, they are traded in the privately negotiated over-the-counter market rather than on an organized exchange. Forward contracts belong to the class of financial instruments known as derivatives because their value is determined by (derived from) the value of the underlying asset, in this case the foreign currency.
When selecting a currency-management strategy, several important factors need to be considered.
International allocation. If foreign securities represent only a relatively small percentage of the investor’s total portfolio—for example, about 10% to 15% (Senior, 2010)—then the benefit from undertaking a currency program may be outweighed by the costs.
Costs. Management and transaction costs for static hedging (where the hedge ratio is constant over time) depend on the approach taken, but “almost any dynamic strategy [where the hedge ratio changes over time] entails higher transaction costs than static hedging” (Lundin, 1997: 19). The costs of the hedge may include compensating currency dealers for facilitating hedging transactions, paying custodian banks for recordkeeping, and paying investment managers for maintaining the hedge. “Transaction costs have a threshold
effect—the greater the portfolio value at risk, the more investors are willing to pay for complicated strategies” (Lundin, 1997: 19). The potential drag on portfolio returns depends on the frequency of rebalancing the hedge back to the desired hedge ratio and the bid-asked spread of the currency; estimates range from 4 to 6 basis points on the low end to as high as 20 basis points.
Currency liquidity. Unlike the euro, Japanese yen, and other major developed-market currencies, some currencies—such as those of emerging markets—have lower trading volumes and may be more difficult to hedge, especially during times of financial turmoil.
Counterparty risk. Because currency forward contracts are negotiated between buyer and seller, the counterparty’s creditworthiness and ability to fulfill the agreement are very important. To mitigate counterparty risk, these over-the-counter derivative transactions may be collateralized, mainly with cash and government securities.
Settlement risk. One element of counterparty risk is settlement risk. This refers to “the risk of default by any of the parties involved in a transaction, when the other parties have already made their payments or delivered securities” in accordance with the contract. Two well-known examples of settlement risk, which resulted in sizable losses for the counterparties, are the closings of Barings in 1995 and the Bank of Credit and Commerce International in 1991 (EconomyWatch, 2010).

3 Here, the term “speculative” refers to taking currency positions—typically using currency forward contracts—without a corresponding foreign equity position.
5
Currency-management approaches
Once an investor decides to manage currency exposure, there are several aspects to consider. The resulting currency strategy will be a combination of features that is appropriate for the investor. For example, an investor may have a risk-management goal and choose to implement the currency management using a set hedge ratio—the amount of foreign currency exposure to be hedged back to the investor’s domestic currency—after the underlying asset portfolio is in place. Or the investor may view currencies as a source of alpha generation and actively vary the currency exposures over time in response to changing forecasts of exchange-rate fundamentals.
Here are three key questions investors need to ask themselves.
Primary objective: Risk management or return enhancement?
Risk management and hedging. This paper uses the term hedging to mean a risk-management technique that reduces foreign-currency exposure to lower the portfolio’s risk from currency fluctuations. (Also see Figure 1 on page 8.) Proponents of hedging often argue that currency exposure is a source of uncompensated risk (Perold and Schulman, 1988; Senior, 2010) that should be mitigated. However, some define hedging to mean an active strategy that is used to protect the portfolio’s downside from losses due to the foreign currency’s depreciation (O’Sullivan, 2010). This latter approach often views the currency exposure and its return in isolation from the underlying asset.
The term hedging usually implies canceling out an implicit long currency position but does not allow for short currency positions. Therefore, in order to allow for both long and short currency positions, the discussion may be instead framed in terms of currency demand (Campbell et al., 2007). Speculative demand, as they defined it, results from “positive expected excess returns on foreign currency over the minimum-variance portfolio,” while risk-management demand stems from “covariances of foreign currency with other assets that investors may wish to hold.”3
Return enhancement/alpha investing. The goal of these strategies is to generate incremental positive returns by anticipating changes in the relative value of currencies. The investor or manager may take both short and long currency positions, and the portfolio need not have any allocations to nondomestic equities or bonds. Leverage is often used in these approaches (Martini, 2007).
As with any investment strategy, evaluation of the currency-management program is important and must be consistent with the investor’s primary objective—whether that be risk management or return enhancement. As Statman (2005) has stressed, having a stated goal of risk reduction for the overall portfolio but evaluating the results using the currency position’s realized return is a mismatched evaluation policy.

6
Static or dynamic exposure?
Investors may choose a static currency exposure or one that is dynamically managed. Underlying this decision is the investor’s belief about whether currency movements can be reliably forecasted or if they follow a random walk.
Passive/strategic. This strategy involves establishing a static hedge ratio and infrequently rolling the hedge. Monthly rebalancing of the hedge, to adjust for market movements and/or to roll the hedge to the next contract month, is common.
Active/tactical. Proponents of tactical asset allocation models argue that the optimal levels of currency exposures vary over time and that use of exchange-rate fundamentals yields better results than mechanistic rules. The models may consider variables—such as interest rate levels, interest rate differentials, term spreads, relative current-account-to-GDP (gross domestic product) ratios, and momentum—to predict the best currency policy (Solnik, 1997; Martini, 2007). Increased return, rather than risk management, is typically the primary goal of these dynamic strategies.
Separate or integrated strategy?
As described in Solnik (1997), investors can approach currency management as a separate decision or they can integrate currency manage-ment into the overall asset allocation process.
Separate currency overlay. There are two basic ways to separately manage the currency exposure that arises from holding a portfolio of international securities: partial optimization and separate optimization. In “partial optimization,” the currency overlay is the second step in the asset management process, after determining the asset allocation for the portfolio. In “separate optimization,” the currency overlay is a stand-alone mandate, and neither the overlay manager nor the asset manager has knowledge of the other’s activities. The overlay manager may or may not be given discretion in deciding the optimal currency weights.
Integrated approach. Jorion (1994) found that separating the currency and asset allocation decisions is suboptimal and that a process known as “joint optimization” is the better approach from a risk–return perspective. In this process, the optimal weights of both the securities and the currencies are determined simultaneously.
Risk-management framework: The theory
When investors buy an asset from a foreign country, they also acquire exposure to that country’s currency. These two positions may be analyzed in a risk–return portfolio context, using familiar portfolio evaluation concepts. In a basic two-security context, average portfolio returns are a simple weighted average of the two security returns, but, as a rule, portfolio volatility is not a simple average of the standard deviations of the returns of the two underlying securities: Portfolio volatility contains a third term to capture the co-movement, or correlation, between
the two securities’ returns. From Markowitz (1952), we have the familiar formula for the variance of a portfolio comprising two assets:
�p2 = w1
2�12 + w2
2�22 + 2 w1 w2 �1,2 �1 �2, (1)
where
σ = the standard deviation of returns for the portfolio p, and for security 1 or 2;
w = the percentage weighting allocated to security 1 or 2; and
ρ1,2 = the correlation between the returns for securities 1 and 2.

Similarly, asset and currency volatilities are not additive (Solnik, 1997; Perold and Schulman, 1988).4 Currency exposure introduces its own volatility to the portfolio but also offers risk-reduction potential through the co-movement, or correlation, between the asset returns and currency movements;5 this effect is captured in the third term of the portfolio volatility formula. Consequently, as correlation falls, the third co-movement term becomes smaller and portfolio volatility decreases. If stock returns and currency movements are negatively correlated, the foreign currency tends to appreciate when the foreign stock market falls. It is the net effect of the two influences that determines whether total portfolio risk is increased or decreased by hedging the foreign currency exposure (Kritzman, 1993).
Modifying Markowitz’s formula to measure the volatility of the unhedged portfolio comprising the foreign asset s and foreign currency exposure f we have:
�p2 = �s
2 + �f2 + 2 �s,f �s �f . (2)
Note that, in equation 2 for the initial unhedged portfolio, the asset weight ws and the accompanying currency exposure wf are both 100%, or 1.
Consequently, portfolio variance is highest when the correlation coefficient is +1. As correlation falls, the third co-movement term becomes smaller, and portfolio volatility decreases. Thus, there is a potential diversification benefit from decreasing exposure, via hedging, to currencies with positive correlations and from holding or acquiring exposure to currencies with low or negative correlations.
Substituting various possible values for the equity–currency correlation, ρs,f , yields this risk-management prescription (Campbell et al., 2007; Solnik, 1997):
currency correlation is perfectly inverse (i.e., ρs,f = –1).6
foreign and domestic7 d currency, when ρs,f is negative.
currency, removing all foreign-currency exposure, when ρs,f is zero (theoretically eliminating currency risk).
currency, when ρs,f is positive.
Note that an unhedged portfolio equates to a 100% exposure in the foreign currency, and a fully hedged portfolio means no exposure to the foreign currency.
4 The exception to this rule occurs when �1,2 = +1 (perfect positive correlation). Substituting +1 for the correlation coefficient into equation 1 and simplifying yields �p = w1�1 + w2�2. When �1,2 = –1 (perfect inverse correlation), �p = w1�1 – w2�2, and the portfolio’s risk equals the weighted volatility of the first asset minus that of the second asset.
5 We use the terms exchange-rate change or currency movement instead of currency return in this paper because the term currency return has two major components: the exchange-rate change and the interest-rate differential. The change in the exchange rate reflects the appreciation or depreciation in the value of the foreign currency over the investment period. But as Martini (2007) explains, “when you invest in a currency, you sell one currency in order to buy another. In doing so, you give up the interest rate on the currency that you sold and receive the interest rate on the currency that you bought.” In our analysis, we calculate the currency movement as the month-to-month percentage change in exchange rates, with no adjustment for any interest-rate differentials. Please see the next subsection, “Asset and foreign exchange data sources,” for further detail.
6 Of course, perfect correlations—that is, when the correlation between two assets is a perfect +1 or a perfect –1—are very rarely achieved in practice. Perfect correlation means that the two variables move in exact lockstep, and that a perfect hedge is feasible. Instead, most hedges are probabilistic, which results in risk reduction but not elimination (Statman, 2005).
7 We use the term domestic, as opposed to local—used by some authors—to indicate the investor’s base or home currency. We reserve local for the MSCI World Price Index in local currency, which essentially measures the return of each component security in its own domestic currency, thus removing currency returns from that of the index. For further discussion, please refer to the next subsection entitled “Asset and foreign exchange data sources.”
7

8
Figure 1 illustrates this risk-management prescription. Panel A of the figure shows the relationship between various hedging strategies and the foreign-currency allocation. Panel B shows the associated equity–currency correlations that minimize portfolio volatility.
As shown in Figure 1, within a risk-management framework, portfolio theory implies adjustment of the currency exposure based on the sign and strength of the expected equity–currency correlation. Note that as ρs,f increases, the optimal weight in the foreign currency falls implying that the optimal weight in the investor’s domestic currency rises. Therefore, to minimize portfolio risk, the currency-management prescription is to keep (or obtain) exposure to negatively correlated currencies and avoid (or minimize) exposure to positively correlated currencies (Campbell et al., 2007).
The currency risk-management prescription can also be applied from the perspective of the investor’s domestic currency, rather than the foreign-currency perspective. When we compute correlations between local equity returns and domestic (home) currency movements, our expectations are:
foreign-currency exposure, should be less volatile than the fully hedged portfolio when the correlation of the investor’s domestic currency with local equity returns is strongly positive.
domestic-currency exposure, should be less volatile than the unhedged portfolio when the correlation of the investor’s domestic currency with local equity returns is near zero or negative.
In the following sections, we test these theoretical relationships.
Prescription for portfolio risk minimization
Panel A. Foreign-currency allocations versus various hedging strategies:
Figure 1.
Overhedged (short)
ρs,f = correlation between local equity return and percentage change in foreign currency; ws = weight in underlying foreign asset; and wf = foreign currency weight.
Notes: “Local equity return” is the return of a security in its own domestic currency—for example, the return of a Japanese company’s stock in Japanese yen. “Percentage change in foreign currency” represents the change in the foreign currency’s exchange rate versus the investor’s domestic currency—for example, for an investor based in Britain, the increase or decrease in value of the yen versus the British pound sterling. “Foreign currency” is a currency outside the investor’s home country—for example, for the British investor who holds a Japanese stock, the yen is the foreign currency.
Sources: Campbell et al., 2007; Solnik, 1997.
Full hedge
Partial hedge
0 < wf < 1
Initial unhedged portfolio
wf = –1 (=–ws) wf = 0 wf = 1 = ws
Panel B. Given the foreign-currency allocation above, portfolio volatility is minimized when:
ρs,f = +1 ρs,f = 0 ρs,f = –1
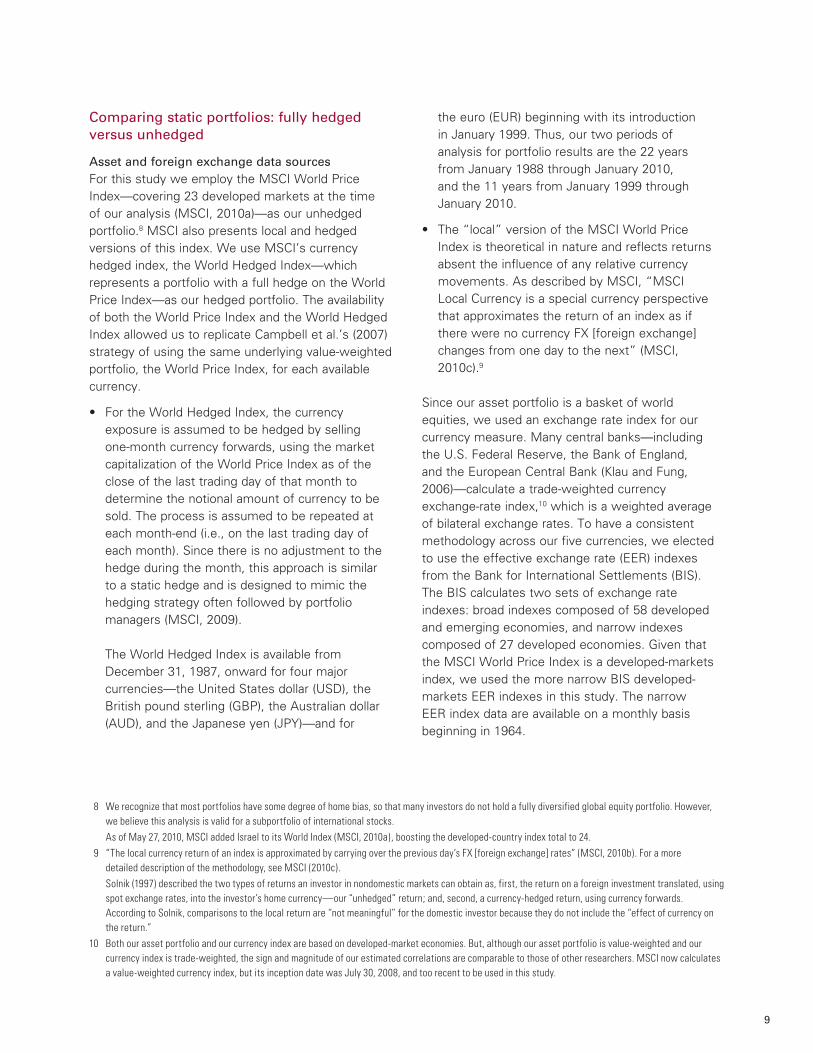
Comparing static portfolios: fully hedged versus unhedged
Asset and foreign exchange data sourcesFor this study we employ the MSCI World Price Index—covering 23 developed markets at the time of our analysis (MSCI, 2010a)—as our unhedged portfolio.8 MSCI also presents local and hedged versions of this index. We use MSCI’s currency hedged index, the World Hedged Index—which represents a portfolio with a full hedge on the World Price Index—as our hedged portfolio. The availability of both the World Price Index and the World Hedged Index allowed us to replicate Campbell et al.’s (2007) strategy of using the same underlying value-weighted portfolio, the World Price Index, for each available currency.
exposure is assumed to be hedged by selling one-month currency forwards, using the market capitalization of the World Price Index as of the close of the last trading day of that month to determine the notional amount of currency to be sold. The process is assumed to be repeated at each month-end (i.e., on the last trading day of each month). Since there is no adjustment to the hedge during the month, this approach is similar to a static hedge and is designed to mimic the hedging strategy often followed by portfolio managers (MSCI, 2009).
The World Hedged Index is available from December 31, 1987, onward for four major currencies—the United States dollar (USD), the British pound sterling (GBP), the Australian dollar (AUD), and the Japanese yen (JPY)—and for
the euro (EUR) beginning with its introduction in January 1999. Thus, our two periods of analysis for portfolio results are the 22 years from January 1988 through January 2010, and the 11 years from January 1999 through January 2010.
Index is theoretical in nature and reflects returns absent the influence of any relative currency movements. As described by MSCI, “MSCI Local Currency is a special currency perspective that approximates the return of an index as if there were no currency FX [foreign exchange] changes from one day to the next” (MSCI, 2010c).9
Since our asset portfolio is a basket of world equities, we used an exchange rate index for our currency measure. Many central banks—including the U.S. Federal Reserve, the Bank of England, and the European Central Bank (Klau and Fung, 2006)—calculate a trade-weighted currency exchange-rate index,10 which is a weighted average of bilateral exchange rates. To have a consistent methodology across our five currencies, we elected to use the effective exchange rate (EER) indexes from the Bank for International Settlements (BIS). The BIS calculates two sets of exchange rate indexes: broad indexes composed of 58 developed and emerging economies, and narrow indexes composed of 27 developed economies. Given that the MSCI World Price Index is a developed-markets index, we used the more narrow BIS developed-markets EER indexes in this study. The narrow EER index data are available on a monthly basis beginning in 1964.
8 We recognize that most portfolios have some degree of home bias, so that many investors do not hold a fully diversified global equity portfolio. However, we believe this analysis is valid for a subportfolio of international stocks.
As of May 27, 2010, MSCI added Israel to its World Index (MSCI, 2010a), boosting the developed-country index total to 24. 9 “The local currency return of an index is approximated by carrying over the previous day’s FX [foreign exchange] rates” (MSCI, 2010b). For a more
detailed description of the methodology, see MSCI (2010c). Solnik (1997) described the two types of returns an investor in nondomestic markets can obtain as, first, the return on a foreign investment translated, using
spot exchange rates, into the investor’s home currency—our “unhedged” return; and, second, a currency-hedged return, using currency forwards. According to Solnik, comparisons to the local return are “not meaningful” for the domestic investor because they do not include the “effect of currency on the return.”
10 Both our asset portfolio and our currency index are based on developed-market economies. But, although our asset portfolio is value-weighted and our currency index is trade-weighted, the sign and magnitude of our estimated correlations are comparable to those of other researchers. MSCI now calculates a value-weighted currency index, but its inception date was July 30, 2008, and too recent to be used in this study.
9

Empirical results We calculated the estimated equity–currency correlations using monthly returns for the MSCI World Price Index in local currency versus the BIS EER index for each of the five currencies we evaluated, for three time periods—including a longer time period beginning in 1973. As shown in Figure 2, in all three periods the estimated equity–currency correlations were near zero or negative for the U.S. dollar, Japanese yen, British pound sterling, and euro, but the correlation was positive for the Australian dollar.11 These findings are consistent with those of Campbell et al.’s 1975–2005 study, with one exception: The equity-currency correlation for the euro was strongly negative.
Figure 3 presents annual volatility measures for the unhedged and hedged MSCI World Price Index, the percentage risk impact of fully hedging the currency exposures, and the equity–currency correlations. Consistent with the risk-management prescription, fully hedging foreign-currency exposure reduced portfolio volatility for all but the Australian dollar. Risk-minimizing AUD investors would prefer to remain unhedged and hold foreign currency because the Australian dollar has tended to move in the same direction as world equity markets; “thus any foreign currency serves as a hedge against fluctuations in these stock markets” (Campbell et al., 2007: 18).12 In addition, Perold and Schulman (1988) found that, for U.S. investors, fully hedging the currency exposure implicit in internationally diversified equity and bond portfolios results in significant risk reduction.
11 Unlike many other developed economies, Australia did not move to a floating exchange rate immediately after the collapse of the Bretton Woods system in 1971. During the 1971–1983 period, Australia’s currency gradually moved from a fixed exchange rate pegged to the U.S. dollar to a managed floating rate, linked to a trade-weighted currency basket, and finally in 1983 to an independently floating rate. Thus, for the 1973–2010 period, the equity–currency correlation for the AUD was likely affected by this gradual loosening of foreign-exchange controls. See Battellino and Plumb (2009) and McCauley (2006) for further discussion on this process.
12 Shead (2008) attributes this linkage: “Given the sizeable contribution commodities make to Australia’s economy, a bullish view of [global] growth that is reflected in equity market appreciation is also reflected in an appreciating AUD.”
10
Currency
British U.S. pound Australian Japanese dollar sterling dollar Euro yen (USD) (GBP) (AUD) (EUR) (JPY)
January 1973–January 2010 –0.13 0.03 0.09 NA –0.03
January 1988–January 2010 –0.12 0.10 0.25 NA –0.13
January 1999–January 2010 –0.20 0.09 0.40 0.09 –0.32
Notes: Correlations between local equity index returns and the percentage change in the foreign exchange indexes were calculated using the MSCI World Price Index (local) and Bank for International Settlements Effective Exchange Rate Indices (narrow), with month-end data from January 1973 through January 2010.
Sources: Vanguard calculations, using data from Datastream, MSCI, and Bank for International Settlements.
Estimated equity–currency correlationsFigure 2.

11
Portfolio volatility, risk impact, and equity–currency correlations
Using month-end data from January 1999–January 2010
Figure 3.
–50
–40
–30
–20
–10
0
10
20
30
40
50%
17.0% 15.9%
–6.7%–0.20
16.9% 16.0%
–5.0%
0.09
13.1%16.3%
24.8%0.40
16.8% 16.1%
0.09
–4.3%
USD GBP AUD EUR
19.6%15.8%
–19.3%–0.32
JPY
Notes: Annualized geometric standard deviations of equity index returns and the associated risk impact of hedging (represented by the left axis), as well as equity–currency correlations (represented by the right axis), were calculated using the MSCI World Price Index (local), the MSCI World Price Index, the MSCI World Hedged Index, and Bank for International Settlements Effective Exchange Rate Indices (narrow), with month-end data from January 1999–January 2010.
Sources: Vanguard calculations, using data from Datastream, MSCI, and Bank for International Settlements.
Unhedged portfolio standard deviation Hedged portfolio standard deviation
Port
folio
vol
atili
ty a
ndas
soci
ated
ris
k im
pact
(%)
Equity–currency correlations
Percentage risk impact
Correlation (BIS Effective Exchange Rate Index, local MSCI World Price Index)
–1.0
–0.8
–0.6
–0.4
–0.2
0
0.2
0.4
0.6
0.8
1.0
Because many factors affect spot and forward exchange rates and equity prices, any estimations of equity–currency correlations are not static. Therefore, Figure 4, on page 12, presents the relationship between equity–currency correlations and percentage-risk-impact data for the AUD on a 12-month rolling basis. (For similar graphs for the other four currencies, please see Figure A1 in the Appendix.)
As shown in Figure 5, on page 12, for all five currencies there was a positive relationship—although not a perfect correlation—between the percentage risk impact of a fully hedged portfolio and the estimated equity–currency correlation.
Evaluating a tactical hedging strategy: methodology and results
As we have seen, the correlation between currency movements and local equity market returns plays a major role in determining the risk-reduction potential of a currency hedge. The previous section compared the results for the fully hedged and unhedged versions of the MSCI World Price Index. Here, we extend the analysis to consider a tactical hedging strategy and whether there is an optimal hedge ratio—often defined as the amount of foreign-currency exposure to be hedged back to the investor’s domestic currency.

Correlation is one of the essential building blocks of the hedge ratio. Because estimated equity–currency correlations may change dramatically over time, both reversing sign and changing magnitude, by inference the implied currency exposures derived from these correlation estimates also will change over time.
Therefore, we use these correlation estimates to test a simple tactical hedging strategy and compare the risk-minimization results to that of the unhedged portfolio, represented by the MSCI World Price Index. See the accompanying box on “Is there an optimal hedge ratio?” for more discussion.
12
Currency
USD GBP AUD EUR JPY
January 1988–January 2010 0.48 0.39 0.57 NA 0.44
January 1999–January 2010 0.84 0.61 0.75 0.50 0.43
Notes: Correlations over the two time periods were calculated using the MSCI World Price Index (local), the MSCI World Price Index, the MSCI World Hedged Index, and Bank for International Settlements Effective Exchange Rate Indices (narrow), with month-end data from January 1988–January 2010 and January 1999–January 2010, respectively.
Sources: Vanguard calculations, using data from Datastream, MSCI, and Bank for International Settlements.
Estimated correlations: Risk impact with equity–currency correlationFigure 5.
Ris
k im
pact
(%)
Notes: Rolling 12-month calculations using the MSCI World Price Index (local), the MSCI World Price Index, the MSCI World Hedged Index, and Bank for International Settlements Effective Exchange Rate Indices (narrow), with month-end data from February 1988–January 2010.
Sources: Vanguard calculations, using data from Datastream, MSCI, and Bank for International Settlements.
AUD percentage risk impact AUD equity–currency correlation
Equity–currency correlations and risk impacts: Full hedge of Australian dollar (AUD)Figure 4.
Feb.1989
Feb.1991
Feb.1993
Feb.1995
Feb.1997
Feb.1999
Feb.2001
Feb.2003
Feb.2005
Feb.2007
Feb.2009
–100
–80
–60
–40
–20
0
20
40
60
80
100%
–1.0
–0.8
–0.6
–0.4
–0.2
0
0.2
0.4
0.6
0.8
1.0
Equity—
currency correlation
Positive (domestic-currency) correlation:increased portfolio risk from full hedge
Negative (domestic-currency) correlation:decreased portfolio risk from full hedge

13 Campbell et al.’s (2007) currency strategy may be described as a separate currency overlay in which the authors solve for the set of optimal currency exposures for a given global equity portfolio. The authors’ currency prescription is to short those currencies that have positive equity–currency correlations and go long those with negative correlations.
13
Is there an optimal hedge ratio?
There is no consensus on whether an optimal hedge ratio exists or on what this optimal value may be. As described below, various researchers have set the hedge ratio between 0%, leaving the portfolio unhedged, and 100%, fully hedging the foreign-currency exposure. (See Figure 1 for a depiction of these various hedged positions.)
On one end of the hedging spectrum is the fully hedged portfolio. Perold and Schulman (1988) argued that, since currency hedges lower portfolio risk but not return, the full hedge is essentially a “free lunch.” They further advocated that the policy benchmark, the starting point for any portfolio, should be the fully hedged portfolio and said that “this strategy does not necessarily give the maximum risk reduction, but it does eliminate the bulk of the risk.”
At the opposite end of this hedge-ratio spectrum is the unhedged portfolio. Froot (1993) concluded that if real exchange rates and asset prices display mean reversion, then the decision to hedge or not depends on the investor’s investment horizon. For longer horizons of several years, the unhedged portfolio may be optimal. However, for shorter horizons, Froot reported lower portfolio variances for the hedged portfolios.
The partial hedge lies in the middle of these poles. Here, only part of the foreign-currency exposure is hedged back to the investor’s domestic currency. Black (1995) derived a “universal hedging” ratio that varies from 30% to 77%, depending on the values of several unstable inputs. Gastineau (1995) advocated a simple 50% hedged/50% unhedged currency benchmark as the “baseline currency policy” and argued that it is “not a bad policy for a passive manager and a reasonable starting point for an active currency manager.”
Another possible position is overhedging. In Campbell et al.’s (2007) currency schema, shorting the foreign currency results in a negative “hedge” ratio and more than 100% exposure to the investor’s domestic currency.13 (Our portfolio simulations were conducted with and without short positions.)
In the end, if the investor chooses to hedge some or all of the portfolio’s currency exposure, the optimal hedge ratio is a function of the investor’s risk tolerance, beliefs about the movements of currencies and asset prices, and the objectives of the currency program.

Our methodology was as follows:14
equity–currency correlations (as depicted in Figure 4 and Appendix A-1) to calculate currency hedge ratios—defined by Campbell et al. (2007) and Solnik (1991) as the ratio of the covariance between the equity return and currency movements and the variance of the currency movements. If we define the hedge ratio in terms of the investor’s domestic currency (d ):15
�d = (�s,d �s �d) / �d2. (3)
For any currency, domestic or foreign, the amount of currency hedged (βd ) plus the amount “kept” (wd ) sum to 100% or 1:
�d + wd = 1 so that wd = 1 – �d. (4)
These “keep rates” may also be termed the currency weightings in the domestic (wd ) and foreign (wf ) currencies, respectively. For our two-currency scenario, these two currency weightings also sum to 100% or 1:
wd + wf = 1 or wf = 1 – wd. (5)
Substituting (5) into (4), we derive the hedge ratio in terms of the foreign currency (βf ):
� f = wd. (6)
That is, the amount of the foreign currency hedged away (βf ) equals the currency weighting in the domestic currency (wd ).
the subsequent month’s equity index returns to generate simulated returns from a tactical hedging strategy. We multiply the domestic currency weighting by the return of the MSCI World
Hedged Index and the foreign-currency weighting by the return of the unhedged MSCI World Price Index. Each month’s simulated return is the sum of these two products:
wd * rh + wf * ru, (7)
where rh = the return on the MSCI World Hedged Index and ru = the return on the MSCI World Price Index.
monthly tactical hedging return series to that of the static unhedged and fully hedged MSCI World indexes to evaluate the results.
Note that if the foreign hedge ratio βf equals +1, this is a full hedge with a 100% allocation to the domestic currency in the fully hedged portfolio, the MSCI World Hedged Index. Alternatively, if the foreign hedge ratio βf is zero, this implies a 100% allocation to the foreign currency in the unhedged portfolio, that is, the MSCI World Price Index.16 Of course, the more likely scenario will have fractional hedge ratios, implying allocations to both indexes.
Furthermore, a hedge ratio βf greater than one would imply an allocation to the domestic currency, wd , greater than one—the overhedging scenario of Figure 1. Since some portfolio managers are constrained to full or partial hedges with no short currency positions allowed, we conducted our simulations twice for each currency: first with a ceiling on the domestic currency weighting so that both domestic- and foreign-currency weights are between 0% and 100%, and a second time with no constraints (i.e., allowing short positions in the foreign currency).
14 One of the limitations of the methodology used here is that it relies on the historical equity–currency correlation over the previous 12 months to set the hedge ratio for the subsequent month. Since these correlations do change over time, different results may obtain for different time periods. However, our aim here is to compare the risk reduction from a tactical strategy with that of a more passive, full-hedge strategy.
15 Although a hedge ratio is typically defined in terms of foreign currency, the BIS exchange-rate indexes are domestic-currency based. Thus, given this data constraint, our initial hedge ratio is defined in terms of the domestic currency.
16 Of course, given that we are using the MSCI World Price Index as our asset portfolio, a 100% allocation to the unhedged portfolio would leave the weighting to the domestic currency unchanged at whatever the value weighting to that country happened to be. As of February 2, 2010, only the country weighting for Australia (3.8%) was less than 10%. Weightings for the United States (48.6%), Japan (10.3%), the United Kingdom (10.0%), and the countries using the euro (13.6%) were all 10% or greater.
14

Figure 6 shows the results of our portfolio simulations: the average foreign-currency hedge ratios for the two scenarios, with and without the shorting constraint. With the exception of the AUD, use of the estimated equity–currency correlations produced average foreign hedge ratios of more than 50% for the no-shorting scenario and close to 100% for the unconstrained scenario. Consistent with the positive correlations for the AUD, the risk-minimizing foreign hedge ratios were closer to 0% (the unhedged portfolio).
The accompanying Figure 7, on page 16, indicates that applying this tactical monthly hedging rule to four of the currencies (USD, GBP, EUR, and JPY) resulted in a risk profile similar to that of the fully hedged portfolio. Thus, at least for this tactical
hedging strategy, using the estimated equity–currency correlation to calculate the monthly hedge ratio contributed very little incremental volatility reduction from that of the hedged portfolio.
However, for the AUD, applying the hedging rule resulted in less volatility in the AUD’s tactically hedged portfolios compared with the fully hedged portfolio. In addition, comparing the volatility of the unhedged portfolio with that of the three hedging strategies (fully hedged, tactically hedged with shorting, and tactically hedged without shorting), we found the greatest difference was for the Australian dollar. This was largely due to the fact that the two tactically hedged portfolios had less exposure to the positively correlated AUD.
15
Currency
USD GBP AUD EUR JPY
January 1988–January 2010
No shorting allowed 0.71 0.61 0.38 NA 0.82
Shorting allowed 1.07 0.86 0.60 NA 1.12
January 1999–January 2010
No shorting allowed 0.64 0.74 0.17 0.57 0.88
Shorting allowed 1.05 1.09 0.29 1.00 1.37
Notes: Average foreign hedge ratios over the two time periods were calculated using the MSCI World Price Index (local), the MSCI World Price Index, the MSCI World Hedged Index, and Bank for International Settlements Effective Exchange Rate Indices (narrow), with month-end data from January 1988–January 2010 and January 1999–January 2010, respectively.
Sources: Vanguard calculations, using data from Datastream, MSCI, and Bank for International Settlements.
Portfolio simulations: Average foreign-currency hedge ratios Figure 6.

Limited impacts of hedging
Despite the fact that hedging discussions tend to be focused on risk management, unfortunately the first-order consideration for many investors is whether or not the return of the hedged portfolio—in absolute or relative terms—was positive (Appell, 2010). As shown in Figure 8, this relative return, or hedge impact, was positive for Australia in both the 22- and 11-year time periods analyzed. Hedging back to the Australian dollar produced a higher average annual return that was, as also shown in Figure 3, accompanied by higher volatility. However, the information ratios for all five currencies were economically quite small and not statistically significant.
Thus, from a risk-adjusted-return standpoint, given the large volatility in the data, hedging the foreign-currency exposure produced no statistically significant value added. This finding is similar to that noted by Statman (2005), who found that the realized returns and risk for hedged and unhedged portfolios were virtually identical during the 1988–2003 time period.
16
Risk impacts versus unhedged portfoliosFigure 7.
–25
–20
–15
–10
–5
0
5
10
15
20
25
AUD
30%
Notes: The risk impacts are percentage differences in the annualized geometric standard deviations. These are volatility comparisons against the unhedged portfolio and were calculated using the MSCI World Price Index (local), the MSCI World Price Index, the MSCI World Hedged Index, and Bank for International Settlements Effective Exchange Rate Indices (narrow), with month-end data from January 1999–January 2010. The risk impacts for the full hedge are identical to those in Figure 3.
Sources: Vanguard calculations, using data from Datastream, MSCI, and Bank for International Settlements.
USD GBP JPYEUR
Full hedge No shorting allowed Shorting allowed
Ris
k im
pact
(%)
–6.7 –6.8–9.5
–5.0–7.7
–5.9
24.8
9.0
14.1
–4.3 –5.7–3.7
–19.3 –18.8 –19.8
Using month-end data from January 1999–January 2010

Conclusion
“Currency risks” are a major consideration for investors when making portfolio allocation decisions. Using a risk-focused framework for managing currency exposure, we found that, for four of five major currencies (except the Australian dollar), currency management of a global equity portfolio provided very modest risk-reduction benefits. Further, risk-adjusted returns were highly variable, and therefore, statistically insignificant. We conclude that while the prescription of theory with respect to currency hedging is clear, for the equity markets we examined the impact of such hedging on portfolio volatility was marginal in practice. It is unclear whether the volatility reduction arising from a systematic hedging program is worth the costs.
In addition, we are mindful that while investors often talk about currency management for risk- control reasons, they frequently tend to evaluate the effectiveness of a currency strategy in terms of its impact on overall return, not portfolio risk. There is a clear difference between a currency strategy undertaken for volatility management and a program designed to enhance returns by forecasting future exchange-rate movements. Investors should be clear, ex ante, about the primary rationale for their currency program—risk management or return enhancement—and keep this objective in mind throughout the implementation and monitoring of the program. Mislabeling a currency strategy as “risk management” when the real goal is alpha generation may lead to a short-term focus and disappointing results.
17
Currency
USD GBP AUD EUR JPY
11 years: January 1999–January 2010
Average hedge impact –0.60% –0.09% 3.57% 0.46% –2.23%
Standard deviation of hedge impact 3.64% 6.92% 11.33% 7.19% 8.73%
Information ratio –0.16 –0.01 0.32 0.06 –0.26
Equity–currency correlation –0.20 0.09 0.40 0.09 –0.32
22 years: January 1988–January 2010
Average hedge impact –0.35% 0.91% 2.19% NA –2.30%
Standard deviation of hedge impact 4.62% 7.43% 11.01% NA 8.61%
Information ratio –0.08 0.12 0.20 NA –0.27
Equity–currency correlation –0.12 0.10 0.25 NA –0.13
Notes: “Hedge impact” is the monthly difference between the returns of the MSCI World Hedged Index and the MSCI World Price Index. Average hedge impacts were not significantly different from zero. Both the average hedge impact and the standard deviation of hedge impact are annualized and geometric, not arithmetic, calculations. “Information ratio” is the ratio of the average hedge impact divided by its volatility. “Equity–currency correlation” is the correlation of monthly returns for the Bank for International Settlements Effective Exchange Rate indices (narrow) and the MSCI World Price Index (local). The correlations are identical to those presented in Figure 2.
The results shown were calculated using the MSCI World Price Index (local), the MSCI World Price Index, the MSCI World Hedged Index, and Bank for International Settlements Effective Exchange Rate indices (narrow), with month-end data from January 1999–January 2010 and January 1998–January 2010, respectively.
Sources: Vanguard calculations, using data from Datastream, MSCI, and Bank for International Settlements.
Incremental return and volatility of hedgingFigure 8.
References
Appell, Douglas, 2010. Investors’ Lament: Where Does the Buck Stop? Pensions & Investments (March 8); available at http://www.pionline.com/article/20100308/PRINTSUB/303089973.
Bank for International Settlements, 2010. BIS Effective Exchange Rate Indices; available at http://www.bis.org/statistics/eer/index.htm.
Battellino, Ric, and Michael Plumb, 2009. A Generation of an Internationalised Australian Dollar. Address presented to BIS/Bank of Korea Seminar on “Currency Internationalisation: Lessons from the International Financial Crisis and Prospects for the Future in Asia and the Pacific,” Seoul, March 19–20. Reserve Bank of Australia. Sydney: Reserve Bank of Australia; available at http://www.bis.org/repofficepubl/arpresearch200903.11.pdf.
Black, Fischer, 1995. Universal Hedging: Optimizing Currency Risk and Reward in International Equity Portfolios. Financial Analysts Journal 51(1): 161–67.
Campbell, John Y., Karine Serfaty-de Medeiros, and Luis M. Viceira, 2007. Global Currency Hedging. NBER Working Paper No. 13088. Cambridge, Mass: National Bureau of Economic Research; available at http://www.nber.org/papers/w13088. Also published, 2010, in Journal of Finance 65(1): 87–121.
Davis, Joseph H., Roger Aliaga-Díaz, and Charles Thomas, 2010, in progress. Currency’s Impact on International Returns. Valley Forge, Pa.: The Vanguard Group.
EconomyWatch, 2010. Settlement Period, Settlement Risk; available at http://www.economywatch.com/trading/settlement-period-settlement-risk.html.
Froot, Kenneth A., 1993. Currency Hedging Over Long Horizons. NBER Working Paper No. 4355. Cambridge, Mass: National Bureau of Economic Research; available at http://www.nber.org/ papers/w4355.
Gastineau, Gary L., 1995. The Currency Hedging Decision: A Search for Synthesis in Asset Allocation. Financial Analysts Journal 51(3): 8–17.
Jorion, Phillippe, 1994. Mean-Variance Analysis of Currency Overlays. Financial Analysts Journal 50(3): 48–56.
Klau, Marc, and San Sau Fung, 2006. The New BIS Effective Exchange Rate Indices. BIS Quarterly Review (March): 51–65; available at http://www.bis.org/publ/qtrpdf/r_qt0603e.pdf.
Kritzman, Mark, 1993. The Optimal Currency Hedging Policy with Biased Forward Rates. Journal of Portfolio Management 19(4): 94–100.
Lundin, Mark, 1997. To Hedge or Not to Hedge. AIMR Conference Proceedings: Managing Currency Risk (November): 14–27.
Markowitz, Harry, 1952. Portfolio Selection. Journal of Finance 7(1): 77–91.
Martini, Giulio, 2007. Active Currency Management: The Unexploited Alpha Opportunity. AllianceBernstein Working Paper (August). New York: AllianceBernstein. Updated as Active Currency Management: The Unexploited Opportunity, in Bernstein Journal: Perspectives on Investing and Wealth Management (Fall 2007).
18

McCauley, Robert, 2006. Internationalising a Currency: The Case of the Australian Dollar. BIS Quarterly Review (December): 41–54; available at http://www.bis.org/publ/qtrpdf/r_qt0612f.pdf.
MSCI, 2009. MSCI Hedged Indices, MSCI FX Hedge Indices, and MSCI Global Currency Indices; available at http://www.mscibarra.com/products/indices/thematic_and_strategy/hedging_currency/hedged/MSCI_Hedged_FX_Hedge_Global_Currency_Methodology_Nov09.pdf.
MSCI, 2010a. Index Country Membership Tool; available at http://www.mscibarra.com/products/indices/tools/index_country_membership.
MSCI, 2010b. Index Frequently Asked Questions; available at http://www.mscibarra.com/support/ index_frequently_asked_questions.html#faq6.
MSCI, 2010c. MSCI Index Calculation Methodologies; available at http://www.mscibarra.com/eqb/methodology/meth_docs/MSCI_Feb10_IndexCalcMethodology.pdf.
O’Sullivan, Kate, 2010. Painful Conversions: As Currency Risk Intensifies, Companies of All Sizes Are Taking Steps to Protect Cash Flows. CFO Magazine (April 1); available at http://www.cfo.com/article.cfm/14485382.
Perold, André F., and Evan C. Schulman, 1988. The Free Lunch in Currency Hedging: Implications for Investment Policy and Performance Standards. Financial Analysts Journal 44(3): 45–50.
Philips, Christopher B., 2009. Considerations for International Equity. Valley Forge, Pa.: The Vanguard Group.
Senior, Christine, 2010. The Dilemma of Whether to Hedge or Not. Financial Times (April 11); available at http://www.ft.com/cms/s/0/01075a78-4333-11df- 9046-00144feab49a.html.
Shead, Jonathan, 2008. An Historical View of Currency Hedging and Portfolio Volatility. State Street Global Advisors Library (April); available at http://www.ssga.com/library/esps/historical viewofcurrencyhedging20080422/page.html.
Solnik, Bruno, 1991. International Investments, 2d ed. Reading, Mass.: Addison-Wesley Publishing Co.
Solnik, Bruno, 1997. Integrating Global Asset Allocation and Currency Management. AIMR Conference Proceedings: Managing Currency Risk (November): 60–70.
Statman, Meir, 2005. Hedging Currencies with Hindsight and Regret. Journal of Investing (14)2: 15–19.
Wang, Jian, 2008. Why Are Exchange Rates So Difficult to Predict? Economic Letter 3(6). Federal Reserve Bank of Dallas; available at http://www.dallasfed.org/research/eclett/2008/e10806.html.
19

Appendix.
20
Notes: Rolling 12-month calculations using the MSCI World Price Index (local), the MSCI World Price Index, the MSCI World Hedged Index, and Bank for International Settlements Effective Exchange Rate Indices (narrow), with month-end data from February 1988–January 2010 for the U.S. dollar, the British pound sterling, and the Japanese yen, and from February 1999–January 2010 for the euro. Results for the Australian dollar are presented in Figure 4.
Sources: Vanguard calculations, using data from Datastream, MSCI, and Bank for International Settlements.
Equity–currency correlations and risk impactsFigure A1.
a. Full hedge of U.S. Dollar (USD)
Ris
k im
pact
(%)
USD percentage risk impact USD equity–currency correlation
Feb.1989
Feb.1991
Feb.1993
Feb.1995
Feb.1997
Feb.1999
Feb.2001
Feb.2003
Feb.2005
Feb.2007
Feb.2009
–100
–80
–60
–40
–20
0
20
40
60
80
100%
–1.0
–0.8
–0.6
–0.4
–0.2
0
0.2
0.4
0.6
0.8
1.0
Equity—
currency correlation
b. Full hedge of British pound sterling (GBP)
Ris
k im
pact
(%)
GBP percentage risk impact GBP equity–currency correlation
Feb.1989
Feb.1991
Feb.1993
Feb.1995
Feb.1997
Feb.1999
Feb.2001
Feb.2003
Feb.2005
Feb.2007
Feb.2009
–100
–80
–60
–40
–20
0
20
40
60
80
100%
–1.0
–0.8
–0.6
–0.4
–0.2
0
0.2
0.4
0.6
0.8
1.0
Equity—
currency correlation
Positive (domestic-currency) correlation:increased portfolio risk from full hedge
Negative (domestic-currency) correlation:decreased portfolio risk from full hedge
Positive (domestic-currency) correlation:increased portfolio risk from full hedge
Negative (domestic-currency) correlation:decreased portfolio risk from full hedge

21
Notes: Rolling 12-month calculations using the MSCI World Price Index (local), the MSCI World Price Index, the MSCI World Hedged Index, and Bank for International Settlements Effective Exchange Rate Indices (narrow), with month-end data from February 1988–January 2010 for the U.S. dollar, the British pound sterling, and the Japanese yen, and from February 1999–January 2010 for the euro. Results for the Australian dollar are presented in Figure 4, on page 12.
Sources: Vanguard calculations, using data from Datastream, MSCI, and Bank for International Settlements.
c. Full hedge of Euro (EUR)
Ris
k im
pact
(%)
EUR percentage risk impact EUR equity–currency correlation
Feb.2000
Feb.2001
Feb.2002
Feb.2003
Feb.2004
Feb.2005
Feb.2006
Feb.2007
Feb.2008
Feb.2009
–100
–80
–60
–40
–20
0
20
40
60
80
100%
–1.0
–0.8
–0.6
–0.4
–0.2
0
0.2
0.4
0.6
0.8
1.0
Equity–currency correlation
d. Full hedge of Japanese yen (JPY)
Ris
k im
pact
(%)
JPY percentage risk impact JPY equity–currency correlation
Feb.1989
Feb.1991
Feb.1993
Feb.1995
Feb.1997
Feb.1999
Feb.2001
Feb.2003
Feb.2005
Feb.2007
Feb.2009
–100
–80
–60
–40
–20
0
20
40
60
80
100%
–1.0
–0.8
–0.6
–0.4
–0.2
0
0.2
0.4
0.6
0.8
1.0
Equity–currency correlation
Positive (domestic-currency) correlation:increased portfolio risk from full hedge
Negative (domestic-currency) correlation:decreased portfolio risk from full hedge
Positive (domestic-currency) correlation:increased portfolio risk from full hedge
Negative (domestic-currency) correlation:decreased portfolio risk from full hedge

Vanguard research >Vanguard Center for Retirement Research Vanguard Investment Counseling & Research Vanguard Investment Strategy Group
E-mail > [email protected]
P.O. Box 2600 Valley Forge, PA 19482-2600
© 2010 The Vanguard Group, Inc. All rights reserved.
ICRCMC 092010
Connect with Vanguard® > vanguard.com> global.vanguard.com (non-U.S. investors)