Currency Exposures Benefit Gold Miners
31
Equity Research Industry Update www.cowen.com Please see addendum of this report for important disclosures. February 9, 2015 ■ Metals & Mining: Precious Metals ■ Metals & Mining: Emerging Miners Currency Exposures Benefit Gold Miners In 2015 Adam P. Graf, CFA 646.562.1344 [email protected] Misha Levental 646.562.1410 [email protected] The Cowen Insight We expect margins for gold miners to benefit in 2015 due to 1) lower oil, and 2) weakening currencies, in addition to other factors. As a follow-on to our report, Miners Benefit From Lower Oil Price, we have modeled the impact of weakening foreign currencies and hedge positions on miners. Of the large gold miners, we estimate that NEM, AUY, KGC should see the most margin benefit (Figure 3). Exposure To Weakening Foreign Currencies - Sorting Through The Noise Within our coverage universe, senior miners operate in a multitude of global jurisdictions. In 2014, we saw local currencies (for which the miners are most exposed) depreciate ~20%, on average, versus the USD (Figure 1). In 2015, the USD is expected to continue to strengthen against most global currencies, as implied by the futures curves for currency exchange rates (Figure 9). Senior NA miners' report in USD; therefore, those with the highest exposure to weaker foreign currencies should see the most y/y cost improvement. However, miners' true cost exposure to weaker local currency can be muted or lagged by: 1) currency hedge positions, 2) local inflation rates (as is the case in Argentina), and 3) each individual operation's exposure to the local currency vs. USD denominated contracts and purchases. Where We Expect To See 2015E Outperformance - NEM, AUY, KGC, AEM By our estimates, NEM and AEM demonstrate the highest degree of sensitivity to exchange rate movement on 2015E and 2016E EPS (Figures 4-6). At the current forward curve for currencies, NEM's exposure to AUD and PEN in 2015 should provide the company with an additional $0.20/sh in EPS, versus 2014; AEM's exposure to CAD and MXN in 2015 should provide the company with an additional $0.36/sh in EPS, versus 2014. ABX, due to respective currency hedging positions already in place for 2015, shows relatively lower sensitivity currency exchange rate movement vs the USD on 2015E EPS. Due in part to hedges, AUY and KGC also have limited exposure to local currency movement in 2015, but should still see some benefit from lower oil. We continue to forecast 2015E and 2016E EPS estimates (Figure 3), taking into account the current forward curves for oil and currencies. Currencies + Oil, To Bring Industry All-In Costs Sub-$1,100/oz in 2015 Overall, we expect 2015 to be a good year for senior gold miners; we would expect margin-growth, and cash building in 2015-16, as costs improve, not only from improvements made operationally, but also due to weaker foreign currencies, and lower oil prices (as we mentioned in our note, Miners Benefit From Lower Oil Price). Each of these factors, in total, have helped bring down operating costs (per ounce) for each of the six North American gold producers, which, coupled with significantly reduced 2015 capital programs, should bring "all-in cost" (AIC) down y/y, to $1,100/oz or lower (Figures 7 & 10). Cost should remain around $1,100/oz through 2016; beyond 2016, the "all-in cost" landscape is likely to rise, due to increased capital spending required to maintain current growth profiles. This report is intended for [email protected]. Unauthorized redistribution of this report is prohibited.
-
Upload
misha-levental -
Category
Documents
-
view
19 -
download
2
Transcript of Currency Exposures Benefit Gold Miners

Equity Research Industry Update
www.cowen.com Please see addendum of this report for important disclosures.
February 9, 2015
■ Metals & Mining: Precious Metals■ Metals & Mining: Emerging Miners Currency Exposures Benefit Gold Miners
In 2015Adam P. Graf, [email protected]
Misha [email protected]
The Cowen InsightWe expect margins for gold miners to benefit in 2015 due to 1) lower oil, and 2)weakening currencies, in addition to other factors. As a follow-on to our report, MinersBenefit From Lower Oil Price, we have modeled the impact of weakening foreigncurrencies and hedge positions on miners. Of the large gold miners, we estimate thatNEM, AUY, KGC should see the most margin benefit (Figure 3).
Exposure To Weakening Foreign Currencies - Sorting Through The Noise
Within our coverage universe, senior miners operate in a multitude of globaljurisdictions. In 2014, we saw local currencies (for which the miners are mostexposed) depreciate ~20%, on average, versus the USD (Figure 1). In 2015, the USDis expected to continue to strengthen against most global currencies, as implied bythe futures curves for currency exchange rates (Figure 9). Senior NA miners' reportin USD; therefore, those with the highest exposure to weaker foreign currenciesshould see the most y/y cost improvement. However, miners' true cost exposure toweaker local currency can be muted or lagged by: 1) currency hedge positions, 2)local inflation rates (as is the case in Argentina), and 3) each individual operation'sexposure to the local currency vs. USD denominated contracts and purchases.
Where We Expect To See 2015E Outperformance - NEM, AUY, KGC, AEM
By our estimates, NEM and AEM demonstrate the highest degree of sensitivity toexchange rate movement on 2015E and 2016E EPS (Figures 4-6). At the currentforward curve for currencies, NEM's exposure to AUD and PEN in 2015 should providethe company with an additional $0.20/sh in EPS, versus 2014; AEM's exposure to CADand MXN in 2015 should provide the company with an additional $0.36/sh in EPS,versus 2014. ABX, due to respective currency hedging positions already in place for2015, shows relatively lower sensitivity currency exchange rate movement vs the USDon 2015E EPS. Due in part to hedges, AUY and KGC also have limited exposure tolocal currency movement in 2015, but should still see some benefit from lower oil. Wecontinue to forecast 2015E and 2016E EPS estimates (Figure 3), taking into accountthe current forward curves for oil and currencies.
Currencies + Oil, To Bring Industry All-In Costs Sub-$1,100/oz in 2015
Overall, we expect 2015 to be a good year for senior gold miners; we would expectmargin-growth, and cash building in 2015-16, as costs improve, not only fromimprovements made operationally, but also due to weaker foreign currencies, andlower oil prices (as we mentioned in our note, Miners Benefit From Lower Oil Price).Each of these factors, in total, have helped bring down operating costs (per ounce)for each of the six North American gold producers, which, coupled with significantlyreduced 2015 capital programs, should bring "all-in cost" (AIC) down y/y, to $1,100/ozor lower (Figures 7 & 10). Cost should remain around $1,100/oz through 2016; beyond2016, the "all-in cost" landscape is likely to rise, due to increased capital spendingrequired to maintain current growth profiles.
This report is intended for w
orld-cowen-m
orningnotesdistribution@cow
en.com. U
nauthorized redistribution of this report is prohibited.

Currency Exchange Rates & Lower Oil Should Reduce Operating Costs
Over the last two years, most “commodity” currencies have weakened 15%-25%
against the USD (Figure 1). Consequently, we have painstakingly reviewed the asset-
by-asset exposures of the six largest North American gold miners. We have added or
refined our cost formulas to take into account local currency exposure and hedge
positions, in order to dynamically incorporate the currency forward curves. For the
most part, this has reduced our forward looking operating (and capital) cost estimates
for operations exposed. As a result, we have revised our forward looking financial
estimates and valuations so as to reflect disclosed currency exposures and hedge
positions. For many of the miners, the depreciation of local currencies against the
dollar has had even a greater positive impact on a company’s cost structure, when compared to the positive impact of a lower oil price on diesel. Our primary focus is
not only to better forecast the earnings and cash flows, but also to be ahead of the
market on valuing these companies.
Figure 1 : Currency Exchange Rate Historic Performance For Select Currencies (January 2013-Present)
Source: Cowen and Company, Bloomberg
We have reviewed asset-by-asset operating cost sensitivity to exchange rate
movement for the large North American gold miners. Each company’s exposure to exchange rate movements is a function of 1) expected shifts in local currencies versus
the USD (Figure 8), 2) relative exposure to jurisdictions in which it operates (Figure 7),
and 3) any currency hedging undertaken (explained further below). By our estimates,
Newmont Mining and Agnico-Eagle demonstrate the highest degree of sensitivity to
movement in exchange rates on 2015E and 2016E EPS, for a 10% change in respective
local currency exchange rates versus the USD. Barrick, Yamana, and Kinross,
however, due to respective currency hedging positions already in place for 2015, show
relatively less sensitivity to a 10% move in local currency exchange rates versus the
USD on 2015E EPS.
0.40
0.50
0.60
0.70
0.80
0.90
1.00
1.10
Jan-
13
Feb
-13
Mar
-13
Apr
-13
May
-13
Jun-
13
Jul-1
3
Aug
-13
Sep
-13
Oct
-13
Nov
-13
Dec
-13
Jan-
14
Feb
-14
Mar
-14
Apr
-14
May
-14
Jun-
14
Jul-1
4
Aug
-14
Sep
-14
Oct
-14
Nov
-14
Dec
-14
Jan-
15
USD/CAD USD/PEN USD/BRL USD/MXN USD/CLP USD/RUB USD/AUD
USD/RUB
USD/CLPUSD/AUD
USD/BRL
USD/CAD
USD/PEN
USD/MXN
www.cowen.com2
Cowen and Company
Equity Research February 9, 2015
This report is intended for w
orld-cowen-m
orningnotesdistribution@cow
en.com. U
nauthorized redistribution of this report is prohibited.

Figure 2 : Impact on EPS, Due To Changes in Gold, Oil, Copper, & Currencies, 11/2014-Present
Source: Cowen and Company, data from Bloomberg
Note: Nov/2014 EPS estimates use current model, with historic forward curves for metals, energy, and currency
Spot Gold ($/oz) $1,173 Spot Gold ($/oz) $1,262
Spot Oil ($/bbl) $87 Spot Oil ($/bbl) $51
ABX Delta Impact on 2015E EPS Due To Changes In
Gold Oil Copper Currencies
Cowen 2015E
EPS $0.91 $0.14 $0.04 -$0.08 $0.01
Cowen 2015E
EPS $1.02
Consensus $0.88 Consensus $0.75
Gold Oil Copper Currencies
Cowen 2015E
EPS $0.77 $0.11 $0.13 -$0.03 $0.07
Cowen 2015E
EPS $1.05
Consensus $1.04 Consensus $0.78
NEM
Gold Oil Copper Currencies
Cowen 2015E
EPS $1.06 $0.26 $0.27 -$0.28 $0.12
Cowen 2015E
EPS $1.43
Consensus $1.05 Consensus $1.02
KGC
Gold Oil Copper Currencies
Cowen 2015E
EPS $0.14 $0.06 $0.07 $0.00 $0.00
Cowen 2015E
EPS $0.27
Consensus $0.13 Consensus $0.09
AEM
Gold Oil Copper Currencies
Cowen 2015E
EPS $0.79 $0.22 $0.30 -$0.01 $0.28
Cowen 2015E
EPS $1.58
Consensus $1.03 Consensus $0.84
Gold Oil Copper Currencies
Cowen 2015E
EPS $0.22 $0.05 $0.05 -$0.04 $0.00
Cowen 2015E
EPS $0.28
Consensus $0.22 Consensus $0.17
11/1/2014 2/5/2015
11/1/2014 2/5/2015
11/1/2014 2/5/2015
11/1/2014 2/5/2015
11/1/2014 2/5/2015
11/1/2014 2/5/2015
11/1/2014 2/5/2015
www.cowen.com 3
Cowen and Company
Equity Research February 9, 2015
This report is intended for w
orld-cowen-m
orningnotesdistribution@cow
en.com. U
nauthorized redistribution of this report is prohibited.

North American senior producers generally disclosure up to three years’ worth of production, cost and capital spending guidance. Consistent with our methodology, we
build upon guidance provided by the companies, factoring in the futures curves for
metals, energy, and currency; our estimates reflect the impact of such futures. As
highlighted by Figure 2, our 2015E EPS are above Street for all six North American
senior miners under coverage. Figure 2 shows that for most of the six senior
producers, effects of 1) higher gold price, 2) lower oil price, and 3) weakening
currencies, have not yet been factored into 2015 estimates, and may explain much the
discrepancy between Cowen and Street.
Changes in Cowen 2015E EPS from November 2014 through present are derived from
evaluating the impact on select significant input factors over the two time periods, to
seek to explain the increase in our estimates. Not surprisingly, over this time period,
our estimates have been incrementally revised upward, a function of 1) higher gold
price, 2) lower oil price, and 3) weakening currencies, offset by a lower copper price.
Over this same time period, 2015E Street EPS estimates have generally declined,
despite indications of an improving environment for gold miners in 2015. This may be
reflective weaker announced 2015 operating guidance from senior miners (e.g. GG,
AUY), mine suspensions (e.g. KGC/GG, ABX), the impact of share issuance (AUY,
AEM), and the impact of asset sales (NEM). Therefore, we believe that current Street
consensus estimates must be either:
1. Using a 2015 gold price assumption below the current gold price, or
2. Not yet updated with respect to improving cost profile for miners as lower oil
price and weakening currencies.
We would expect upward revisions for Street estimates as we progress through 2015,
as lower cost inputs become incorporated into management guidance, and evidence
of cost structure improvement show in quarter-end financial statements.
www.cowen.com4
Cowen and Company
Equity Research February 9, 2015
This report is intended for w
orld-cowen-m
orningnotesdistribution@cow
en.com. U
nauthorized redistribution of this report is prohibited.

Gold Miner Sensitivity To Currency Exchange Rates
We derive our forward-looking oil price and currency exchange rate assumptions
weekly, using respective futures curves, as listed in Figure 9. In Figure 3, we have
assessed the impact of lower 2015E-2016E oil and currencies on gold miners’ 2015E-
2016E EPS by calculating the differential in EPS, using 2014 average oil price and
exchange rates. For example, using average 2014 oil price ($99/bbl) for 2015E (the
current average 2015E oil price, as implied by the current futures curve, is $58/bbl)
results in a $0.07/sh decrease to ABX’s 2015E EPS. Similarly, using 2014 currency
exchange rates for 2015E (current average foreign currencies forwards for 2015E, vs
the USD, are 20% below 2014 values) caused a $0.03/sh decrease to ABX 2015E EPS.
Figure 3 : 2015E-2016E EPS Estimates, And The Impact Of Lower Oil and Weaker Foreign Currency
Source: Cowen and Company, Street consensus from Bloomberg
Note: 2015E oil and currency prices derived using respective futures curves, as listed in Figure 9
Figures 4-6 highlight the impact of weakening currencies on EPS estimates (2015E
and 2016E) and NAV. These tables indicate our calculated impact of a 10% change in
individual exchange rates on estimates, taking into account any hedging initiatives. As
an example of the impact of currency hedging on AUY, while Brazilian operations
account for approximately 25% of total production (Figure 8), substantial hedging of
the Brazilian Real undertaken for 2015 has left the company relatively insensitive to
fluctuations in the local currency.
For 2015, ABX shows the least earnings variability to fluctuations in local currencies in
2015, primarily due to currency hedging undertaken. As of September 30, 2014, for the
year 2015, 54% of Australian operating costs were hedged at A$1.06/US$, 61% of
Canadian operating costs were hedged at C$0.97/US$, and 50% of Chilean operating
costs were hedged at 0.002 CLP/US$. As of September 30, 2014, for the year 2016,
13% of Australian operating costs were hedged at A$1.10/US$.
Impact to 2015E EPS Impact to 2016E EPS
2015E EPS 2016E EPS
Using 2015E Oil
Price, Vs 2014
actual
Using 2015E
Currency Prices, Vs
2014 actuals
Using 2016E Oil
Price, Vs 2014
actual
Using 2016E
Currency Prices, Vs
2014 actuals
Cowen $1.02 $1.16 $0.07 $0.03 $0.08 $0.05
Street $0.75 $0.95
Cowen $1.05 $1.40 $0.18 $0.14 $0.11 $0.14
Street $0.78 $0.98
Cowen $1.43 $1.71 $0.45 $0.20 $0.38 $0.45
Street $1.02 $1.26
Cowen $0.27 $0.34 $0.10 $0.05 $0.10 $0.09
Street $0.09 $0.14
Cowen $1.58 $1.43 $0.38 $0.36 $0.23 $0.34
Street $0.84 $1.20
Cowen $0.28 $0.25 $0.07 $0.03 $0.05 $0.06
Street $0.17 $0.30AUY
ABX
GG
NEM
KGC
AEM
www.cowen.com 5
Cowen and Company
Equity Research February 9, 2015
This report is intended for w
orld-cowen-m
orningnotesdistribution@cow
en.com. U
nauthorized redistribution of this report is prohibited.

Figure 4 : Impact on 2015E EPS, for North American Senior Gold Producers, Per 10% Change in Respective Local Currency Exchange Rates
Source: Cowen and Company
Figure 5 : Impact on 2016E EPS, for North American Senior Gold Producers, Per 10% Change in Respective Local Currency Exchange Rates
Source: Cowen and Company
Figure 6 : Impact on 2015E NAV, for North American Senior Gold Producers, Per 10% Change in Respective Local Currency Exchange Rates
Source: Cowen and Company
NEM and AEM appear the most sensitive to local currency fluctuations. AEM’s large operating exposure to Canadian operations (~70% of production), coupled with
relatively minimal currency hedging in place, leaves the company relatively vulnerable
to fluctuations in the Canadian Dollar. NEM’s large operating exposure to Australian operations (~30% of production) is mitigated by hedging undertaken on the
Australian Dollar. The company hedges its currency exposure to the AUD and NZ$. In
2015E
EPS CAD % of EPS EUR AUD MXN PEN CLP ARS RUB
ABX $1.02 $0.01 (1%) $0.01 (1%) $0.00 (0%)
$1.05 $0.06 (6%) $0.04 (4%) $0.01 (1%)
NEM $1.43 $0.11 (8%) $0.11 (8%)
KGC $0.27 $0.01 (3%) $0.00 (2%)
AEM $1.58 $0.18 (12%) $0.04 (2%) $0.03 (2%)
AUY $0.28 $0.01 (2%) $0.00 (0%) $0.02 (9%) $0.00 (0%)
2016E
EPS CAD % of EPS EUR AUD MXN PEN CLP ARS RUB
ABX $1.16 $0.01 (1%) $0.01 (1%) $0.00 (0%)
$1.40 $0.07 (5%) $0.04 (3%) $0.01 (0%)
NEM $1.71 $0.14 (8%) $0.01 (1%)
KGC $0.34 $0.01 (4%) $0.01 (2%)
AEM $1.43 $0.20 (14%) $0.03 (2%) $0.03 (2%)
AUY $0.25 $0.01 (3%) $0.02 (7%) $0.02 (10%) $0.00 (0%)
2015E
NAV CAD
% of
NAV EUR AUD MXN PEN CLP ARS RUB
ABX $9.59 $0.13 (1%) $0.04 (0%) $0.00 (0%)
$19.85 $0.50 (3%) $0.51 (3%) $0.02 (0%)
NEM $28.97 $0.97 (3%) $0.39 (1%)
KGC $4.68 $0.21 (5%) $0.02 (1%)
AEM $27.19 $1.97 (7%) $0.57 (2%) $0.25 (1%)
AUY $6.01 $0.13 (2%) $0.20 (3%) $0.22 (4%) $0.00 (0%)
www.cowen.com6
Cowen and Company
Equity Research February 9, 2015
This report is intended for w
orld-cowen-m
orningnotesdistribution@cow
en.com. U
nauthorized redistribution of this report is prohibited.

2015, 2016, and 2017, the company has hedged 18%, 11%, and 7% of operating
expenses, respectively at 0.98 $/A$, 0.95 $/A$, and 0.93 $/A$, respectively.
Figure 7 : Effect of Y/y Change in 2015E Oil Price and Currencies on Senior Producers’ 2015E All-In Costs, Versus 2014
Source: Cowen and Company, All-In Costs made-up of: Net Operating Costs After-Byproduct + Capex + SGA + Exploration + Interest + Taxes
Most of the North American senior miners have stated 2015 “all-in sustaining cost” (AISC) near-or-below $1,000/oz in 2015. Our “all-in cost” (AIC) estimates are similar to miners’ guidance; however, the difference is explained by our inclusion of all capital vs. only “sustaining” capital. ABX and GG show the largest cuts in AIC (we have defined as Net Operating Costs After-Byproduct + Capex + SGA + Exploration +
Interest + Taxes); driven by reductions to capital expenditures. For NEM, AEM, and
($750)
($250)
$250
$750
$1,250
$1,750
2014E 2015E
$/oz
Au
Oil Price Currencies Other
incl. capex
($750)
($250)
$250
$750
$1,250
$1,750
2014E 2015E$/
oz
Au
Oil Price Currencies Otherincl. capex
($750)
($250)
$250
$750
$1,250
$1,750
2014E 2015E
$/oz
Au
Oil Price Currencies Otherincl. capex
($750)
($250)
$250
$750
$1,250
$1,750
2014E 2015E
$/oz
Au
Oil Price Currencies Other
incl. capex
($750)
($250)
$250
$750
$1,250
$1,750
2014E 2015E
$/oz
Au
Oil Price Currencies Other
incl. capex
($750)
($250)
$250
$750
$1,250
$1,750
2014E 2015E
$/oz
Au
Oil Price Currencies Other
incl. capex
ABX
KGC
AEM AUY
www.cowen.com 7
Cowen and Company
Equity Research February 9, 2015
This report is intended for w
orld-cowen-m
orningnotesdistribution@cow
en.com. U
nauthorized redistribution of this report is prohibited.

KGC, however, lower oil and weakening currencies reduce the operating cost
component of the AIC reduction in 2015 (at the current futures curve for oil and
respective currencies).
To-date, the sell-off in oil is expected to contribute more to the expected decrease in
2015 net operating costs than weakening currencies. Based on the current futures
curve for metals and currency (Figure 9), however, we would expect to continue to see
currencies contribute to improved operating cost profiles for miners, whereas the
benefit of lower oil price should be expected to contract as we head into 2016 and
beyond.
www.cowen.com8
Cowen and Company
Equity Research February 9, 2015
This report is intended for w
orld-cowen-m
orningnotesdistribution@cow
en.com. U
nauthorized redistribution of this report is prohibited.
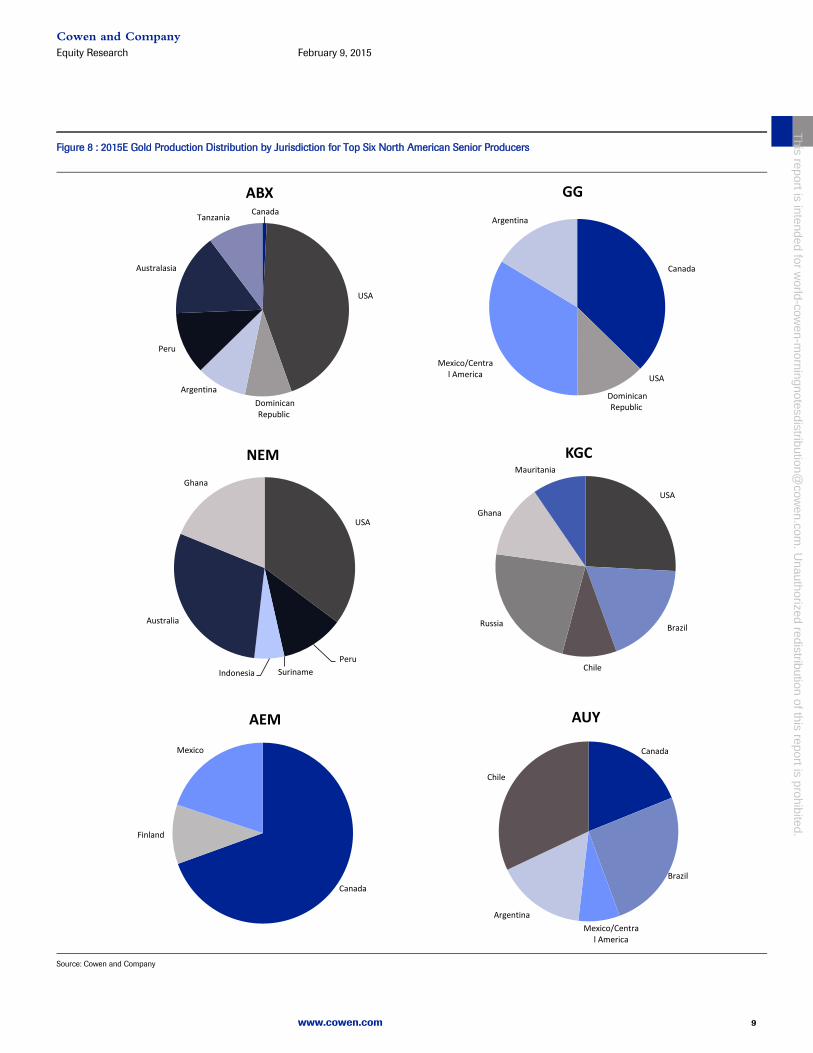
Figure 8 : 2015E Gold Production Distribution by Jurisdiction for Top Six North American Senior Producers
Source: Cowen and Company
Canada
USA
Dominican
Republic
Argentina
Peru
Australasia
Tanzania
ABX
Canada
USA
Dominican
Republic
Mexico/Centra
l America
Argentina
GG
USA
Brazil
Chile
Russia
Ghana
Mauritania
KGC
Canada
Brazil
Mexico/Centra
l America
Argentina
Chile
AUY
Canada
Finland
Mexico
AEM
USA
Peru
Suriname Indonesia
Australia
Ghana
NEM
www.cowen.com 9
Cowen and Company
Equity Research February 9, 2015
This report is intended for w
orld-cowen-m
orningnotesdistribution@cow
en.com. U
nauthorized redistribution of this report is prohibited.

Barrick
Approximately 45% of the company’s production is tied to U.S. operations. The
remaining operations are spread across Australia, Peru, Canada, Dominican Republic,
Chile/Argentina, Tanzania, and Saudi Arabia, representing 15%, 12%, 1%, 9%, 9%,
10%, and 0.1% of total production. The company’s exposure to weaker commodity
currencies vs. the USD should reduce the company’s consolidated cost structure. ABX, however, has mitigated its exposure to various currency movements through
hedging positions established in the Australian Dollar, Canadian Dollar, and Chilean
Peso. As of September 30, 2014, for the year 2015, 54% of Australian operating costs
were hedged at A$1.06/US$, 61% of Canadian operating costs were hedged at
C$0.97/US$, and 50% of Chilean operating costs were hedged at 0.002 CLP/US$. As of
September 30, 2014, for the year 2016, 13% of Australian operating costs were hedged
at A$1.10/US$.
Goldcorp
Approximately 40% of the company’s production comes from Canadian operations; approximately 30% of production is tied to Mexican operations. With Cerro Negro now
online, Argentinian operations represent roughly 18% of longer-term production
volumes. The Dominican Republic (Pueblo Viejo – 40% ownership) accounts for ~12%
of total production.
Newmont
Newmont’s operations extend across the United States, Peru, Indonesia, Australia, and Africa, with gold production from each accounting for 35%, 11%, 5%, 29%, and 19%,
respectively, of total production. Furthermore, the company is currently developing the
Merian Project in Suriname, which once in operation (end-2016), will account for
~10% of total production. Inclusive of copper production, the company is further
exposed to Nevada (46.4MM lbs in 2015), Indonesia (458.0MM lbs in 2015), and
Australia (61.4MM lbs in 2015). The company hedges its currency exposure to the
AUD and NZ$. In 2015, 2016, and 2017, the company has hedged 18%, 11%, and 7%
of operating expenses, respectively at 0.98 $/A$, 0.95 $/A$, and 0.93 $/A$, respectively.
Kinross
Kinross’ operations are geographically diverse. Operations are spread across USA,
Brazil, Chile, Russia, and Mauritania, with each region accounting for 25%, 20%, 10%,
20%, and 25% of operations, respectively. According to Kinross, approximately 60%Ǧ70% of the Company’s costs are denominated in U.S. dollars. However, a portion of
operating costs and capital expenditures are denominated in their respective local
currencies. According to the company, 45% of Russian operations, 40% of Chilean
operations, 75% of Brazilian operations, 45% of Ghanaian operations, and 30% of
Mauritanian operations, are denominated in the local currency. As of September 30,
2014, for 2015, the company has hedged US$152MM at 2.42 BRL/USD, US$53MM at
577.36 CLP/USD, US$48MM at 35.88 RUB/USD, and US$45MM at 1.09 CAD/USD.
www.cowen.com10
Cowen and Company
Equity Research February 9, 2015
This report is intended for w
orld-cowen-m
orningnotesdistribution@cow
en.com. U
nauthorized redistribution of this report is prohibited.

Agnico-Eagle
The company’s jurisdictional risk is spread across three countries: Canada, Mexico, and Finland. Agnico-Eagle’s Canadian exposure - 70% of gold production in 2015 – is
the largest among the top six senior producers. The company uses derivative financial
instruments (primarily option and forward contracts) to manage exposure to
fluctuations in by-product metal prices, interest rates and foreign currency exchange
rates and may use such means to manage exposure to certain input costs. As at
September 30, 2014, the company had outstanding foreign exchange zero cost collars,
relating to $72.0MM of 2014 expenditures and $24.0MM of 2015 expenditures.
Figure 9 : Currency Exchange Rate Futures Curve For Select Currencies (as of February 2, 2015)
Source: Cowen and Company, Bloomberg
Yamana
The company’s operations are located across North and South America. South American operations make up ~70-75% of annual production; equity production from
Canadian Malartic, the company’s sole Canadian asset following the recent joint-
acquisition of Osisko, makes up ~20% of annual gold production. Within South
America, Brazil, Argentina, and Chile account for 27%, 10%, and 34% of total
production for 2015. Once Cerro Moro comes online in 2016, gold production from
Argentina will account for 20% of total annual gold production. The company’s operating expenses are incurred in United States Dollars, Brazilian Reals (BRL),
Chilean Pesos (CLP), Argentine Pesos (ARG), Mexican Pesos (MXN) and Canadian
Dollars (CAD). The company is currently engaged in forward contracts to
economically hedge against the risk of an increase in the value of the Brazilian Real,
and Mexican Peso, versus the US Dollar. As of September 30, 2014, for 2015, the
company has hedged US$520MM at 2.28 BRL/USD, and US$65MM at 13.32
MXN/USD.
Brent Oil $99.45 $57.69 $64.96 $69.07 $72.14 $74.57 $76.34
Mexican Peso (MXN) 13.29 15.12 15.49 16.10 16.57 17.03 17.03
Argentine Peso (ARS) 8.11 10.17 14.04 21.08 25.40 31.64 31.64
Canadian Dollar (CAD) 1.10 1.27 1.27 1.26 1.25 1.25 1.25
Peruvian Nuevo Sol. (PEN) 2.80 3.13 3.26 3.41 3.41 3.41 3.41
Australian Dollar (AUD) 1.11 1.30 1.33 1.34 1.35 1.36 1.36
Euro (EUR) 0.75 0.88 0.87 0.85 0.84 0.82 0.82
Brazil Real (BRL) 2.34 2.86 3.14 3.53 3.83 4.13 4.13
S. African Rand (ZAR) 10.83 11.96 12.66 13.76 14.53 15.30 15.30
Chilean Peso (CLP) 569.99 644.18 659.18 678.51 689.05 710.19 710.19
www.cowen.com 11
Cowen and Company
Equity Research February 9, 2015
This report is intended for w
orld-cowen-m
orningnotesdistribution@cow
en.com. U
nauthorized redistribution of this report is prohibited.

Figure 10 : All-In Cost Per Ounce Comparison, 2014E-2020E, For North American Senior Producers
Source: Cowen and Company
Note: All-in Costs calculated as Net Operating Costs After-Byproduct + Capex + SG&A + Exploration + Interest + Tax – By-Product
($1,000)
($500)
$0
$500
$1,000
$1,500
$2,000
2014E 2015E 2016E 2017E 2018E 2019E 2020E
ABX
($1,000)
($500)
$0
$500
$1,000
$1,500
$2,000
2014E 2015E 2016E 2017E 2018E 2019E 2020E
GG
($1,000)
($500)
$0
$500
$1,000
$1,500
$2,000
2014E 2015E 2016E 2017E 2018E 2019E 2020E
AUY
($1,000)
($500)
$0
$500
$1,000
$1,500
$2,000
2014E 2015E 2016E 2017E 2018E 2019E 2020E
KGC
($1,000)
($500)
$0
$500
$1,000
$1,500
$2,000
2014E 2015E 2016E 2017E 2018E 2019E 2020E
AEM
($1,000)
($500)
$0
$500
$1,000
$1,500
$2,000
2014E 2015E 2016E 2017E 2018E 2019E 2020E
NEM
www.cowen.com12
Cowen and Company
Equity Research February 9, 2015
This report is intended for w
orld-cowen-m
orningnotesdistribution@cow
en.com. U
nauthorized redistribution of this report is prohibited.

Figure 11 Leverage As Measured by NAV Sensitivity & Normalized to P/NAV & Stock Price
Source: Cowen and Company
LEVERAGE PER SHARE VS. UNDERLYING COMMODITY
GOLD SILVER COPPER ZINC OIL LEAD MOLYBDENUM
SA 0.96x 0.07x 0.29x 0.01x
NAK 0.24x 0.00x 0.62x 0.08x
TRQ 0.25x 1.04x -0.04x
NG 0.79x 0.35x
SSRI 1.37x 1.07x 0.43x -0.45x 0.11x
ANV 4.59x 2.64x -0.95x
AGI 1.75x 0.03x -0.15x
KGC 3.64x 0.05x 0.00x -0.29x
NEM 3.84x 0.05x 0.36x -0.38x
ABX 4.90x 0.19x 0.28x 0.04x -0.42x
GG 1.99x 0.20x 0.25x 0.13x -0.13x
AEM 3.00x 0.09x 0.02x 0.02x -0.06x
AUY 3.27x 0.28x 0.58x -0.18x
MUX 0.26x 0.19x -0.02x
GUY 1.18x
TGB 0.81x 1.29x
VGZ 4.53x
PZG 2.05x 0.62x
CKG 2.70x 0.81x
SGR 5.90x
PVG 1.24x 0.01x
GGA 3.48x 0.10x
GBU 1.56x 0.07x
PAAS 0.99x 1.99x 0.08x 0.33x -0.31x
AG 0.30x 3.06x 0.45x -0.07x 0.54x
CDE 2.71x 2.72x -0.62x
HL 2.82x 1.71x 1.06x -0.08x 0.62x
GSV 2.56x
GCU 10.62x 0.79x
MAY 3.62x 0.20x
TGD/TMM 2.73x -0.08x
FNV 0.64x 0.06x 0.04x 0.04x
RGLD 0.72x 0.03x 0.04x
SLW 0.43x 0.90x
SAND 0.90x 0.01x
MLX 2.20x -0.01x
www.cowen.com 13
Cowen and Company
Equity Research February 9, 2015
This report is intended for w
orld-cowen-m
orningnotesdistribution@cow
en.com. U
nauthorized redistribution of this report is prohibited.

Figure 12 Emerging & Precious Metal Miners Comparative Analysis
Source: Cowen and Company Estimates; Notes: for rating 1=Outperform, 2=Market Perform, 3=Underperform.
Price USD 2015 YtD Mkt. Net Shares EPS EBITDA ($MM) OP CF Per Share
02/04/15 Perf. Cap($MM) Debt($MM) Out(MM) 2014E 2015E 2016E 2014E 2015E 2016E 2014E 2015E 2016E
Emerging Miners
Chesapeake Gold CKG $1.89 1 $7.87 316.1% $30.09 0.06x 7.1% $89 ($22) 47 $67 ($0.12) ($0.04) ($0.03) ($7) ($7) ($7) ($0.13) ($0.05) ($0.04)
Gabriel Resources GBU $0.58 1 $1.77 204.8% $6.99 0.08x 66.4% $236 $1 408 $237 ($0.02) ($0.02) ($0.04) ($12) ($12) ($12) ($0.01) ($0.01) ($0.02)
Gold Canyon Resources GCU $0.12 1 $0.98 681.5% $7.13 0.02x 22.4% $21 ($24) 166 ($3) ($0.04) ($0.03) ($0.04) ($7) ($7) ($8) ($0.01) ($0.01) ($0.01)
Gold Standard Ventures Corp. GSV $0.48 1 $2.12 339.5% $3.82 0.13x 9.8% $72 $1 149 $71 ($0.03) ($0.02) ($0.03) ($5) ($5) ($5) ($0.02) ($0.01) ($0.02)
Guyana Goldfields GUY $2.33 1 $9.26 298.1% $9.26 0.25x -6.5% $364 $110 156 $474 ($0.06) $0.07 $0.31 ($11) $42 $127 ($0.09) $0.20 $0.68
Meadow Bay Gold MAY $0.10 1 $0.37 285.8% $1.68 0.06x -12.5% $6 $4 67 $11 ($0.02) ($0.01) ($0.01) ($1) ($1) ($1) ($0.02) ($0.01) ($0.02)
Northern Dynasty NAK $0.44 1 $9.16 1980.8% $91.31 0.00x 10.0% $61 ($0) 139 $61 ($0.09) ($0.05) ($0.03) ($10) ($13) ($13) ($0.06) ($0.03) ($0.05)
NovaGold Resources NG $3.82 2 $4.40 15.2% $17.20 0.22x 23.2% $1,386 ($46) 363 $1,340 ($0.13) ($0.12) ($0.11) ($31) ($32) ($33) ($0.03) ($0.04) ($0.04)
Paramount Gold & Silver PZG $1.24 1 $1.59 28.5% $4.06 0.31x 21.6% $200 $83 162 $283 ($0.06) ($0.06) ($0.00) ($9) ($9) $5 ($0.06) ($0.06) $0.03
Pretium Resources Inc. PVG $6.68 1 $20.76 211.0% $35.38 0.19x 8.4% $957 $179 143 $1,135 ($0.14) ($0.27) $0.09 ($10) ($10) $79 ($0.13) ($0.29) $0.16
Seabridge Gold SA $9.15 1 $78.33 756.1% $152.29 0.06x 17.9% $462 ($183) 50 $279 ($0.17) ($0.17) ($0.18) ($12) ($13) ($13) ($0.07) ($0.08) ($0.08)
Vista Gold Corp. VGZ $0.40 1 $3.95 886.3% $6.80 0.06x 37.9% $42 $13 106 $55 ($0.08) ($0.08) ($0.22) ($14) ($14) ($14) ($0.15) ($0.16) ($0.38)
Emerging Miners Average 0.12x 17.1%
Junior Miners
Alamos Gold AGI $5.45 1 $12.64 131.9% $14.93 0.37x -26.0% $759 ($298) 139 $461 ($0.03) $0.09 $0.64 $32 $52 $160 $0.25 $0.41 $1.08
Allied Nevada ANV $1.01 2 $3.71 267.7% $9.21 0.11x 12.2% $133 $482 132 $615 ($0.35) $0.34 ($0.58) $15 $131 $93 $0.21 $0.83 $0.03
Coeur Mining CDE $6.26 1 $8.94 42.7% $9.64 0.65x 18.1% $854 $271 136 $1,125 ($0.98) ($0.21) ($0.19) $58 $140 $175 $0.84 $0.91 $1.15
First Majestic Silver Corp. AG $6.25 2 $6.03 -3.5% $6.03 1.04x 19.7% $774 $38 124 $812 $0.09 $0.05 $0.45 $63 $71 $158 $0.61 $0.61 $1.14
Goldgroup Mining GGA $0.10 1 $0.67 539.3% $2.02 0.05x 12.0% $18 ($31) 169 ($13) ($0.03) $0.07 $0.06 ($3) $17 $15 $0.00 $0.12 $0.11
Hecla Mining HL $3.31 2 $2.77 -16.3% $2.99 1.11x 16.5% $1,223 $349 370 $1,573 ($0.01) $0.01 ($0.00) $122 $137 $131 $0.18 $0.28 $0.27
McEwen Mining MUX $1.23 1 $3.49 184.0% $17.64 0.07x 11.8% $372 ($58) 303 $314 ($0.00) $0.05 $0.13 $0 $24 $73 $0.05 $0.07 $0.21
Metals X Limited MLX $0.93 1 $2.08 125.2% $3.32 0.28x 34.6% $387 ($142) 418 $245 $0.11 $0.12 $0.25 $120 $141 $239 $0.25 $0.28 $0.47
Pan American Silver Corp. PAAS $11.71 2 $10.77 -8.0% $16.07 0.73x 22.4% $1,877 ($169) 160 $1,708 $0.03 ($0.06) $0.14 $127 $156 $152 $0.89 $0.77 $0.98
San Gold SGR $0.03 2 $0.22 581.0% $0.49 0.07x 26.4% $17 $44 515 $60 ($0.08) ($0.07) ($0.07) ($4) $3 $11 $0.01 $0.02 $0.03
Silver Standard Resources SSRI $6.20 1 $16.20 161.3% $20.65 0.30x 17.4% $514 $44 83 $558 ($0.24) $0.43 $0.49 ($5) $49 $49 $0.17 $0.88 $0.94
Taseko Mines Ltd. TGB $0.77 1 $1.75 128.2% $16.45 0.05x -27.1% $170 $263 222 $433 ($0.12) ($0.02) ($0.36) $10 $47 ($48) $0.08 $0.22 ($0.12)
Timmins Gold Corp TMM.CN $1.08 1 $2.90 168.8% $3.70 0.29x 1.8% $195 ($66) 181 $129 $0.07 $0.15 $0.12 $44 $76 $70 $0.26 $0.27 $0.32
Turquoise Hill TRQ $2.88 1 $13.34 363.2% $16.63 0.17x -11.9% $5,792 $52 2011 $5,844 $0.18 $0.15 $0.02 $71 $879 $288 $0.02 $0.36 $0.14
Junior Miners Average 0.38x 9.1%
Senior Miners
Agnico-Eagle AEM $34.34 2 $27.19 -20.8% $33.22 1.03x 25.1% $7,164 $811 209 $7,975 $0.49 $1.58 $1.43 $657 $1,102 $1,110 $2.64 $4.38 $4.33
Barrick Gold ABX $12.78 2 $9.59 -24.9% $12.83 1.00x 17.1% $14,972 $9,018 1172 $23,990 $0.51 $1.02 $1.16 $3,820 $4,709 $5,060 $2.42 $1.83 $2.01
Goldcorp GG $24.22 2 $19.85 -18.0% $21.19 1.14x 28.6% $20,175 $1,299 833 $21,474 $0.82 $1.05 $1.40 $2,023 $2,505 $2,956 $1.75 $2.38 $2.83
Kinross Gold KGC $3.42 2 $4.68 36.9% $6.46 0.53x 17.9% $3,946 $206 1154 $4,153 $0.04 $0.27 $0.34 $1,118 $1,373 $1,493 $0.79 $0.96 $1.03
Newmont Mining NEM $25.00 1 $28.97 15.9% $33.37 0.75x 29.3% $12,475 $2,748 499 $15,223 $1.59 $1.43 $1.71 $2,501 $3,066 $3,367 $3.02 $4.42 $4.91
Yamana Gold AUY $4.17 1 $6.01 44.0% $7.63 0.55x 4.0% $3,663 $1,070 878 $4,733 $0.04 $0.28 $0.25 $681 $1,157 $1,178 $0.71 $1.14 $1.17
Senior Miners Average 0.83x 20.3%
Franco Nevada FNV $59.27 2 $47.35 -20.1% 59.99 0.99x 20.8% $9,313 ($788) 157 $8,525 $1.18 $1.07 $1.08 $461 $421 $430 $2.43 $2.22 $2.23
Royal Gold RGLD $72.11 1 $86.85 20.4% 96.60 0.75x 12.1% $4,694 ($362) 65 $4,333 $0.96 $1.33 $2.19 $200 $248 $354 $2.26 $3.29 $4.59
Silver Wheaton SLW $23.15 2 $22.46 -3.0% 26.04 0.89x 11.1% $8,295 $902 358 $9,197 $0.68 $0.68 $0.76 $411 $428 $469 $0.97 $0.82 $0.86
Sandstorm Gold SAND $3.99 1 $5.09 27.8% $7.80 0.51x 6.6% $474 ($99) 119 $375 $0.10 $0.01 $0.03 $31 $27 $28 $0.26 $0.23 $0.24
Royalty Company Average 0.78x 12.6%
Company Ticker Mkt Price
/NAV NAV
12-mo Tgt
Price
Upside to
TP Rating EV ($MM)
www.cowen.com14
Cowen and Company
Equity Research February 9, 2015
This report is intended for w
orld-cowen-m
orningnotesdistribution@cow
en.com. U
nauthorized redistribution of this report is prohibited.

The following is an excerpt
from our previously published report,
Miners Benefit From Lower Oil Price,
dated January 20, 2015.
(link to full report & disclosures)
www.cowen.com 15
Cowen and Company
Equity Research February 9, 2015
This report is intended for w
orld-cowen-m
orningnotesdistribution@cow
en.com. U
nauthorized redistribution of this report is prohibited.

Equity Research Industry Update
www.cowen.com Please see addendum of this report for important disclosures.
January 20, 2015
■ Metals & Mining: Precious Metals■ Metals & Mining: Emerging Miners Miners Benefit From Lower Oil PriceAdam P. Graf, [email protected]
Misha [email protected]
The Cowen InsightWe believe NEM, KGC and AUY should see cost structure improvement from lowerfuel prices. With a lower exposure to oil price volatility, from lower usage or pricehedging, ABX, GG, and AEM should not see the same benefit. We reiterate NEM asour top pick, as Street does not seem to be factoring in lower oil, a weakening AUD, orlonger-term production growth in estimates.
Lower Oil Price, Lower Op Costs - NEM, KGC, AUY Biggest Beneficiaries
Following up to our note How-To Guide For Playing Oil Price Fluctuations In MoreThan 20 Sectors, NEM, KGC, and AUY have the highest leverage to oil prices,and should benefit the most from lower oil prices, versus peers, by our estimates.By contrast, ABX, GG, and AEM show least earnings and valuation leverage tofuel price, therefore unlikely to see a similar benefit to cost structure. Lower oilespecially benefits those heavier-weighted in fuel-driven machinery-intensive open-pit operations. By our estimates, for NEM, KGC, and AUY, every $10/bbl decrease inoil price should lower operating costs by $28/oz, $38/oz, and over $23/oz, respectively.Earnings in 2015 would be positively impacted by $0.16/sh, $0.06/sh, and $0.03/sh,respectively. Our 2015E EPS estimates for NEM, KGC, and AUY currently stand at$1.58/sh, $0.16/sh, and $0.15/sh, and assume a 2015E oil price average of ~$60/bbl, atthe current forward curve for oil prices.
NEM Benefits From AUD and Higher Copper Production; Street Doesn't SeemTo Notice
We believe NEM to be best-positioned in 2015 on cost improvement, versus peers.Specifically, in 2015, in addition to lower fuel prices, we expect NEM operations tobenefit from 1) operating cost management, 2) a weakening USD/AUD, and 3) an 85%improvement in by-product copper production. Compared to the average 2014 USD/AUD exchange rate, the 2015 forward curve results in a positive ~$0.17/sh impact onEPS (12% change USD/AUD vs. 2014). As we point out in our note 2015 Top Picks,Updating Target Prices, we expect lower y/y operating costs to drive margin growth;adding ~$0.50/sh to EPS. These positive margin impacts, driven by the forward curvesfor oil and currency, are embedded into our 2015 and 2016 EPS estimates of $1.58/shand $1.86/sh, respectively. Our EPS estimates are currently above Street consensusestimates of $0.96/sh and $1.26/sh, respectively; we believe consensus earnings havenot yet adjusted for margin expansion or 2016-2018 growth.
What's More, We Expect All Miners To Earn FCF in 2015
As we mention in our December Quarterly Cost Piece, we expect North Americansenior gold producers to be able to achieve free cash flows from operations in 2015.Miners have re-positioned themselves for the current metals price environment, withoperations largely reconfigured to be operating cash flow positive at gold pricesabove $1,000-$1,100/oz. While the increasing spending trend may indicate growingmanagement confidence, aggregate capital spending across seniors still appears todecline in 2015E, with the largest declines expected from ABX, GG, AUY, and KGC,offset by capital spending increases expected from NEM and AEM.
www.cowen.com16
Cowen and Company
Equity Research February 9, 2015
This report is intended for w
orld-cowen-m
orningnotesdistribution@cow
en.com. U
nauthorized redistribution of this report is prohibited.

The Effect of Oil Price on Gold Miners
We have reviewed asset-by-asset operating cost sensitivity to oil for the large North
American gold miners. By our estimates, Newmont Mining, Yamana Gold, and
Kinross Gold appear to demonstrate a higher degree of EPS and operating cost
exposure (leverage) to changes in oil prices, versus peers. Thus, shares would be in a
better position to benefit more from lower oil prices. By contrast, for Goldcorp and
Agnico-Eagle, oil appears to account for a much smaller percentage of operating
costs, or is subject to a greater degree of federally regulated pricing. In the case of
ABX, oil price sensitivity has been muted with its ~47% usage hedged at $85/bbl oil
for the next 3 years. We update our estimates weekly for the latest changes in metal
price, currencies, and oil price.
Figure 1 : Impact on EPS for every $10/bbl change in Oil Price
Source: Cowen and Company
Figure 2 : Impact on NAV for every $10/bbl change in Oil Price
Source: Cowen and Company
We have revised our estimates compared to our contribution to the multi-sector note
on oil by Cowen on January 15. Similar to EPS sensitivity, the large open-pit miners:
NEM, KGC, and ABX have a higher degree of leverage to oil prices, vs. more
underground focused miners (AEM, AUY, GG). This greater impact NAV vs. EPS for
Barrick is due to the longer-term nature of the NAV calculation, which is less sensitive
to the impact of their oil hedge program.
Company
2015E EPS Estimate
(Cowen)
Change in EPS per
$10/bbl Change in Oil
ABX $1.22 $0.02
GG $0.82 $0.03
NEM $1.58 $0.16
KGC $0.16 $0.06
AEM $1.22 $0.05
AUY $0.15 $0.03
Company
2015E NAVPS
Estimate (Cowen)
Change to NAVPS
per $10/bbl Change
ABX $17.71 $0.85
GG $20.16 $0.45
NEM $30.44 $2.19
KGC $6.21 $0.33
AEM $29.86 $0.32
AUY $8.43 $0.24
www.cowen.com 17
Cowen and Company
Equity Research February 9, 2015
This report is intended for w
orld-cowen-m
orningnotesdistribution@cow
en.com. U
nauthorized redistribution of this report is prohibited.

Barrick
While production from open-pit mines account for approximately 75% of Barrick‘s operations, the costs and earnings will only see a limited benefit from the recent
decline in global oil price, due to a hedging program in which ~47% of oil usage has
been hedged at $85/bbl oil for the next 3 years (according to ABX’s most recent 10-
Q). Approximately 40% of the company’s production is tied to U.S. operations. Operations are exposed to Peruvian, Argentine, and Australian currencies, and South
American and Australian operations account for 20% of operations each. Weaker
commodity currencies vs. the USD should further reduce the company’s consolidated cost structure.
Goldcorp
Goldcorp’s annual production is split fairly evenly between open-pit and underground
ounces. The company’s exposure to underground ounces allows the company’s operations to stay relatively insulated to oil price volatility; by our estimates, every
$10/bbl move in the price of oil will result in an opposite ~$12/oz change in operating
expenses, one of the lowest versus peers. Goldcorp’s other primary exposures include those tied to the Canadian Dollar and Mexican Peso. Diesel prices in Mexico are
federally controlled. Consequently, there is little in the way of near-term positive
impact of lower oil prices on GG’s open pit operations there. Approximately 40% of
the company’s production comes from Canadian operations; approximately 30% of production is tied to Mexican operations. With Cerro Negro now online, Argentinian
operations represent roughly 18% of longer-term production volumes.
Figure 3 : 2015E-2016E EPS Comparison, Cowen versus Street
Source: Cowen and Company
2015E 2016E
Cowen $1.22 $1.32
Street $0.75 $0.91
Cowen $0.82 $1.21
Street $0.80 $1.03
Cowen $1.58 $1.86
Street $0.96 $1.26
Cowen $0.16 $0.16
Street $0.09 $0.12
Cowen $1.22 $1.02
Street $0.76 $1.11
Cowen $0.15 $0.13
Street $0.17 $0.29
ABX
AEM
GG
KGC
NEM
AUY
www.cowen.com18
Cowen and Company
Equity Research February 9, 2015
This report is intended for w
orld-cowen-m
orningnotesdistribution@cow
en.com. U
nauthorized redistribution of this report is prohibited.

Newmont
Newmont is one of the highest-exposed to oil prices among peers. With production
from open-pit operations accounting for over 80% of its annual output, NEM’s
business is relatively heavily impacted by shifts in oil price. To help mitigate this risk,
the company engages in oil hedging at its Nevada operations. Nevada operations are
58%, 33%, and 12% hedged in 2015, 2016, and 2017, respectively. In 2015, we estimate
that every $10/bbl decrease in the price of oil would correspond to close to $30/oz of
margin growth. At an average 2015E oil price of $60/bbl, NEM’s all-in cash costs after
by-product credits are expected to total around $1,080/oz. According to the company,
every $10/bbl decrease in the price of oil would allow for an additional $40MM in FCF.
Figure 4 : Impact on 2015E Cash Costs for North American Senior Gold Producers, Per $10/bbl Change in Oil Price
Source: Cowen and Company
Kinross
Kinross is one of the most exposed to fluctuations in oil price, versus peers; ~70% of
production is attributable to open-pit operations. Further, the company’s Kupol and Dvoinoye mines, located in Russia, and its Tasiast mine in Mauritania operate solely
off of diesel powered generators. The combination of a large percentage of open pit
mines, and diesel sourced electrical power, result in high oil price exposure vs. its
peers. We estimate that a $10/bbl decrease in the price of oil corresponds to a
~$40/oz decrease in production costs. Kinross manages oil price volatility by hedging
roughly 25% of its near-term exposure. Fuel deliveries to remote operations are made
once a year. Consequently, those operations will be booking the use of higher cost
fuel until new deliveries are made. In 2013, management estimates that over 1.6MM
bbls of oil equivalent were used in operations. Kinross’ operations are geographically diverse. Operations are spread across USA, Brazil, Chile, Russia, and Mauritania, with
each region accounting for 25%, 20%, 10%, 20%, and 25% of operations, respectively.
According to Kinross, approximately 60%Ǧ70% of the Company’s costs are
denominated in U.S. dollars.
$-
$5
$10
$15
$20
$25
$30
$35
$40
$45
ABX GG NEM KGC AEM AUY
$/oz
Au
www.cowen.com 19
Cowen and Company
Equity Research February 9, 2015
This report is intended for w
orld-cowen-m
orningnotesdistribution@cow
en.com. U
nauthorized redistribution of this report is prohibited.

Agnico-Eagle
Agnico-Eagle is known to be one of the most experienced underground operators
among peers. Five out of its nine operations are underground; in 2015, production
from these mines is expected to account for 46% of the company’s annual output. Larger oil consuming operations include Canadian Malartic, Meadowbank, and La
India open pit operations. At the remote Meadowbank operation (and likely will also
be the case for AEM’s Meliadine project), power is generated using diesel, and fuel is delivered once a year. Management estimates that Canadian Malartic uses 50MM
liters of diesel per year. However at the company’s La India operations in Mexico (as well as Kittila operations in Finland) purchase fuel at a federally regulated price. Thus
these operations will also not see a near-term benefit cost structure. Operating costs
are also exposed to fluctuations in the USD/CAD, as Canadian operations account for
~70% of the company’s annual gold production. In 2015 we expect all-in sustaining
costs to decline y/y to ~$1,000/oz, rising steadily thereafter due to rising capital
expenditures. We estimate capital expenditures will rise to fund Meliadine coming
online around 2019.
Yamana
Approximately 60% of the company’s annual gold production is attributable to
underground operations. Nevertheless in 2015, by our model, AUY shows a relatively
large cost-per-ounce impact to fluctuations in oil price, in part due to the large
exposure of the cost structure to by-product credits produced from open-pit
operations. The company’s operations are located across North and South America. South American operations make up ~70-75% of annual production; equity
production from Canadian Malartic, the company’s sole Canadian asset following the
recent joint-acquisition of Osisko, makes up ~20% of annual production.
www.cowen.com20
Cowen and Company
Equity Research February 9, 2015
This report is intended for w
orld-cowen-m
orningnotesdistribution@cow
en.com. U
nauthorized redistribution of this report is prohibited.
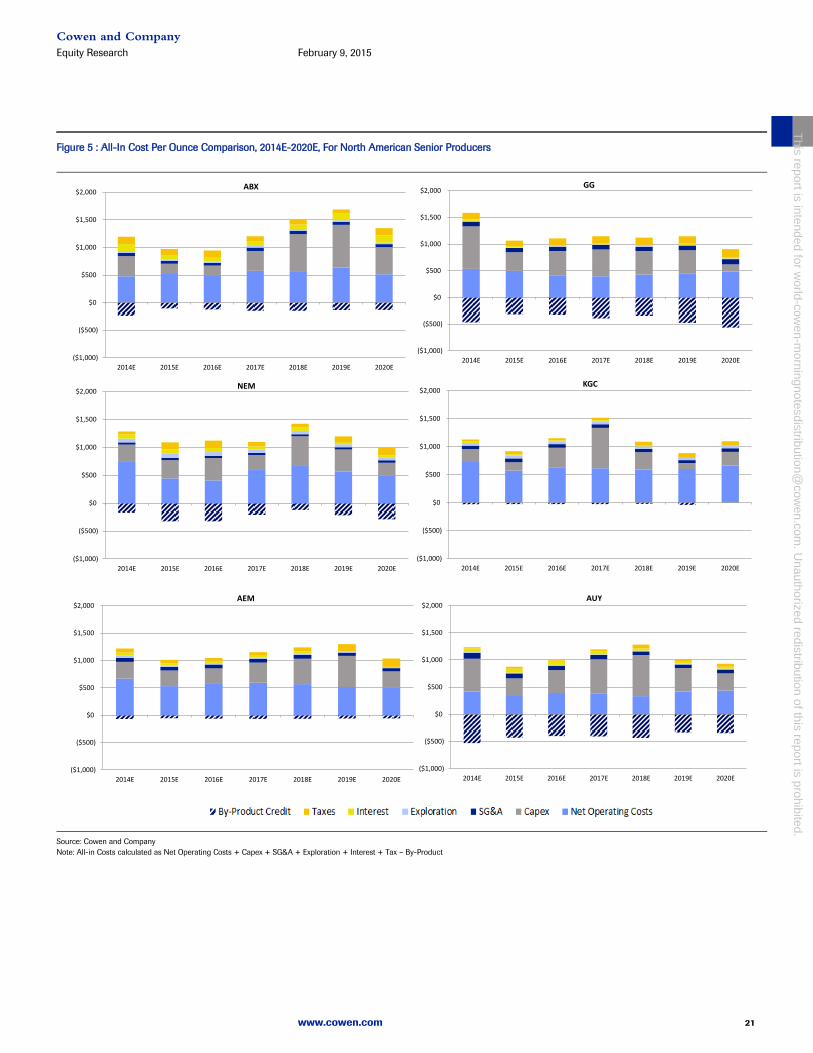
Figure 5 : All-In Cost Per Ounce Comparison, 2014E-2020E, For North American Senior Producers
Source: Cowen and Company
Note: All-in Costs calculated as Net Operating Costs + Capex + SG&A + Exploration + Interest + Tax – By-Product
($1,000)
($500)
$0
$500
$1,000
$1,500
$2,000
2014E 2015E 2016E 2017E 2018E 2019E 2020E
ABX
($1,000)
($500)
$0
$500
$1,000
$1,500
$2,000
2014E 2015E 2016E 2017E 2018E 2019E 2020E
GG
($1,000)
($500)
$0
$500
$1,000
$1,500
$2,000
2014E 2015E 2016E 2017E 2018E 2019E 2020E
AUY
($1,000)
($500)
$0
$500
$1,000
$1,500
$2,000
2014E 2015E 2016E 2017E 2018E 2019E 2020E
KGC
($1,000)
($500)
$0
$500
$1,000
$1,500
$2,000
2014E 2015E 2016E 2017E 2018E 2019E 2020E
AEM
($1,000)
($500)
$0
$500
$1,000
$1,500
$2,000
2014E 2015E 2016E 2017E 2018E 2019E 2020E
NEM
www.cowen.com 21
Cowen and Company
Equity Research February 9, 2015
This report is intended for w
orld-cowen-m
orningnotesdistribution@cow
en.com. U
nauthorized redistribution of this report is prohibited.

Overview of Oil Dependency in Mining Operations
Diesel fuel is the principle fuel used in mining operations to operate heavy equipment.
In addition, ANFO (ammonium nitrate + fuel oil) is the principle explosive used in
mining, for which HSD (High Speed Diesel) is a major component. Thus oil and its
derivatives are a major overall component of mining costs. In addition, remote
operations often generate electrical power by the use of diesel power generators.
Depending on the type and extent of crushing and processing, electrical power may
be the largest component of processing costs. Finally, for mines that produce
intermediate products, such as copper concentrate, beneficiated coal or iron ore, etc,
significant transportation costs may be involved in moving volumes to the customer,
again often relying on diesel fueled transport (trains, trucks, ship).
Open-pit operations generally require a much higher degree of fuel consumption than
do underground operations, due to the increased use of fuel-powered machinery and
hauling equipment, and larger volumes of lower grade ore. We estimate that diesel
and ANFO make up roughly 35%-40% open-pit mining costs. Underground mines, by
contrast, generally move much less material by truck, but have significantly higher
electrical and explosive costs as a percentage of cost structure. We estimate that
diesel make up roughly 13%-17% of underground mining costs. For remote
underground operations that are not connected to the power grid, and instead rely on
diesel power generators, we estimate diesel generated power could comprise another
10%-16% of mining costs. Electrical use in underground mining may include
electricity to power airflow, pumping, lighting, ventilation, and hauling miners and
materials.
Figure 6 : 2015 Estimated Break-Out Of Gold Ounces From Open Pit (O/P) Mines, Versus Underground (U/G)
Source: Cowen and Company
After the ore is mined, ore processing operations are frequently very power intensive,
as they may involve conveying, crushing, grinding, and pumping of heavy materials.
The average North American mine spends 17%-26% of processing costs on electricity.
0%
10%
20%
30%
40%
50%
60%
70%
80%
90%
100%
ABX GG NEM KGC AEM AUY
Underground Ounces Open-Pit Ounces
www.cowen.com22
Cowen and Company
Equity Research February 9, 2015
This report is intended for w
orld-cowen-m
orningnotesdistribution@cow
en.com. U
nauthorized redistribution of this report is prohibited.

We estimate that diesel generated power could comprise up to 50% of processing
costs for a remote mine without grid access. Some miners break-out energy usage as
a percentage of total operating costs; Goldcorp, for example, states that fuel charges
make-up roughly 9% of operating costs, company-wide.
We have attempted to determine the positive leverage of the large North American
gold miners to lower oil (diesel) price. Barrick, Goldcorp, Newmont, and Kinross have
the highest exposure to open-pit mining, based on total tons of ore processed.
However, this can be somewhat misleading. For instance, in 2015, 90% of Goldcorp’s processed tons will have corresponded to open-pit mining activities. However, by our
model, GG’s open-pit operations provide only 56% of its total estimated production of
gold ounces, meaning oil prices should have a lower impact per ounce produced.
Mining companies’ exposure to fuel exists in its mining operations, and therefore impact operating costs. Simply put, lower oil will correspond to lower operating costs,
therefore helping to expand margins. As is consistent with our methodology, our
forward looking oil price assumptions use the forward curve for Brent oil price. Our
model is updated weekly to reflect a dynamic futures curve for the commodities that
drive our model. As of January 12, 2015, the futures curve for crude oil assumes an
average price of ~$60/bbl in 2015, rising steadily y/y to ~$80/bbl by 2021.
Gold and Oil – Historically Volatile Relationship
Figure 7 : Gold/Oil Historic Ratio
Source: Cowen and Company, Bloomberg
Over the last 45 years, we see a broad longer-term relationship between gold and oil
price, and a great deal of shorter-term volatility. Both commodities fluctuate based on
different market forces, and as such, it is difficult to predict the movement of gold
price based on a movement in oil. As oil is a major component of the mining cost
structure, gold miners should outperform base metal producer when the gold to oil
ratio is high, but underperform base metal miners when the ratio is low and oil looks
expensive relative to gold.
0
5
10
15
20
25
30
35
Dec
-70
Dec
-72
Dec
-74
Dec
-76
Dec
-78
Dec
-80
Dec
-82
Dec
-84
Dec
-86
Dec
-88
Dec
-90
Dec
-92
Dec
-94
Dec
-96
Dec
-98
Dec
-00
Dec
-02
Dec
-04
Dec
-06
Dec
-08
Dec
-10
Dec
-12
Dec
-14
Gol
d/O
il ra
tio
Gold/Oil Historic Ratio
Au/Oil Ratio Mean Std_above Std_below
Oil Cheaper
Oil Richer
www.cowen.com 23
Cowen and Company
Equity Research February 9, 2015
This report is intended for w
orld-cowen-m
orningnotesdistribution@cow
en.com. U
nauthorized redistribution of this report is prohibited.

This page left blank intentionally.
www.cowen.com24
Cowen and Company
Equity Research February 9, 2015
This report is intended for w
orld-cowen-m
orningnotesdistribution@cow
en.com. U
nauthorized redistribution of this report is prohibited.

Ticker Rating Price* Price Target
AEM • Market Perform $34.56 $27.19ANV • Market Perform $1.05 $3.71CKG.CN • Outperform C$2.30 C$7.87AG • Market Perform $6.32 $6.03GBU.CN • Outperform $0.73 $1.77GG • Market Perform $24.53 $19.85GSV • Outperform $0.51 $2.12HL • Market Perform $3.40 $2.77MUX • Outperform $1.19 $3.49MLX.AU • Outperform AUD1.20 AUD2.08NAK • Outperform $0.64 $9.16PAAS • Market Perform $11.94 $10.77PVG.CN • Outperform C$8.59 C$20.76SAND Outperform $4.10 $5.09SA • Outperform $9.09 $78.33SLW • Market Perform $23.33 $22.46TMM.CN • Outperform C$1.31 C$2.90VGZ • Outperform $0.38 $3.95
Ticker Rating Price* Price Target
AGI • Outperform $5.77 $12.64ABX • Market Perform $13.06 $9.59CDE • Outperform $7.23 $8.94FNV • Market Perform $57.30 $47.35GCU.CN Outperform C$0.17 C$0.98GGA.CN Outperform C$0.13 C$0.67GUY.CN • Outperform C$3.21 C$9.26KGC • Market Perform $3.43 $4.68MAY.CN • Outperform C$0.14 C$0.37NEM • Outperform $24.82 $28.97NG • Market Perform $4.09 $4.40PZG • Outperform $1.44 $1.59RGLD • Outperform $72.51 $86.85SGR.CN Market Perform C$0.04 C$0.22SSRI • Outperform $6.14 $16.20TGB • Outperform $0.80 $1.75TRQ • Outperform $3.13 $13.34AUY • Outperform $4.48 $6.01
*As of 02/05/2015
■ Rating and/or Price Target Change
Valuation Methodology And RisksValuation Methodology
Precious Metals:In the Precious Metals and Emerging Miners space, we utilize NAV methodology(income approach) to value developing and operational mining plays as this methodencompasses key variables such as: price, operating costs, up-front capital, mine life,time-value of money, and the corporate balance sheet. This method allows for thesevariables to change over time.Our individual asset values use Reserves and Resources to determine projectlife. Where possible, forward commodity and exchange rate price strips are usedto generate revenues and modify costs. Costs are built from historic results,modifications of existing studies, or from independent studies of like deposits. Fullcosting (on-site & off-site), stripping ratios, oil price, and currency rates are usedto determine costs per ton. Relatively recent contract smelting and refining terms,payable rates, and shipping rates are used. Estimates of capital expenditures for newprojects or brownfield expansions rely on recent detailed costing studies and variousrules of thumb regarding both upfront and sustaining capital costs. Due to the natureof exploration assets, where key variables have greater uncertainty, the market orcost approaches are generally preferred to the income approach. However, theseapproaches themselves contain a great deal of uncertainty, where value determinationis indirect -- as no two assets are directly comparable, due to intrinsic differencesin geology, land ownership, legal/tax regime, mineralogical potential, and extractioneconomics. In addition, as market conditions and commodity prices change, previousmarket transactions quickly become stale and no longer representative of currentfair-market value. As assets develop and more information is gathered, the cost andmarket approach advantages give way to the income approach which is our primaryvaluation choice.For the market approach, we prefer to use more than one comparable transaction,adjusting transactions to take into account non-comparable factors, and then usinga per-area-unit approach (such as dollars/claim). For the cost approach, we favor thegeoscience matrix approach (Kilburn, 1990) -- where five major criteria (broken into19 parts) are considered to reach a value per claim based on a multiple to- cost perclaim. However, this approach reaches a maximum value per claim, which, at a point,
www.cowen.com 25
Cowen and Company
Equity Research February 9, 2015
This report is intended for w
orld-cowen-m
orningnotesdistribution@cow
en.com. U
nauthorized redistribution of this report is prohibited.

ceases to be representative of successful advances in exploration and development.Early-stage exploration properties may be accounted for using 3% of current in-situvalue. For precious metal dominated development projects, we derive an average“precious metal discount rate” from the market price of the largest precious metalequities we have modeled. Currently, we calculate a discount rate near 10%. Similarly,we determine a “base metal discount rate” by utilizing the 3 large copper producerswe have modeled. Our calculated base metal discount rate is approximately 14%. Goldcompanies usually trade at higher financial multiples and lower discount rates dueto the expected low beta to market of the underlying commodity, which frequentlyleads to the aggressive practice of evaluating gold projects on a zero discount rate.Back calculation of discount rates for large, multi-asset miners supports our view ofdiscount rates, however. Most importantly, 1) we remain agnostic to price forecasting,2) utilize consistent discount rates between projects and companies and 3) presentinvestors with an asset by asset breakdown of NAV. By following this methodologywe avoid personal biases regarding commodity price expectations and relative riskperceptions, thus providing a framework for the investor to apply their own commodityprice views and risk handicaps. Our ratings and price targets are based upon acombination of value and leverage relative to a company’s peer group.Emerging Miners:In the Precious Metals and Emerging Miners space, we utilize NAV methodology(income approach) to value developing and operational mining plays as this methodencompasses key variables such as: price, operating costs, up-front capital, mine life,time-value of money, and the corporate balance sheet. This method allows for thesevariables to change over time.Our individual asset values use Reserves and Resources to determine projectlife. Where possible, forward commodity and exchange rate price strips are usedto generate revenues and modify costs. Costs are built from historic results,modifications of existing studies, or from independent studies of like deposits. Fullcosting (on-site & off-site), stripping ratios, oil price, and currency rates are usedto determine costs per ton. Relatively recent contract smelting and refining terms,payable rates, and shipping rates are used. Estimates of capital expenditures for newprojects or brownfield expansions rely on recent detailed costing studies and variousrules of thumb regarding both upfront and sustaining capital costs. Due to the natureof exploration assets, where key variables have greater uncertainty, the market orcost approaches are generally preferred to the income approach. However, theseapproaches themselves contain a great deal of uncertainty, where value determinationis indirect -- as no two assets are directly comparable, due to intrinsic differencesin geology, land ownership, legal/tax regime, mineralogical potential, and extractioneconomics. In addition, as market conditions and commodity prices change, previousmarket transactions quickly become stale and no longer representative of currentfair-market value. As assets develop and more information is gathered, the cost andmarket approach advantages give way to the income approach which is our primaryvaluation choice.For the market approach, we prefer to use more than one comparable transaction,adjusting transactions to take into account non-comparable factors, and then usinga per-area-unit approach (such as dollars/claim). For the cost approach, we favor thegeoscience matrix approach (Kilburn, 1990) -- where five major criteria (broken into19 parts) are considered to reach a value per claim based on a multiple to- cost perclaim. However, this approach reaches a maximum value per claim, which, at a point,ceases to be representative of successful advances in exploration and development.Early-stage exploration properties may be accounted for using 3% of current in-situvalue. For precious metal dominated development projects, we derive an average“precious metal discount rate” from the market price of the largest precious metalequities we have modeled. Currently, we calculate a discount rate near 10%. Similarly,we determine a “base metal discount rate” by utilizing the 3 large copper producers
www.cowen.com26
Cowen and Company
Equity Research February 9, 2015
This report is intended for w
orld-cowen-m
orningnotesdistribution@cow
en.com. U
nauthorized redistribution of this report is prohibited.

we have modeled. Our calculated base metal discount rate is approximately 14%. Goldcompanies usually trade at higher financial multiples and lower discount rates dueto the expected low beta to market of the underlying commodity, which frequentlyleads to the aggressive practice of evaluating gold projects on a zero discount rate.Back calculation of discount rates for large, multi-asset miners supports our view ofdiscount rates, however. Most importantly, 1) we remain agnostic to price forecasting,2) utilize consistent discount rates between projects and companies and 3) presentinvestors with an asset by asset breakdown of NAV. By following this methodologywe avoid personal biases regarding commodity price expectations and relative riskperceptions, thus providing a framework for the investor to apply their own commodityprice views and risk handicaps. Our ratings and price targets are based upon acombination of value and leverage relative to a company’s peer group.
Investment Risks
Precious Metals:Political Risk: With worldwide assets, miners are subject to significant politicalrisk. Despite compliance with national laws, provincial or local opposition (legalor otherwise) may impact operations. Changing federal laws and regulations maynegatively impact project economics, regardless of prior agreements. Environmentalgroups and other non-governmental organizations may actively pursue tactics (legalor otherwise) that can negatively impact miners.Operational and Technical Risk: The mining industry contends with risks associatedwith large-scale equipment, earth moving operations, and heavily strained processingequipment. These operations are subject to uncertainties that must be recognizedand managed to avoid major, and often catastrophic, negative events. All minesare fundamentally unique, and thus dangers must constantly be investigated andmanaged. Similarly, new projects are subject to technical risks, and design flaws mayresult from applying an existing process to a new ore body.Commodity Price Risk: Nearly all commodity-related equities are exposed to changesin the underlying commodity. Investors may seek this exposure for the upsidepotential, but must recognize that leverage cuts both ways. Lower commodity pricescould undoubtedly make attractive projects less economically viable.Market Risk: While the market sentiment toward the group is often tied closely withcommodity prices (and risk), it may also be impacted by business cycle expectationsand general opinion as to the legitimacy of the sector.Financing and Dilution Risk: The cost of financing changes beyond the control of anycompany, and the availability of capital can appear or disappear rapidly. If a minerdoes not access the capital markets when conditions are favorable (either when thestock price is strong or debt is inexpensive), then management might find themselvesshort of capital and forced to take very expensive debt financing or issue equity atvery low prices or risk going bankrupt altogether, both to the detriment of existingshareholders.Royalty Risk in the US and Abroad: Mining companies in the US and abroad may besubject to a changing royalty regime which can negatively impact profitability and/orthe economic viability of developing projects. Currently in the U.S. Congress there aretwo bills. One would impose gross revenue royalties while the other would impose anet revenue royalty. Passage of either bill would prove detrimental to exploration andmining investment in the US.Emerging Miners:Political Risk: With worldwide assets, miners are subject to significant politicalrisk. Despite compliance with national laws, provincial or local opposition (legalor otherwise) may impact operations. Changing federal laws and regulations maynegatively impact project economics, regardless of prior agreements. Environmental
www.cowen.com 27
Cowen and Company
Equity Research February 9, 2015
This report is intended for w
orld-cowen-m
orningnotesdistribution@cow
en.com. U
nauthorized redistribution of this report is prohibited.

groups and other non-governmental organizations may actively pursue tactics (legalor otherwise) that can negatively impact miners.Operational and Technical Risk: The mining industry contends with risks associatedwith large-scale equipment, earth moving operations, and heavily strained processingequipment. These operations are subject to uncertainties that must be recognizedand managed to avoid major, and often catastrophic, negative events. All minesare fundamentally unique, and thus dangers must constantly be investigated andmanaged. Similarly, new projects are subject to technical risks, and design flaws mayresult from applying an existing process to a new ore body.Commodity Price Risk: Nearly all commodity-related equities are exposed to changesin the underlying commodity. Investors may seek this exposure for the upsidepotential, but must recognize that leverage cuts both ways. Lower commodity pricescould undoubtedly make attractive projects less economically viable.Market Risk: While the market sentiment toward the group is often tied closely withcommodity prices (and risk), it may also be impacted by business cycle expectationsand general opinion as to the legitimacy of the sector.Financing and Dilution Risk: The cost of financing changes beyond the control of anycompany, and the availability of capital can appear or disappear rapidly. If a minerdoes not access the capital markets when conditions are favorable (either when thestock price is strong or debt is inexpensive), then management might find themselvesshort of capital and forced to take very expensive debt financing or issue equity atvery low prices or risk going bankrupt altogether, both to the detriment of existingshareholders.Royalty Risk in the US and Abroad: Mining companies in the US and abroad may besubject to a changing royalty regime which can negatively impact profitability and/orthe economic viability of developing projects. Currently in the U.S. Congress there aretwo bills. One would impose gross revenue royalties while the other would impose anet revenue royalty. Passage of either bill would prove detrimental to exploration andmining investment in the US.
www.cowen.com28
Cowen and Company
Equity Research February 9, 2015
This report is intended for w
orld-cowen-m
orningnotesdistribution@cow
en.com. U
nauthorized redistribution of this report is prohibited.

AddendumAnalyst CertificationEach author of this research report hereby certifies that (i) the views expressed in the research report accurately reflect his or her personal views about any and all of the subjectsecurities or issuers, and (ii) no part of his or her compensation was, is, or will be related, directly or indirectly, to the specific recommendations or views expressed in this report.
Important DisclosuresThis report constitutes a compendium report (covers six or more subject companies). As such, Cowen and Company, LLC chooses to provide specific disclosures for the companiesmentioned by reference. To access current disclosures for the all companies in this report, clients should refer to https://cowen.bluematrix.com/sellside/Disclosures.action orcontact your Cowen and Company, LLC representative for additional information.Cowen and Company, LLC compensates research analysts for activities and services intended to benefit the firm's investor clients. Individual compensation determinations forresearch analysts, including the author(s) of this report, are based on a variety of factors, including the overall profitability of the firm and the total revenue derived from all sources,including revenues from investment banking. Cowen and Company, LLC does not compensate research analysts based on specific investment banking transactions.
DisclaimerThis research is for our clients only. Our research is disseminated primarily electronically and, in some cases, in printed form. Research distributed electronically is availablesimultaneously to all Cowen and Company, LLC clients. All published research can be obtained on the Firm's client website, https://cowenlibrary.bluematrix.com/client/library.jsp.Further information on any of the above securities may be obtained from our offices. This report is published solely for information purposes, and is not to be construed as an offerto sell or the solicitation of an offer to buy any security in any state where such an offer or solicitation would be illegal. Other than disclosures relating to Cowen and Company, LLC,the information herein is based on sources we believe to be reliable but is not guaranteed by us and does not purport to be a complete statement or summary of the available data.Any opinions expressed herein are statements of our judgment on this date and are subject to change without notice.
For important disclosures regarding the companies that are the subject of this research report, please contact Compliance Department, Cowen and Company, LLC, 599 LexingtonAvenue, 20th Floor, New York, NY 10022. In addition, the same important disclosures, with the exception of the valuation methods and risks, are available on the Firm's disclosurewebsite at https://cowen.bluematrix.com/sellside/Disclosures.action.
Price Targets: Cowen and Company, LLC assigns price targets on all covered companies unless noted otherwise. The price target for an issuer's stock represents the value thatthe analyst reasonably expects the stock to reach over a performance period of twelve months. The price targets in this report should be considered in the context of all priorpublished Cowen and Company, LLC research reports (including the disclosures in any such report or on the Firm's disclosure website), which may or may not include pricetargets, as well as developments relating to the issuer, its industry and the financial markets. For price target valuation methodology and risks associated with the achievement ofany given price target, please see the analyst's research report publishing such targets.
Notice to UK Investors: This publication is produced by Cowen and Company, LLC which is regulated in the United States by FINRA. It is to be communicated only to personsof a kind described in Articles 19 and 49 of the Financial Services and Markets Act 2000 (Financial Promotion) Order 2005. It must not be further transmitted to any other personwithout our consent.
Copyright, User Agreement and other general information related to this report
© 2015 Cowen and Company, LLC. Member NYSE, FINRA and SIPC. All rights reserved. This research report is prepared for the exclusive use of Cowen clients and may not bereproduced, displayed, modified, distributed, transmitted or disclosed, in whole or in part, or in any form or manner, to others outside your organization without the express priorwritten consent of Cowen. Cowen research reports are distributed simultaneously to all clients eligible to receive such research reports. Any unauthorized use or disclosure isprohibited. Receipt and/or review of this research constitutes your agreement not to reproduce, display, modify, distribute, transmit, or disclose to others outside your organizationthe contents, opinions, conclusion, or information contained in this report (including any investment recommendations, estimates or price targets). All Cowen trademarks displayedin this report are owned by Cowen and may not be used without its prior written consent.
Cowen and Company, LLC. New York (646) 562-1000 Boston (617) 946-3700 San Francisco (415) 646-7200 Chicago (312) 577-2240 Cleveland (440) 331-3531 Atlanta(866) 544-7009 London (affiliate) 44-207-071-7500
COWEN AND COMPANY RATING DEFINITIONS
Cowen and Company Rating System effective May 25, 2013
Outperform (1): The stock is expected to achieve a total positive return of at least 15% over the next 12 months
Market Perform (2): The stock is expected to have a total return that falls between the parameters of an Outperform and Underperform over the next 12 months
Underperform (3): Stock is expected to achieve a total negative return of at least 10% over the next 12 months
Assumption: The expected total return calculation includes anticipated dividend yield
Cowen and Company Rating System until May 25, 2013
Outperform (1): Stock expected to outperform the S&P 500
Neutral (2): Stock expected to perform in line with the S&P 500
Underperform (3): Stock expected to underperform the S&P 500
Assumptions: Time horizon is 12 months; S&P 500 is flat over forecast period
Cowen Securities, formerly known as Dahlman Rose & Company, Rating System until May 25, 2013
Buy – The fundamentals/valuations of the subject company are improving and the investment return is expected to be 5 to 15 percentage points higher than the general marketreturn
Sell – The fundamentals/valuations of the subject company are deteriorating and the investment return is expected to be 5 to 15 percentage points lower than the general marketreturn
Hold – The fundamentals/valuations of the subject company are neither improving nor deteriorating and the investment return is expected to be in line with the general marketreturn
www.cowen.com 29
Cowen and Company
Equity Research February 9, 2015
This report is intended for w
orld-cowen-m
orningnotesdistribution@cow
en.com. U
nauthorized redistribution of this report is prohibited.

Cowen And Company Rating DefinitionsDistribution of Ratings/Investment Banking Services (IB) as of 12/31/14
Rating Count Ratings Distribution Count IB Services/Past 12 Months
Buy (a) 461 60.50% 109 23.64%
Hold (b) 288 37.80% 14 4.86%
Sell (c) 13 1.71% 0 0.00%
(a) Corresponds to "Outperform" rated stocks as defined in Cowen and Company, LLC's rating definitions. (b) Corresponds to "Market Perform" as defined in Cowen and Company,LLC's ratings definitions. (c) Corresponds to "Underperform" as defined in Cowen and Company, LLC's ratings definitions.
Note: "Buy", "Hold" and "Sell" are not terms that Cowen and Company, LLC uses in its ratings system and should not be construed as investment options. Rather, these ratingsterms are used illustratively to comply with FINRA and NYSE regulations.
www.cowen.com30
Cowen and Company
Equity Research February 9, 2015
This report is intended for w
orld-cowen-m
orningnotesdistribution@cow
en.com. U
nauthorized redistribution of this report is prohibited.

Points Of ContactAnalyst Profiles
Adam P. Graf, CFA
New York
646.562.1344
Adam Graf is a senior research analystcovering precious metals & emergingminers. He is a geologist and holds theCFA designation.
Misha Levental
New York
646.562.1410
Misha Levental is an associate coveringprecious metals & emerging miners.He joined Cowen in 2013 through themerger with Dahlman Rose.
Reaching Cowen
Main U.S. Locations
New York
599 Lexington AvenueNew York, NY 10022646.562.1000800.221.5616
Atlanta
3399 Peachtree Road NESuite 417Atlanta, GA 30326866.544.7009
Boston
Two International PlaceBoston, MA 02110617.946.3700800.343.7068
Chicago
181 West Madison StreetSuite 3135Chicago, IL 60602312.577.2240
Cleveland
20006 Detroit RoadSuite 100Rocky River, OH 44116440.331.3531
San Francisco
555 California Street, 5th FloorSan Francisco, CA 94104415.646.7200800.858.9316
International Locations
Cowen InternationalLimited
Cowen and Company (Asia)Limited
London
1 Snowden Street - 11th FloorLondon EC2A 2DQUnited Kingdom44.20.7071.7500
Hong Kong
Suite 1401 Henley BuildingNo. 5 Queens Road CentralCentral, Hong Kong852 3752 2333
@CowenResearch Cowen and Company
www.cowen.com 31
Cowen and Company
Equity Research February 9, 2015
This report is intended for w
orld-cowen-m
orningnotesdistribution@cow
en.com. U
nauthorized redistribution of this report is prohibited.