curis.ku.dkcuris.ku.dk/ws/files/135695372/10.pdf.pdfCapacity Development of the EU and Danish...
64
university of copenhagen Københavns Universitet Capacity development of the EU and Danish fishing fleets Lindebo, Hans Erik Publication date: 2000 Document Version Publisher's PDF, also known as Version of record Citation for published version (APA): Lindebo, E. (2000). Capacity development of the EU and Danish fishing fleets. Statens Jordbrugs- og Fiskeriøkonomiske Institut. SJFI Working Paper, No. 10/2000 Download date: 08. Jun. 2018
-
Upload
vuonghuong -
Category
Documents
-
view
218 -
download
5
Transcript of curis.ku.dkcuris.ku.dk/ws/files/135695372/10.pdf.pdfCapacity Development of the EU and Danish...

u n i ve r s i t y o f co pe n h ag e n
Københavns Universitet
Capacity development of the EU and Danish fishing fleets
Lindebo, Hans Erik
Publication date:2000
Document VersionPublisher's PDF, also known as Version of record
Citation for published version (APA):Lindebo, E. (2000). Capacity development of the EU and Danish fishing fleets. Statens Jordbrugs- ogFiskeriøkonomiske Institut. SJFI Working Paper, No. 10/2000
Download date: 08. Jun. 2018

Capacity Development of the EU and Danish Fishing Fleets
Erik Lindebo
SJFI – Working Paper no. 10/2000

Capacity Development of the EU and Danish Fishing Fleets
Erik Lindebo∗ Danish Institute of Agricultural and Fisheries Economics (SJFI)
Fisheries Economics and Management Division E-mail: [email protected]
November 2000
Abstract
The fishing capacity issue has lately received considerable global attention. The application
of an embracing structural policy in the European Union (EU) during the 1980’s and 90’s
has indicated the desire of fisheries managers and administrators to rebalance the level of
capacity of fishing fleets with resource availability. The resulting effect of this structural
policy on fleet development is reviewed.
The Danish administration has sought to structurally adjust the national fishing fleet under
the guidance of the EU structural policy framework. The means by which administrators
measure and register fishing capacity are considered. National capacity regulations and
adjustment policies, including vessel removal, construction and modernisation, are
assessed for the 1992-99 period. The impact of these regulations and policies on the
national fleet size and structure is analysed for the same period, as well as examining the
resulting capital (insurance value) development. Future issues concerning the national
capacity adjustment policy are reviewed.
Keywords: Fishing capacity, overcapacity, capacity regulation, capacity adjustment policy, capacity development, insurance values, EU and Danish fishing fleets.
∗ The author is grateful to Lars Christensen Clink, Henrik Haarh, Martin Jørgensen, and numerous staff at
the Directorate of Fisheries for assistance with Danish fleet data and regulatory information. Any shortcomings of the paper, however, remain the responsibility of the author.

- 2 -
Contents:
1. Introduction .......................................................................................................... 5 1.1 The fishing capacity concept .................................................................... 5 1.2 Identifying overcapacity ........................................................................... 6 2. Global overview ................................................................................................... 8 3. European Union ................................................................................................. 10 3.1 Capacity measurement ............................................................................ 10 3.2 Community register of fishing vessels..................................................... 11 3.3 Capacity adjustment policy ..................................................................... 12 3.3.1 Framework ................................................................................... 12 3.3.2 Vessel decommissioning ............................................................. 13 3.3.3 Effort reduction ............................................................................ 14 3.3.4 Vessel construction and modernisation ....................................... 15 3.4 Capacity development ............................................................................. 15 3.5 Financing of capacity adjustment ........................................................... 17 3.6 Reviewing the MAGP ............................................................................. 19 4. Denmark ............................................................................................................. 22 4.1 Capacity measurement ............................................................................ 22 4.2 The fishing vessel register ...................................................................... 23 4.3 Capacity adjustment requirement ............................................................ 23 4.4 MAGP III and IV (1992-2001) ............................................................... 25 4.4.1 Fleet segmentation ....................................................................... 25
4.4.2 Fleet reduction rates ..................................................................... 25 4.4.3 Capacity development ................................................................. 26 4.5 National capacity guidelines and regulations (1992-99) ........................ 27 4.5.1 Guidelines 1992-94 ...................................................................... 28 4.5.2 Guidelines 1995-96 ...................................................................... 28 4.5.3 Regulations 1997-99 .................................................................... 29 4.6 Capacity adjustment (1992-99) ............................................................... 31 4.6.1 Vessel removal ............................................................................. 31 4.6.2 Vessel construction ...................................................................... 32 4.6.3 Vessel modernisation ................................................................... 33 4.7 Capacity adjustment (1992-99) – Results ............................................... 33 4.8 Financing of capacity adjustment ........................................................... 37 4.9 Capital development (1992-99) .............................................................. 39 4.10 Future issues ............................................................................................ 42

- 3 -
Appendix A. Classification of stocks ....................................................................... 44 Appendix B. Danish objectives of MAGP IV ........................................................... 45 Appendix C. Danish MAGP III and IV results ......................................................... 46 Appendix D. Danish capacity adjustment – Results .................................................. 48 Appendix E. Capital development ............................................................................ 51 List of Tables and Figures .......................................................................................... 52 Acronyms and Exchange rate ..................................................................................... 53 References .................................................................................................................. 54

- 4 -

- 5 -
1. Introduction
The exploitation of common pool fish stocks is traditionally characterised by externality problems among fishers, where a fisher’s individual production function is interdependent, with his/her realised catch depending on the catches of other fishers. Because fishers do not have the incentives to conserve fish stocks, they tend to over-invest in capital to harvest fish in a ‘race to fish’ behaviour. The theory of fisheries economics1 indicates that fisheries can be regulated efficiently if market forces are allowed to dictate the evolution of fishing fleets, discouraging the competitive build-up of excess capacity. A management strategy that is based on output constraints and the internalisation of externality problems, through the use of landing taxation and individual property rights for example, would lead to a gradual optimisation of fleet capacity. The majority of global fisheries are, however, managed under regulated open access conditions, where management strategies are based on problematic input control measures. These measures fail to address the externality problem and, hence, management has been forced to address the issues of fishing capacity and overcapacity in order to implement fleet adjustment programmes that aim to optimise fleet capacity levels. As a result, to create effective adjustment programmes one has to be able to correctly define and measure fishing capacity and ensure that the concept can be correctly linked to the concepts of fishing effort and fishing mortality, traditional concepts that management measures are often based upon.
This paper aims to address fishing capacity and overcapacity and analyse the structural adjustment policies that have been in place during the 1992-99 period, examining their impact on the capacity structure of EU and Danish fishing fleets.
1.1 The fishing capacity concept
Conflicting definitions and measures of fishing capacity often prevail as a result of economic, biological and technical impartiality. These definitions and measures have also often been adopted to agree with objectives of fisheries managers. In order to assist a global recognition of the fishing capacity issue, the FAO initiated an extensive consultation programme in 1998 in order to discuss the many conflicting definitions of fishing capacity and the possible means of measuring and managing fishing capacity. There has, as a result, been a recent increase in available research literature.
1 See Cunningham, Dunn & Whitmarsh (1985)

- 6 -
Capacity has tended to be more often than not expressed in relatively simple and easily monitored technological (input) terms. These could include number of vessels, physical characteristics of vessels, gear and fishing methods used, and the time available for fishing. However, capacity has also been defined in terms of catch (output) or in economic terms (e.g. capital costs). Defining capacity in economic terms has been less widely used due to the relatively large demand for data collection. The use of an output definition may, however, be more applicable on a global basis. Indeed, the current FAO initiative seeks national managers and administrators to measure fishing capacity in output terms, where: “Fishing capacity is the maximum amount of fish over a period of time that can be
produced by a fishing fleet if fully utilised, given the biomass and age structure of the fish
stock and the present state of the technology” (FAO 1998, p 10). Defining a standardised measurement for global or regional comparison was the focus of a recent FAO Technical Consultation in 1999. It is hoped that the resulting documents will assist to harmonise capacity measurement on a global scale.
1.2 Identifying fishing overcapacity
Overcapacity is evident in many global fisheries today. Porter (1998) discusses that biologically, overcapacity can be thought of as a level of capacity that, when fully utilised, produces a level of fishing mortality that threatens to reduce the fish stock biomass below the maximum sustainable yield (MSY). From an economic perspective, overcapacity can be defined as a fully utilised fishing capacity that reduces yield below the maximum economic yield (MEY). The extent of overcapacity can be estimated by accounting for the difference between the current potential capacity of the fleet and that of a defined optimal fleet capacity. However, the estimation of an optimal level will be fishery specific and the contrasting perceptions of biologists, economists, fisheries managers and politicians will affect the optimal capacity level that is used to assess overcapacity. For example, an optimal level may be determined in accordance with management objectives that maximise firm profits, supply to markets or regional employment, or those that promote fish stock growth. Holland and Sutinen (1998) state that regardless of which level is chosen, and on what basis, the levels and the mix of variable inputs are expected to change as biological, economic and regulatory conditions change in the fishery. Hence, despite an unaltered fleet size, the potential and optimal capacity levels of the fleet may alter considerably over time.

- 7 -
The optimal level of capacity is often perceived to be a capacity target level of fisheries management. Hence, FAO (1998, p 11) propose a generic definition of target capacity, where: “Target fishing capacity is the maximum amount of fish over a period of time that can be
produced by a fishing fleet if fully utilised, while satisfying fishery management objectives
designed to ensure sustainable fisheries”. The difference between the target capacity (as defined by management) and the current potential fishing capacity of a given fishing fleet would therefore indicate the level of overcapacity that exists. Such an estimate would then allow managers and administrators to set a series of meaningful fleet adjustment targets in order to rebalance fleet capacity with resource availability.

- 8 -
2. Global overview
With regard to marine capture fisheries, Garcia and Newton (1997) point out that 70% of the global resources are overexploited, fully exploited, or are recovering. Grainger and Garcia (1996) also confirm in their global assessment of marine resources that the main stocks are being overexploited. They show that of the 200 major global fisheries, 35% are senescent (declining yields), 25% are mature (exploited at a constant maximum rate), and 40% are still developing (increasing yields). Mace (1997) and FAO (1997) draw on this evidence and identify the key problem afflicting marine resources as being overcapacity. Over the 1970-90 period, global harvesting capacity grew at a rate eight times greater than the growth of landings of global capture fisheries. This is a remarkable trend considering that financial losses have been significant during this expansion. This development has apparently been sustainable only through extensive government subsidies, with Milazzo (1998) estimating annual subsidies to be in the range of US$ 14-20 billion, amounting to some 17-25% of the industry’s revenues. The size of the global fishing fleet is monitored by the FAO and Lloyds Register of Ships databases. FAO fleet statistics show that the fleet size for decked vessels increased from 0.6 million vessels in 1970, to 1.0 million in 1985, and to 1.2 million in 1990 and 1995 (Greboval 1999). Over the last 15 years, the Chinese fishing fleet has seen a continuous increase in vessel number and tonnage and now represents about a third of the global decked fleet recorded by FAO. This increase has been compensated by a significant decrease in vessel number in other countries, leading to a relatively stable fleet size overall. Fitzpatrick and Newton (1998) further draw on FAO statistics to show that gross tonnage of the global fleet increased from 26 to 26.7 million gross registered tonnage during the 1992-97 period. Only a limited amount of empirical work has been undertaken to assess the extent of global overcapacity in fisheries. Garcia and Newton (1997) assess overcapacity to be about 30% with respect to MSY of the major stocks representing 70% of global landings in 1989. However, since management often favours a precautionary approach (below MSY), an overcapacity of 30% with respect to biological criteria should be regarded as a minimum. With respect to MEY, they estimate overcapacity to be in the vicinity of 25-53%. The impact of technical development, through new constructions and modernisation of vessel and gear, would also need to be incorporated if an accurate portrayal of the level of

- 9 -
overcapacity is to be given. A resulting increase of 2% per annum in effective capacity is often considered to be modest in this regard. Based on this work and preliminary estimates of fleet/stock evolution during the 1990’s, FAO called for a “drastic reduction of at least 30% of world fishing capacity” in 1998 (FAO 1999). Mace (1997) further states that perhaps as much as a 50% reduction in global fishing capacity is required for capacity levels to become commensurate with sustainable resource productivity.

- 10 -
3. European Union
The following section examines how fishing capacity of the European Union (EU) fleet has been measured and registered. The structural adjustment policy that has been in force during the 1992-99 period is analysed and the resulting capacity development assessed. The financial framework and future issues to be addressed are also considered.
3.1 Capacity measurement
Fishing capacity in the EU has historically been measured in terms of two vessel characteristics, namely gross tonnage of the vessel and engine power. These two characteristics have been measured, monitored and registered as indicators of fishing capacity in the majority of Member States (MS), as specified by Regulation 2930/862, and are regarded as the most pertinent parameters for expressing fishing capacity of the fleets using active gears3.
The number of kilowatts (total of the maximum continuous power) of a vessel engine is a relatively straightforward measure, although differing measurement procedures in MS have caused some complications. Problems have included de-rating practices, the exclusion of auxiliary engines, as well as differing measurements in terms of official kilowatt (kW) and maximum effect kW. The gross tonnage measure of the vessel has been less straightforward. Historically, tonnage has been measured as Gross Registered Tonnage (GRT), as defined by the Oslo Convention 1947, or as a particular national unit of tonnage. The EU has been progressively moving to a common standard for measuring tonnage, a volumetric measure known as Gross Tonnage (GT), as defined by the International Convention on Tonnage Measurement of Ships 1969. However, the tonnage registration of many MS fleets still includes a mixture of measurements as a result of the slow and complicated conversion procedure, and so has limited the transparency of results of capacity reduction initiatives. A range of standardisation procedures has been adopted for various vessel length categories and re-measurement is expected to be complete by the end of 2003. In addition to this fishing capacity terminology, fishing capacity (as described above) has been used in the EU to define a further term known as fishing effort. The two terms have
2 Council Regulation (EEC) No 2930/86 3 Council Decision 97/413/EC

- 11 -
since 1992 worked in parallel to achieve desired fleet reductions. Lassen et al. (1996) state that fishing effort can be considered as composed of two separate elements: a capacity element (vessel and gear characteristics) and an activity element (capacity utilisation, fishing time etc.). That is,
(1) Activity * (gear)Capacity * (vessels)Capacity Effort Fishing =
The EU adopted a fishing effort measure in individual fleet segments, in terms of aggregate tonnage, engine power and fishing activity. These are:
(2) ∑=
=n
iii Ja
1
(tonnage)Effort Fishing
(3) ∑=
=n
iii Pa
1
power) (engineEffort Fishing
where n is the number of vessels in the fleet segment, ai is the vessel’s number of sea-days during the observation period, Ji and Pi is the vessel’s tonnage (GT/GRT) and engine power (kW) respectively, in each fleet segment during the observation period4. The problem with the fishing capacity and fishing effort terminology is to assess whether there is an appreciable biological impact as a result of a reduction in fishing effort. Furthermore, the estimation of fishing effort is complex and objectives may hence be manipulated.
3.2 Community register of fishing vessels
The Community register of fishing vessels was set up in 1989 to allow the European Commission to implement and monitor the Common Fisheries Policy. The register is meant to be a record of the physical characteristics of all the commercial marine fishing vessels in the EU fleet allowing the continued monitoring of the EU fleet through monthly declarations by MS. In practise, however, the data for some nations are incomplete. In their monthly declarations, each MS must notify the Commission of any changes to the fleet, such as new constructions, withdrawals, modifications or changes in activity. The register is continually being updated and the reliability of the information improved. An amendment
4 Commission Regulation (EC) No 2091/98

- 12 -
to the regulation was recently adopted which both extends and simplifies the information to be communicated, and also puts into place the procedures for direct (internet) access to the database by each MS. This will greatly speed up the exchange of information and allow the register to be used to monitor the access of vessels to the various fisheries. The main characteristics recorded include: Country of registration, Name of vessel, Port of registration, International radio call sign, External marking, Types of fishing gear, Length overall, Length between perpendiculars, Tonnage 2930/86, Tonnage Oslo Convention, Tonnage (other standard), Main engine power, Auxiliary engine power, Hull material, Date of entry into service, Year of construction, MAGP segment, Importing/exporting country, Event indicator (e.g. modernisation, construction, withdrawal etc.), Date of event. Since 1996 the register has also recorded whether or not public aid was involved with the entry of capacity or with the withdrawal of capacity. Where fleet objectives are also sought through effort reduction, records of the number of days spent at sea by the vessel also have to be submitted (Roitmann and Hopkins 1999). At the end of 1998 the register contained just over 100,000 fishing vessels.
TABLE 1. Community register of fishing vessels – Total EU fleet 1989-98 End of year Tonnage (GT/GRT) Power (kW) Number of vessels 1989 - 8,768,887 107,030 1990 - 8,644,174 106,738 1991 2,295,443 8,471,314 101,733 1992 2,225,460 8,302,453 99,213 1993 2,138,615 8,061,472 96,641 1994 2,153,719 8,331,780 102,348 1995 2,100,007 8,153,489 100,321 1996 2,070,577 7,980,193 98,683 1997 2,053,240 7,991,591 99,528 1998 1,986,230 7,812,146 100,106 Note: 1989-93 figures exclude Finland and Sweden Source: DG Fisheries (1999b) Statistical Bulletin
3.3 Capacity adjustment policy
3.3.1 Framework
In order to attain a sustainable balance between the capacity of the EU fishing fleet and the available resources, and to reduce inefficient ‘race to fish’ behaviour, a comprehensive

- 13 -
structural policy has been in force since 1983. This policy has been sought through a string of structural adjustment measures, including a comprehensive capacity adjustment policy known as Multiannual Guidance Programmes (MAGPs). In order to remove excess capacity from fisheries, vessel decommissioning and effort reduction have been the most frequently measures applied. Other measures such as joint enterprises, export to third countries, and reassignment for purposes other than fishing have also been applied, although to a much lesser extent, and will hence not be discussed further in this section. The measures have been implemented under the MAGP framework, with the present MAGP IV programme running until the end of 2001. Additional measures to renew and modernise vessels have also been applied to help restructure the EU fishing fleet, working in conjunction with the MAGPs. Currently, the EU fleet is segmented depending on how each vessel is geared towards fish stocks, defined on the basis of the zone fished, the species exploited and the fishing gear used. Fleet segment reduction objectives are set in accordance with desired fishing mortality rates of certain fish stocks. The extent of these ‘weighted’ reductions has been based on biological advice on fish stock overexploitation (see Appendix A). The probable impact of capacity adjustment on areas dependent on fishing can be measured both socially and economically. At a social level, a reduction in fishing capacity will have a negative effect on jobs at sea and the upstream sector (suppliers, shipyards and harbour administrations). On the other hand, the downstream sector is likely to suffer only during the time required for the ‘recapitalisation’ of fish stocks, since the quantities caught is likely to increase, thus increasing the number of jobs downstream. In economic terms, the profitability of fishing companies and competitiveness of European products is likely to improve as a result of the elimination of the overcapacity of the EU fleet. However, the negative effects of direct and indirect job losses will also need to be accounted for.
3.3.2 Vessel decommissioning
The principal objective of decommissioning is to reduce capacity, through the voluntary removal of redundant vessels, so as to bring fleets fishing particular resources into balance with their allocated quota. The process works by giving fishers a financial incentive to leave the fishery, usually in the form of a grant. In theory, the vessels that remain in the fishery will benefit and improve the overall efficiency as global production increases. The expected

- 14 -
effects will include an improvement in the economic results of the fisheries companies, through a reduction in fixed costs and improved catches, and greater competitiveness5. A successful decommissioning programme will rely on whether fishers can be drawn out of the fishery for future financial gain, as opposed to what they would otherwise gain if they remained in the fishery (Frost et al. 1995). Fishers may also withdraw from the fishery because of the poor future prospects regardless, resulting in a financial loss and reemployment elsewhere. A vessel decommissioning programme is expected to remove the marginal players first (i.e. often the oldest and least efficient vessels) and it may prove more difficult to table sufficient financial incentives at the later stages of the programme in order to entice the more efficient vessels. It could also be expected that vessel decommissioning may lead to some redistribution of wealth, as the vessels left in the fishery may be able to exploit a larger share of the quota.
3.3.3 Effort reduction
A less permanent measure has been applied to MAGPs since 1992 under the fishing effort concept, where MS may reduce the overexploiting nature of fishing fleets by limiting their fishing activity (as described in Section 3.1). Generally known as ‘tie-ups’, this measure requires vessels to remain in port for a minimum number of days in port per year, thus reducing the overall fishing effort and subsequent pressure on fish stocks. The limitation of effort through activity could only account for 45% of the overall reduction in fishing effort, with capacity removal (e.g. decommissioning) accounting for the remaining 55% under MAGP III. However, no such restrictions were imposed for MAGP IV, as long as previous programme targets were satisfied. Although this measure may address the biological objectives it is unlikely to address the more fundamental issue of improving the structure of the fleets. Since this measure is largely a ‘regulation by inefficiency’, the overall economic situation of the fleet is unlikely to improve significantly, although employment levels may be maintained.
5 COM (96) 237 final
- 15 -
3.3.4 Vessel construction and modernisation
Grant aid has been allocated for the construction and modernisation of fishing vessels to ensure that the EU fleet remains competitive, to improve safety on board vessels, to improve the quality of fish handling and to encourage the use of more selective gears. However, attaining aid is currently possible only if the corresponding increase in fishing capacity has been allowed within the framework of the MAGPs. Close monitoring is required to ensure that the replacement of old and less efficient vessels with new or modernised vessels does not lead to an overall increase in capacity that will hamper MS reaching their MAGP objectives.
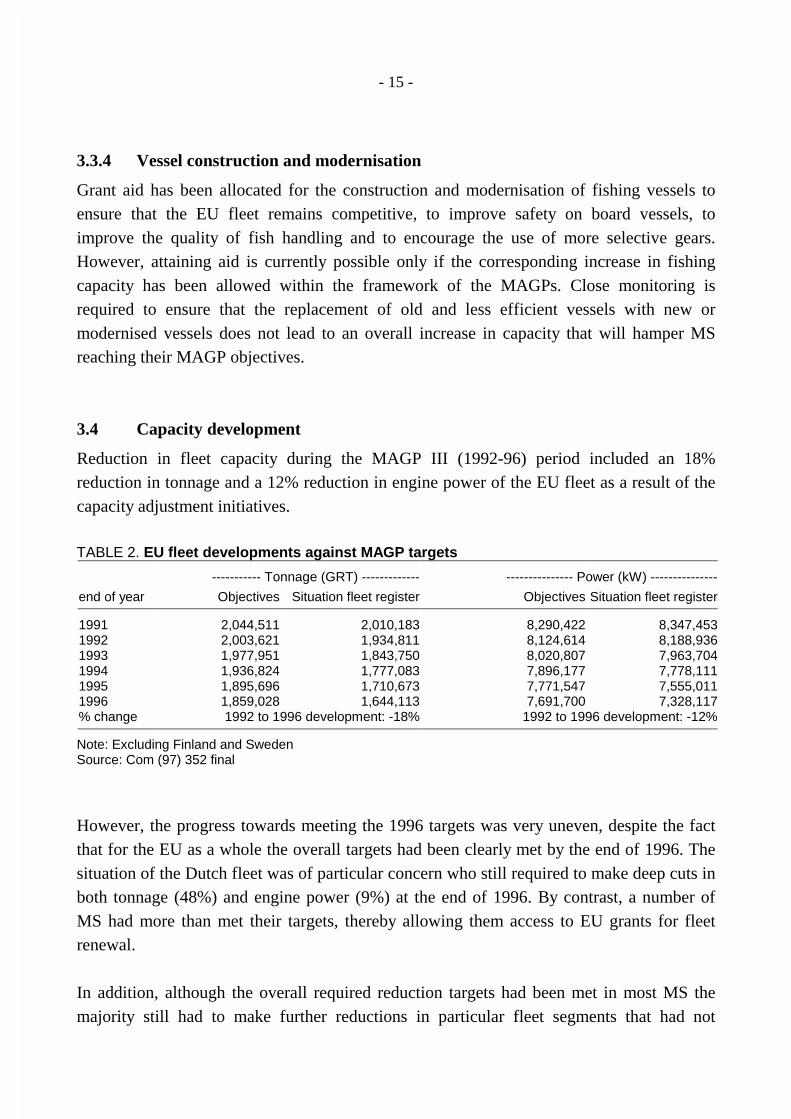
3.4 Capacity development
Reduction in fleet capacity during the MAGP III (1992-96) period included an 18% reduction in tonnage and a 12% reduction in engine power of the EU fleet as a result of the capacity adjustment initiatives. TABLE 2. EU fleet developments against MAGP targets
----------- Tonnage (GRT) ------------- --------------- Power (kW) ---------------
end of year Objectives Situation fleet register Objectives Situation fleet register 1991 2,044,511 2,010,183 8,290,422 8,347,453 1992 2,003,621 1,934,811 8,124,614 8,188,936 1993 1,977,951 1,843,750 8,020,807 7,963,704 1994 1,936,824 1,777,083 7,896,177 7,778,111 1995 1,895,696 1,710,673 7,771,547 7,555,011 1996 1,859,028 1,644,113 7,691,700 7,328,117 % change 1992 to 1996 development: -18% 1992 to 1996 development: -12% Note: Excluding Finland and Sweden Source: Com (97) 352 final
However, the progress towards meeting the 1996 targets was very uneven, despite the fact that for the EU as a whole the overall targets had been clearly met by the end of 1996. The situation of the Dutch fleet was of particular concern who still required to make deep cuts in both tonnage (48%) and engine power (9%) at the end of 1996. By contrast, a number of MS had more than met their targets, thereby allowing them access to EU grants for fleet renewal. In addition, although the overall required reduction targets had been met in most MS the majority still had to make further reductions in particular fleet segments that had not

- 16 -
reached their targets. For example, the United Kingdom had already met its 1996 targets for a number of segments by the end of 1994, but it still had about 18% and 36% overcapacity respectively in key demersal trawler and beam trawler segments. The current EU and MS fleet objectives for MAGP IV (1997-2001) are given in the following tables. TABLE 3. EU fleet objectives for 2001 --------------- Tonnage (GT) -------------- ----------------- Power (kW) -------------
end of year Objectives Situation fleet register Objectives Situation fleet register 1996 2,114,810 1,774,685 6,820,931 6,321,292 1997 - 1,726,319 - 6,146,604 2001 2,065,707 - 6,618,026 - Note: Excluding Italy Source: Com (1999) 175 final TABLE 4. MS fleet objectives for 2001
MS -------------------- Tonnage (GT) -------------------- ---------------------- Power (kW) -------------------
Situation 1997
Objective 2001
Sit.1997/ Obj. 2001
Situation 1997
Objective 2001
Sit. 1997/ Obj. 2001
Belgium 23,099 23,323 99% 64,896 67,857 96% Denmark 98,411 132,539 74% 380,809 463,437 82% Finland 24,197 22,992 105% 220,066 212,847 103% France 191,744 185,686 103% 959,614 922,357 104% Germany 68,781 81,973 84% 161,706 170,050 95% Greece 110,362 120,755 91% 655,752 654,172 0% Ireland 58,603 69,649 84% 179,744 199,009 90% Netherlands 146,581 131,809 111% 399,891 347,095 115% Portugal 121,539 195,885 62% 394,684 497,246 79% Spain 587,172 799,253 73% 1,468,300 1,755,636 84% Sweden 48,181 51,159 94% 245,749 261,857 94% UK 247,649 250,684 99% 1,015,393 1,066,463 95% EU total 1,726,319 2,065,707 84% 6,146,604 6,618,026 93% Note: Excluding Italy Source: Com (1999) 175 final The current capacity reduction objectives are rather modest. However, some MS have opted to reduce fishing effort in certain fleet segments by restricting days at sea, hence resulting in lower capacity reduction requirements for those segments (Hatcher 2000). The programme concentrates the reductions in capacity on those fleet segments operating on the most vulnerable stocks (see Appendix A) and attempts to minimise their short-term socio-

- 17 -
economic impact. In order to reach the objectives each MS must adopt legislation to control the renewal of the fleet, which on a segment basis determines the required ratio between entries and exits of vessels. It follows that aid cannot be granted to the renewal of the fleet, resulting in an increase in fishing capacity, unless stated objectives have been met. Since the overall objectives of MAGP IV have already been met (see Table 3), it should be anticipated that the capacity of the EU fleet will increase through vessel construction and modernisation in eligible fleet segments.
3.5 Financing of capacity adjustment
In 1993, as part of a general reform of the Structural Funds, all the common structural measures relating to fisheries were integrated into an overall system of EU structural funding under a single financial instrument, the Financial Instrument for Fisheries Guidance (FIFG). The specific tasks of the FIFG included helping to achieve a sustainable balance between resources and their exploitation, a strengthening of the competitiveness of structures and the development of economically viable enterprises. The regulation required each MS initially to draw up a single programming document, to include a sectoral plan for fisheries together with an aid application. The sectoral plan had to contain a strategy to the adjustment of fishing capacity and the renewal of the fleet, as well as the means (legal, financial etc.) envisaged for attaining those objectives. Other measures (e.g. supports to markets, aquaculture, port facilities, training etc.) were also included but are not discussed here. During the 1983-90 period, very large sums of EU aid were directed towards fleet renewal projects and led to a rather apparent capacity increase. After 1990, however, when the rates of aid were reduced and the Commission adopted a stricter attitude to the granting of aids to those nations not meeting their MAGP targets, there was a significant reduction in this category of aid. At the same time, aid towards fleet reduction measures increased considerably. Table 5 lists the total budget allocations (EU and national) approved by the Commission for the fleet renewal measures (construction and modernisation projects) and capacity/effort adjustment measures under the sectoral plans submitted by each MS for the period 1994-99.

- 18 -
TABLE 5. Aid budget for EU fleet measures 1994-99 (ECU million)
MS Adjustment of fishing capacity/effort ---------- Construction and modernisation ---------
FIFG Public Total FIFG Public Private Total Belgium 5.20 5.20 10.40 7.88 3.94 27.58 39.40Denmark 37.74 37.74 75.48 35.06 7.01 98.17 140.24Finland 4.14 4.14 8.28 2.41 1.06 6.55 10.02France 16.19 16.19 32.38 37.81 29.48 89.01 156.30Germany 8.66 12.68 21.34 32.61 5.76 66.60 104.97Greece 31.77 10.59 42.36 14.29 4.76 24.25 43.30Ireland 5.56 1.86 7.42 11.70 1.91 24.58 38.19Italy 104.58 104.58 209.16 93.22 23.10 115.11 231.43Netherlands 9.50 9.50 19.00 2.20 0.88 13.90 16.98Portugal 82.05 28.02 110.07 36.23 8.07 29.68 73.98Spain 378.97 188.09 567.06 334.38 71.66 310.56 716.60Sweden 4.00 4.00 8.00 12.00 4.00 24.00 40.00UK 19.15 13.84 32.99 20.13 4.73 28.02 52.88EU total 707.51 436.43 1,143.94 639.92 166.36 858.01 1,664.29 Note: Values for Finland and Sweden are for 1995-99 Source: European Union aid for the development of the fishing industry, DGXIV (1998a) The FIFG regulation for 2000-2006 has recently been approved and includes the continued provision for a mechanism to manage fleet development, aiming to achieve an appreciable reduction in fleet capacity6. Table 6 below lists the indicative budget allocations by MS under the FIFG outside the Objective 1 regions of the Structural Funds for the period 2000-06. A further breakdown of the national budget allocations is currently unavailable. It should be noted that these figures include all structural measures and do therefore not solely indicate the level of spending on capacity adjustment. However, it does serve as an indicator of the balance of intended spending on structural measures of MS. TABLE 6. Indicative MS budgets under FIFG 2000-06 (EUR million at 1999 prices) MS Aus Bel Den Fin Fra Ger Gre Ire Ita Lux Net Por Spa Swe UK Total
4 34 197 31 225 107 0 0 96 0 31 0 200 60 121 1,106
Source: Commission Decision 1999/500/EC The newly adopted FIFG (2000-06) will continue to make funds available for achieving “a
lasting balance between fish stocks and their exploitation…and reinforce competitiveness
and the development of economically viable businesses in the fishing industry”. An 6 Council Regulation (EC) No 2792/1999
- 19 -
appreciable reduction in capacity will be sought, where, for example, publicly funded additions require the non-funded removal of greater capacity (30% greater than the new addition). Penalty measures and refusal of public support will be strengthened in cases where MS do not observe the rules agreed under the MAGP and the Community register of fishing vessels (DG Fisheries 1999a).
3.6 Reviewing the MAGP
The Scientific, Technical and Economic Committee for Fisheries (STECF) recognises in their report to the Commission that in order to prepare for the next MAGP phase, a full evaluation of previous programmes needs to be undertaken. The STECF (1999, p 11) further considers that: “In view of the low reduction rates applied to Member States’ fleets in MAGP III and IV in
comparison to what was recommended according to the state of the stocks, and the way
they have been applied, the primary objective of matching fishing capacity to resource
availability is unlikely to have been fully achieved by the end of 2001”.
A comprehensive evaluation should therefore address the implementation process (e.g. segmentation, scrap and build policies, activity changes etc.) and how economic and other incentives have influenced their effectiveness. STECF (1999) further suggests that for the Commission to implement the next generation of MAGPs successfully, the following areas will need to be investigated or clarified:
• State of the fish stocks exploited by the European fleets
• Economic situation of the fleets
• The levels of fishing mortality in relation to the precautionary approach
• Fleet dynamics and the behaviour of fleet segments in relation to management measures
• The fishing capacity, fishing effort and fishing mortality relationship The latter issue is especially important since it is recognised that in principle the control of capacity and effort can be used to control the overall level of fishing mortality. It will therefore be important to define what is meant by each concept and how they will be measured, and to understand the practical relationship between these concepts.
- 20 -
The difficulties of trying to address biological imperatives while accommodating a multitude of political, economic and socio-economic interests have, however, hampered the progress of the capacity adjustment programmes in the EU. Although most of the reduction objectives have been met during the 1990’s, the translated effect of a similar reduction in fishing pressure on stocks remains in doubt. It can be expected that issues such as technological improvement, effort creeping following vessel decommissioning, grants for vessel construction and modernisation, temporary effort restrictions, lack of compliance by certain fleet segments, and possible relocation of capacity in less regulated fisheries, will all determine the success of the continued application of adjustment programmes. The principal fishing capacity, fishing effort and fishing mortality relationship, including their definition and reliable measurement, will require further analysis if meaningful fleet reduction targets are to be set in accordance with the desired multi-objectives of EU fisheries management. The Commission acknowledge in their mid-term review of the MAGP to the Council7 that despite the reductions in of the Community fleet, “the fleet would still be more than
capable of exerting excessive levels of fishing effort”. The reduction in capacity “would
have been a significant step in the right direction but could not be expected to have a
measurable impact on the state of the resources in the short term”. Furthermore, they state that “although the current exploitation rates are too high, they represent only a fraction of
what the existing fleet capacity is potentially able to exert if it were not for the constraints
imposed by the Community regulations, an in particular the quota allocations”. The review considers that the effect of using weighted reduction rates and activity reductions have significantly undermined the effectiveness of MAGP IV in reducing fishing capacity. As a result of the weighting procedure, the reduction of the Community fleet required by MAGP IV is a mere 5%, as opposed to the initial 15% target set for the 5-year period. The procedure has also had the perverse effect of giving less, and not more, protection to the heavily depleted stocks. Furthermore, the allowance to reduce fishing effort by limiting vessel activity has lead capacity reductions requirements being reduced from 5% to less than 3%. MS not recognising the permanent and binding nature of the activity reductions has further hampered the programme. The review concludes by suggesting that the weighted reduction procedure be replaced by unweighted rates for the remaining period of MAGP IV, leading to additional reduction of 7 COM (2000) 272 final

- 21 -
the fleet (approximately 2% per year). It is proposed that these additional reductions be achieved in terms of capacity only. It is further suggested that MAGP IV is extended until the end of 2002 to incorporate these modifications. This proposal, if implemented, will require overall reductions of the Community fleet over the 2001-02 period by 5.4% and 5.2%, in terms of GT and kW respectively, if reductions are achieved by capacity only. In terms of both capacity and activity, reductions will be 6% and 5.6% respectively. The MS most affected include Germany, Denmark, Ireland, the Netherlands, Sweden and the UK, with reduction requirements ranging from 6.2% to 12%. However, the majority of MS opposed this proposal at a Commission meeting in June 2000.
- 22 -
4. Denmark
This section analyses the capacity development of the Danish fishing fleet as a result of national and EU capacity adjustment policies for the 1992-99 period. The criteria for capacity measurement and registration are described and the need to adjust fleet capacity is addressed. The MAGP framework and the Danish ‘official’ response to the objectives are also examined. National capacity guidelines, regulations and adjustment initiatives are then described. With the assistance of data from the Directorate of Fisheries and Directorate for Development, the impact of these measures on fleet development is assessed for the period. The section concludes by considering the financial framework and future issues of national fleet adjustment.
4.1 Capacity measurement
Vessel capacity has traditionally been measured in terms of vessel length, vessel tonnage and engine power. Vessel length categories have been most frequently used to represent capacity, using overall length, defined as the distance in a straight line between the front of the bow and the back of the stern, as the recorded unit. However, due to the importance of EU regulation and MAGP initiatives, vessel capacity of the national fleet has also been closely monitored in terms of vessel tonnage and engine power, and has been the basis for the capacity adjustment framework. Vessel tonnage has been measured in terms of GRT and is slowly undergoing a conversion into GT units (as described in Section 3.1). According to the present legislation all vessels with a length of 24 metres or more must now be measured in GT. Vessels of less than 24 metres, which have been registered before 1 January 1988 and have not been modified since, may still be recorded in GRT. As a result, the vessel register now contains a mixture of GT and GRT. Since the GT measure often gives a higher tonnage than GRT, the total tonnage of the fleet gradually increases as a greater proportion of the fleet is measured in GT. This will complicate any subsequent trend analysis of fleet capacity over time. Engine power has been measured in terms of horsepower (HP), based on the specifications by the manufacturer. HP is recorded as ‘official effect’, which is the maximum effect of the entire propulsion machinery in continuous operation, and/or ‘maximal HP’, which is the maximum performance without deduction for auxiliary engines driven by the machine. To comply with the EU register the HP measure has been converted to kilowatts (kW) by the simple formula, 1 HP = 0.7355 kW (Directorate of Fisheries 1999).

- 23 -
4.2 The fishing vessel register
The national fleet consists of fishing vessels registered in Denmark that have been issued a fishing license by the Directorate of Fisheries. A license allows general permission to exploit allocated Danish quota in commercial fisheries, although further licensing may be required for certain selected fisheries. The Directorate of Fisheries has administered a register of the national fleet since 1982 and holds information of all commercial fishing vessels, including: Vessel tonnage, Engine power, Vessel length, Vessel category, Number of crew, Vessel identification number (EU and national), Vessel district, Vessel age, Insurance value, MAGP fleet segment. This is by no means a comprehensive list of all information held in the register. The information held more than complies with the demands of the Community register of fishing vessels, discussed in Section 3.2. Vessels of less than 5 GRT were excluded from the national register before 1992, due to the lack of information. Since 1992, however, all commercial fishing vessels with an overall length of 6 metres or above have been included and since 1995, all vessels have been included (Directorate of Fisheries 1999). This has hence resulted in an increase in the number of fishing vessels held in the register. At the end of 1999 the fishing vessel register contained 4,261 fishing vessels, as registered on 15 February 2000. Around 70% of these vessels were small-scale netters under 12 metres in length, whereas trawlers and Danish seiners represented some 25% of the vessels in the fleet. Netters over 12 metres in length and purse seiners made up the remaining 5%. However, trawlers and Danish seiners represented almost 80% and 70% of the fleet in terms of vessel tonnage and engine power respectively.
4.3 Capacity adjustment requirement
The overall objective of the long-term application of capacity adjustment policy has been to make the fishing sector economically viable, whilst contributing to a more selective and sustainable utilisation of available resources. Another important objective has been to secure sound economic and social conditions for the enterprises and the persons employed in the sector and to create a reasonable and stable income level. In order to satisfy these objectives, the aim of capacity adjustment policy has been to reduce the size of the fleet in line with national capacity regulations and the EU capacity
- 24 -
adjustment initiatives. Although this will contribute to having a negative effect on employment in the short term, reducing the fleet is seen as an essential condition for a positive evolution in the remainder of the fishing fleet. A fundamental structural change in the Danish fisheries sector has been required, mainly because of scarcity of resources in Community waters and increased competition for markets. During the late 1980’s and early 90’s, the situation for the most important stocks for the Danish fishing fleet deteriorated, notably for cod. The Danish authorities were therefore extremely restrictive as regards granting permission for entry of new vessels in the fishing fleet. The banking sector was furthermore very reluctant to finance renewal of vessels. The result is that the Danish fishing fleet is now comparatively old and the average age of vessels was around 27 years old at the end of 1998 (FVM 2000). Danish capacity adjustment measures have primarily focused on decommissioning of fishing vessels. Although the MAGP framework has allowed MS to reduce their fleets in terms of capacity and effort (through activity restrictions), Denmark has opted to reach their targets by means of capacity reduction only. During the period 1987-93 a total of 797 vessels, representing almost 40,000 GRT or 29% of the fleet size in 1987, was decommissioned with national and Community aid (Frost et al. 1995). The Danish seine and trawler fleets were particularly subject to decommissioning, with 41% and 33% reductions respectively. This reduction was larger than that imposed by MAGP objectives. Approximately 2,000 jobs were lost in the same period. The modernisation of the Danish fishing fleet is of crucial importance to employment in the many small and medium-sized shipyards in Denmark, not least because of the limitations imposed on vessel construction. At the same time, modernisation of the fleet is a key factor in ensuring continued improvement in the quality of fish landed, which in turn is a condition for increasing value-added in the future. Restrictions on the size of the fleet have continued to ensure that the capacity adjustments undertaken have not been cancelled out by additions to the fleet.

- 25 -
4.4 MAGP III and IV (1992-2001)
4.4.1 Fleet segmentation
Capacity adjustment during the 1992-96 period was based on a defined fleet segmentation of the Danish fleet. The fleet segmentation codes in coastal, EU and international waters under the MAGP III (1992-1996) programme were as follows8: B08 Vessels (<5GRT) B09 Pelagic fisheries B10 Trawlers (Greenland) B12 Trawlers and Danish seiners B13 Netters B17 Purse seiners U Unclassified The capacity development for the 1997-2001 period is based on a different segmentation of the Danish fleet, as defined by the MAGP IV programme. The codes are as follows: 4B1 Vessels (<12 m), except trawlers and Danish seiners 4B2 Vessels (=>12 m), except trawlers and Danish seiners 4B3 Trawlers and Danish seiners 4B4 Purse seiners A fleet segment has been defined as a group of vessels having homogenous physical characteristics using the same fishing gear or the same type of fishing gear. The segmentation of the Danish fleet has been determined in relation to the exploited stocks and fishing techniques, taking account of the segmentation adopted as part of MAGP III (1992-96)9. Further details of fleet segment characteristics (i.e. fishing area and stocks exploited) can be viewed in Appendix B. The fleet segment databases are updated on an annual basis.
4.4.2 Fleet reduction rates
The capacity reduction coefficients for MAGP III (1992-96) were set in accordance with the fleet segment concerned, as follows10:
8 Commission Regulation (EC) No 2091/98 9 Council Decision 97/413/EC 10 Commission Decision 92/595/EEC

- 26 -
• 20% for segments practising bottom trawling in teams or using an otter trawl, and fishing for demersal stocks
• 15% for dredgers and beam trawlers fishing for benthic stocks • 0% growth in other segments For MAGP IV, the pilot reduction rates of fishing capacity for each segment are based on the critical nature of the stocks exploited (defined in Appendix A), set out as follows11: • 30% for depleted stocks • 20% for overfished stocks • 0% growth for fully exploited stocks or for stocks where sufficient biological
information is not available The application of the outlined reduction criteria to the Danish fleet segments (4B1-4B4) under MAGP IV can be viewed in Appendix B. The catch composition of each exploited stock is weighted by the required pilot rate accordingly to reach an overall reduction rate for each fleet segment. Vessels under 12 metres (except trawlers and Danish seiners) are exempt from the above reduction criteria.
4.4.3 Capacity development
Reduction in fleet capacity during the 1992-96 period was pronounced with a 25% reduction in tonnage and a 21% reduction in engine power of the Danish fleet as a result of the capacity adjustment initiatives under MAGP III (see Table 7 below). This can be compared to total EU fleet reductions of 18% and 12% respectively for the same period. TABLE 7. Danish fleet developments against MAGP targets 1992-96
------------- Tonnage (GRT) -------------- ---------------- Power (kW) ---------------
End of year Objectives Situation fleet register Objectives Situation fleet register 1991 119,118 109,406 514,716 496,690 1992 116,804 101,458 504,422 460,634 1993 112,766 88,546 487,131 410,245 1994 108,727 87,368 469,840 418,346 1995 104,689 84,386 452,550 404,941 1996 105,109 81,148 480,043 390,226 % change 1992 to 1996 development: -25% 1992 to 1996 development: -21% Source: Com (97) 352 final
11 Council Decision 97/413/EC

- 27 -
The development of the Danish fleet during the 1997-99 period has been relatively insignificant and an exact analysis is further complicated by the apparent discrepancies between the figures given in Tables 7 and 8. The GRT to GT conversion has obviously caused some confusion but there also seem to be difficulties with the registration of engine power. Whether this is a result of general updating or differing measurement criteria is uncertain. The analysis is further hindered by the fact that the Commission has yet to report the latest capacity development, and so national figures have to be relied upon. What can be concluded from these tables, however, is that the Danish fleet is well within the MAGP 2001 objectives.
TABLE 8. Danish fleet developments against MAGP targets 1997-2001
--------------- Tonnage (GT) --------------- ----------------- Power (kW) -----------------
End of year Objectives Situation fleet register Objectives Situation fleet register 1996 138,043 106,499 483,306 411,684 1997 - 105,745 - 394,516 1998 136,667 105,595 478,339 389,030 1999 135,291 107,805 473,372 390,789 2001 132,539 - 463,437 - % change 1997 to 1999 development: +1% 1997 to 1999 development: -5% Note: 2,536 of the 4,453 vessels in the vessel register have an estimated GT. Intermediate objectives for
1998 and 1999 are calculated in accordance with Commission Decision 98/126/EC Source: Com (1999) 175 final. Situation fleet register data 1997-99 comes from the Directorate of Fisheries
database More detailed capacity development data for the MAGPs, given on the defined fleet segments, can be viewed in Appendix C.
4.5 National capacity guidelines and regulations (1992-99)
The management and control of fishing capacity of the national fleet has been the task of the Directorate of Fisheries. The sections that follow outline the main guidelines and regulations that have been implemented during the 1992-99 period. These guidelines and regulations have worked in conjunction with EU and national capacity adjustment initiatives in order to seek a fleet capacity that is balanced with resource availability.
- 28 -
4.5.1 Guidelines 1992-9412
Vessel renewal (construction and modernisation) was understood as: “A constructive change of the vessel that results in an increase in dimensions (length,
breadth and depth), engine power, tonnage or hold capacity”.
New fishing capacity was permitted to enter the fishing fleet following a reduction of fishing capacity of the fishing fleet. The new capacity could only represent a maximum of 15% of the net capacity reduction of the whole fleet. Applications were reviewed under the following categories with applicable conditions:
• Vessel construction and modernisation resulting in capacity increase – with a maximum capacity increase of 15% as a result of vessel modernisation.
• Vessel replacement – maximum 5% increase in tonnage and dimensions, with a maximum 5 GT/GRT increase. A shipwrecked vessel could be replaced by another vessel with a maximum 15% increase in capacity and dimensions, with a maximum 35 GT/GRT increase.
• Modernisation of existing vessels on the basis of vessel removal – no capacity increase allowed.
4.5.2 Guidelines 1995-9613
Vessel replacement was understood as a situation where a vessel was removed from the fleet and replaced by another vessel. It was not permitted to remove one large vessel and replace it with two smaller vessels, and vice versa. The fishing fleet was divided up into the following overall length categories: 0 - 5.99 m 6 - 8.99 m 9 - 11.99 m 12 - 15.99 m 16 - 19.99 m 20 - 23.99 m
12 Guidelines for adjustment of fleet harvesting capacity, 1992 13 Guidelines permitting vessel replacement, modernisation and engine power change, 1995

- 29 -
24 - 29.99 m 30 - 39.99 m 40 - 49.99 m >50 m
The replacing vessel had to be in the same overall length category, or in the category immediately following it, as the vessel that had been removed. However, the overall length of the replacing vessel could not be more than 12 metres longer than the removed vessel. Engine power could be increased by no more than 10% or 50 HP/37 kW. The same criteria applied to vessels that sought to modernise. Special conditions applied to beam trawlers and purse seiners.
4.5.3 Regulations 1997-99
The current Ministerial Announcement No. 257 of 3 April 1997 concerning vessels that are used in commercial fisheries lays down the following capacity regulations: Vessel replacement should occur within the same length category (as defined in the Guidelines 1995-96), or within the category just above or below the category of the removed vessel. The replacing vessel can be no more than 35% greater in terms of tonnage compared to the removed vessel, with a maximum increase of 100 GT allowed. If the replacing vessel is measured in GT and the removed vessel is measured in GRT, then the increase can be no more than 3 metres in overall length. Engine power can be increased by no more than 10% or 50 HP/37 kW. Special conditions apply to beam trawlers and purse seiners. The same criteria apply to vessels that seek to be modernised and effectively require vessel owners to remove capacity from the fleet in order to modernise (e.g. through the purchase of redundant capacity). Modernisation is reviewed under the following categories:
• Tonnage increase
• Dimension increase (overall length, breadth and depth)
• Hold capacity increase
• Engine power increase
• Modernisation re-rigging that allows the vessel to purse seine
• Modernisation and re-rigging of vessels over 500 HP/370 kW that allows beam trawling
- 30 -
Ministerial Announcement No. 1120 of 15 December 1997 concerning vessels that are used in commercial fisheries supplements the previous Announcement, and laid down the following regulations: The Directorate of Fisheries allowed a capacity introduction of 5,300 GT through vessel construction, replacement and modernisation during the period May 1997 to the end of December 1999 since national capacity targets were well below the MAGP fleet reduction objectives set by the European Commission. This would result in a net increase in fleet capacity, although this increase would still have to comply with the overall MAGP objectives. The permitted capacity was allocated in the overall length categories as follows: 0 - 11.99 m 424 GT 12 - 23.99 m 2,438 GT > 24 m 2,438 GT This was further broken down so tonnage in each category could be sought through various means in the following manner: Vessel construction 60% (3,180 GT) Vessel replacement 20% (1,060 GT) Vessel modernisation 20% (1,060 GT) The same criteria apply as in the previous Announcement although the replacing vessel can be no more than 10% greater in terms of tonnage compared to the removed vessel, with a maximum increase of 25 GT allowed. Special attention is given to encouraging a new generation of fishers to enter the Danish fishing industry. Where one vessel replaces two or more vessels, the tonnage of the replacing vessel may only be the same tonnage as one of the removed vessels plus an extra 75% of the tonnage of that or another vessel that has been removed from the fleet. Where two or more vessels replace one vessel, the total tonnage of the replacing vessels may only be 75% of the tonnage of the vessel that has been removed from the fleet. Vessel modernisation follows the same procedure.

- 31 -
4.6 Capacity adjustment (1992-99)
The following sections outline the capacity adjustment initiatives in force during 1994-99, in accordance with Council Regulation (EC) No. 3699/93 of the European Union. The previous Council Regulation (EC) No. 4028/86, in force during 1992 and 1993, is excluded from the discussion although the support structure was of very similar nature, but applied different rates of support. Capacity adjustment includes vessel removal, construction and modernisation, all implemented to reach and comply with the capacity reduction targets under the MAGPs, as well as complying with national capacity regulations. Restriction of fishing effort through limiting days at sea has not be in operation in Denmark, and hence will not be discussed in this section.
4.6.1 Vessel removal
Vessel removal has been carried out under the following categories:
• Vessel decommissioning
• Reassignment for purposes other than fishing
• Joint enterprises and export to third countries However, public support for the removal of vessels of less than 25 GRT can only be given if the vessels concerned are permanently removed (i.e. decommissioned). All vessels that are removed through these measures have to be deleted from the national registers as well as the Community register of fishing vessels. The EU covers 50% of the grant for vessel removal, with the remaining 50% covered by national means. The aim of vessel decommissioning is to adjust the size of the fishing fleet to the actual catching possibilities and to create a basis for future, long term renewal of the fleet. Conditions include the number of days fished during the last two years, the age of the vessel (at least 10 years old), and the grant size is dependant on vessel tonnage and age14. The reassignment of vessels for purposes other than fishing also falls under this category, encouraging the permanent cessation of fishing vessel activities.
14 Ministerial Announcement No. 669 of 14 July 1994

- 32 -
The aim of joint enterprises and export to third countries is to assist with the fleet size adjustment to the actual catching possibilities by transferring Danish vessels to fisheries in third countries. Grant is given to vessels that are permanently transferred to third country fisheries through the establishment of a joint enterprise between one or more Danish partner with one or more partners in a third country. Conditions include a minimum vessel size of 25 GRT and that the vessel has been fishing for at least 5 years under the Danish flag. The size of the grant is once again dependant on vessel tonnage and age (Directorate for Development 1999). During the 1992-99 period vessel removal has largely been carried out by means of decommissioning. The difficulty of control following the creation of joint enterprises and export to third countries meant that administrators were reluctant to support such measures. Additionally, the reassignment for purposes other than fishing attracted limited interest (personal communication with Directorate for Development, March 2000).
4.6.2 Vessel construction
The aim of funding vessel construction has been to promote renewal and permanently adjust the structure of the fishing fleet15. Funding for vessel construction has only been made available on the condition that the vessel owner removes capacity from the fishery with the extent of the allocated grant depending on the investment cost, the tonnage of the new vessel, and the amount of capacity (tonnage) that is removed in conjunction with the new investment. The maximum grant cover is 30% of the proposed investment, 25% of which is covered by the EU with the remaining 5% covered by national means. Grants are also given to projects that specifically enhance on-board safety, promote more selective and environmentally friendly fishing practises, and better fish handling and quality. The strict capacity regulation in force has meant that funded vessel construction has been limited to only a handful of projects during the 1992-99 period. Vessel owners have therefore tended to seek funding for modernisation in order to improve their status in the fishery (personal communication with Directorate for Development, March 2000).
15 Ministerial Announcement No. 772 of 14 October 1999

- 33 -
4.6.3 Vessel modernisation
The aim of allocating grants for vessel modernisation has been to rationalise the fishery, improve the storage and quality of fish products, promote more selective and environmentally friendly (including energy saving) fishing practises, improve the working and safety conditions on board or allow better fisheries surveillance16. Vessels have to be less than 30 years old to be eligible for a grant, unless the project promotes better safety conditions or improved fisheries surveillance. Approved projects are granted support for up to 30% of the investments that includes an EU grant of 25% and a national grant of 5%, where investments have to be of at least DKK 25,000. For 2000, the grant has been reduced to 20% of the overall investment cost. Where modernisation results in a capacity increase, grants allocated depend on the amount of the investment, the tonnage of the vessel, and the amount of capacity (tonnage) that is simultaneously removed. Modernisation that results in an increase in capacity, in terms of tonnage or engine power, can only be granted funding if capacity is simultaneously removed from the fishing fleet whereas modernisation that is considered to be general vessel maintenance cannot be funded. The majority of approved projects during the 1992-99 period have mainly concerned energy saving measures through the acquisition of new vessel engines and improvement of fish storage on board (personal communication with Directorate for Development, March 2000).
4.7 Capacity adjustment (1992-99) – Results
National capacity adjustment records held by the Directorate of Fisheries and Directorate for Development have been updated to conform to the latest segmentation codes of the Danish fleet under MAGP IV. Vessel tonnage is given as a mixture of GT/GRT, only using GRT when GT is unavailable. Engine power is given as the official effect kW. The complete set of official capacity adjustment figures can be viewed in Appendix D. The figures and tables below present the capacity adjustment process that has taken place during the 1992-99 period. The data source is the Directorate of Fisheries and the Directorate for Development.
16 Ministerial Announcement No. 354 of 17 June 1998
- 34 -
01,0002,0003,0004,0005,0006,0007,0008,0009,000
10,000
1992 1993 1994 1995 1996 1997 1998 1999
GT
/GR
T
05,00010,00015,00020,00025,00030,00035,00040,00045,00050,000
Off
kW
GT/GRT Off kW
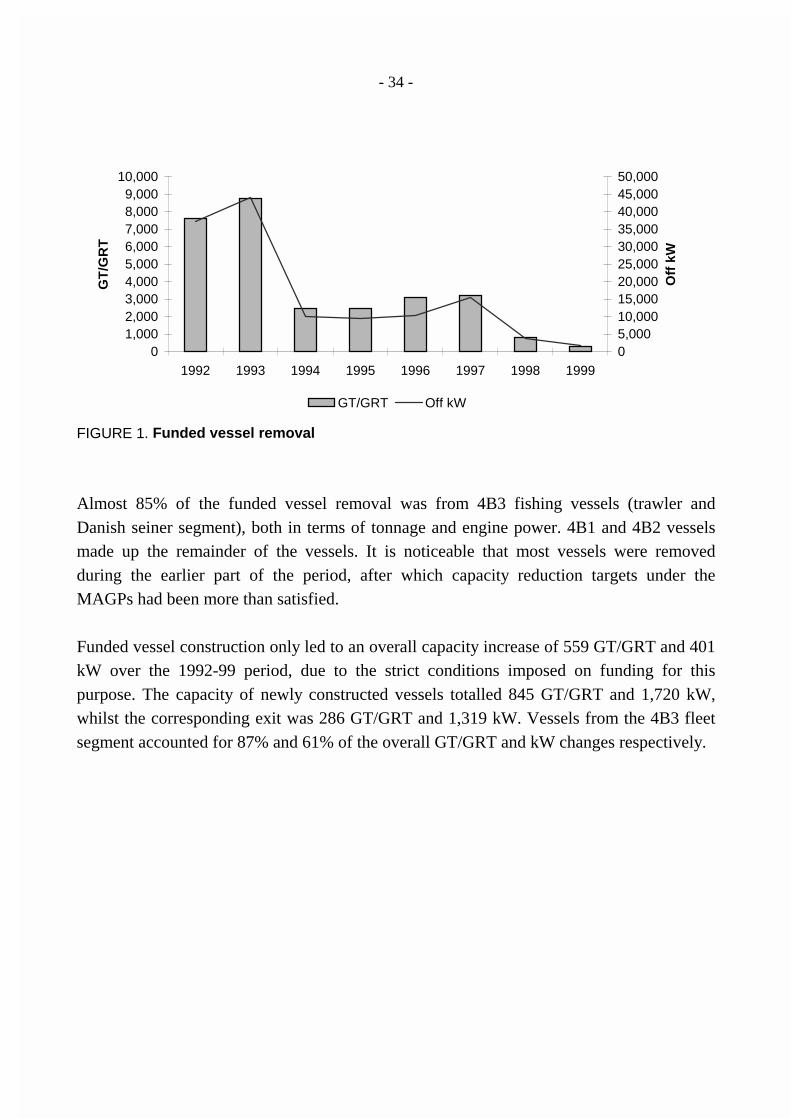
FIGURE 1. Funded vessel removal
Almost 85% of the funded vessel removal was from 4B3 fishing vessels (trawler and Danish seiner segment), both in terms of tonnage and engine power. 4B1 and 4B2 vessels made up the remainder of the vessels. It is noticeable that most vessels were removed during the earlier part of the period, after which capacity reduction targets under the MAGPs had been more than satisfied.
Funded vessel construction only led to an overall capacity increase of 559 GT/GRT and 401 kW over the 1992-99 period, due to the strict conditions imposed on funding for this purpose. The capacity of newly constructed vessels totalled 845 GT/GRT and 1,720 kW, whilst the corresponding exit was 286 GT/GRT and 1,319 kW. Vessels from the 4B3 fleet segment accounted for 87% and 61% of the overall GT/GRT and kW changes respectively.
- 35 -
0
200
400
600
800
1,000
1,200
1,400
1,600
1,800
1995 1996 1997 1998
GT/GRT Off kW
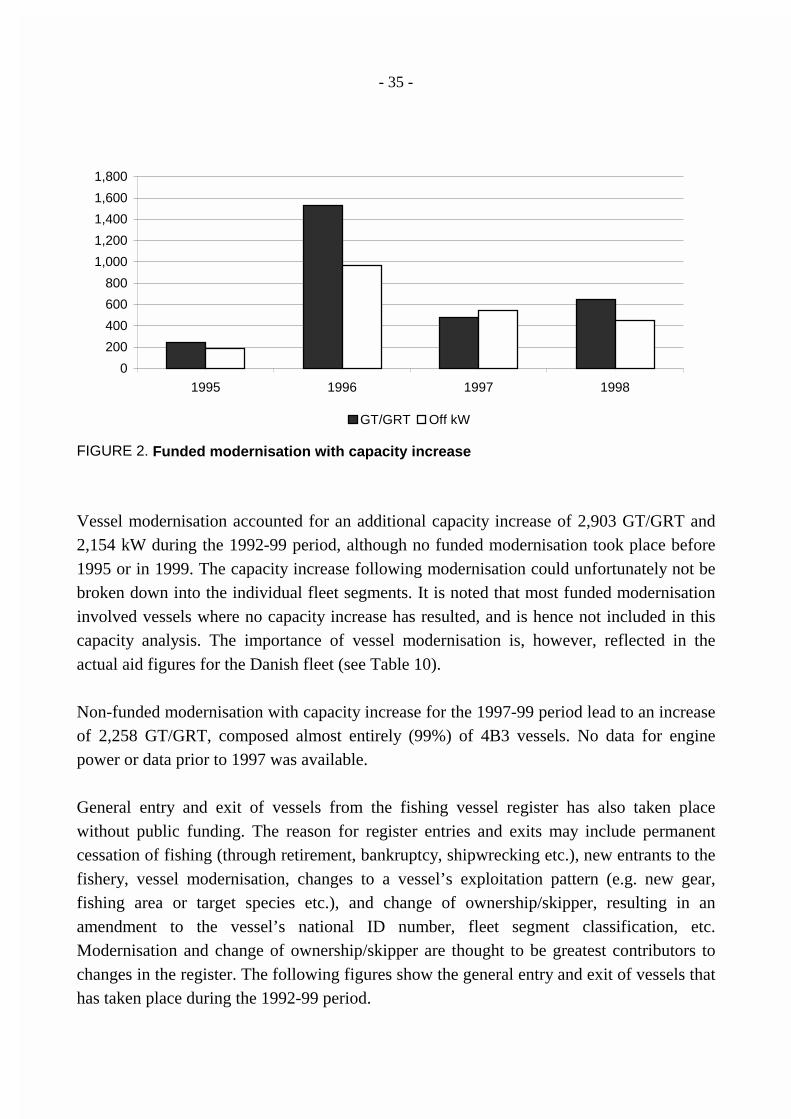
FIGURE 2. Funded modernisation with capacity increase
Vessel modernisation accounted for an additional capacity increase of 2,903 GT/GRT and 2,154 kW during the 1992-99 period, although no funded modernisation took place before 1995 or in 1999. The capacity increase following modernisation could unfortunately not be broken down into the individual fleet segments. It is noted that most funded modernisation involved vessels where no capacity increase has resulted, and is hence not included in this capacity analysis. The importance of vessel modernisation is, however, reflected in the actual aid figures for the Danish fleet (see Table 10). Non-funded modernisation with capacity increase for the 1997-99 period lead to an increase of 2,258 GT/GRT, composed almost entirely (99%) of 4B3 vessels. No data for engine power or data prior to 1997 was available.
General entry and exit of vessels from the fishing vessel register has also taken place without public funding. The reason for register entries and exits may include permanent cessation of fishing (through retirement, bankruptcy, shipwrecking etc.), new entrants to the fishery, vessel modernisation, changes to a vessel’s exploitation pattern (e.g. new gear, fishing area or target species etc.), and change of ownership/skipper, resulting in an amendment to the vessel’s national ID number, fleet segment classification, etc. Modernisation and change of ownership/skipper are thought to be greatest contributors to changes in the register. The following figures show the general entry and exit of vessels that has taken place during the 1992-99 period.

- 36 -
Perhaps the most noticeable development is the 1994 data where previously non-registered vessels entered the register (see Section 4.2). It is apparent that these new vessels were small in terms of tonnage and had a bigger impact on the overall engine power of the fleet.
0
5,000
10,000
15,000
20,000
25,000
1992 1993 1994 1995 1996 1997 1998 1999
GT
/GR
T
Entry Exit
FIGURE 3. Non-funded GT/GRT entry and exit
0
10,000
20,000
30,000
40,000
50,000
60,000
70,000
1992 1993 1994 1995 1996 1997 1998 1999
kW
Entry Exit
FIGURE 4. Non-funded kW entry and exit
4B3 vessels accounted for approximately 80% of all entries and exits in terms of tonnage and 68% in terms of engine power. Around 20% of all entries and exits in terms of engine power were vessels from the 4B1 segment.

- 37 -
The following figures show the resulting net effect of funded and non-funded capacity adjustment during the 1992-99 period.
-16,000-14,000-12,000-10,000-8,000-6,000-4,000-2,000
02,0004,000
1992 1993 1994 1995 1996 1997 1998 1999
GT
/GR
T
4B1 4B2 4B3 4B4
FIGURE 5. Net GT/GRT change 1992-99
-60,000-50,000-40,000-30,000-20,000-10,000
010,00020,00030,00040,000
1992 1993 1994 1995 1996 1997 1998 1999
kW
4B1 4B2 4B3 4B4
FIGURE 6. Net kW change 1992-99
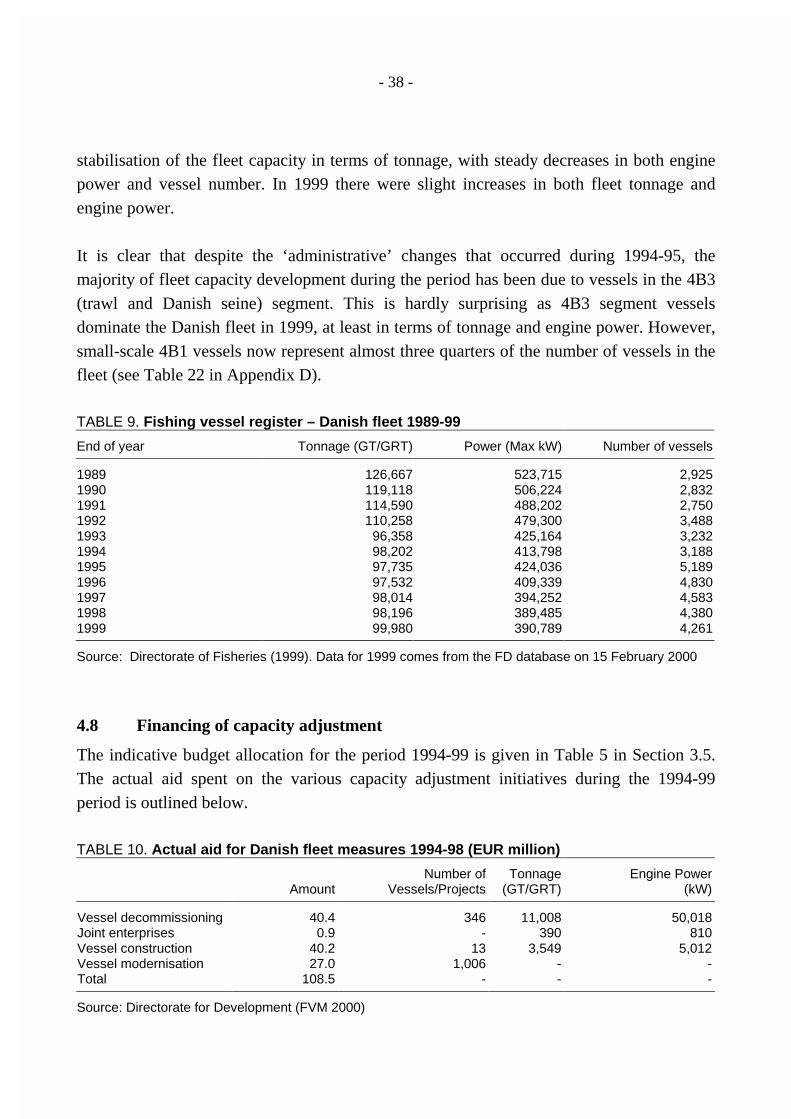
Data from the fishing vessel register (Table 9) seem to support this general capacity trend. The 1992-93 period saw a marked reduction in capacity, largely as a result of vessel decommissioning. The 1994-95 figures show an increase in tonnage, engine power and vessel number, following the decision that all vessels should be registered. This development is clearly shown in the figures above, with 4B1 vessels accounting for the majority of the capacity increase in 1994. The 1996-98 period saw a comparative
- 38 -
stabilisation of the fleet capacity in terms of tonnage, with steady decreases in both engine power and vessel number. In 1999 there were slight increases in both fleet tonnage and engine power. It is clear that despite the ‘administrative’ changes that occurred during 1994-95, the majority of fleet capacity development during the period has been due to vessels in the 4B3 (trawl and Danish seine) segment. This is hardly surprising as 4B3 segment vessels dominate the Danish fleet in 1999, at least in terms of tonnage and engine power. However, small-scale 4B1 vessels now represent almost three quarters of the number of vessels in the fleet (see Table 22 in Appendix D). TABLE 9. Fishing vessel register – Danish fleet 1989-99 End of year Tonnage (GT/GRT) Power (Max kW) Number of vessels 1989 126,667 523,715 2,925 1990 119,118 506,224 2,832 1991 114,590 488,202 2,750 1992 110,258 479,300 3,488 1993 96,358 425,164 3,232 1994 98,202 413,798 3,188 1995 97,735 424,036 5,189 1996 97,532 409,339 4,830 1997 98,014 394,252 4,583 1998 98,196 389,485 4,380 1999 99,980 390,789 4,261 Source: Directorate of Fisheries (1999). Data for 1999 comes from the FD database on 15 February 2000
4.8 Financing of capacity adjustment
The indicative budget allocation for the period 1994-99 is given in Table 5 in Section 3.5. The actual aid spent on the various capacity adjustment initiatives during the 1994-99 period is outlined below. TABLE 10. Actual aid for Danish fleet measures 1994-98 (EUR million)
Amount Number of
Vessels/Projects Tonnage
(GT/GRT) Engine Power
(kW) Vessel decommissioning 40.4 346 11,008 50,018 Joint enterprises 0.9 - 390 810 Vessel construction 40.2 13 3,549 5,012 Vessel modernisation 27.0 1,006 - - Total 108.5 - - - Source: Directorate for Development (FVM 2000)

- 39 -
TABLE 11. Actual aid for Danish fleet measures 1999 (EUR million)
FIFG (European Union) Public (National) Total Vessel decommissioning 0.67 0.67 1.34 Vessel construction 1.56 0.31 1.87 Vessel modernisation 9.66 1.94 11.6 Total 11.89 2.92 14.81 Source: Directorate for Development The forthcoming structural funding under the recently adopted FIFG programme for 2000-06 is expected to be as follows: TABLE 12. Aid budget for Danish fleet measures 2000-06 (EUR million)
FIFG (European Union) Public (National) Private (National) Total
Adjustment of fishing capacity/effort
16.8
16.8
0
33.6
Construction and modernisation
70.6
23.5
376.8
470.9
Total 87.4 40.3 376.8 504.5 Source: Directorate for Development (FVM 2000)
4.9 Capital development (1992-99)
It may be of interest to examine the capital involved in the capacity adjustment process. That is, what has been the net capital change over the period and how does this compare to the fleet development in physical terms that has already been addressed. The capital (insurance value) data set is sourced from the Directorate of Fisheries database and can be viewed in Appendix E. Figure 7 shows that there has been a steady decrease in the capital value of fishing vessels between 1992-96, although the 1997-99 period has seen a steady increase in capital of almost 7% in terms of insurance values. Vessel capitalisation in the 4B3 and 4B4 segments is the main reason for this increase.

- 40 -
600
620
640
660
680
700
720
740
760
1992 1993 1994 1995 1996 1997 1998 1999
EU
R m
illio
n
FIGURE 7. Insurance value of the Danish fleet 1992-99
Figure 8 below further portrays the capital development of the fleet for the 1992-99 period. The capacity adjustment process of the fleet has mostly concerned the 4B3 vessels in terms of the capital involved (between 84-87% for all categories). The figure also indicates that the value of the grant does not seem to cover the insurance value of the fishing vessels.
0
10
20
30
40
50
60
1992 1993 1994 1995 1996 1997 1998 1999
EU
R m
illio
n
Ins. value of vessels removed with funding Grant received by vessels removed with funding
Ins. value of vessels removed without funding Ins. value of newly entered vessels
FIGURE 8. Capital development 1992-99
Although the figure indicates that the insurance value of newly entered vessels peaked in 1997, this will have largely been offset by the insurance values of vessels removed in the same year.

- 41 -
Compared to the fleet adjustment process that has taken place in physical terms17, the capital development seems to provide a similar picture. Figures 9 and 10 below show that substantial reductions, in both physical (vessel tonnage) and capital (insurance value) terms, took place during 1992-93. The introduction of the smaller 4B1 vessels into the register in 1994 had little impact on the continued reduction of overall physical capacity and insurance value of the fleet up until 1996.
-16,000
-14,000-12,000
-10,000-8,000
-6,000
-4,000-2,000
02,000
4,000
1992 1993 1994 1995 1996 1997 1998 1999
NE
T G
T/G
RT
ch
ang
e
600
620
640
660
680
700
720
740
760
Ins.
val
ue
(EU
R m
illio
n)
GT/GRT Ins. value
FIGURE 9. Fleet capacity (GT/GRT) and capital development 1992-99
0
1,000
2,000
3,000
4,000
5,000
6,000
1992 1993 1994 1995 1996 1997 1998 1999
Nu
mb
er o
f ve
ssel
s
600
620
640
660
680
700
720
740
760
Ins.
val
ue
(EU
R m
illio
n)
Number of vessels Ins. value
FIGURE 10. Fleet capacity (vessels) and capital development 1992-99
17 Refer to Figures 5 and 6 in Section 4.7
- 42 -
The steady increase in fleet insurance value during the last three years can partly be explained by the shift away from capacity reduction. This is a reasonable assumption since MAGP IV targets were already met by this time. The main factor for the capital increase is thought to be the continued investment (i.e. modernisation) in existing vessels of the dominant 4B3 and 4B4 segments. This is further supported by the fact that although the number of vessels has decreased since 1994, the vessels removed have probably been marginal players in the fishery, of relatively little capital value. In fact, almost 88% of the number of vessels removed from the register since 1994 have been 4B1 and 4B2 vessels. Vessels from the 4B3 and 4B4 segments, on the other hand, represented over 85% of the total insurance value of the Danish fleet in 1999. The capacity/capital figures for 1997-99 would indicate that the structural policy is tending towards modernisation and renewal of vessels, especially of the 4B3 and 4B4 segments, leading to an overall increase in fleet capitalisation.
4.10 Future issues
The Danish fishing fleet has been restructured over the last decade, where the main emphasis has been to reduce the size of the fleet through vessel decommissioning. This was especially apparent in the early 1990’s. Very strict capacity regulations and funding criteria have limited the impact of construction and modernisation initiatives. The capacity of the fleet has a result been reduced by between 30 % and 40% over the last 10 years, and the fleet is now characterised by vessels that are on average almost 30 years old. Under the FIFG 2000-06 programme (outlined in FVM 2000) it is expected that adjustment of fishing capacity and fleet renewal will continue with specific aims of:
• Removing 2,800 GT/GRT and 12,000 kW from special fisheries (e.g. Limfjord mussel fishery)
• Removing 3,240 GT/GRT and 13,900 kW in other fisheries
• Constructing new vessels with capacity of 18,000 GT and 80,000 kW
• Allowing 2,800 modernisation projects Capacity removal is expected to result in the improved rentability of individual vessels, a reduction in fishing mortality and improved fish stock growth. New constructions and vessel modernisation are expected to lead to better product quality and price, fewer discards and by-catches, lower fuel consumption and improved safety on board (FVM 2000).

- 43 -
The overall capacity of the fleet is expected to remain relatively stable in accordance with the current national capacity regulations, since construction and modernisation is only permitted in cases where other capacity is removed first. However, the impact of technological progress and modernisation projects may result in an increase in effective capacity. Furthermore, despite physical capacity being capped, the capital invested in vessels is expected to continue to increase (as it has done since 1996). The capacity of the Danish fleet continues to be well within the MAGP targets and so it is anticipated that the Danish fleet will undergo a considerable renewal process, given the proposed budget details for the 2000-06 period. However, if the proposals of the recent Commission review of MAGP IV are implemented (see Section 3.6), capacity reductions of 9.6% and 8.4%, in terms of GT and kW respectively, will be required during the 2001-02 period18.
18 COM (2000) 272 final

- 44 -
Appendix A. Classification of stocks
TABLE 13. Critical stocks as stated in Council Decision 97/413/EC
Species
Zone
III bcd
III a
IV
VI
VII a
VII bc
VII efg hjk
VII d
VIII abd
VIII c IX a
MS
Herring (Clupea harengus)
FE DR FE OF
Mackerel (Scomber scombrus)
DR DR OF OF OF OF OF OF OF
Sardine (Sardina pilchardus)
DR
Salmon (Salmo Salar)
DR
Bluefin Tuna (Thunnus thynnus)
OF OF OF OF OF
Swordfish (Xiphias gladius)
OF OF OF OF OF
Cod (Gadus morhua)
OF DR DR DR DR OF DR
Haddock (Melanogrammus aeglefinus)
OF OF OF FE OF
Whiting (Merlangus merlangius)
FE OF FE FE FE
Saithe (Pollachius virens)
OF OF DR
Hake (Merluccius merluccius)
OF OF OF OF OF OF OF OF DR
Plaice (Pleuronectes platessa)
OF DR FE DR FE
Sole (Solea spp.)
DR OF DR OF OF
Anglerfish (Lophius spp.)
OF OF OF OF OF OF OF
Megrim (Lepidorhombus spp.)
FE FE FE FE FE FE FE
Nephrops
(Nephrops norvegicus) OF FE FE FE FE OF FE
DR Depletion risk: Spawning stock biomass presently below MBAL or likely to be in that position in the
short-term at current levels of fishing mortality OF Overfished: Moderate to substantial gains in long-term yield if effort is decreased; if heavily
overfished, medium-term risk of spawning stock biomass falling below MBAL FE Fully exploited: No substantial long-term gains or losses if effort is moderately increased or reduced Zones: III bcd (Baltic Sea), IIIa (Skagerrak and Kattegat), IV (North Sea), VI (West Scotland),
VIIa (Irish Sea), VIIbc (West Ireland), VIIefghjk (Celtic Sea and Western Channel), VIId (Eastern Channel), VIIIabd (Bay of Biscay), VIIIc and IXa (Iberian Peninsula), and MS (Mediterranean Sea)

- 45 -
Appendix B. Danish objectives of MAGP IV
TABLE 14. Fishing capacity reduction targets of Danish fleet segments under MAGP IV
Area
Stocks
Segment Catch
composition
Pilot rate Weighted reduction
Situation end 1997
Objective end 1997
Objective end 2001
GT* kW GT* kW GT* kW Coastal waters
- Vessels <12 m (4B1)
- 0% 0% 9,428 82,991 11,387 92,429 11,387 92,429
Subtotal 9,428 82,991 11,387 92,429 11,387 92,429 EU waters Demersal and
Flatfish Vessels =>12 m
(4B2) DR: 72.3% OF: 16.9%
Other: 10.8%
30% 26.8% 8,038 36,729 12,269 50,142 8,981 36,704
EU waters International
waters
Demersal Flatfish, Pelagic and Crustacea
Trawlers/ Danish seiners
(4B3)
DR: 3.7% OF: 3.5%
Other: 92.8%
25% 1.8% 81,170 276,143 102,342 317,822 100,500 312,101
EU waters International
waters
Pelagic Purse seiners (4B4)
DR: 10.4% OF: 0%
Other: 89.6%
30% 3.1% 7,863 15,821 12,045 22,913 11,672 22,203
Subtotal 97,071 328,693 126,656 390,877 121,152 371,008 Total 106,499 411,684 138,043 483,306 132,539 463,437 Note: DR = depletion risk, OF = overfished GT* includes estimated GT values in accordance with the present Decision. Objectives will be revised as real GT values become available Source: Commission Decision 98/126/EC

- 46 -
Appendix C. Danish MAGP III and IV results
TABLE 15. Tonnage development of Danish fleet segments 1992-96
End of year B08 B09 B10 B12 B13 B17 U Total
1991 3,003 - 2,001 83,085 14,977 6,258 82 109,406 1992 2,969 - 2,001 75,838 14,310 6,258 82 101,458 1993 2,973 - 256 65,350 13,678 6,207 82 88,546 1994 4,459 - - 63,203 13,417 6,207 82 87,368 1995 4,394 - - 61,102 12,677 6,207 6 84,386 1996 4,121 - - 58,775 12,021 6,225 6 81,148
% change +37% - - -29% -19% - - -25% Objective 1996 4,459 2,300 3,480 71,979 15,656 7,235 - 105,109 Sit./Obj. 1996 92% - - 82% 77% 86% - 77%
Note: Tonnage is measured in GRT for all segments except B08, which is given in GT. Hence the Total tonnage measure is given as a GRT/GT mix. The GRT figures include GRT estimations in accordance with the formula given in Commission Decision 97/259/EC Source: Com (97) 352 final TABLE 16. Engine power development of Danish fleet segments 1992-96
End of year B08 B09 B10 B12 B13 B17 U Total
1991 23,919 - 3,810 364,476 88,265 15,668 552 496,690 1992 24,574 - 3,810 330,671 85,359 15,668 552 460,634 1993 24,830 - 809 285,356 83,030 15,668 552 410,245 1994 44,784 - - 275,625 81,717 15,668 552 418,346 1995 44,457 - - 266,946 77,840 15,668 30 404,941 1996 42,163 - - 257,606 74,759 15,668 30 390,226
% change +76% - - -29% -15% - - -21% Objective 1996 44,784 5,700 3,810 314,439 93,998 17,312 - 480,043 Sit./Obj. 1996 94% - - 82% 80% 91% - 81%
Note: Engine power is measured in kW Source: Com (97) 352 final TABLE 17. Tonnage development of Danish fleet segments 1997-2001
End of year 4B1 4B2 4B3 4B4 Total
1996 9,428 8,038 81,170 7,863 106,499 1997 8,642 7,119 81,747 8,237 105,745 1998 8,069 7,125 82,164 8,237 105,595 1999 8,161 7,084 84,323 8,237 107,805
% change -13% -12% +4% +5% +1% Objective 2001 11,387 8,981 100,500 11,672 132,539
Sit. 1999/ Obj. 2001
72% 79%
84% 71% 81%
Note: Tonnage is measured in GT. 2,536 of the 4,453 vessels in the vessel register have an estimated GT Source: Com (1999) 175 final. The 1997-99 data comes from the Directorate of Fisheries database
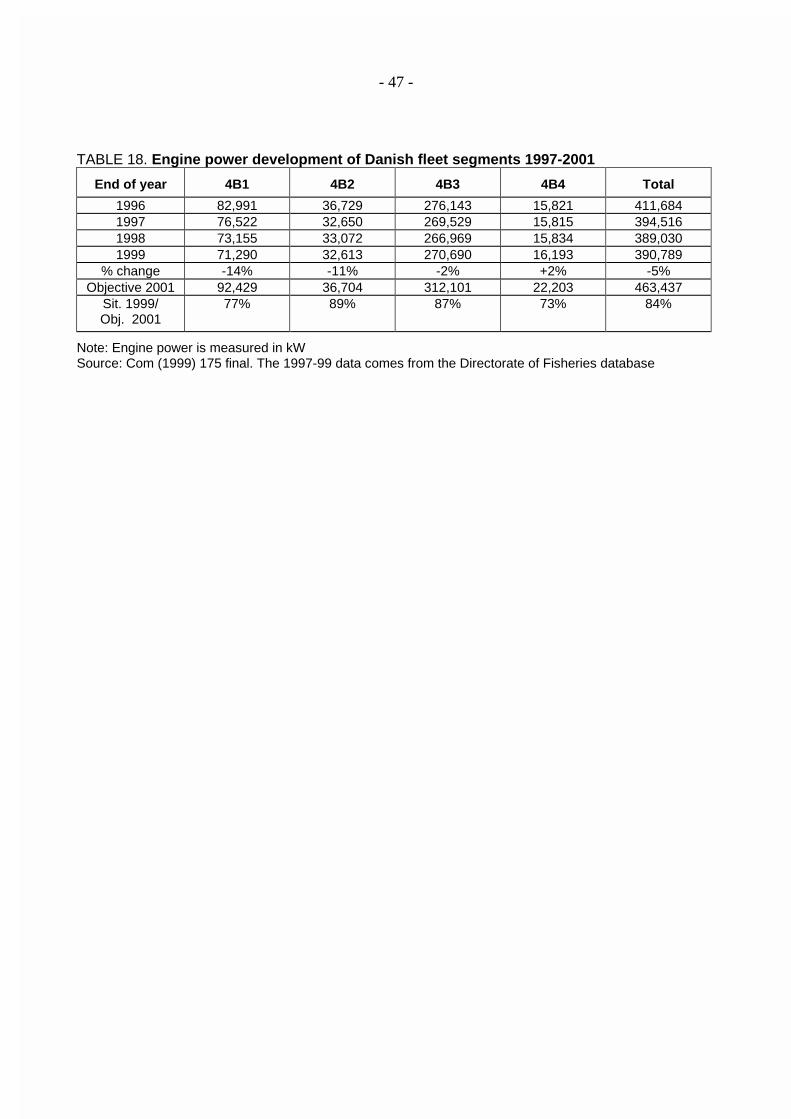
- 47 -
TABLE 18. Engine power development of Danish fleet segments 1997-2001
End of year 4B1 4B2 4B3 4B4 Total
1996 82,991 36,729 276,143 15,821 411,684 1997 76,522 32,650 269,529 15,815 394,516 1998 73,155 33,072 266,969 15,834 389,030 1999 71,290 32,613 270,690 16,193 390,789
% change -14% -11% -2% +2% -5% Objective 2001 92,429 36,704 312,101 22,203 463,437
Sit. 1999/ Obj. 2001
77% 89% 87% 73% 84%
Note: Engine power is measured in kW Source: Com (1999) 175 final. The 1997-99 data comes from the Directorate of Fisheries database
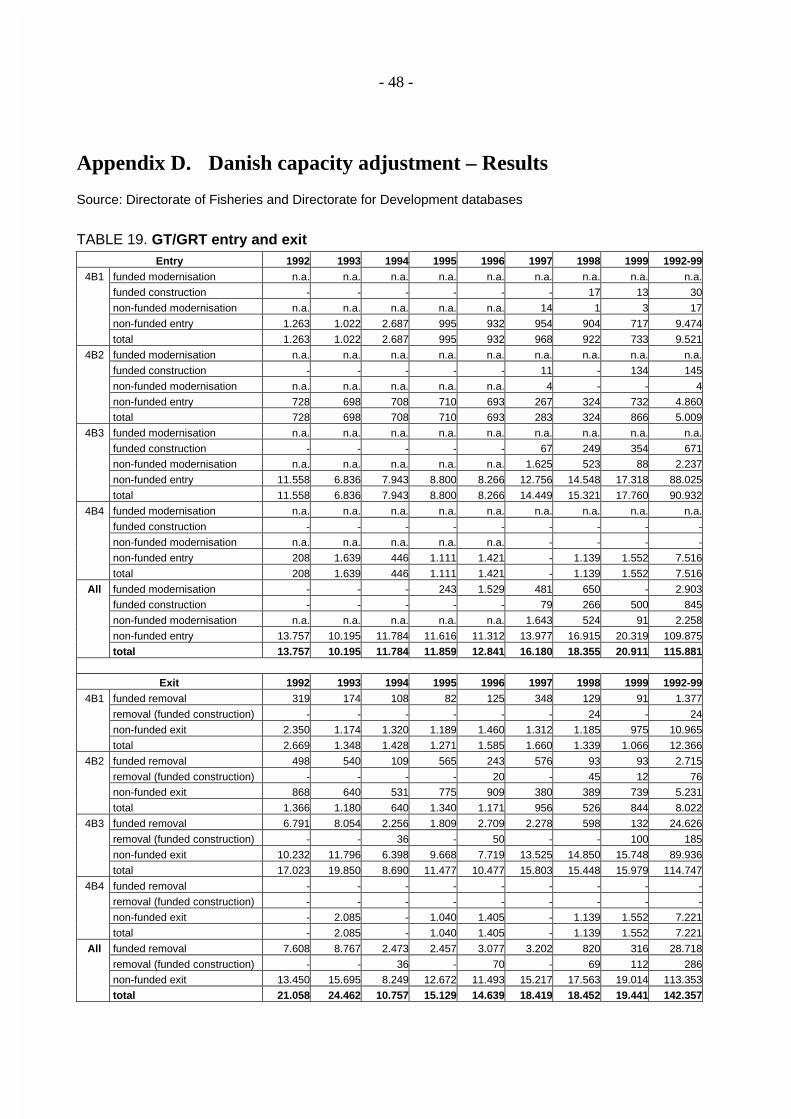
- 48 -
Appendix D. Danish capacity adjustment – Results
Source: Directorate of Fisheries and Directorate for Development databases
TABLE 19. GT/GRT entry and exit
Entry 1992 1993 1994 1995 1996 1997 1998 1999 1992-99 4B1 funded modernisation n.a. n.a. n.a. n.a. n.a. n.a. n.a. n.a. n.a.
funded construction - - - - - - 17 13 30
non-funded modernisation n.a. n.a. n.a. n.a. n.a. 14 1 3 17
non-funded entry 1.263 1.022 2.687 995 932 954 904 717 9.474
total 1.263 1.022 2.687 995 932 968 922 733 9.521
4B2 funded modernisation n.a. n.a. n.a. n.a. n.a. n.a. n.a. n.a. n.a.
funded construction - - - - - 11 - 134 145
non-funded modernisation n.a. n.a. n.a. n.a. n.a. 4 - - 4
non-funded entry 728 698 708 710 693 267 324 732 4.860
total 728 698 708 710 693 283 324 866 5.009
4B3 funded modernisation n.a. n.a. n.a. n.a. n.a. n.a. n.a. n.a. n.a.
funded construction - - - - - 67 249 354 671
non-funded modernisation n.a. n.a. n.a. n.a. n.a. 1.625 523 88 2.237
non-funded entry 11.558 6.836 7.943 8.800 8.266 12.756 14.548 17.318 88.025
total 11.558 6.836 7.943 8.800 8.266 14.449 15.321 17.760 90.932
4B4 funded modernisation n.a. n.a. n.a. n.a. n.a. n.a. n.a. n.a. n.a.
funded construction - - - - - - - - -
non-funded modernisation n.a. n.a. n.a. n.a. n.a. - - - -
non-funded entry 208 1.639 446 1.111 1.421 - 1.139 1.552 7.516
total 208 1.639 446 1.111 1.421 - 1.139 1.552 7.516
All funded modernisation - - - 243 1.529 481 650 - 2.903 funded construction - - - - - 79 266 500 845
non-funded modernisation n.a. n.a. n.a. n.a. n.a. 1.643 524 91 2.258
non-funded entry 13.757 10.195 11.784 11.616 11.312 13.977 16.915 20.319 109.875
total 13.757 10.195 11.784 11.859 12.841 16.180 18.355 20.911 115.881
Exit 1992 1993 1994 1995 1996 1997 1998 1999 1992-99 4B1 funded removal 319 174 108 82 125 348 129 91 1.377
removal (funded construction) - - - - - - 24 - 24
non-funded exit 2.350 1.174 1.320 1.189 1.460 1.312 1.185 975 10.965
total 2.669 1.348 1.428 1.271 1.585 1.660 1.339 1.066 12.366
4B2 funded removal 498 540 109 565 243 576 93 93 2.715
removal (funded construction) - - - - 20 - 45 12 76
non-funded exit 868 640 531 775 909 380 389 739 5.231
total 1.366 1.180 640 1.340 1.171 956 526 844 8.022
4B3 funded removal 6.791 8.054 2.256 1.809 2.709 2.278 598 132 24.626
removal (funded construction) - - 36 - 50 - - 100 185
non-funded exit 10.232 11.796 6.398 9.668 7.719 13.525 14.850 15.748 89.936
total 17.023 19.850 8.690 11.477 10.477 15.803 15.448 15.979 114.747
4B4 funded removal - - - - - - - - -
removal (funded construction) - - - - - - - - -
non-funded exit - 2.085 - 1.040 1.405 - 1.139 1.552 7.221
total - 2.085 - 1.040 1.405 - 1.139 1.552 7.221
All funded removal 7.608 8.767 2.473 2.457 3.077 3.202 820 316 28.718
removal (funded construction) - - 36 - 70 - 69 112 286
non-funded exit 13.450 15.695 8.249 12.672 11.493 15.217 17.563 19.014 113.353
total 21.058 24.462 10.757 15.129 14.639 18.419 18.452 19.441 142.357

- 49 -
TABLE 20. kW entry and exit
Entry 1992 1993 1994 1995 1996 1997 1998 1999 1992-99
4B1 funded modernisation n.a. n.a. n.a. n.a. n.a. n.a. n.a. n.a. n.a.
funded construction - - - - - - 138 120 258
non-funded modernisation n.a. n.a. n.a. n.a. n.a. n.a. n.a. n.a. n.a.
non-funded entry 9.169 8.199 28.481 8.179 7.145 8.000 7.683 5.989 82.845
total 9.169 8.199 28.481 8.179 7.145 8.000 7.821 6.109 83.103
4B2 funded modernisation n.a. n.a. n.a. n.a. n.a. n.a. n.a. n.a. n.a.
funded construction - - - - - 118 - 298 416
non-funded modernisation n.a. n.a. n.a. n.a. n.a. n.a. n.a. n.a. n.a.
non-funded entry 4.437 4.253 3.345 4.117 4.005 1.734 2.254 4.061 28.206
total 4.437 4.253 3.345 4.117 4.005 1.852 2.254 4.359 28.622
4B3 funded modernisation n.a. n.a. n.a. n.a. n.a. n.a. n.a. n.a. n.a.
funded construction - - - - - 125 286 635 1.046
non-funded modernisation n.a. n.a. n.a. n.a. n.a. n.a. n.a. n.a. n.a.
non-funded entry 42.637 25.066 24.158 29.325 25.928 37.897 38.418 43.885 267.314
total 42.637 25.066 24.158 29.325 25.928 38.022 38.704 44.520 268.360
4B4 funded modernisation n.a. n.a. n.a. n.a. n.a. n.a. n.a. n.a. n.a.
funded construction - - - - - - - - -
non-funded modernisation n.a. n.a. n.a. n.a. n.a. n.a. n.a. n.a. n.a.
non-funded entry 662 3.622 912 2.724 3.055 - 2.078 3.221 16.274
total 662 3.622 912 2.724 3.055 - 2.078 3.221 16.274
All funded modernisation - - - 188 967 545 454 - 2.154
funded construction - - - - - 243 424 1.053 1.720
non-funded modernisation n.a. n.a. n.a. n.a. n.a. n.a. n.a. n.a. n.a.
non-funded entry 56.905 41.140 56.896 44.345 40.133 47.631 50.433 57.156 394.639
total 56.905 41.140 56.896 44.533 41.100 48.419 51.311 58.209 398.513
Exit 1992 1993 1994 1995 1996 1997 1998 1999 1992-99
4B1 funded removal 1.993 1.163 566 571 814 2.640 935 602 9.282
removal (funded construction) - - - - - - 163 - 163
non-funded exit 9.381 8.140 8.720 8.981 10.803 10.319 9.107 7.363 72.814
total 11.374 9.303 9.286 9.552 11.617 12.959 10.205 7.965 82.259
4B2 funded removal 1.929 2.158 612 2.204 933 2.381 427 449 11.093
removal (funded construction) - - - - 81 - 158 114 353
non-funded exit 4.162 3.439 3.258 4.620 4.415 2.556 2.512 4.476 29.438
total 6.091 5.597 3.870 6.824 5.429 4.937 3.097 5.039 40.884
4B3 funded removal 33.331 40.719 8.749 6.631 8.576 10.621 2.538 673 111.838
removal (funded construction) - - 113 - 250 - - 440 803
non-funded exit 41.087 34.156 5.869 30.776 25.824 40.334 40.059 41.361 259.466
total 74.418 74.875 14.731 37.407 34.650 50.955 42.597 42.474 372.107
4B4 funded removal - - - - - - - - -
removal (funded construction) - - - - - - - - -
non-funded exit - 4.534 - 2.724 3.055 - 2.078 3.221 15.612
total - 4.534 - 2.724 3.055 - 2.078 3.221 15.612
All funded removal 37.253 44.040 9.926 9.406 10.323 15.641 3.900 1.724 132.213
removal (funded construction) - - 113 - 331 - 321 554 1.319
non-funded exit 54.630 50.269 17.847 47.101 44.097 53.209 53.756 56.421 377.330
total 91.883 94.309 27.886 56.507 54.751 68.850 57.977 58.699 510.862

- 50 -
TABLE 21. Net GT/GRT and kW changes 1992-99 GT/GRT 1992 1993 1994 1995 1996 1997 1998 1999 1992-99
Entry 4B1 1.263 1.022 2.687 995 932 968 922 733 9.521
4B2 728 698 708 710 693 283 324 866 5.009
4B3 11.558 6.836 7.943 8.800 8.266 14.449 15.321 17.760 90.932
4B4 208 1.639 446 1.111 1.421 - 1.139 1.552 7.516
All 13.757 10.195 11.784 11.859 12.841 16.180 18.355 20.911 115.881
Exit 4B1 2.669 1.348 1.428 1.271 1.585 1.660 1.339 1.066 12.366
4B2 1.366 1.180 640 1.340 1.171 956 526 844 8.022
4B3 17.023 19.850 8.690 11.477 10.477 15.803 15.448 15.979 114.747
4B4 - 2.085 - 1.040 1.405 - 1.139 1.552 7.221
All 21.058 24.462 10.757 15.129 14.639 18.419 18.452 19.441 142.357
Net change 4B1 (1.406) (326) 1.259 (276) (653) (693) (417) (334) (2.846)
4B2 (638) (482) 68 (630) (478) (673) (202) 22 (3.013)
4B3 (5.465) (13.014) (747) (2.677) (2.211) (1.354) (127) 1.781 (23.815)
4B4 208 (446) 446 71 16 - - - 295
All (7.301) (14.267) 1.027 (3.270) (1.798) (2.239) (97) 1.469 (26.476)
KW 1992 1993 1994 1995 1996 1997 1998 1999 1992-99 Entry 4B1 9.169 8.199 28.481 8.179 7.145 8.000 7.821 6.109 83.103
4B2 4.437 4.253 3.345 4.117 4.005 1.852 2.254 4.359 28.622
4B3 42.637 25.066 24.158 29.325 25.928 38.022 38.704 44.520 268.360
4B4 662 3.622 912 2.724 3.055 - 2.078 3.221 16.274
All 56.905 41.140 56.896 44.533 41.100 48.419 51.311 58.209 398.513
Exit 4B1 11.374 9.303 9.286 9.552 11.617 12.959 10.205 7.965 82.259
4B2 6.091 5.597 3.870 6.824 5.429 4.937 3.097 5.039 40.884
4B3 74.418 74.875 14.731 37.407 34.650 50.955 42.597 42.474 372.107
4B4 - 4.534 - 2.724 3.055 - 2.078 3.221 15.612
All 91.883 94.309 27.886 56.507 54.751 68.850 57.977 58.699 510.862
Net change 4B1 (2.205) (1.104) 19.195 (1.373) (4.472) (4.959) (2.384) (1.856) 844
4B2 (1.654) (1.344) (525) (2.707) (1.424) (3.085) (843) (680) (12.262)
4B3 (31.781) (49.809) 9.427 (8.082) (8.722) (12.933) (3.893) 2.046 (103.747)
4B4 662 (912) 912 - - - - - 662
All (34.978) (53.169) 29.010 (11.974) (13.651) (20.431) (6.666) (490) (112.349)
TABLE 22. Fishing vessel register – Danish fleet 31.12.1999
Segment Tonnage (GT/GRT) Power (Max kW) Number of vessels
4B1 8,187 71,290 3,007 4B2 5,438 32,613 202 4B3 78,118 270,690 1,041 4B4 8,237 16,196 11
Total 99,980 390,789 4,261 Source: Directorate of Fisheries database on 15 February 2000

- 51 -
Appendix E. Capital development
TABLE 23. Capital development of the Danish fleet 1992-99 (EUR million) 1992 1993 1994 1995 1996 1997 1998 1999 1992-99
Vessel exit with funding
4B1 Insurance value 1.6 1.1 0.5 0.6 0.7 2.2 0.9 0.1 7.6
Grant 1.0 0.5 0.3 0.4 0.6 1.7 0.6 0.1 5.1
Vessels 37 23 11 10 17 50 20 1 169
4B2 Insurance value 2.4 2.7 0.6 3.2 1.3 3.0 0.5 - 13.7
Grant 1.6 1.8 0.3 2.2 0.9 2.1 0.3 - 9.1
Vessels 15 16 5 13 9 22 4 - 84
4B3 Insurance value 43.1 51.6 11.9 9.1 14.0 11.6 3.0 - 144.2
Grant 28.0 32.8 7.5 6.2 8.2 7.7 2.0 - 92.4
Vessels 128 176 37 29 43 62 16 - 491
Total insurance value 47.1 55.4 12.9 12.9 16.0 16.7 4.4 0.1 165.5
Total grant 30.5 35.1 8.2 8.7 9.7 11.4 2.9 0.1 106.6
Number of vessels 180 215 53 52 69 134 40 1 744
Vessel exit without funding
4B1 Insurance value 0.8 0.8 1.1 0.8 1.0 1.3 0.9 0.7 7.4
Vessels 128 46 68 47 75 54 48 43 509
4B2 Insurance value - 0.7 0.4 0.4 0.6 0.2 0.8 1.5 4.5
Vessels 1 6 2 3 4 3 3 6 28
4B3 Insurance value 6.9 26.7 4.1 5.9 2.8 7.6 5.2 3.4 62.6
Vessels 25 27 25 19 17 19 16 13 161
Total insurance value 7.8 28.1 5.7 7.1 4.5 9.0 6.9 5.6 74.6
Number of vessels 154 79 95 69 96 76 67 62 698
Vessel entry
4B1 Insurance value 0.5 1.2 1.4 0.6 0.4 0.4 0.4 0.5 5.4
Vessels 57 57 1,524 55 100 43 26 16 1,878
4B2 Insurance value 0.9 0.4 0.9 0.7 - 0.2 0.3 0.9 4.4
Vessels 2 1 1 2 - 2 1 1 10
4B3 Insurance value 5.2 1.8 1,9 6.2 2.2 20.3 6.6 14.4 58.6
Vessels 13 7 8 11 7 12 12 13 83
Total insurance value 6.6 3.4 4.2 7.5 2.6 20.9 7.3 15.9 68.5
Number of vessels 72 65 1,533 68 107 57 39 30 1,971
Fleet register
4B1 Insurance value 55.7 55.0 56.1 54.7 52.3 49.8 47.5 50.6
Vessels 1,801 1,808 3,873 3,784 3,481 3,317 3,121 3,007
4B2 Insurance value 59.5 59.2 60.0 57.1 54.5 51.1 51.4 48.7
Vessels 272 262 256 245 232 203 206 202
4B3 Insurance value 583.6 508.2 497.9 489.9 481.6 490.2 501.7 522.1
Vessels 1,418 1,219 1,168 1,145 1,108 1,051 1,035 1,041
4B4 Insurance value 42.1 43.2 43.2 41.5 41.8 51.3 51.3 52.4
Vessels 11 11 11 11 11 11 11 11
Total insurance value 741 665.6 657.2 643.2 630.2 642.3 651.9 673.7
Number of vessels 3,502 3,300 5,308 5,185 4,832 4,582 4,373 4,261 Source: Directorate of Fisheries database

- 52 -
List of Tables and Figures
Table 1 Community register of fishing vessels - Total EU fleet 1989-98 Table 2 EU fleet developments against MAGP targets Table 3 EU fleet objectives for 2001 Table 4 MS fleet objectives for 2001 Table 5 Aid budget for EU fleet measures 1994-99 Table 6 Indicative MS budgets under FIFG 2000-06 Table 7 Danish fleet development against MAGP targets 1992-96 Table 8 Danish fleet development against MAGP targets 1997-2001 Table 9 Fishing vessel register - Danish fleet 1989-99 Table 10 Actual aid for Danish fleet measures 1994-98 Table 11 Actual aid for Danish fleet measures 1999 Table 12 Aid budget for Danish fleet measures 2000-06 Table 13 Critical stocks as stated in Council Decision 97/413/EC Table 14 Fishing capacity reduction targets of Danish fleet segments under MAGP IV Table 15 Tonnage development of Danish fleet segments 1992-96 Table 16 Engine power development of Danish fleet segments 1992-96 Table 17 Tonnage development of Danish fleet segments 1997-2001 Table 18 Engine power development of Danish fleet segments 1997-2001 Table 19 GT/GRT entry and exit Table 20 kW entry and exit Table 21 Net GT/GRT and kW changes 1992-99 Table 22 Fishing vessel register – Danish fishing fleet 31.12.1999 Table 23 Capital development of the Danish fleet 1992-99 Figure 1 Funded vessel removal Figure 2 Funded modernisation with capacity increase Figure 3 Non-funded GT/GRT entry and exit Figure 4 Non-funded kW entry and exit Figure 5 Net GT/GRT change 1992-99 Figure 6 Net kW change 1992-99 Figure 7 Insurance value of the Danish fleet 1992-99 Figure 8 Capital development 1992-99 Figure 9 Fleet capacity (GT/GRT) and capital development 1992-99 Figure 10 Fleet capacity (vessels) and capital development 1992-99

- 53 -
Acronyms
EU European Union MS Member State(s) FAO Food and Agriculture Organisation of the United Nations STECF Scientific, Technical and Economic Committee for Fisheries MSY Maximum Sustainable Yield MEY Maximum Economic Yield MBAL Minimum Biologically Acceptable Level MAGP Multiannual Guidance Programme FIFG Financial Instrument for Fisheries Guidance GRT Gross Registered Tonnage, 1947 GT Gross Tonnage, 1969 HP Horsepower kW Kilowatt DKK Danish Kroner ECU European Currency Unit EUR Euro US$ United States Dollars
Exchange rate
1 EUR = 7.44 DKK

- 54 -
References
General papers/reports
Concerted Action (1999) “Overcapacity, Overcapitalisation and Subsidies in European Fisheries”. Proceedings of the first workshop of EU FAIR Concerted Action on Economics and the Common Fisheries Policy: Perspectives for the future economic management of Europe’s fisheries, edited by Hatcher, A. & Robinson, K. CEMARE, April 1999.
Cunningham, S., Dunn, M. & Whitmarsh, D. (1985) “Fisheries Economics: An
introduction. Mansell Publishing, London. FAO (1997) “The State of World Fisheries and Aquaculture”. Rome, 1996. FAO (1998) “Report of the FAO Technical Working Group on the Management of Fishing
Capacity”. La Jolla, USA, 15-18 April 1998. FAO (1999) “Managing Fishing Capacity: Selected papers on the underlying concepts and
issues”. FAO Fisheries Technical Paper 386, edited by Greboval, D. Rome, 1999. Fitzpatrick, J. & Newton, C. (1998) “Assessment of the World’s Fishing Fleet 1991-97”.
Paper submitted to Greenpeace International, May 1998. Frost, H., Lanters, R., Smit, J. & Sparre, P. (1995) “An Appraisal of the Effects of the
Decommissioning Scheme in the Case of Denmark and the Netherlands”. DIFER/SUC publication 16/95.
Garcia, S. M. & Newton, C. (1997) “Current Situation, Trends and Prospects in World
Capture Fisheries”, in Pickitch, E. K. et al., “Global Trends: Fisheries Management (American Fisheries Society Symposium 20. Maryland, USA).
Grainger, R. J. R., Garcia, S. M. (1996) “Chronicles of Marine Fishery Landings (1950-
94): Trend analysis and fisheries potential”. FAO Fisheries Technical Paper 359. Rome, 1996.
Greboval, D. (1999) “Assessing Excess Fishing Capacity at Worldwide Level”, in
Greboval, D. “Managing Fishing Capacity: Selected papers on the underlying concepts and issues”. FAO Fisheries Technical Paper 386. Rome, 1999.
Hatcher, A. (2000) “Subsidies for European fishing fleets: The European Community’s
structural policy for fisheries 1971-99”. Marine Policy, Vol. 24, pp. 129-140.

- 55 -
Holland, D. & Sutinen, J. G. (1998) “Draft Guidelines on Fishing Capacity”. Paper prepared for the FAO Technical Working Group on the Management of Fishing Capacity. La Jolla, USA, 15-18 April 1998.
Lindebo, E. (1999a) “A Review of Fishing Capacity and Overcapacity”. SJFI Working
Paper no. 14/1999. Revised and extended version of “A Review of the Fishing Capacity Concept” prepared for the XIth Annual Conference of EAFE. Dublin, 7-10 April 1999.
Lindebo, E. (1999b) “Fishing Capacity and EU Fleet Adjustment”. SJFI Working Paper
no. 19/1999. Paper prepared for the FAO Technical Consultation on the Measurement of Fishing Capacity. Mexico City, 29 November-3 December 1999.
Mace, P. “Developing and Sustaining World Fishery Resources: The state of science and
management”. Paper presented at the World Fisheries Congress, Brisbane 1996. Unpublished.
Metzner, R. & Rawlinson, P. (1998) “Fisheries Structural Adjustment: Towards a national
framework”. Fisheries Victoria and Commonwealth Department of Primary Industries and Energy. Australia, March 1998.
Milazzo, M. (1998) “Subsidies in World Fisheries: A reexamination”. World Bank
Technical Paper no. 406, Fisheries Series. Washington D.C., 1998. Porter, G. (1998) “Too much Fishing Fleet, Too few Fish: A proposal for eliminating
global fishing overcapacity”. Prepublication Draft. WWF, August 1998. Community papers/reports
Commission (1996) “Proposal for a Council Decision concerning the objectives and detailed rules for restructuring the Community fisheries sector for the period from 1 January 1997 to 31 December 2001 with a view to achieving a balance on a sustainable basis between resources and their exploitation”. COM (96) 237 final. Brussels, 29.5.1996.
Commission (1997) “The Annual Report to the Council and to the European Parliament on
the results of the Multi-Annual Guidance Programmes for the fishing fleets at the end of 1996”. COM (97) 352 final. Brussels, 11.7.1997.
Commission (1999) “The Annual Report to the Council and to the European Parliament on
the results of the Multi-Annual Guidance Programmes for the fishing fleets at the end of 1997”. COM (1999) 175 final. Brussels, 27.4.1999.

- 56 -
Commission (2000) “Preparation for a mid-term review of the Multi-Annual Guidance Programmes (MAGP)”. Report from the Commission to the Council. COM (2000) 272 final. Brussels, 10.5.2000.
DG XIV (1998) “European Union aid for the development of the fishing industry (1994-
99)”. Made available on DG XIV Internet website. DG Fisheries (1999a) “New arrangements for community structural assistance to the
fisheries sector 2000-2006”. Made available on DG Fisheries Internet website. DG Fisheries (1999b) “Statistical Bulletin”. European Commission, September 1999. Lassen, H. et al. (1996) “Report of the Group of Independent Experts to advise the
European Commission on the Fourth Generation of Multi-Annual Guidance Programmes”. DG XIV/298/96-EN, April 1996.
Roitmann, M. & Hopkins, P. (1999) “Measurement and Management of Fleet Capacity in
the European Union”. Paper prepared for the FAO Technical Consultation on the Measurement of Fishing Capacity. Mexico City, 29 November-3 December 1999.
STECF (1999) “8th Report of the Scientific, Technical and Economic Committee for
Fisheries”. Commission Staff Working Paper, SEC (1999) 932. Brussels, 14.6.1999. Community legislation
Commission Decision 92/595/EEC on a multiannual guidance programme for the fishing fleet of Denmark for the period 1993 to 1996 pursuant to Council Regulation (EEC) No 4028/86 on Community measures to improve and adapt structures in the fisheries and aquaculture sectors, OJ L 401, 31.12.1992.
Commission Decision 94/928/EC on the adoption of the Community programme for
structural assistance in the fisheries and aquaculture sector and the processing and marketing of its products in Denmark (Objective 5a regions – the period 1994 to 1999), OJ L 364, 31.12.1994.
Commission Decision 97/259/EC concerning the tonnage objectives of the multiannual
guidance programmes for the Community fishing fleets for the period 1992 to 1996, OJ L 104, 22.4.1997.
Commission Decision 98/126/EC approving the multiannual guidance programme for the
fishing fleet of Denmark for the period from January 1, 1997 to December 31, 2001. WorldFish Report, February 26, 1998.
- 57 -
Commission Decision 1999/500/EC fixing an indicative allocation by Member State of the commitment appropriations under the financial instrument for fisheries guidance (FIFG) outside the Objective 1 regions of the Structural Funds for the period 2000 to 2006, OJ L 161, 26.6.1999.
Commission Regulation (EC) No 2090/98 concerning the fishing vessel register of the
Community, OJ L 266, 1.10.1998. Commission Regulation (EC) No 2091/98 concerning the segmentation of the Community
fishing fleet and fishing effort in relation to the multiannual guidance programmes, OJ L 266, 1.10.1998.
Council Decision 97/413/EC concerning the objectives and detailed rules for restructuring
the Community fisheries sector for the period from 1 January 1997 to 31 December 2001 with a view to achieving a balance on a sustainable basis between resources and their exploitation, OJ L 175, 3.7.1997.
Council Regulation (EEC) No 2930/86 defining the characteristics of fishing vessels, OJ L
274, 25.9.1986, amended by Council Regulation (EC) No 3259/94, OJ L 339, 29.12.1994.
Council Regulation (EC) No 3699/93 concerning the criteria and conditions for EU
structural intervention in fisheries, aquaculture and fish processing and sale of fisheries and aquaculture products, OJ L 346, 31.12.93 (in Danish).
Council Regulation (EC) No 2792/1999 laying down the detailed rules and arrangements
regarding Community structural assistance in the fisheries sector, OJ L 337, 30.12.1999.
Danish reports/legislation
Børsen (2000) “Record desire to invest in the fishery”. Article by Jette Warrer Knudsen quoting 1999 investment figures from the Directorate for Development. Børsen, 5 January 2000.
Directorate for Development (1999) “Grant arrangements for the fisheries sector”.
Miscellaneous documents. Strukturdirektoratet, September 1999. Directorate of Fisheries (1992) “Guidelines for adjustment of fleet harvesting capacity”.
Fiskeridirektoratet, September 1990, amended April 1992.
- 58 -
Directorate of Fisheries (1995) “Guidelines to permit vessel replacement, engine power
change and modernisation”. Fiskeridirektoratet, June 1995. Directorate of Fisheries (1999) “Yearbook of Fishery Statistics 1998”. Fiskeridirektoratet,
November 1999. FVM (2000) “The Danish application for funding for the development of the fisheries
sector in Denmark 2000-2006”. Draft programming document for the fisheries sector, received by the European Commission 29 February 2000. Fødevareministeriet, 1 March 2000.
Ministerial Announcement No. 669 of 14 July 1994 concerning permanent cessation
support to commercial fishers. Fødevareministeriet, J. nr. 91-350-2. Ministerial Announcement No. 257 of 3 April 1997 concerning vessels that are used in
commercial fisheries. Fødevareministeriet, J. nr. 1997-1183-0001. Ministerial Announcement No. 1120 of 15 December 1997 concerning vessels that are used
in commercial fisheries. Fødevareministeriet, J. nr. 1997-1180-0023. Ministerial Announcement No. 354 of 17 June 1998 concerning grants for modernisation
and improvement of fishing vessels. Fødevareministeriet, J. nr. 1998-216-13. Ministerial Announcement No. 772 of 14 October 1999 concerning grants for construction
of fishing vessels. Fødevareministeriet, J. nr. 1998-216-17.

- 59 -
Working Papers Statens Jordbrugs- og Fiskeriøkonomiske Institut
1/98 June 98 Christian F. Bach and
Søren E. Frandsen European Integration and the Common Agricultural Policy
2/98 June 98 Kim Martin Lind An I(2) Analysis of a Factor
Demand System Applied to Danish Pig Production
3/98 Juni 98 Boie S. Frederiksen og
Anne H. Johannessen Ledsageforanstaltningernes anvendelse – et studie af incita- mentforhold
4/98 June 98 Lars-Bo Jacobsen The Danish Contribution to the
GTAP Database Methodological and Practical Issues
5/98 Juni 98 Ole Olsen, Svend Sørensen og
Christian Tronier Driftsgrensøkonomi for økologisk jordbrug 1996/97
6/98 Juli 98 Steffen Møllenberg og
Henrik B. Pedersen Grønne afgifter, energitilskud og gartnerierhvervets økonomi
7/98 August 98 Søren Svendsen Regnskabsanalyse af 11
driftsfælleskaber om malkekvæg 8/98 September 98 Chantal Pohl Nielsen The GTAP Database
Content and Methodology 9/98 September 98 Chantal Pohl Nielsen Economic structures and trade
patterns of Denmark, the EU and the CEECs – Extracts from the GTAP database
10/98 Oktober 98 Michael H. J. Stæhr Elasticities in the GTAP-Model 11/98 November 98 Hans G. Jensen, Søren E.
Frandsen and Christian F. Bach Agricultural and Economic-Wide Effects of European Enlargement: Modelling the Common Agricultural Policy
12/98 November 98 S.E. Frandsen, H.G. Jensen and
D.M. Vanzetti Expanding ’Fortress Europe’ Implication of European enlarge- ment for non-member regions

- 60 -
13/98 December 98 Jesper S. Schou Undersøgelse af landbrugets pesticidanvendelse – Metode, data og resultater
1/99 Januar 99 Søren E. Frandsen og Hans G.
Jensen Kan velfærdsændringer i de generelle ligevægtsmodeller forklares? En dekomponering af den ækvivalerende variation
2/99 Februar 99 Knud Kristensen and Jørgen
Dejgaard Jensen Danish Farmers’ Adjustment Capabilities: The Case of Fertiliser Regulation
3/99 Februar 99 Michael Parsby og Håkan
Rosenqvist Energiafgrødernes produktions- økonomi - med særlig fokus på pil
4/99 Februar 99 Søren Svendsen Teorigrundlag for undersøgelse af
formaliserede samarbejder 5/99 Marts 99 Lars-Bo Jacobsen og
Søren E. Frandsen Analyse af de samfundsøkonomiske konsekvenser af en omlægning af dansk landbrug til økologisk produktion
6/99 Marts 99 Tove Christensen
Jesper S. Schou Oversigt over økonomiske ana-lyser af landbrugets pesticidanvendelse
7/99 April 99 Chantal Pohl Nielsen EU Enlargement and The Common
Agricultural Policy: Modeling Issues
8/99 Juni 99 Nicolaj H. Nørgaard Driftsøkonomisk betydning af salmonella hos svin
9/99 Juni 99 Kim Martin Lind Long-run Behavior and Uncertainty
in World Cereal Markets
10/99 Juli 99 Ole Olsen, Svend Sørensen og Christian Tronier
Driftsgrensøkonomi for økologisk jordbrug 1997/98
11/99 September 99 Jesper T. Graversen Implementering af multi-site
konceptet - en organisationsøkonomisk vurdering af incitamenter, muligheder og begrænsninger

- 61 -
12/99 September 99 Jesper Levring Andersen A Review of the Basic Biological and Economic Approaches to Fishing Effort
13/99 September 99 Max Nielsen EU Seafood Markets – Integration
and Demand 14/99 September 99 Erik Lindebo A Review of Fishing Capacity and
Overcapacity 15/99 September 99 Hild Rygnestad The Agenda 2000 policy reform for
agriculture and rural development. Opportunities and limits for environmental protection
16/99 September 99 Niels Tvedegaard Omlægning til økologisk svine- og
planteproduktion - analyse af de økonomiske konsekvenser på udvalgte bedrifter
17/99
November 99
Knud Kristensen
A Consistent Estimate of Danish Agriculture's Production Function
18/99 December 99 Lars-Bo Jacobsen Samfundsøkonomiske virkninger af
kvælstofafgifter I landbruget 19/99 December 99 Erik Lindebo Fishing Capacity and EU Fleet
Adjustment 20/99 December 99 Nicolaj H. Nørgaard Sammenhæng imellem driftsøkonomi
og brysthindear hos svin 21/99 December 99 Hild Rygnestad og
Jesper S. Schou Miljøøkonomiske analyser: Kvælstofoverskud og datakrav
22/99 December 99 Jørgen Dejgaard Jensen, Knud
Kristensen and Connie Nielsen Estimating Behavioural Parameters for CGE-Models: Using Micro-Econometrically Estimated Flexible Functional Forms
23/99 December 99 Jesper S. Schou Integrerede økonomi- og miljø-
analyser for dansk landbrug Sammenfatning af arbejder i Ph.D afhandlingen
24/99 December 99 Jens Abildtrup Status for miljøvenlige jordbrugs-
foranstaltninger, kortlægning af fremtidige analysebehov

- 62 -
1/00 Februar 2000 Tove Christensen & Hild Rygnestad
Environmental Cross Compliance: Topics for future research
2/00 Februar 2000 Niels Tvedegaard Omlægning til økologisk planteavl –
analyse af de økonomiske konse-kvenser på udvalgte planteavlsbe-drifter
3/00 May 2000 Chantal Pohl Nielsen and
Kym Anderson GMOs, Trade Policy, and Welfare in Rich and Poor Countries
4/00 June 2000 Hild Rygnestad Integrating environmental economics
and policy analyses in a geographical information system
5/00 July 2000 Arne Lauridsen, Ole Olsen og
Svend Sørensen Driftsgrensøkonomi for økologisk jordbrug 1998/99
6/00 July 2000 Henning Porskrog Calculation SGM. How we do it in
Denmark 7/00 Juli 2000 Steffen Møllenberg Gartnerierhvervets produktivitets-
udvikling – samt udviklingen i mængder og priser, herunder bytteforhold, mellem 1980 og 1998/99
8/00 August 2000 Paul Rye Kledal Økologisk jordbrug for fremtiden? –
en økonomisk analyse af de potentielle økologiske jordbrugere
9/00 Oktober 2000 Max Nielsen Calculations of Danish prices of
unprocessed seafood 10/00 November 2000 Erik Lindebo Capacity Development of the EU and
Danish Fishing Fleets