
Cumulative Network Meta-Analysis and Clinical Practice ...
115
Cumulative Network Meta-Analysis and Clinical Practice Guidelines - A Case Study on First-Line Medical Therapies for Primary Open-Angle Glaucoma by Benjamin Rouse A thesis submitted to the Department of Epidemiology of Johns Hopkins Bloomberg School of Public Health in conformity with the requirements for the degree of Master in Health Science, Epidemiology, Clinical Trials and Evidence Synthesis Baltimore, Maryland May 2015
Transcript of Cumulative Network Meta-Analysis and Clinical Practice ...

Cumulative Network Meta-Analysis and Clinical Practice Guidelines - A
Case Study on First-Line Medical Therapies for Primary Open-Angle
Glaucoma
by
Benjamin Rouse
A thesis submitted to the Department of Epidemiology of Johns Hopkins Bloomberg
School of Public Health in conformity with the requirements for the degree of
Master in Health Science,
Epidemiology,
Clinical Trials and Evidence Synthesis
Baltimore, Maryland
May 2015
ii
Abstract
Background
Clinical practice guidelines are statements of recommendations for patient care. Studies
have shown that guideline recommendations do not always depend on evidence from
clinical trials or systematic reviews. It is unknown whether no high quality evidence
exists, evidence exists but authors were unaware of it, or advanced statistical methods
were not available to them to address their questions. Our objective was to compare the
guideline recommendations for first-line medical therapy for primary open-angle
glaucoma (POAG) from each major update of the American Academy of
Ophthalmology’s (AAO) Preferred Practice Patterns (PPPs) with the actual evidence base
available at the time.
Methods
We identified and extracted recommendations relevant to first-line medical therapy for
POAG from each version of the AAO PPP. We searched MEDLINE, EMBASE, and
CENTRAL for randomized controlled trials published up to March 2014. We analyzed
intraocular pressure (IOP) outcome data as available at the time of each major guideline
update. We used network meta-analysis to determine which of all drugs “works best.”
Results
We identified 9 versions of AAO’s guideline for POAG published between 1989 and
2010. Based on similarity in treatment recommendations or discussion, we grouped these

iii
guidelines into 5 sets: 1989-1992, 1996, 2000-2003; 2005-2006, and 2010. The 2010
guideline recommended prostaglandins as initial treatment, but previous sets presented
treatment options without recommending one drug (or class) over another. Based on a
series of network meta-analyses of trials published up to around the time of the latest
guideline in each set, all drugs are more effective than placebo or no treatment at each
time point, but effect size appears to decrease over time. Network meta-analysis indicated
that the most effective drug and class (at time point analyzed) were: levobunolol and beta
blockers (1991), levobunolol and alpha agonists (1995), travoprost and prostaglandins
(2002), bimatoprost and prostaglandins (2004 and 2009).
Conclusions
Network meta-analysis improves our understanding of the comparative effectiveness of
multiple interventions. Had network meta-analysis been available, the AAO POAG PPP
could have recommended prostaglandins (current first-line treatment) seven years before
it actually did. Guideline developers should consider using results from network meta-
analyses in forming future recommendations.
Advisor: Tianjing Li, PhD, MD, MHS
Second reader: Roberta W. Scherer, PhD, MS

iv
Acknowledgements
I would like to thank Tianjing Li for serving as my main thesis advisor. I would
also like to thank Roberta Scherer for her assistance as a second reader and my academic
advisor. I would like to thank Hwanhee Hong, Qiyuan Shi, Lijuan Zeng, Gillian
Gresham, Kexin Jin, Cesar Ugarte-Gil, Sueko Ng, and Nan Guo for their help with study
screening, data abstraction, and data analysis. Finally, I would like to thank my family
and friends for their encouragement throughout the program.
The project was funded by Grant 1 RC1 EY020140 and Grant 1 U01 EY020522,
National Eye Institute, National Institutes of Health, United States (PI: Dr. Kay
Dickersin).

v
Table of Contents
1 Introduction ................................................................................................................. 1
2 Objective ..................................................................................................................... 4
3 Methods....................................................................................................................... 5
3.1 Guideline identification and extraction ................................................................ 5
3.2 Systematic review and network meta-analysis..................................................... 5
3.2.1 Eligibility criteria .......................................................................................... 6
3.2.2 Identification of included studies .................................................................. 6
3.2.3 Data abstraction and management ................................................................ 7
3.2.4 Qualitative synthesis ..................................................................................... 7
3.2.5 Quantitative synthesis ................................................................................... 8
3.2.6 Evaluation of network meta-analysis assumptions ....................................... 8
3.2.7 Measures of relative treatment effect ............................................................ 9
3.3 Guideline and network meta-analysis comparison............................................. 10
4 Results ....................................................................................................................... 11
4.1 Guideline identification and extraction .............................................................. 11
4.2 Network meta-analysis ....................................................................................... 11
4.2.1 Search results and general study characteristics ......................................... 11
4.2.2 Risk of bias ................................................................................................. 13
4.2.3 Interventions ............................................................................................... 13
4.2.4 Network meta-analysis outcomes ............................................................... 14
4.2.5 Inconsistency............................................................................................... 15
4.3 Guideline and network meta-analysis comparison............................................. 15
5 Discussion ................................................................................................................. 17
6 References ................................................................................................................. 22
7 Tables ........................................................................................................................ 26
7.1 Table 1 Recommendations from AAO POAG PPPs ......................................... 26
vi
7.2 Table 2 Summary estimates for intraocular pressure (mmHg) at 3 months
derived from network meta-analysis ............................................................................. 27
7.2.1 Table 2a Network meta-analysis IOP estimates for drugs from studies
published by 1991 ..................................................................................................... 27
7.2.2 Table 2b Network meta-analysis IOP estimates for drugs from studies
published by 1995 ..................................................................................................... 28
7.2.3 Table 2c Network meta-analysis IOP estimates for drugs from studies
published by 2002 ..................................................................................................... 29
7.2.4 Table 2d Network meta-analysis IOP estimates for drugs from studies
published by 2004 ..................................................................................................... 30
7.2.5 Table 2e Network meta-analysis IOP estimates for drugs from studies
published by 2009 ..................................................................................................... 31
7.2.6 Table 2f Network meta-analysis IOP estimates for drugs from studies
published by 2014 ..................................................................................................... 32
7.2.7 Table 2g Network meta-analysis IOP estimates for classes from studies
published by 1991 ..................................................................................................... 33
7.2.8 Table 2h Network meta-analysis IOP estimates for classes from studies
published by 1995 ..................................................................................................... 34
7.2.9 Table 2i Network meta-analysis IOP estimates for classes from studies
published by 2002 ..................................................................................................... 35
7.2.10 Table 2j Network meta-analysis IOP estimates for classes from studies
published by 2004 ..................................................................................................... 36
7.2.11 Table 2k Network meta-analysis IOP estimates for classes from studies
published by 2009 ..................................................................................................... 37
7.2.11 Table 2l Network meta-analysis IOP estimates for classes from studies
published by 2014 ..................................................................................................... 38
7.3 Table 3. Guideline and network meta-analysis comparison .............................. 39
8 Figures....................................................................................................................... 40
8.1 Figure 1 Selection of studies .............................................................................. 40
8.2 Figure 2 Risk of bias figure ................................................................................ 41

vii
8.2.1 Figure 2a Risk of bias figure for studies published up to 1991 .................. 41
8.2.2 Figure 2b Risk of bias figure for studies published up to 1995 .................. 41
8.2.3 Figure 2c Risk of bias figure for studies published up to 2002 .................. 42
8.2.4 Figure 2d Risk of bias figure for studies published up to 2004 .................. 42
8.2.5 Figure 2e Risk of bias figure for studies published up to 2009 .................. 43
8.2.6 Figure 2f Risk of bias figure for studies published up to 2014 ................... 43
8.3 Figure 3 Network graphs .................................................................................... 44
8.3.1 Figure 3a Network graph for studies published up to 1991 ........................ 44
8.3.2 Figure 3b Network graph for studies published up to 1995........................ 44
8.3.3 Figure 3c Network graph for studies published up to 2002 ........................ 45
8.3.4 Figure 3d Network graph for studies published up to 2004........................ 45
8.3.5 Figure 3e Network graph for studies published up to 2009 ........................ 46
8.3.6 Figure 3f Network graph for studies published up to 2014 ........................ 46
8.4 Figure 4 Funnel plots of treatment effect relative to placebo at each network
meta-analysis time point ............................................................................................... 47
8.4.1 Figure 4a Funnel plot for drug effect relative to placebo ........................... 47
8.4.2 Figure 4b Funnel plot for class effect relative to placebo ........................... 48
8.5 Figure 5 Ranking probabilities for any treatment at any position ...................... 49
8.5.1 Figure 5a Ranking probabilities for any drug at any position from studies
published by 1991 ..................................................................................................... 49
8.5.2 Figure 5b Ranking probabilities for any drug at any position from studies
published by 1995 ..................................................................................................... 50
8.5.3 Figure 5c Ranking probabilities for any drug at any position from studies
published by 2002 ..................................................................................................... 51
8.5.4 Figure 5d Ranking probabilities for any drug at any position from studies
published by 2004 ..................................................................................................... 52
8.5.5 Figure 5e Ranking probabilities for any drug at any position from studies
published by 2009 ..................................................................................................... 53
viii
8.5.6 Figure 5f Ranking probabilities for any drug at any position from studies
published by 2014 ..................................................................................................... 54
8.5.7 Figure 5g Ranking probabilities for any class at any position from studies
published by 1991 ..................................................................................................... 55
8.5.8 Figure 5h Ranking probabilities for any class at any position from studies
published by 1995 ..................................................................................................... 56
8.5.9 Figure 5i Ranking probabilities for any class at any position from studies
published by 2002 ..................................................................................................... 57
8.5.10 Figure 5j Ranking probabilities for any class at any position from studies
published by 2004 ..................................................................................................... 58
8.5.11 Figure 5k Ranking probabilities for any class at any position from studies
published by 2009 ..................................................................................................... 59
8.5.12 Figure 5l Ranking probabilities for any class at any position from studies
published by 2014 ..................................................................................................... 60
8.6 Figure 6 Cumulative ranking of treatments at each network meta-analysis time
point… .......................................................................................................................... 61
8.6.1 Figure 6a Cumulative ranking of drugs at each network meta-analysis time
point………………… .............................................................................................. 61
8.6.2 Figure 6b Cumulative ranking of class at each network meta-analysis time
point………….. ........................................................................................................ 61
Appendix I. Search Strategy ............................................................................................. 62
Appendix II. References to included studies .................................................................... 68
Appendix III. Characteristics of included studies ............................................................. 78
Appendix IV. Risk of bias table ........................................................................................ 84
Appendix V. Pair-wise meta-analysis ............................................................................... 92
App V. Table 1. Summary estimates for intraocular pressure at 3 months derived from
pair-wise meta-analysis for drugs in studies published by 1991 .................................. 92
App V. Table 3. Summary estimates for intraocular pressure at 3 months derived from
pair-wise meta-analysis for drugs in studies published by 2002 .................................. 93
ix
App V. Table 2. Summary estimates for intraocular pressure at 3 months derived from
pair-wise meta-analysis for drugs in studies published by 1995 .................................. 94
App V. Table 4. Summary estimates for intraocular pressure at 3 months derived from
pair-wise meta-analysis for drugs in studies published by 2004 .................................. 95
App V. Table 5. Summary estimates for intraocular pressure at 3 months derived from
pair-wise meta-analysis for drugs in studies published by 2009 .................................. 96
App V. Table 6. Summary estimates for intraocular pressure at 3 months derived from
pair-wise meta-analysis for drugs in studies published by 2014 .................................. 97
App V. Table 7. Summary estimates for intraocular pressure at 3 months derived from
pair-wise meta-analysis for classes in studies published by 1991 ................................ 98
App V. Table 8. Summary estimates for intraocular pressure at 3 months derived from
pair-wise meta-analysis for classes in studies published by 1995 ................................ 99
App V. Table 8. Summary estimates for intraocular pressure at 3 months derived from
pair-wise meta-analysis for classes in studies published by 2002 .............................. 100
App V. Table 9. Summary estimates for intraocular pressure at 3 months derived from
pair-wise meta-analysis for classes in studies published by 2004 .............................. 101
App V. Table 10. Summary estimates for intraocular pressure at 3 months derived
from pair-wise meta-analysis for classes in studies published by 2009 ..................... 102
App V. Table 11. Summary estimates for intraocular pressure at 3 months derived
from pair-wise meta-analysis for classes in studies published by 2014 ..................... 103
Curriculum Vitae ............................................................................................................ 104

1
1 Introduction
Clinical practice guidelines are statements of recommendations for patient care
that are intended to be based on the best available evidence.1, 2
Historically, guidelines
had primarily represented the opinions of individual authors or the consensus of experts.3
With the advent of evidence-based medicine, however, guidelines have increasingly
made use of randomized controlled trials (RCTs) and synthesis of RCTs in the form of
systematic reviews and meta-analyses to form the basis of recommendations.2 Despite the
push towards evidence-based guidelines, there may still be many recommendations that
are based on lower levels of evidence. Tricoci et al., for example, examined 17 recent
cardiovascular guidelines and found that among the 16 guidelines that reported levels of
evidence, recommendations were most frequently based on expert opinion, case studies,
or standard of care.4 It is unknown in these cases whether no high quality evidence exists,
evidence exists but authors were unaware of it, or advanced statistical methods were not
available for them to address their questions.
When quantitatively evaluating the evidence base to make a guideline
recommendation, the standard meta-analytic techniques may not always be adequate. A
standard meta-analysis can only compare two treatments at a time, and only those
treatments that have been compared directly in clinical trials. When developing a
guideline for a particular condition, in many cases multiple treatment options must be
considered, and direct comparisons may be available only for some pairs of treatments. In
these cases, an alternative to the standard meta-analysis may be used, the network meta-
analysis. A network meta-analysis looks across the entire network of trials of treatments
for a specific condition and uses information from both direct and indirect comparisons

2
(i.e. using studies comparing treatments A and B and studies comparing B and C to
estimate the comparison between A and C) to make inferences about the comparative
effectiveness of all treatments in a single analysis.5,6
Since they enable an “all-way”
comparison, network meta-analyses are particularly suited for informing evidence-based
guideline recommendations.
Clinical fields which could most benefit from network meta-analysis are those for
which a number of treatment options are available. One such area is primary open-angle
glaucoma (POAG). POAG is an eye condition in which damage has occurred to the optic
nerve and is associated with factors such as high intraocular pressure (IOP), age, and
being African American.7 POAG makes up the majority of glaucoma cases.
8 Since IOP is
the only known modifiable risk factor for POAG, treatment efficacy is generally
determined by reduction in IOP.7,9
One of the earliest sets of guidelines that has been
influential in the care of POAG is the American Academy of Ophthalmology’s (AAO)
POAG Preferred Practice Pattern (PPP).7, 10-17
The first version of this guideline was
published in 1989, with major revisions being published approximately every three to
five years.
When the AAO PPP guideline was first developed, evidence was gathered based
on the guideline panel members’ preexisting knowledge; each member submitted what
they considered seminal works and these works were distributed among the rest of the
panel.18
In 1996, the panel began using literature searching methods to gather evidence,
though details of the search were not reported. The panel also began rating the strength of
the evidence in three levels: “I” for evidence from RCTs, “II” for “an appropriately
controlled case series and sufficient statistical analysis,” and “III” for “expert opinion.”12
3
In the 2000 publication, the panel started reporting more details about the literature
search, such as databases searched and publication years included.13
The criteria for
strength of the evidence was also revised. “I” represented “strong evidence in support of
the statement” based on study design, study populations, general quality, and statistical
methods.13
“II” represented “substantial evidence in support of the statement” based on
lacking one or more of the components for level “I” categorization. The definition for
“III,” similar to before, represented a “consensus of expert opinion.”13
In 2010, the
categorizations for strength of evidence were again redefined.17
“I” was for evidence
based on high quality RCTs or meta-analyses. “II” represented evidence from well-
designed non-randomized controlled trials, cohort studies, case-control studies, or
multiple-time series studies. Support was rated as “III” for evidence from descriptive
studies, case reports, or expert committee/organization reports.17
By using a cumulative network meta-analysis (i.e. conducting network meta-
analysis on a collection of studies published up to a time point), the evidence base for
first line medical treatments can be compared with the recommendations for treatment for
each major revision in the AAO guideline. Findings from this study will inform guideline
developers about the potential benefits of incorporating the results of network meta-
analyses to form recommendations in the future. This study is not intended as criticism of
guideline developers for not using statistical methods that were undeveloped at the time.
Rather, we would like to examine what impact such techniques would have had, had they
been available at the time.

4
2 Objective
The objective of this study was to compare the clinical recommendations for first-
line medical therapy for POAG from each major update of AAO’s POAG PPP with the
actual evidence base as determined by network meta-analysis available at the time of
each major update.
5
3 Methods
3.1 Guideline identification and extraction
We identified nine versions of the AAO’s POAG PPP from the AAO website
(http://www.aao.org/preferred-practice-patterns-publication) from 1989 to 2010, updated
about every three to five years. Since only the latest version could be obtained online, we
contacted the AAO’s librarian who provided the remaining versions.19
One individual
reviewed each version of the guideline, identified sections discussing treatment for
POAG, and extracted recommendations on specific drugs or drug classes for initial
treatment, references cited for recommendations, and numerical estimates of efficacy or
effectiveness (i.e. reduction of IOP) for drugs or drug classes. If a guideline included no
specific recommendation for a drug or drug class, we extracted general recommendations
for POAG management with medical therapies (e.g. “Medical therapy should be initial
treatment for POAG”), as well as discussions about available medical therapies (e.g.
“Treatment A is most frequently prescribed as initial treatment”). We considered
recommendations evidence-based if they were based on a least one high-quality large
RCT or a systematic review. When consecutive guideline versions presented identical
recommendations or discussions regarding medical treatment, we grouped them together.
Therefore, the nine guidelines were divided into five groups based on their
recommendations.
3.2 Systematic review and network meta-analysis
This study was conducted using RCTs identified from an ongoing systematic
review.20
We performed a network meta-analysis for each group of guidelines. Based on
the latest guideline in each group, each corresponding network meta-analysis was
comprised of all eligible studies published either up to the stopping point for the literature
6
search reported in the guideline or, if such a point is not reported, a year before that
guideline was published (to allow for lag time between publication and inclusion of
evidence in guideline). An additional analysis was performed with all studies obtained
from the published literature up to 2014.
3.2.1 Eligibility criteria
The eligibility criteria described here are the same as the underlying systematic
review, unless otherwise noted.20
Eligible studies were RCTs with at least 60% of
participants having a diagnosis of POAG or ocular hypertension (OHT), as defined by the
trial. Trials included in this analysis also had to evaluate first line medical treatments for
POAG or OHT, and compared single active treatments with no treatment, placebo, or
other single active treatments.
Trials were excluded if less than 10 participants were enrolled per treatment arm
or if participants were followed for outcomes less than 28 days after randomization.
For this analysis, we examined mean IOP at 3 months as a continuous variable in
units of mmHg as the primary outcome. When a trial measured IOP multiple ways, the
priority for selection of IOP measurement was based on the following order: mean
diurnal IOP, 24-hour mean IOP, peak IOP, morning IOP, and trough IOP. If a trial did
not report IOP values at 3 months, we used data from the closest follow-up time point
instead. IOP was selected as the primary outcome based on a preliminary analysis of
guidelines indicating that it is the primary efficacy endpoint on which guideline
recommendations were made.7
3.2.2 Identification of included studies
We searched the Cochrane Register of Controlled Trials (CENTRAL) in The
Cochrane Library, MEDLINE, and EMBASE in November 17, 2009 and the search was

7
updated in March 11, 2014. Although the Food and Drug Administration (FDA) was
searched for additional trials for the underlying systematic review, we did not include
these trials in this project because none of the guidelines reported searching the FDA
website. The search strategies are available in Appendix 1. Two individuals
independently screened titles and abstracts of identified records for potential eligibility.
We obtained the full texts for records considered potentially eligible and these articles
were then assessed independently for eligibility for the review by two individuals. When
feasible, two individuals assessed the non-English language reports for eligibility,
otherwise a single individual who was a native or fluent speaker of the language was
responsible for assessing eligibility. We resolved discrepancies in classification of
eligibility of full text articles through discussion or consultation with a third person.
3.2.3 Data abstraction and management
Two individuals independently abstracted data from eligible trials on the study
design, participant and intervention characteristics, outcomes, risk of bias, and
quantitative results on treatment effects and safety using electronic forms developed and
maintained in the Systematic Review Data Repository (http://srdr.ahrq.gov/).21,22
We
used the Cochrane Risk of Bias Tool to grade each of the following methodological
domains at “low” “high” or “unclear” risk of bias: sequence generation and allocation
sequence concealment (selection bias), masking of participants and outcome assessors
(information bias), trial funding, and author financial relationships.23
We resolved
discrepancies in data abstraction through discussion or consultation with a third person.
3.2.4 Qualitative synthesis
We examined clinical, methodological, and statistical heterogeneity. We
investigated clinical heterogeneity in terms of participant characteristics (e.g. age of

8
participants and baseline IOP) and trial interventions. For methodological heterogeneity,
we considered study design and risk of bias.
3.2.5 Quantitative synthesis
Our analysis did not distinguish between drug concentrations; comparisons were
based on the active ingredient and class of that ingredient. We first conducted pair-wise
meta-analyses for all direct comparisons using random-effects models assuming
comparison-specific heterogeneity and a common heterogeneity across all comparisons at
both the drug and class level. To assess the statistical heterogeneity, we examined the I2
and tau2 values for these models. Pair-wise meta-analyses were conducted in STATA
13®.24
Next, we fit Bayesian random-effects network meta-analysis models based on the
Lu and Ades approach in WinBUGS 1.4.3. 25-27
This model also accounts for the within-
study correlation of multi-arm trials.25-26
We applied non-informative, yet proper, priors
so that the data dominate the posterior distribution. We drew samples of the parameters
of interest from the full posterior distribution using Markov Chain Monte Carlo (MCMC)
algorithms. We used 2 chains and obtained 50,000 samples (after a 20,000 sample burn-
in period). Our approach to model class effect was based on the approach used by Mayo-
Wilson et al.28
In this model, class effect is estimated from the pooled distribution of
estimates from individual treatments in that class. This method allows us to use data from
all trials for class effect, rather than discarding trials comparing drugs from the same
class. We assumed that variance was homogeneous at both the drug and the class level.
3.2.6 Evaluation of network meta-analysis assumptions
A valid network meta-analysis requires the assumption that there are no
systematic differences between included comparisons other than the treatments
9
themselves.5 We examined this assumption based on the distribution of participant
characteristics, interventions, and design characteristics among trials. We further
considered the statistical disagreement between direct and indirect comparisons, or
inconsistency, present among studies. To assess inconsistency, we used the loop-specific
approach with inconsistency models. For the loop-specific approach, each independent
closed triangular or quadratic loop (set of three or four treatments connected by direct
comparisons) in the network is evaluated for inconsistency and incorporated as separate
parameters (i.e. inconsistency factors) in the model.29-30
This analysis was conducted in
STATA 13®.30-32
When inconsistency was found, we qualitatively investigated trial
characteristics such as funding source to determine potential sources of inconsistency.
3.2.7 Measures of relative treatment effect
We examined mean differences in IOP (and 95% confidence intervals or credible
intervals) between drug pairs and drug class pairs. We combined both change from
baseline values with values at a time point. Due to randomization, it is reasonable to
assume that both specific metrics are estimating the same effect.33
We also determined
the probability of rank for each drug or class (i.e. the probability of a drug being the most
efficacious treatment, the second most, etc.). We examined the hierarchy of treatment
rankings by using the surface below the cumulative ranking curve (SUCRA).30,34
A
SUCRA value (or percentage) gives the probability that a treatment is among the best
treatments, with a value of 1 (or 100%) meaning that a treatment is certain to be the best
and 0 (or 0%) meaning that a treatment is certain to be the worst. Rankings based on
SUCRA values are considered to better take into account uncertainty in estimated
treatment effects than general ranking probabilities.30,34

10
3.3 Guideline and network meta-analysis comparison
We compared information extracted from each guideline group to the results of
the corresponding network meta-analysis to assess frequency of matching of
recommended drugs or drug classes and efficacy estimates in the guideline with the most
efficacious drug or drug class from the network meta-analysis (based on SUCRA values).
11
4 Results
4.1 Guideline identification and extraction
We identified 9 version of the AAO’s POAG PPP: 1989, 1990, 1992, 1996, 2000,
2003, 2005, 2006, and 2010.7,10-17
Based on recommendations and level of discussion of
POAG medical therapies, we grouped the guidelines together into 5 different sets: 1991-
1992, 1996, 2000-2003, 2005-2006, and 2010 (Table 1). Of these guideline sets, only
2010 made recommendations on first-line medical therapy. Based on a meta-analysis of
11 glaucoma trials, the 2010 guideline stated that “Prostaglandin analogs are the most
effective drugs at lowering IOP and can be considered as initial medical therapy.”
However, no other guideline set made any specific recommendations with regard to
which drug or class of drug is most efficacious; guideline statements have focused on
describing available options, therapies most often used as first-line treatment, or general
guidance for treatment. For example, the 2005-2006 guideline set stated that “In many
instances, topical medications constitute effective initial therapy" instead of making a
specific recommendation. Of the guideline sets, the 2005-2006 and 2010 sets reported
stopping points for literature searches. Therefore, the time points for network meta-
analysis were 1991, 1995, 2002, 2004, and 2009, with an additional one comprising all
collected data up to 2014.
4.2 Network meta-analysis
4.2.1 Search results and general study characteristics
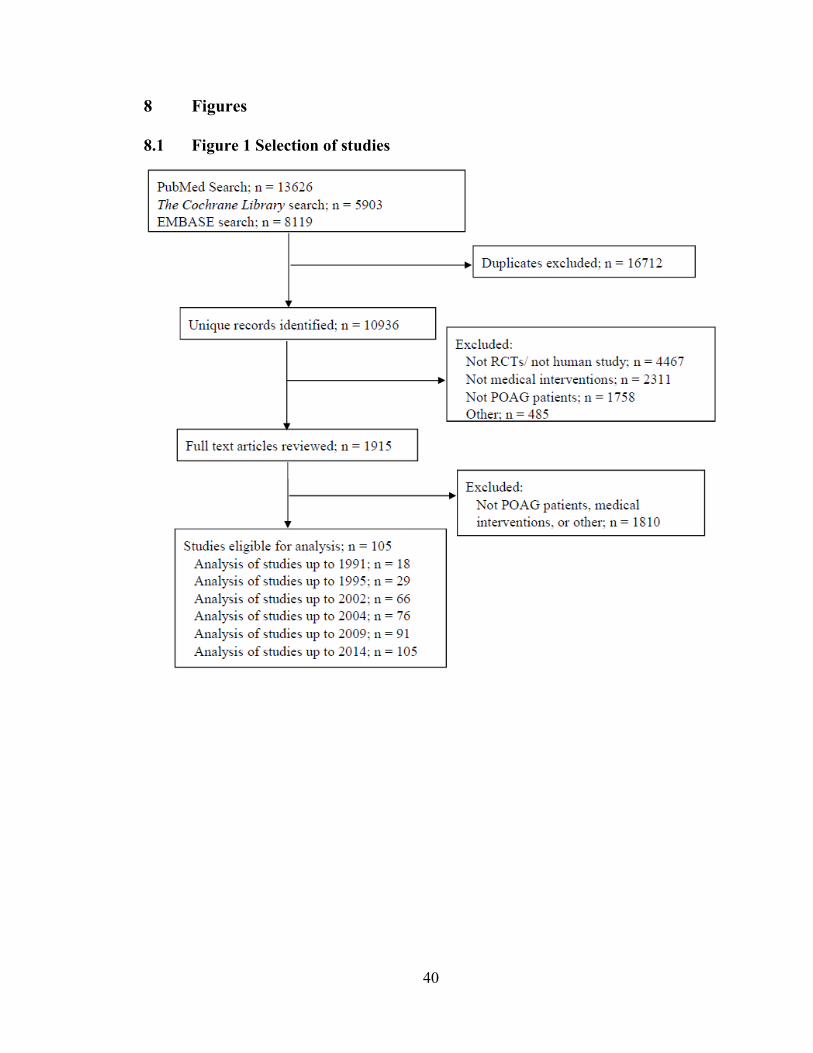
We identified 10,936 unique records from the search. For this analysis, a total of
105 RCTs from the published literature met our eligibility criteria (Figure 1; references
for these trials are available in Appendix II). The first trial was published in 1983 and the
latest trial in 2013. The network included 18 trials (1,161 participants) by 1991, 29 trials

12
(2,641 participants) by 1995, 66 trials (9,446 participants) by 2002, 76 trials (10,717
participants) by 2004, and 91 trials (13,870 participants) by 2009. As of 2014, there are a
total 16,898 participants in the network of 105 trials. Detailed characteristics of
individual trials are included in Appendix III.
The study characteristics described include all trials published by the network
meta-analysis time point. Sample size of studies appears to be smaller in earlier years
than later ones. In 1991, the median size of trials was 69 participants (interquartile range
(IQR): 28 to 85). This increased to 72 participants (IQR: 42 to 137) by 1995, and 95
participants (IQR: 45 to 177) by 2002. Afterwards, study sample size does not appear to
change substantially, with a median of 91 participants (IQR: 43 to 195) by 2004 and 90
participants (IQR: 47 to 213) by 2009. As of 2014, the median sample size of trials is 97
(IQR: 49 to 218). The smallest trial (17 participants) was published in 1985 and the
largest (976 participants) in 2005.
The proportion of trials reported to be multicenter also appears to be smaller in
earlier years: 39% of trials were reported to be multicenter in 1991, 55% in 1995, 70% in
2002, 64% in 2004, 61% in 2009, and 65% as of 2014. Reported regions of participant
recruitment (in 1991 and 2014 respectively) are North America (28% to 37%), Latin
America (0% to 3%), Europe (0% to 17%), Africa (0% to 1%), Asia (6% to 16%),
Oceania (0% to 2%) (trials could recruit participants from more than one region;
remaining trials did not report region).
The length of trials is generally longer for earlier studies. Median trial length was
6 months (IQR: 3 to 15) in 1991 and 6 months (IQR: 3 to 12) in 1995. For all network
meta-analysis time points after 1995, median length was 3 months (IQR: 3 to 12).

13
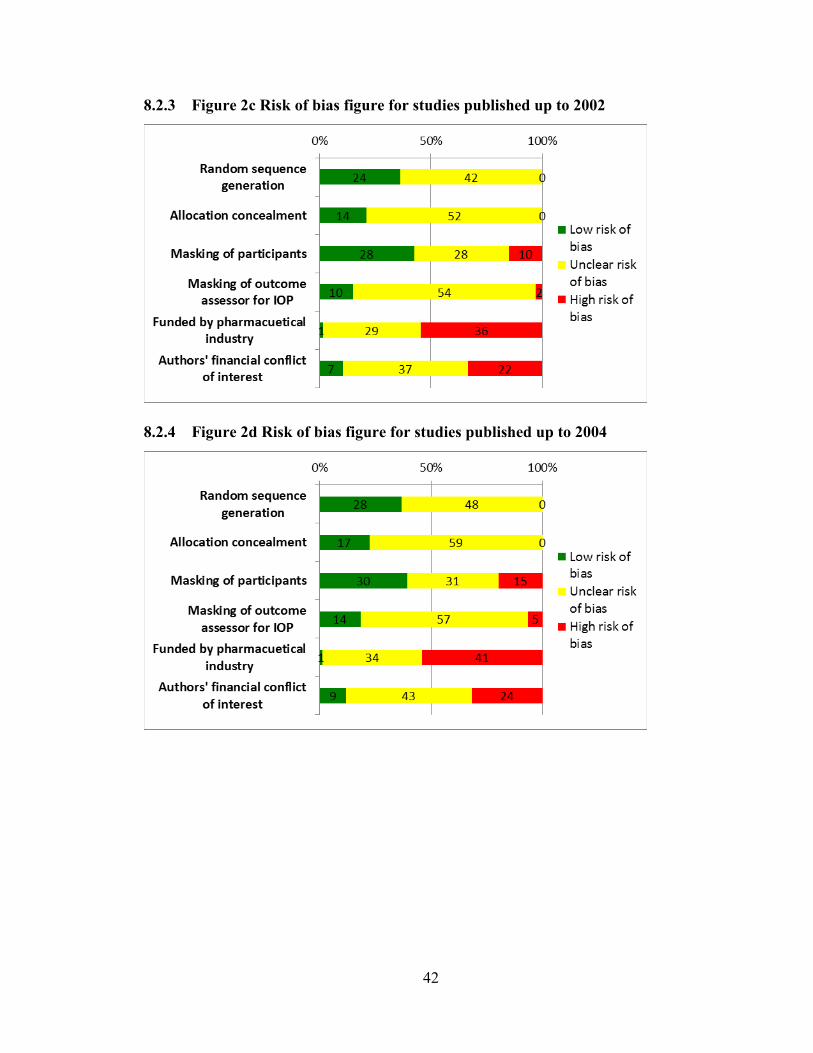
4.2.2 Risk of bias
At all network meta-analysis time points, the risk of bias of included studies was
generally unclear to high, although the proportion of trials with low risk of bias appears
to be higher at later time points (Figure 2a-f; Appendix IV). The proportion of studies
with low risk of bias from sequence generation ranges from 11% in 1991 (89% unclear)
to 43% in 2014 (57% unclear). 17% of studies published by 1991 were rated to have a
low risk of bias for allocation concealment (83% unclear) while 27% published by 2014
were (73% unclear). We rated the risk of bias from masking of participants to be low for
33% of studies up to 1991 (11 % high; 56% unclear) and 39% of studies up to 2014 (21%
high; 40% unclear). 17% of studies to 1991 (83% unclear) were rated to have a low risk
of bias due to masking of IOP assessor, and 22% of studies were rated low up to 2014
(10% high; 69% unclear). In trials published up to 1991, only 33% reported funding, of
which 100% had industry funding and 33% were funded by government (a trial could
report more than one funding source). By 2014, 59% reported funding, of which 92%
reported industry funding and 13% reported government funding. Of trials published by
1991, 33% reported on author financial conflicts of interest, of which 100% reported
conflicts of interest for at least one author. By 2014, 52% of trials reported on conflicts of
interests, of which 67% reported existing conflict of interest for least one author.
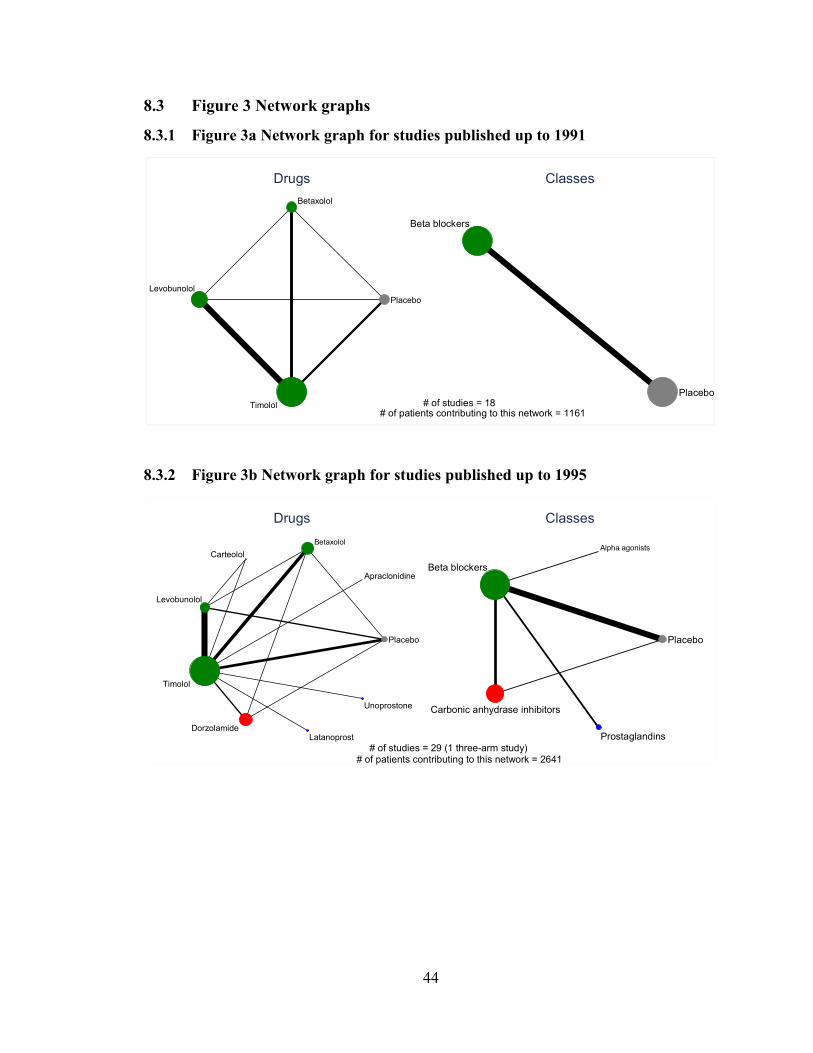
4.2.3 Interventions
Included trials studied 13 active interventions from 4 different classes, as well as
placebo/vehicle/no treatment (Figure 3a-f). The active interventions were apraclonidine
and brimonidine (alpha-2 adrenergic agonists); betaxolol, carteolol, levobunolol, and
timolol (beta blockers); brinzolamide and dorzolamide (carbonic anhydrase inhibitors);

14
and bimatoprost, latanoprost, travoprost, tafluprost, and unoprostone (prostaglandin
analogs). By 1991, three active drugs (betaxolol, levobunolol, and timolol) from one class
(beta blockers) and placebo were studied in RCTs. In 1995, the network of studies
included an additional five drugs (apraclonidine, carteolol, dorzolamide, latanoprost, and
unoprostone), and at least one drug from each class was included. The network expanded
to 11 active drugs in 2002 with brimonidine, brinzolamide, and travoprost. By 2004, 12
of the active drugs were in the network and no additional drugs were added in 2009. As
of 2014, one more drug, tafluprost, has been studied in the network.
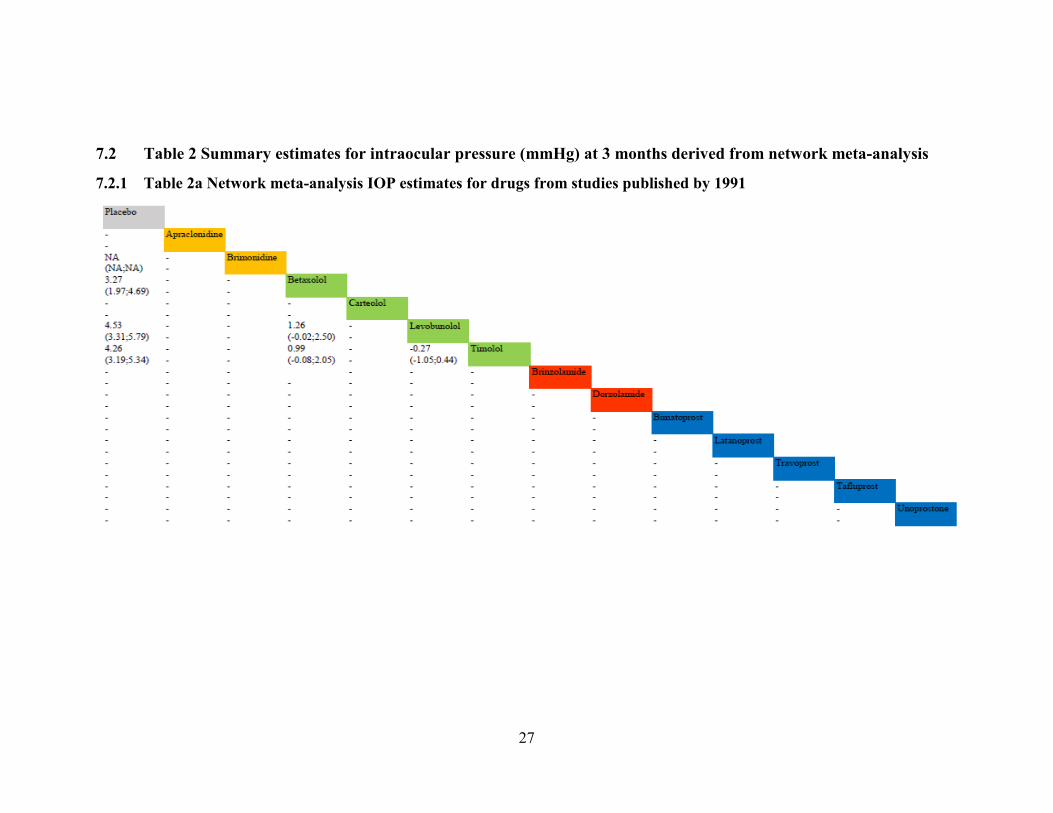
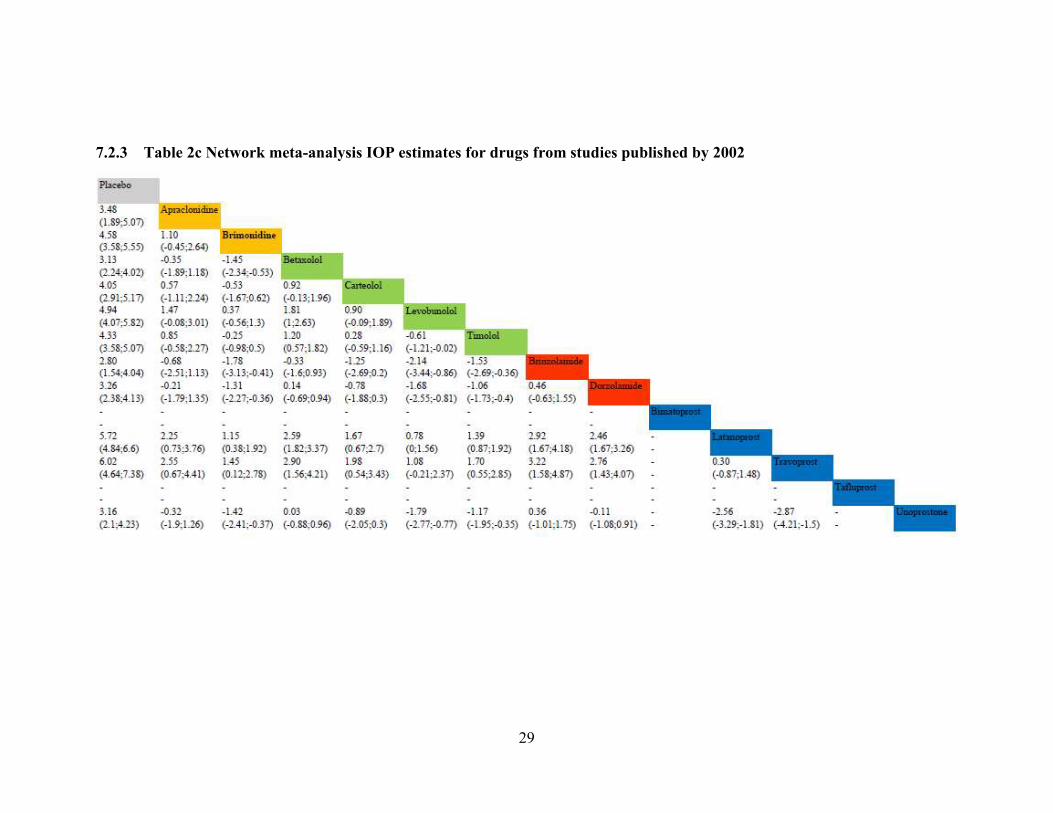
4.2.4 Network meta-analysis outcomes
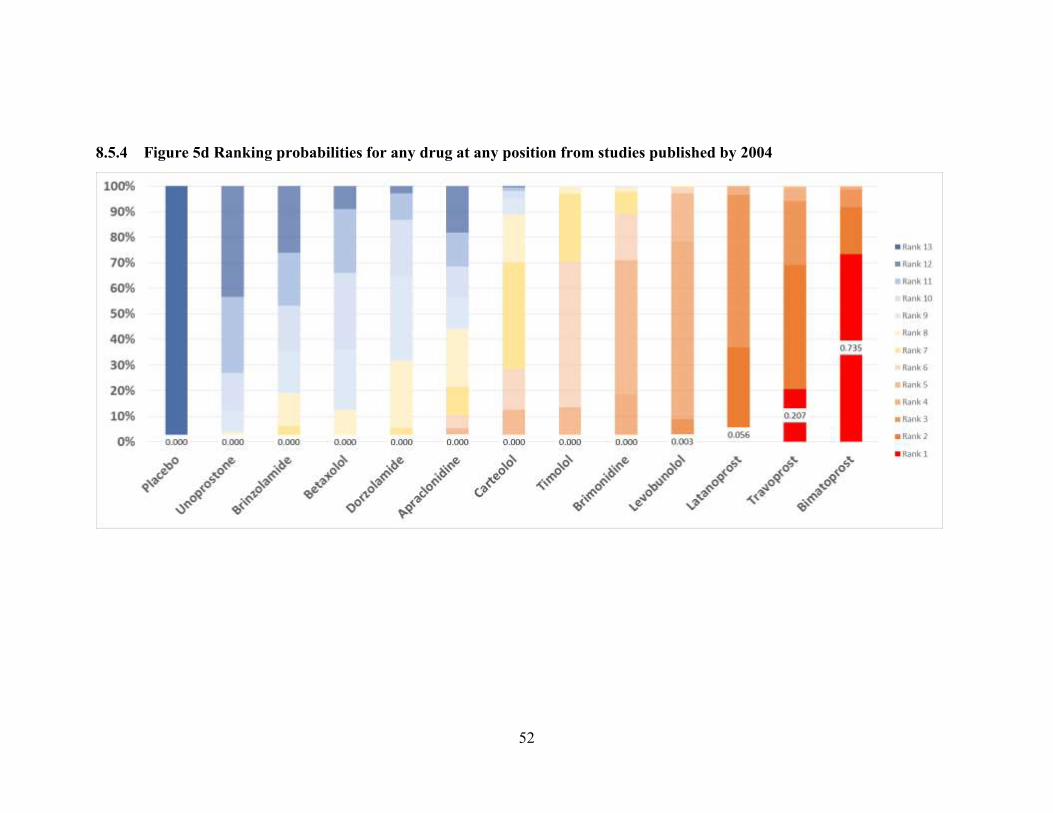
Network meta-analysis indicates that all drugs (and classes) are superior to
placebo in lowering 3-month IOP at all network meta-analysis time points (Table 2a-l;
Figure 4a-b). Results are reported in terms of mean IOP (in mmHg) and 95% credible
interval. The drugs and classes with the largest effect on IOP reduction compared with
placebo at each time point are: 1991: levobunolol 4.53 (3.31 to 5.79), beta blockers 4.01
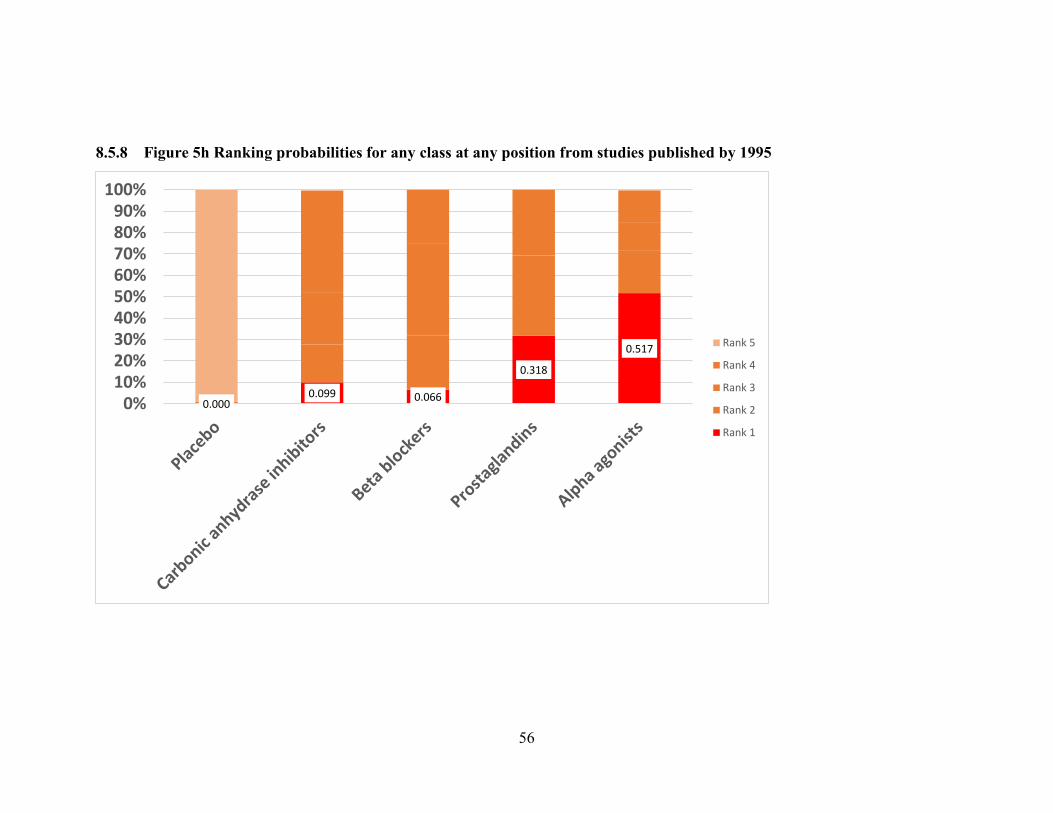
(0.48 to 7.43); 1995: apraclonidine 5.63 (2.56 to 8.64), alpha agonists 5.64 (1.73 to 9.50);
2002: travoprost 6.02 (4.64 to 7.38), prostaglandins 4.97 (3.29 to 6.65); 2004:
bimatoprost 5.87 (4.67 to 7.06), prostaglandins 4.75 (3.11 to 6.44); 2009 bimatoprost
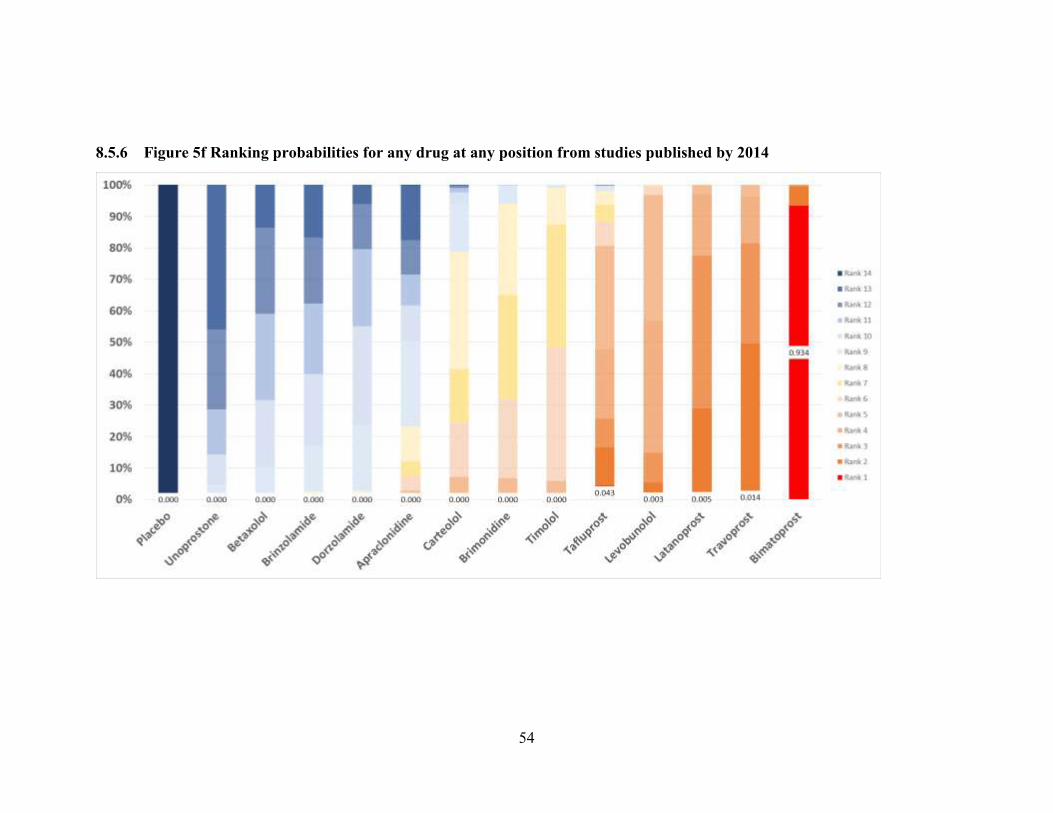
5.87 (4.96 to 6.77), prostaglandins 4.58 (2.94 to 6.24); 2014: bimatoprost 5.55 (4.80 to
6.31), prostaglandins 4.38 (3.03 to 5.75). Point estimates for drug and class effects appear
to diminish over time (Figure 4a-b).
Many direct comparisons between drugs, such as latanoprost vs placebo, are
missing even by 2014 and for the direct comparisons that exist, there are often only one
or two trials (Appendix V). The class effect estimates from direct comparison differ
greatly from those obtained from combining direct and indirect comparisons. For
15
example, by 2014 only two trials have directly compared prostaglandins with placebo and
the pooled estimate is not significantly superior to placebo.
Ranking probabilities are consistent with the network meta-analysis effect
estimates (Figure 5a-l). By 2014, for example, bimatoprost had a 93.4% chance of being
the most efficacious drug in terms of effect on 3-month IOP, 6.1% chance of being the
second best, and 0.5% chance of being the third best, while as a class, prostaglandins had
73.9% chance of being the best, 19.8% of being the second best, and 5.4% of being the
third best. Ranking based on cumulative ranking probabilities from SUCRA plots are also
generally consistent with effect estimates (Figure 6a-b). The only time at which the
highest cumulative rank did not match with treatment effect was in 1995, in which
apraclonidine was had the highest mean effect but levobunolol had the highest
cumulative ranking. By 2004, rankings generally stabilized for both drugs and classes.
Sometimes, when two drugs were included at the same time point, they crossed in
cumulative rank at subsequent points (Figure 6a-b). For example, from 2002 to 2009,
brimonidine was ranked higher than timolol, but by 2014, their positions switched.
4.2.5 Inconsistency
By 2014, the loop-specific approach to inconsistency indicated evidence of
inconsistency in 5 of 34 triangular loops (15%). We could not find any qualitative
reasons to explain inconsistency among studies included in the inconsistent loops.
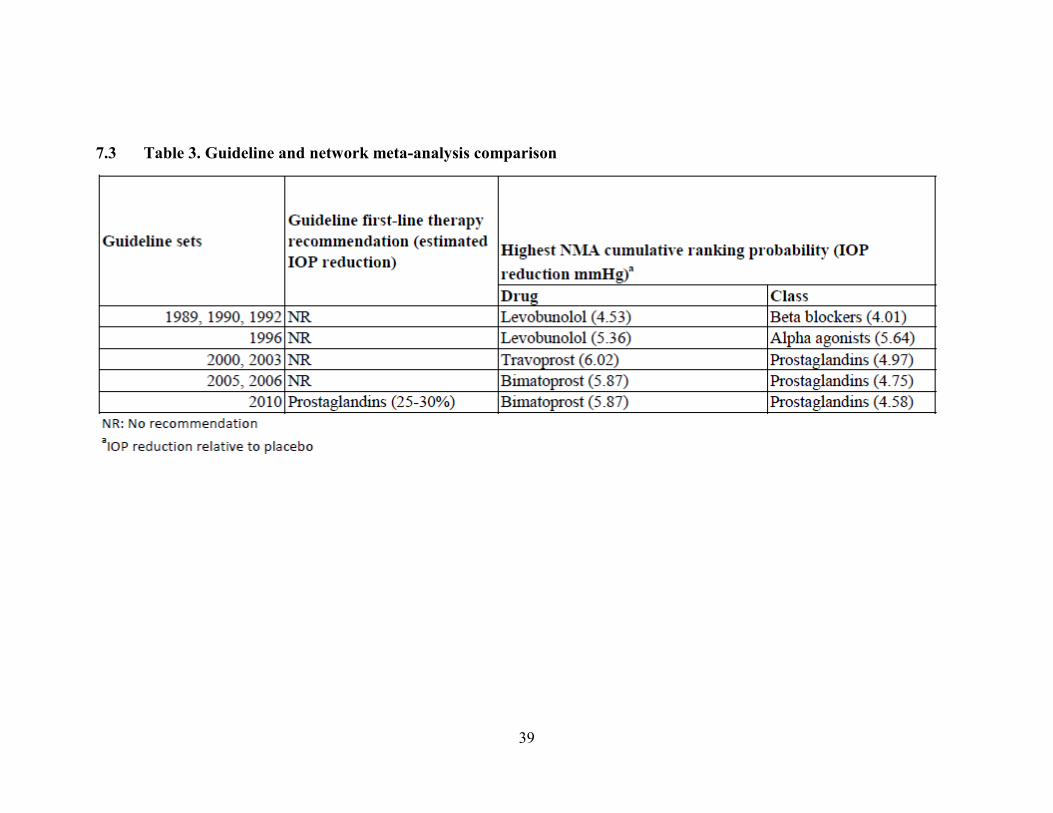
4.3 Guideline and network meta-analysis comparison
A summary of the comparison between guidelines recommendations and network
meta-analytic findings is given in Table 3. Based on network-meta-analysis, it would
have been possible to make treatment recommendations for all guideline sets, such as that
beta blockers were superior to placebo/no treatment based on RCT data available by

16
1991. The only time evidence from network meta-analysis with the guideline
recommendation is in 2010, as both indicate that the prostaglandin class should be
considered the first-line treatment in terms of efficacy.
17
5 Discussion
AAO’s POAG PPP did not make specific recommendations for first-line
treatment until 2010. However, based on network meta-analysis, there was sufficient
evidence to conclude that medical treatments superior to placebo existed by 1991. The
2010 recommendation is supported by the network meta-analysis results. The ranking of
classes based on the effect sizes given in the 2010 guidelines are also consistent with our
findings. Prostaglandins have the largest effect, beta blockers and alpha agonists are next
and are very close in effect, and carbonic anhydrase inhibitors are the least effective. In
both the 2010 guideline and the corresponding network meta-analaysis, even though
prostaglandins are considered the most efficacious class, the magnitude of IOP reduction
does not really appear to differ substantially between classes.
The AAO’s POAG PPPs do not give recommendations at the drug level. This
may be because the guideline producers did not want to appear to favor a particular drug
manufacturer, since some glaucoma drugs, such as bimatoprost, are still under patent.
Our results indicate that drugs within a class generally have similar effects on IOP. The
most notable exception is unoprostone, which was the least effective drug at all time
points since 2004 despite the high ranking of all other prostaglandins. With unoprostone,
there is uncertainty whether it should be classified as a prostaglandin analogue or not.35-36
Despite being derived from prostaglandin F(2α) like the other prostaglandin drugs,
pharmacological studies have suggested that unoprostone has a distinct mechanism of
action compared to the other prostaglandins, and therefore it may not be appropriate to
group it with these other drugs.35-36
If unoprostone is really part of a separate drug class,
it would explain the great disparity in IOP effect, as well as indicate that our findings for
18
prostaglandin effect may underestimate the true class effect. Other exceptions are
betaxolol, which has a lower effect than the other beta blockers, and the two alpha
agonists, apraclonidine and brimonidine, which start off with different effectiveness
profiles but appear to get closer in effect size and ranking over time. Since within-class
treatments are generally similar, it is appropriate for guidelines to make recommendations
at the class level for POAG treatments.
One interesting finding from the cumulative network meta-analysis is that, as can
be seen in Figure 4, there appears to be a consistent pattern that the effect size for all
glaucoma treatments diminishes over time. Despite this, all treatments are superior to
placebo at all network meta-analysis time points. This result is consistent with findings
by Gehr et al., who, in a meta-regression, determined that the effect size for both timolol
and latanoprost decreased over time.37
One potential explanation for this finding is due
to small-study effects; the tendency for smaller studies to produce larger treatment effects
than larger studies due to factors like publication bias or poorer methodological quality of
smaller studies.38
Earlier studies in the network were smaller, but even when median
study size stops increasing in 2002, treatment effect size still diminishes. Another
possibility is that in earlier studies, participants had less severe disease or more easily
controlled IOP. After drugs became established in RCTs, people entering trials may be
those with more severe disease or whose IOP was not controlled on initial therapy. In
Gehr et al.’s study, it was found that a significant relationship existed between baseline
IOP values and treatment effect over time in the case of timolol.37
We will further explore
the data to try and determine the decrease in effect size over time.
19
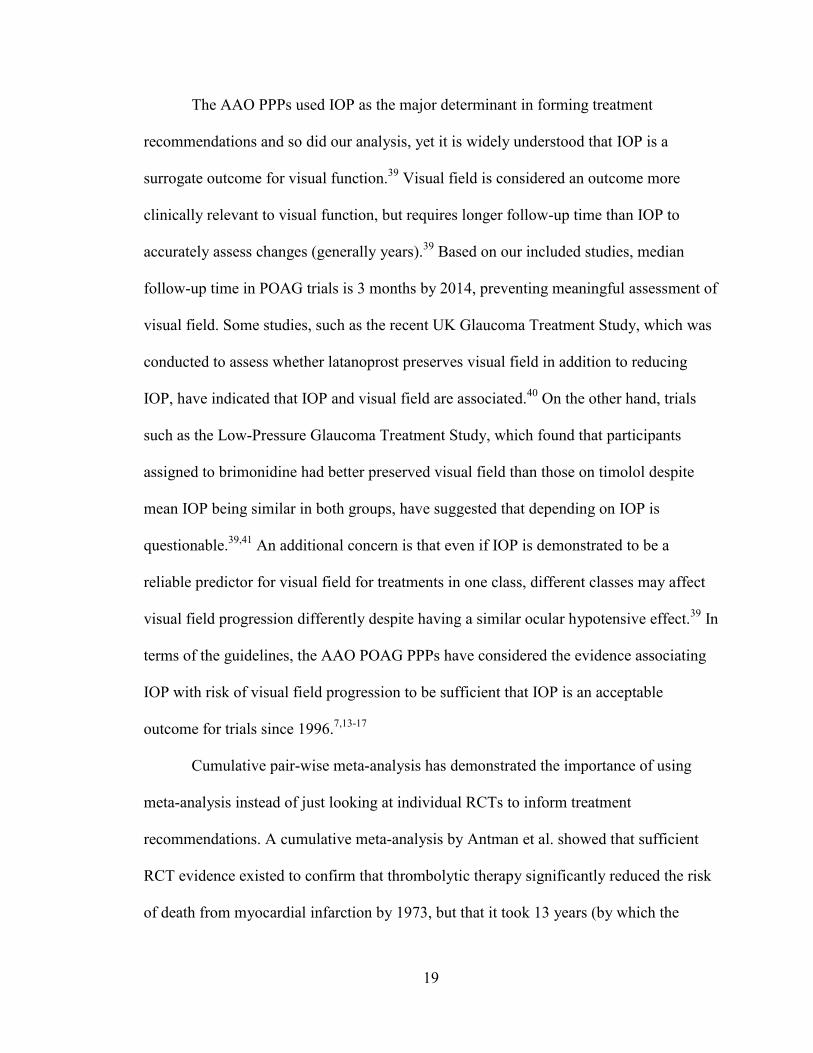
The AAO PPPs used IOP as the major determinant in forming treatment
recommendations and so did our analysis, yet it is widely understood that IOP is a
surrogate outcome for visual function.39
Visual field is considered an outcome more
clinically relevant to visual function, but requires longer follow-up time than IOP to
accurately assess changes (generally years).39
Based on our included studies, median
follow-up time in POAG trials is 3 months by 2014, preventing meaningful assessment of
visual field. Some studies, such as the recent UK Glaucoma Treatment Study, which was
conducted to assess whether latanoprost preserves visual field in addition to reducing
IOP, have indicated that IOP and visual field are associated.40
On the other hand, trials
such as the Low-Pressure Glaucoma Treatment Study, which found that participants
assigned to brimonidine had better preserved visual field than those on timolol despite
mean IOP being similar in both groups, have suggested that depending on IOP is
questionable.39,41
An additional concern is that even if IOP is demonstrated to be a
reliable predictor for visual field for treatments in one class, different classes may affect
visual field progression differently despite having a similar ocular hypotensive effect.39
In
terms of the guidelines, the AAO POAG PPPs have considered the evidence associating
IOP with risk of visual field progression to be sufficient that IOP is an acceptable
outcome for trials since 1996.7,13-17
Cumulative pair-wise meta-analysis has demonstrated the importance of using
meta-analysis instead of just looking at individual RCTs to inform treatment
recommendations. A cumulative meta-analysis by Antman et al. showed that sufficient
RCT evidence existed to confirm that thrombolytic therapy significantly reduced the risk
of death from myocardial infarction by 1973, but that it took 13 years (by which the

20
number of RCTs had increased from 10 to 43) for the therapy to be recommended for
routine practice by expert reviewers.42
Network meta-analysis has begun to be recognized as a useful tool for guideline
developers. The Endocrine Society commissioned a network meta-analysis to be
conducted to inform recommendations for its 2012 clinical practice guideline for
osteoporosis in men.43-44
The National Institute for Health and Clinical Excellence
(NICE) in Europe also conducted its own network meta-analysis for making
recommendations on neuropathic pain treatments.45
By extending the principles of cumulative meta-analysis to network meta-
analysis, we have provided evidence that network meta-analysis can benefit clinical
guideline developers. If network meta-analysis results had been available to developers,
the POAG PPP could have made recommendations for initial medical treatment at each
major update. Furthermore, the current first-line treatment, prostaglandins, could have
been recommended as early as the 2003 update, seven years earlier than when
prostaglandins were recommended. Another strength of our analysis is that we were able
to estimate class effect without discarding trials comparing drugs from the same class.
Our findings regarding network meta-analysis and guideline comparisons may not
be applicable to other clinical fields or even other glaucoma guidelines such as those
developed by the National Institute for Health and Clinical Excellence,9 since we only
examined a single set of guidelines. The cultures of other clinical fields or different
glaucoma guideline groups may lead them to have different approaches to making
treatment recommendations (e.g. drug level instead of class level) or in their use of
evidence as the basis for recommendations.

21
Conclusion
We identified 5 sets of guidelines from AAO’s POAG PPPs with major revisions
in terms of medical treatment recommendations or discussions of therapies. Treatment
recommendations were only made in the final set. Using cumulative network meta-
analysis, we were able to determine the best drug and class at the time of each major
revision based on RCT evidence available at the time. Both the final guideline and the
corresponding network meta-analysis indicate that prostaglandins should be considered
first-line treatment in terms of IOP reduction. Other findings from the network meta-
analysis are that the effect size for all drugs and classes appears to decrease over time, but
all were significantly better than placebo at all time points. Network meta-analysis results
have the potential to help clinical guideline developers make evidence-based
recommendations.
22
6 References
1. Institute of Medicine. Clinical Practice Guidelines We Can Trust. 2011
2. Institute of Medicine. Knowing What Works in Healthcare: Roadmap for the
Nation. 2008
3. Eddy DM. Evidence-based medicine: a unified approach. Health Aff
(Millwood). 2005;24(1):9–17.
4. Tricoci P, Allen JM, Kramer JM, Califf RM, Smith SC. Scientific evidence
underlying the ACC/AHA clinical practice guidelines. JAMA. 2009;301(8):831–
41.
5. Salanti G. Indirect and mixed-treatment comparison, network, or multiple-
treatments meta-analysis: many names, many benefits, many concerns for the
next generation evidence synthesis tool. Res Synth Methods. 2012;3(2):80–97.
6. Cipriani. 2013. Conceptual and technical challenges in network meta-analysis.
7. American Academy of Ophthalmology. Primary Open-Angle Glaucoma
Preferred Practice Patterns. San Francisco: American Academy of
Ophthalmology; 2010
8. Quigley HA, Broman AT. The number of people with glaucoma worldwide in
2010 and 2020. Br J Ophthalmol. 2006;90:262-7.
9. National Institute for Health and Care Excellence. NICE guidelines. Glaucoma:
diagnosis and management of chronic open angle glaucoma and ocular
hypertension. 2009.
10. American Academy of Ophthalmology. Primary Open-Angle Glaucoma
Preferred Practice Patterns. San Francisco: American Academy of
Ophthalmology; 1989
11. American Academy of Ophthalmology. Primary Open-Angle Glaucoma
Preferred Practice Patterns. San Francisco: American Academy of
Ophthalmology; 1990
12. American Academy of Ophthalmology. Primary Open-Angle Glaucoma
Preferred Practice Patterns. San Francisco: American Academy of
Ophthalmology; 1992
13. American Academy of Ophthalmology. Primary Open-Angle Glaucoma
Preferred Practice Patterns. San Francisco: American Academy of
Ophthalmology; 1996

23
14. American Academy of Ophthalmology. Primary Open-Angle Glaucoma
Preferred Practice Patterns. San Francisco: American Academy of
Ophthalmology; 2000
15. American Academy of Ophthalmology. Primary Open-Angle Glaucoma
Preferred Practice Patterns. San Francisco: American Academy of
Ophthalmology; 2003
16. American Academy of Ophthalmology. Primary Open-Angle Glaucoma
Preferred Practice Patterns. San Francisco: American Academy of
Ophthalmology; 2005
17. American Academy of Ophthalmology. Primary Open-Angle Glaucoma
Preferred Practice Patterns. San Francisco: American Academy of
Ophthalmology; 2006
18. Sommer A, Weiner JP, Gamble L. Developing specialty-wide standards of
practice: the experience of ophthalmology. QRB Qual Rev Bull. 1990;16(2):65–
70.
19. "The American Academy of Ophthalmology." American Academy of
Ophthalmology. Accessed 21 Aug. 2014. http://www.aao.org/
20. Li T, Lindsey K, Rouse B, et al. Comparative Effectiveness of First-line
Medications for Patients with Primary Open Angle Glaucoma or Ocular
Hypertension – A Systematic Review and Network Meta-analysis (in process)
21. Ip S, Hadar N, Keefe S, Parkin C, Iovin R, Balk EM, Lau J. A Web-based
archive of systematic review data. Syst Rev. 2012;1(1):15.
22. Li T, Vedula SS, Hadar N, Parkin C, Lau J, Dickersin K. Innovations in data
collection, management, and archiving for systematic reviews. Ann Intern Med.
2015;162(4):287-94.
23. Higgins JPT, Altman DG, Sterne JAC (editors). Chapter 8: Assessing risk of
bias in included studies. In: Higgins JPT, Green S (editors). Cochrane
Handbook for Systematic Reviews of Interventions Version 5.1.0 (updated
March 2011). The Cochrane Collaboration, 2011. Available from
www.cochrane-handbook.org
24. StataCorp. 2013. Stata Statistical Software: Release 13. College Station, TX:
StataCorp LP.
25. Lu G, Ades AE. Combination of direct and indirect evidence in mixed treatment
comparisons. Stat Med. 2004;23(20):3105-3124.
26. Lu G, Ades a. E. Assessing Evidence Inconsistency in Mixed Treatment
Comparisons. J Am Stat Assoc. 2006;101(474):447–459.

24
27. Lunn DJ, Thomas A, Best N, Spiegelhalter D. WinBUGS— a Bayesian
modelling framework: concepts, structure, and extensibility. Stat Comput. 2000;
10: 325–37.
28. Mayo-Wilson E, Dias S, Mavranezouli I, et al. Psychological and
pharmacological interventions for social anxiety disorder in adults: a systematic
review and network meta-analysis. The Lancet Psychiatry. 2014;1(5):368–376.
29. Dias S, Welton NJ, Sutton AJ, Caldwell DM, Lu G, Ades AE. Evidence
synthesis for decision making 4: inconsistency in networks of evidence based on
randomized controlled trials. Med Decis Making. 2013;33(5):641-656.
30. Chaimani A, Higgins JPT, Mavridis D, Spyridonos P, Salanti G. Graphical tools
for network meta-analysis in STATA. PLoS One. 2013;8(10):e76654.
31. White IR. Multivariate random-effects meta-regression : Updates to mvmeta.
Stata J. 2011;11(2):255-270.
32. White IR, Barrett JK, Jackson D, Higgins JPT. Consistency and inconsistency in
network meta-analysis: model estimation using multivariate meta-regression.
Res Synth Methods. 2012;3(2):111–125.
33. Deeks JJ, Higgins JPT, and Altman DG on behalf of the Cochrane Statistical
Methods Group. Chapter 9.4.5.2 Meta-analysis of change scores. In: Higgins
JPT, Green S (editors). Cochrane Handbook for Systematic Reviews of
Interventions Version 5.1.0 (updated March 2011). The Cochrane
Collaboration, 2011. Available from www.cochrane-handbook.org; accessed on
April 29, 2015
34. Salanti G, Ades AE, Ioannidis JP. Graphical methods and numerical summaries
for presenting results from multiple-treatment meta-analysis: an overview and
tutorial. J Clin Epidemiol. 2011;64(2):163–71.
35. Harms N V, Toris CB. Current status of unoprostone for the management of
glaucoma and the future of its use in the treatment of retinal disease. Expert
Opin Pharmacother. 2013;14(1):105-113.
36. Fung DS, T WJ. An evidence-based review of unoprostone for glaucoma : place
in therapy. Clin Ophthalmol. 2014;8:543-554.
37. Gehr BT, Weiss C, Porzsolt F. The fading of reported effectiveness. A meta-
analysis of randomised controlled trials. BMC Med Res Methodol. 2006;6:25.
38. Sterne J AC, Gavaghan D, Egger M. Publication and related bias in meta-
analysis: Power of statistical tests and prevalence in the literature. J Clin
Epidemiol. 2000;53(11):1119-1129.

25
39. Medeiros FA. Biomarkers and surrogate endpoints in glaucoma clinical trials.
Br J Ophthalmol. 2014:1–5.
40. Garway-Heath DF, Crabb DP, Bunce C, et al. Latanoprost for open-angle
glaucoma (UKGTS): a randomised, multicentre, placebo-controlled trial.
Lancet. 2014:1295-1304.
41. Krupin T, Liebmann JM, Greenfield DS, Ritch R, Gardiner S. A randomized
trial of brimonidine versus timolol in preserving visual function: Results from
the low-pressure glaucoma treatment study. Am J Ophthalmol.
2011;151(4):671-681.
42. Antman EM, Lau J, Kupelnick B, Mosteller F, Chalmers TC. A comparison of
results of meta-analyses of randomized control trials and recommendations of
clinical experts. Treatments for myocardial infarction. JAMA. 1992;268(2):240-
248
43. Watts NB, Adler R a, Bilezikian JP, et al. Osteoporosis in men: an Endocrine
Society clinical practice guideline. J Clin Endocrinol Metab. 2012;97(6):1802-
1822.
44. Murad MH, Drake MT, Mullan RJ, et al. Clinical review. Comparative
effectiveness of drug treatments to prevent fragility fractures: a systematic
review and network meta-analysis. J Clin Endocrinol Metab. 2012;97(6):1871-
1880.
45. National Institute for Health and Care Excellence. NICE guidelines.
Neuropathic pain – pharmacological management: The pharmacological
management of neuropathic pain in adults in non-specialist settings. 2013.

26
7 Tables
7.1 Table 1 Recommendations from AAO POAG PPPs
27
7.2 Table 2 Summary estimates for intraocular pressure (mmHg) at 3 months derived from network meta-analysis
7.2.1 Table 2a Network meta-analysis IOP estimates for drugs from studies published by 1991

28
7.2.2 Table 2b Network meta-analysis IOP estimates for drugs from studies published by 1995
29
7.2.3 Table 2c Network meta-analysis IOP estimates for drugs from studies published by 2002

30
7.2.4 Table 2d Network meta-analysis IOP estimates for drugs from studies published by 2004
31
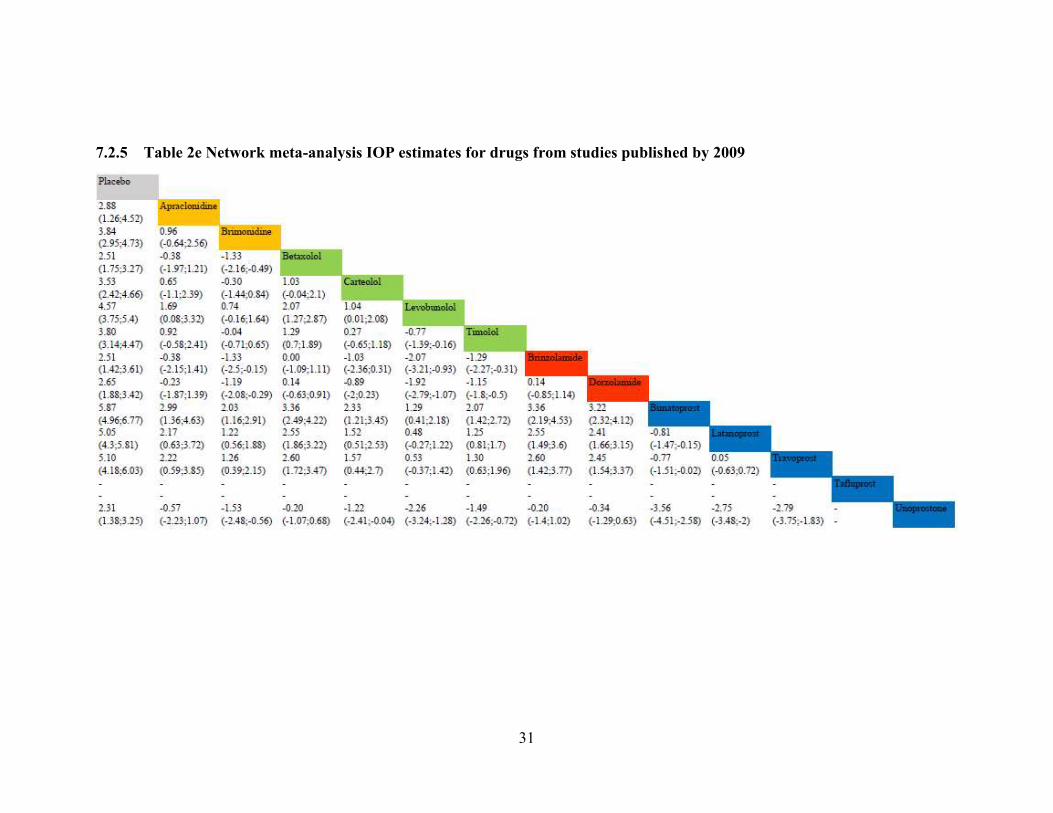
7.2.5 Table 2e Network meta-analysis IOP estimates for drugs from studies published by 2009
32
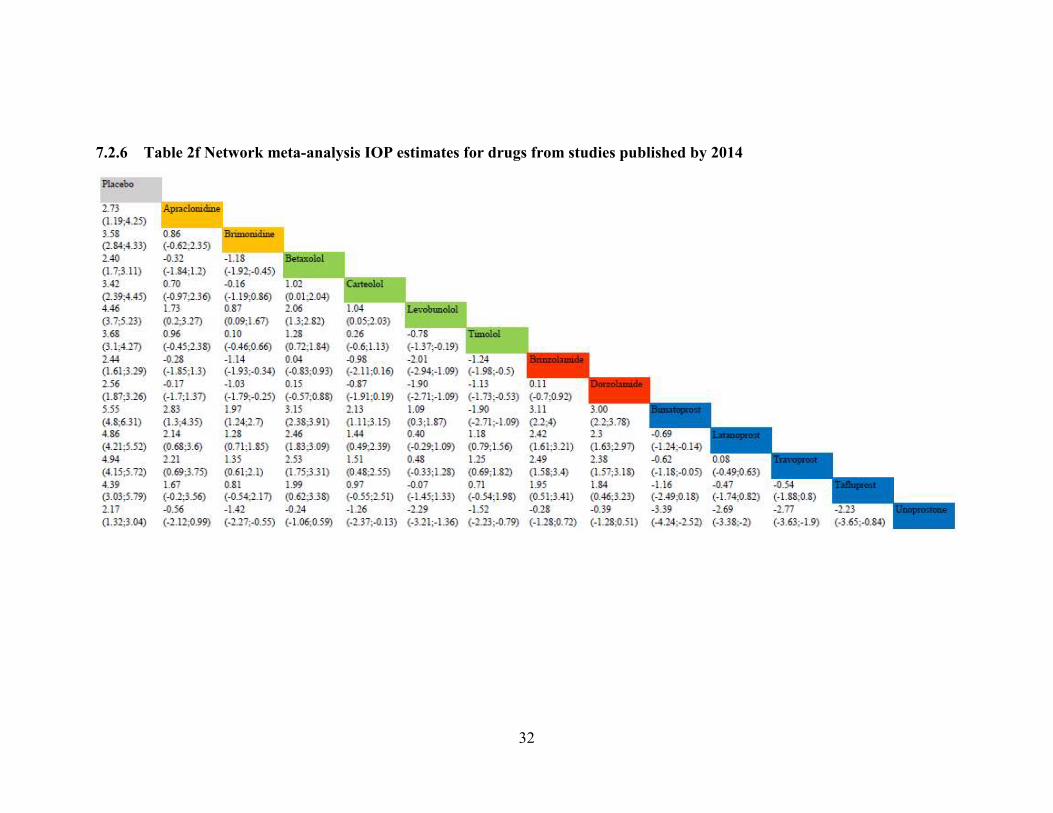
7.2.6 Table 2f Network meta-analysis IOP estimates for drugs from studies published by 2014
33
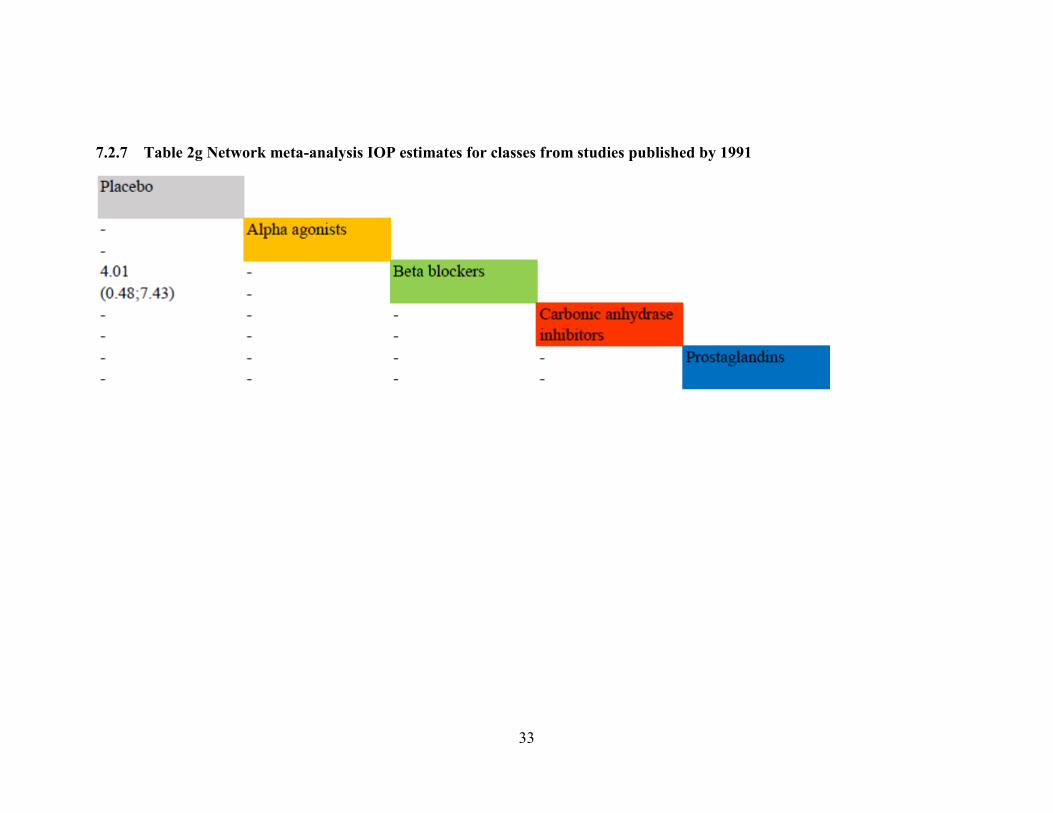
7.2.7 Table 2g Network meta-analysis IOP estimates for classes from studies published by 1991

34
7.2.8 Table 2h Network meta-analysis IOP estimates for classes from studies published by 1995

35
7.2.9 Table 2i Network meta-analysis IOP estimates for classes from studies published by 2002

36
7.2.10 Table 2j Network meta-analysis IOP estimates for classes from studies published by 2004

37
7.2.11 Table 2k Network meta-analysis IOP estimates for classes from studies published by 2009
38
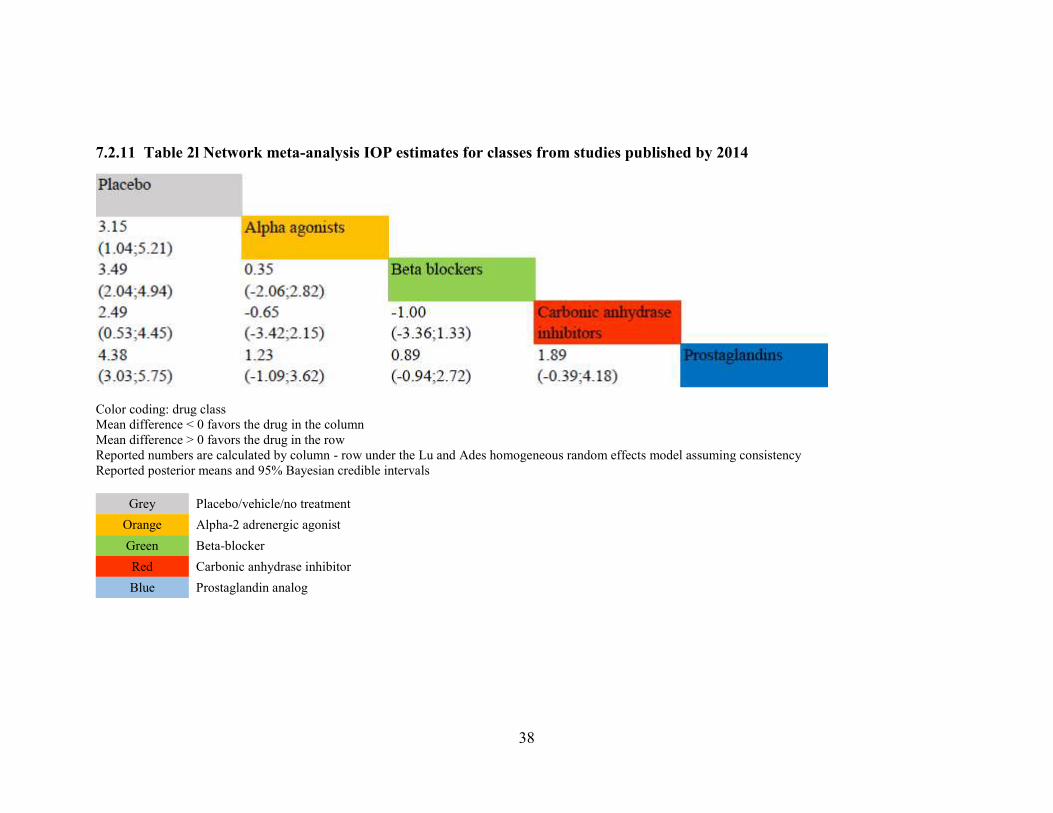
7.2.11 Table 2l Network meta-analysis IOP estimates for classes from studies published by 2014
Color coding: drug class
Mean difference < 0 favors the drug in the column
Mean difference > 0 favors the drug in the row
Reported numbers are calculated by column - row under the Lu and Ades homogeneous random effects model assuming consistency
Reported posterior means and 95% Bayesian credible intervals
Grey Placebo/vehicle/no treatment
Orange Alpha-2 adrenergic agonist
Green Beta-blocker
Red Carbonic anhydrase inhibitor
Blue Prostaglandin analog
39
7.3 Table 3. Guideline and network meta-analysis comparison
40
8 Figures
8.1 Figure 1 Selection of studies

41
8.2 Figure 2 Risk of bias figure
8.2.1 Figure 2a Risk of bias figure for studies published up to 1991
8.2.2 Figure 2b Risk of bias figure for studies published up to 1995
42
8.2.3 Figure 2c Risk of bias figure for studies published up to 2002
8.2.4 Figure 2d Risk of bias figure for studies published up to 2004

43
8.2.5 Figure 2e Risk of bias figure for studies published up to 2009
8.2.6 Figure 2f Risk of bias figure for studies published up to 2014
44
8.3 Figure 3 Network graphs
8.3.1 Figure 3a Network graph for studies published up to 1991
8.3.2 Figure 3b Network graph for studies published up to 1995
Placebo
Betaxolol
Levobunolol
Timolol
Drugs
# of studies = 18# of patients contributing to this network = 1161
Placebo
Beta blockers
Classes
Placebo
Apraclonidine
Betaxolol
Carteolol
Levobunolol
Timolol
DorzolamideLatanoprost
Unoprostone
# of studies = 29 (1 three-arm study)# of patients contributing to this network = 2641
Drugs
Placebo
Alpha agonists
Beta blockers
Carbonic anhydrase inhibitors
Prostaglandins
Classes

45
8.3.3 Figure 3c Network graph for studies published up to 2002
8.3.4 Figure 3d Network graph for studies published up to 2004
Placebo
Apraclonidine
Brimonidine
Betaxolol
Carteolol
Levobunolol
Timolol
Brinzolamide
Dorzolamide
Latanoprost
Travoprost
Unoprostone
# of studies = 66 (5 three-arm studies)
# of patients contributing to this network = 9446
Drugs
Placebo
Alpha agonists
Beta blockers
Carbonic anhydrase inhibitors
Prostaglandins
Classes
Placebo
Apraclonidine
Brimonidine
BetaxololCarteolol
Levobunolol
Timolol
Brinzolamide
Dorzolamide
Bimatoprost
Latanoprost
Travoprost
Unoprostone
# of studies = 76 (7 three-arm studies)
# of patients contributing to this network = 10717
Drugs
Placebo
Alpha agonists
Beta blockers
Carbonic anhydrase inhibitors
Prostaglandins
Classes

46
8.3.5 Figure 3e Network graph for studies published up to 2009
8.3.6 Figure 3f Network graph for studies published up to 2014
Each node represents one drug. The drugs are color-coded by class. The size of the node is proportional to
the number of participants randomized to that drug.
The edges represent direct comparisons (i.e. when there is a line connecting two drugs, the two drugs have
been compared directly to each other in a trial). The width of the edge is proportional to the number of
trials.
Grey Placebo/vehicle/no treatment
Orange Alpha-2 adrenergic agonist
Green Beta-blocker
Red Carbonic anhydrase inhibitor
Blue Prostaglandin analog
Placebo
Apraclonidine
Brimonidine
BetaxololCarteolol
Levobunolol
Timolol
Brinzolamide
Dorzolamide
Bimatoprost
Latanoprost
Travoprost
Unoprostone
# of studies = 91 (11 three-arm studies)# of patients contributing to this network = 13870
Drugs
Placebo
Alpha agonists
Beta blockers
Carbonic anhydrase inhibitors
Prostaglandins
Classes
Placebo
Apraclonidine
Brimonidine
BetaxololCarteolol
Levobunolol
Timolol
Brinzolamide
Dorzolamide
Bimatoprost
Latanoprost Travoprost
Tafluprost
Unoprostone
# of studies = 105 (12 three-arm studies)
# of patients contributing to this network = 19562
Drugs
Placebo
Alpha agonists
Beta blockers
Carbonic anhydrase inhibitors
Prostaglandins
Classes

47
8.4 Figure 4 Funnel plots of treatment effect relative to placebo at each
network meta-analysis time point
8.4.1 Figure 4a Funnel plot for drug effect relative to placebo

48
8.4.2 Figure 4b Funnel plot for class effect relative to placebo
Since glaucoma drugs are expected to lower IOP values, more negative IOP values indicate greater effect.

49
8.5 Figure 5 Ranking probabilities for any treatment at any position
8.5.1 Figure 5a Ranking probabilities for any drug at any position from studies published by 1991

50
8.5.2 Figure 5b Ranking probabilities for any drug at any position from studies published by 1995

51
8.5.3 Figure 5c Ranking probabilities for any drug at any position from studies published by 2002
52
8.5.4 Figure 5d Ranking probabilities for any drug at any position from studies published by 2004

53
8.5.5 Figure 5e Ranking probabilities for any drug at any position from studies published by 2009
54
8.5.6 Figure 5f Ranking probabilities for any drug at any position from studies published by 2014

55
8.5.7 Figure 5g Ranking probabilities for any class at any position from studies published by 1991
0.018
0.982
0%
20%
40%
60%
80%
100%
Rank 2
Rank 1
56
8.5.8 Figure 5h Ranking probabilities for any class at any position from studies published by 1995
0.000 0.099 0.066
0.318
0.517
0%10%20%30%40%50%60%70%80%90%100%
Rank 5
Rank 4
Rank 3
Rank 2
Rank 1

57
8.5.9 Figure 5i Ranking probabilities for any class at any position from studies published by 2002
0.000 0.027
0.170 0.124
0.680
0%
10%
20%
30%
40%
50%
60%
70%
80%
90%
100%
Rank 5
Rank 4
Rank 3
Rank 2
Rank 1

58
8.5.10 Figure 5j Ranking probabilities for any class at any position from studies published by 2004
0.000 0.043 0.144 0.105
0.708
0%10%20%30%40%50%60%70%80%90%100%
Rank 5
Rank 4
Rank 3
Rank 2
Rank 1

59
8.5.11 Figure 5k Ranking probabilities for any class at any position from studies published by 2009

60
8.5.12 Figure 5l Ranking probabilities for any class at any position from studies published by 2014
Warmer colors indicate better ranks
0.000
0.111 0.119
0.739
0%
10%
20%
30%
40%
50%
60%
70%
80%
90%
100%
Rank 5
Rank 4
Rank 3
Rank 2
Rank 1

61
8.6 Figure 6 Cumulative ranking of treatments at each network meta-
analysis time point
8.6.1 Figure 6a Cumulative ranking of drugs at each network meta-analysis
time point
8.6.2 Figure 6b Cumulative ranking of class at each network meta-analysis
time point
SUCRA percentage is the probability a treatment has of being among the best treatments (e.g.
100% if certainly the best, 0% if certainly the worst)

62
Appendix I. Search Strategy
Cochrane Library
#1 MeSH descriptor: [Glaucoma, Open-Angle] explode all trees
#2 MeSH descriptor: [Ocular Hypertension] explode all trees
#3 (open near/2 angle near/2 glaucoma*)
#4 (POAG or OHT)
#5 (((increas* or elevat* or high*) near/3 (ocular or intra-ocular)) and
pressure)
#6 {or #1-#5}
#7 MeSH descriptor: [Adrenergic beta-Antagonists] explode all trees
#8 MeSH descriptor: [Timolol] explode all trees
#9 Timolol*
#10 MeSH descriptor: [Metipranolol] explode all trees
#11 Metipranolol*
#12 MeSH descriptor: [Carteolol] explode all trees
#13 Carteolol*
#14 MeSH descriptor: [Levobunolol] explode all trees
#15 Levobunolol*
#16 MeSH descriptor: [Betaxolol] explode all trees
#17 Betaxolol*
#18 MeSH descriptor: [Carbonic Anhydrase Inhibitors] explode all trees
#19 (Carbonic near/2 Anhydrase near/2 Inhibitor*)
#20 MeSH descriptor: [Acetazolamide] explode all trees
#21 Acetazolam*
#22 Brinzolamide*
#23 Dorzolamide*
#24 MeSH descriptor: [Prostaglandins, Synthetic] explode all trees
#25 latanoprost*
#26 travoprost*
#27 bimatoprost*
#28 unoprostone*
#29 tafluprost*
#30 MeSH descriptor: [Antihypertensive Agents] explode all trees
#31 MeSH descriptor: [Pilocarpine] explode all trees
#32 Pilocarpin*
#33 MeSH descriptor: [Epinephrine] explode all trees
#34 epinephrine*
#35 dipivefrin*
#36 MeSH descriptor: [Adrenergic alpha-2 Receptor Agonists] explode all
trees

63
#37 (adrenergic near/2 alpha* near/3 agonist*)
#38 apraclonidin*
#39 brimonidine*
#40 (drug* or medic* or pharmacologic*) near/3 (treat* or therap* or
intervent*)
#41 {or #7-#40}
#42 #6 and #41
MEDLINE (OVID)
1. exp clinical trial/ [publication type]
2. (randomized or randomised).ab,ti.
3. placebo.ab,ti.
4. dt.fs.
5. randomly.ab,ti.
6. trial.ab,ti.
7. groups.ab,ti.
8. or/1-7
9. exp animals/
10. exp humans/
11. 9 not (9 and 10)
12. 8 not 11
13. exp glaucoma open angle/
14. exp ocular hypertension/
15. (open adj2 angle adj2 glaucoma$).tw.
16. (POAG or OHT).tw.
17. (((increas$ or elevat$ or high$) adj3 (ocular or intra-ocular)) and pressure).tw.
18. or/13-17
19. exp adrenergic beta antagonists/
20. exp timolol/
21. timolol$.tw.
22. exp metipranolol/
23. metipranolol$.tw.
24. exp carteolol/
25. carteolol$.tw.
26. exp levobunolol/
27. levobunolol$.tw.
28. exp betaxolol/
29. betaxolol$.tw.

64
30. exp carbonic anhydrase inhibitors/
31. (carbonic adj2 anhydrase adj2 inhibitor$).tw.
32. exp Acetazolamide/
33. acetazolamide$.tw.
34. brinzolamide$.tw.
35. dorzolamide$.tw.
36. exp Prostaglandins, Synthetic/
37. latanoprost$.tw.
38. travoprost$.tw.
39. bimatoprost$.tw.
40. unoprostone$.tw.
41. brimonidine$.tw.
42. exp antihypertensive agents/
43. exp pilocarpine/
44. pilocarpin$.tw.
45. exp epinephrine/
46. epinephrin$.tw.
47. dipivefrin$.tw.
48. exp Adrenergic alpha-2 Receptor Agonists/
49. ((adrenergic adj2 alpha$ adj2 receptor$) or (adrenergic adj2 alpha$ adj2
agonist$)).tw.
50. apraclonidin$.tw.
51. tafluprost$.tw.
52. ((drug$ or medic$ or pharmacologic$) adj3 (treat$ or therap$ or
intervent$)).tw.
53. or/19-52
54. 18 and 53
55. 12 and 54
Embase.com
#1 'randomized controlled trial'/exp
#2 'randomization'/exp
#3 'double blind procedure'/exp
#4 'single blind procedure'/exp
#5 random*:ab,ti
#6 #1 OR #2 OR #3 OR #4 OR #5
#7 'animal'/exp OR 'animal experiment'/exp
#8 'human'/exp
#9 #7 AND #8
#10 #7 NOT #9

65
#11 #6 NOT #10
#12 'clinical trial'/exp
#13 (clin* NEAR/3 trial*):ab,ti
#14 ((singl* OR doubl* OR trebl* OR tripl*) NEAR/3 (blind* OR
mask*)):ab,ti
#15 'placebo'/exp
#16 placebo*:ab,ti
#17 random*:ab,ti
#18 'experimental design'/exp
#19 'crossover procedure'/exp
#20 'control group'/exp
#21 'latin square design'/exp
#22 #12 OR #13 OR #14 OR #15 OR #16 OR #17 OR #18 OR #19 OR #20
OR #21
#23 #22 NOT #10
#24 #23 NOT #11
#25 'comparative study'/exp
#26 'evaluation'/exp
#27 'prospective study'/exp
#28 control*:ab,ti OR prospectiv*:ab,ti OR volunteer*:ab,ti
#29 #25 OR #26 OR #27 OR #28
#30 #29 NOT #10
#31 #30 NOT (#11 OR #23)
#32 #11 OR #24 OR #31
#33 'open angle glaucoma'/exp
#34 'intraocular hypertension'/exp
#35 (open NEAR/2 angle):ab,ti AND (angle NEAR/2 glaucoma*):ab,ti
#36 poag:ab,ti OR oht:ab,ti
#37 ((increas* OR elevat* OR high*) NEAR/3 (ocular OR 'intra ocular')):ab,ti
AND pressure:ab,ti
#38 #33 OR #34 OR #35 OR #36 OR #37
#39 'beta adrenergic receptor blocking agent'/exp
#40 'timolol'/exp
#41 timolol*:ab,ti
#42 'metipranolol'/exp
#43 metipranolol*:ab,ti
#44 'carteolol'/exp
#45 carteolol*:ab,ti
#46 'levobunolol'/exp
#47 levobunolol*:ab,ti

66
#48 'betaxolol'/exp
#49 betaxolol*:ab,ti
#50 'carbonate dehydratase inhibitor'/exp
#51 (carbonic NEAR/2 anhydrase):ab,ti AND (anhydrase NEAR/2
inhibitor*):ab,ti
#52 'acetazolamide'/exp
#53 acetazolamide*:ab,ti
#54 brinzolamide*:ab,ti
#55 dorzolamide*:ab,ti
#56 'latanoprost'/exp
#57 latanoprost*:ab,ti
#58 'travoprost'/exp
#59 travoprost*:ab,ti
#60 'bimatoprost'/exp
#61 bimatoprost*:ab,ti
#62 'unoprostone isopropyl ester'/exp
#63 unoprostone*:ab,ti
#64 'brimonidine'/exp
#65 brimonidine*:ab,ti
#66 'antihypertensive agent'/exp
#67 'pilocarpine'/exp
#68 pilocarpin*:ab,ti
#69 'adrenalin'/exp
#70 epinephrin*:ab,ti
#71 dipivefrin*:ab,ti
#72 'alpha 2 adrenergic receptor stimulating agent'/exp
#73 (adrenergic NEAR/2 alpha*):ab,ti AND (alpha* NEAR/2 agonist*):ab,ti
#74 apraclonidin*:ab,ti
#75 'tafluprost'/exp
#76 tafluprost*:ab,ti
#77 ((drug* OR medic* OR pharmacologic*) NEAR/3 (treat* OR therap* OR
intervent*)):ab,ti
#78 #39 OR #40 OR #41 OR #42 OR #43 OR #44 OR #45 OR #46 OR #47
OR #48 OR #49 OR #50 OR #51 OR #52 OR #53 OR #54 OR #55 OR #56 OR
#57 OR #58 OR #59 OR #60 OR #61 OR #62 OR #63 OR #64 OR #65 OR #66
OR #67 OR #68 OR #69 OR #70 OR #71 OR #72 OR #73 OR #74 OR #75 OR
#76 OR #77
#79 #38 AND #78
#80 #32 AND #79
67
PubMed
#1 ((randomized controlled trial[pt]) OR (controlled clinical trial[pt]) OR
(randomised[tiab] OR randomized[tiab]) OR (placebo[tiab]) OR (drug
therapy[sh]) OR (randomly[tiab]) OR (trial[tiab]) OR (groups[tiab])) NOT
(animals[mh] NOT humans[mh])
#2 (open[tw] AND angle[tw] AND glaucoma*[tw]) NOT Medline[sb]
#3 (POAG[tw] OR OHT[tw]) NOT Medline[sb]
#4 (((increase*[tw] OR elevat*[tw] OR high*[tw]) AND (ocular[tw] OR
intra-ocular[tw])) AND pressure[tw]) NOT Medline[sb]
#5 #2 OR #3 OR #4
#6 timolol*[tw] NOT Medline[sb]
#7 metipranolol*[tw] NOT Medline[sb]
#8 carteolol*[tw] NOT Medline[sb]
#9 levobunolol*[tw] NOT Medline[sb]
#10 betaxolol*[tw] NOT Medline[sb]
#11 (carbonic[tw] AND anhydrase[tw] AND inhibitor*[tw]) NOT Medline[sb]
#12 acetazolamide*[tw] NOT Medline[sb]
#13 brinzolamide*[tw] NOT Medline[sb]
#14 dorzolamide*[tw] NOT Medline[sb]
#15 latanoprost*[tw] NOT Medline[sb]
#16 travoprost*[tw] NOT Medline[sb]
#17 bimatoprost*[tw] NOT Medline[sb]
#18 unoprostone*[tw] NOT Medline[sb]
#19 brimonidine*[tw] NOT Medline[sb]
#20 pilocarpin*[tw] NOT Medline[sb]
#21 epinephrin*[tw] NOT Medline[sb]
#22 dipivefrin* NOT Medline[sb]
#23 ((adrenergic[tw] AND alpha*[tw] AND receptor*[tw]) OR
(adrenergic[tw] AND alpha*[tw] AND agonist*[tw])) NOT Medline[sb]
#24 apraclonidin*[tw] NOT Medline[sb]
#25 tafluprost*[tw] NOT Medline[sb]
#26 ((drug*[tw] OR medic*[tw] OR pharmacologic*[tw]) AND (treat*[tw]
OR therap*[tw] OR intervent*[tw])) NOT Medline[sb]
#27 #6 OR #7 OR #8 OR #9 OR #10 OR #11 OR #12 OR #13 OR #14 OR
#15 OR #16 OR #17 OR #18 OR #19 OR #20 OR #21 OR #22 OR #23 OR #24
OR #25 OR #26
#28 #5 AND #27
#29 #1 AND #2

68
Appendix II. References to included studies
1. Radius RL. Use of betaxolol in the reduction of elevated intraocular
pressure. Arch Ophthalmol 1983; 101(6): 898-900.
2. Berry DP, Jr., Van Buskirk EM, Shields MB. Betaxolol and timolol. A
comparison of efficacy and side effects. Arch Ophthalmol 1984; 102(1):
42-5.
3. Bensinger RE, Keates EU, Gofman JD, Novack GD, Duzman E.
Levobunolol. A three-month efficacy study in the treatment of glaucoma
and ocular hypertension. Arch Ophthalmol 1985; 103(3): 375-8.
4. Berson FG, Cohen HB, Foerster RJ, Lass JH, Novack GD, Duzman E.
Levobunolol compared with timolol for the long-term control of
elevated intraocular pressure. Arch Ophthalmol 1985; 103(3): 379-82.
5. Cinotti A, Cinotti D, Grant W, et al. Levobunolol vs timolol for open-
angle glaucoma and ocular hypertension. Am J Ophthalmol 1985; 99(1):
11-7.
6. Ober M, Scharrer A, David R, et al. Long-term ocular hypotensive effect
of levobunolol: results of a one-year study. Br J Ophthalmol 1985;
69(8): 593-9.
7. Stryz JR, Merte HJ. [Pressure lowering effect and side effects of 0.5%
and 1.0% levobunolol eyedrops, compared with 0.5% timolol eyedrops
in patients with open-angle glaucoma]. Klin Monbl Augenheilkd 1985;
187(6): 537-44.
8. Stewart RH, Kimbrough RL, Ward RL. Betaxolol vs timolol. A six-
month double-blind comparison. Arch Ophthalmol 1986; 104(1): 46-8.
9. Boozman FW, 3rd, Carriker R, Foerster R, Allen RC, Novack GD,
Batoosingh AL. Long-term evaluation of 0.25% levobunolol and timolol
for therapy for elevated intraocular pressure. Arch Ophthalmol 1988;
106(5): 614-8.
10. Feghali JG, Kaufman PL, Radius RL, Mandell AI. A comparison of
betaxolol and timolol in open angle glaucoma and ocular hypertension.
Acta Ophthalmol (Copenh) 1988; 66(2): 180-6.
11. Freyler H, Novack GD, Menapace R, Skorpik C, Mordaunt J,
Batoosingh AL. [Comparison of the effectiveness and safety of
levobunolol and timolol in ocular hypertension and chronic open-angle
glaucoma]. Klin Monbl Augenheilkd 1988; 193(3): 257-60.
12. Long DA, Johns GE, Mullen RS, et al. Levobunolol and betaxolol. A
double-masked controlled comparison of efficacy and safety in patients
with elevated intraocular pressure. Ophthalmology 1988; 95(6): 735-41.
69
13. Seamone C, LeBlanc R, Saheb N, Novack G. Efficacy of twice-daily
levobunolol in the treatment of elevated intraocular pressure. Can J
Ophthalmol 1988; 23(4): 168-70.
14. Epstein DL, Krug JH, Jr., Hertzmark E, Remis LL, Edelstein DJ. A
long-term clinical trial of timolol therapy versus no treatment in the
management of glaucoma suspects. Ophthalmology 1989; 96(10): 1460-
7.
15. Kass MA, Gordon MO, Hoff MR, et al. Topical timolol administration
reduces the incidence of glaucomatous damage in ocular hypertensive
individuals. A randomized, double-masked, long-term clinical trial. Arch
Ophthalmol 1989; 107(11): 1590-8.
16. Yoshiaki K, Ikuo A, Makoto A. Clinical evaluation of betaxolol
hydrochloride in the treatment of primary open angle glaucoma and
ocular hypertension. Multi-center double-masked study in comparison
with timolol. Rinsho Hyoka (Clinical Evaluation) 1989; 17(2): 243-74.
17. Schulzer M, Drance SM, Douglas GR. A comparison of treated and
untreated glaucoma suspects. Ophthalmology 1991; 98(3): 301-7.
18. Silverstone D, Zimmerman T, Choplin N, et al. Evaluation of once-daily
levobunolol 0.25% and timolol 0.25% therapy for increased intraocular
pressure. Am J Ophthalmol 1991; 112(1): 56-60.
19. Beehler CC, Stewart WC, Macdonald DK, et al. A comparison of the
ocular hypotensive efficacy of twice-daily 0.25% levobunolol to 0.5%
timolol in patients previously treated with 0.5% timolol. J Glaucoma
1992; 1(4): 237-42.
20. Flammer J, Kitazawa Y, Bonomi L, et al. Influence of carteolol and
timolol on IOP an visual fields in glaucoma: a multi-center, double-
masked, prospective study. Eur J Ophthalmol 1992; 2(4): 169-74.
21. Azuma I, Masuda K, Kitazawa Y, Takase M, Yamamura H. Double-
masked comparative study of UF-021 and timolol ophthalmic solutions
in patients with primary open-angle glaucoma or ocular hypertension.
Jpn J Ophthalmol 1993; 37(4): 514-25.
22. Nagasubramanian S, Hitchings RA, Demailly P, et al. Comparison of
apraclonidine and timolol in chronic open-angle glaucoma. A three-
month study. Ophthalmology 1993; 100(9): 1318-23.
23. Wilkerson M, Cyrlin M, Lippa EA, et al. Four-week safety and efficacy
study of dorzolamide, a novel, active topical carbonic anhydrase
inhibitor. Arch Ophthalmol 1993; 111(10): 1343-50.
24. Behrens-Baumann W, Kimmich F, Walt JG, Lue J. A comparison of the
ocular hypotensive efficacy and systemic safety of 0.5% levobunolol
and 2% carteolol. Ophthalmologica 1994; 208(1): 32-6.

70
25. Kitazawa Y. Phase III comparative study of MK-507 ophthalmic
solution in primary open-angle glaucoma and ocular hypertension. Folia
Ophthalmol Jpn 1994; 45(9): 1023-33.
26. Ravalico G, Salvetat L, Toffoli G, Pastori G, Croce M, Battaglia P.
Ocular hypertension: A follow-up study in treated and untreated
patients. NEW TRENDS OPHTHALMOL 1994; 9(2): 97-101.
27. Alm A, Stjernschantz J. Effects on intraocular pressure and side effects
of 0.005% latanoprost applied once daily, evening or morning. A
comparison with timolol. Scandinavian Latanoprost Study Group.
Ophthalmology 1995; 102(12): 1743-52.
28. Schwartz B, Lavin P, Takamoto T, Araujo DF, Smits G. Decrease of
optic disc cupping and pallor of ocular hypertensives with timolol
therapy. Acta Ophthalmol Scand Suppl 1995; (215): 5-21.
29. Strahlman E, Tipping R, Vogel R. A double-masked, randomized 1-year
study comparing dorzolamide (Trusopt), timolol, and betaxolol.
International Dorzolamide Study Group. Arch Ophthalmol 1995; 113(8):
1009-16.
30. Fristrom B. A 6-month, randomized, double-masked comparison of
latanoprost with timolol in patients with open angle glaucoma or ocular
hypertension. Acta Ophthalmol Scand 1996; 74(2): 140-4.
31. Mishima HK, Masuda K, Kitazawa Y, Azuma I, Araie M. A comparison
of latanoprost and timolol in primary open-angle glaucoma and ocular
hypertension. A 12-week study. Arch Ophthalmol 1996; 114(8): 929-32.
32. Schuman JS. Clinical experience with brimonidine 0.2% and timolol
0.5% in glaucoma and ocular hypertension. Surv Ophthalmol 1996; 41
Suppl 1: S27-37.
33. Serle JB. A comparison of the safety and efficacy of twice daily
brimonidine 0.2% versus betaxolol 0.25% in subjects with elevated
intraocular pressure. The Brimonidine Study Group III. Surv
Ophthalmol 1996; 41 Suppl 1: S39-47.
34. Stewart WC, Laibovitz R, Horwitz B, Stewart RH, Ritch R, Kottler M.
A 90-day study of the efficacy and side effects of 0.25% and 0.5%
apraclonidine vs 0.5% timolol. Apraclonidine Primary Therapy Study
Group. Arch Ophthalmol 1996; 114(8): 938-42.
35. Watson P, Stjernschantz J. A six-month, randomized, double-masked
study comparing latanoprost with timolol in open-angle glaucoma and
ocular hypertension. The Latanoprost Study Group. Ophthalmology
1996; 103(1): 126-37.
36. Yamamoto T, Kitazawa Y, Noma A, et al. The effects of the beta-
adrenergic-blocking agents, timolol and carteolol, on plasma lipids and
lipoproteins in Japanese glaucoma patients. J Glaucoma 1996; 5(4):
252-7.

71
37. Kitazawa Y, Azuma I, Shirato S, et al. Phase III Clinical Study of AG-
901 Ophthalmic Solution on Primary Open-Angle Glaucoma and Ocular
Hypertension: A Multicenter, Double-Blind Comparison with 0.5%
Timolol Maleate. Journal of Clinical Therapeutics and Medicines 1997;
13(11): 2975-91.
38. Stewart WC, Cohen JS, Netland PA, Weiss H, Nussbaum LL. Efficacy
of carteolol hydrochloride 1% vs timolol maleate 0.5% in patients with
increased intraocular pressure. Nocturnal Investigation of Glaucoma
Hemodynamics Trial Study Group. Am J Ophthalmol 1997; 124(4): 498-
505.
39. Boyle JE, Ghosh K, Gieser DK, Adamsons IA. A randomized trial
comparing the dorzolamide-timolol combination given twice daily to
monotherapy with timolol and dorzolamide. Dorzolamide-Timolol Study
Group. Ophthalmology 1998; 105(10): 1945-51.
40. Clineschmidt CM, Williams RD, Snyder E, Adamsons IA. A
randomized trial in patients inadequately controlled with timolol alone
comparing the dorzolamide-timolol combination to monotherapy with
timolol or dorzolamide. Dorzolamide-Timolol Combination Study
Group. Ophthalmology 1998; 105(10): 1952-9.
41. Diestelhorst M, Almegard B. Comparison of two fixed combinations of
latanoprost and timolol in open-angle glaucoma. Graefes Arch Clin Exp
Ophthalmol 1998; 236(8): 577-81.
42. LeBlanc RP. Twelve-month results of an ongoing randomized trial
comparing brimonidine tartrate 0.2% and timolol 0.5% given twice daily
in patients with glaucoma or ocular hypertension. Brimonidine Study
Group 2. Ophthalmology 1998; 105(10): 1960-7.
43. Rusk C, Sharpe E, Laurence J, Polis A, Adamsons I. Comparison of the
efficacy and safety of 2% dorzolamide and 0.5% betaxolol in the
treatment of elevated intraocular pressure. Dorzolamide Comparison
Study Group. Clin Ther 1998; 20(3): 454-66.
44. Silver LH. Clinical efficacy and safety of brinzolamide (Azopt), a new
topical carbonic anhydrase inhibitor for primary open-angle glaucoma
and ocular hypertension. Brinzolamide Primary Therapy Study Group.
Am J Ophthalmol 1998; 126(3): 400-8.
45. Bojic L, Bagatin J, Ivanisevic M, Hozo I, Racic G, Karelovic D.
Influence of betaxolol and timolol on the venous tone in glaucoma
patients. Int Ophthalmol 1999; 23(3): 149-53.
46. Stewart WC, Dubiner HB, Mundorf TK, et al. Effects of carteolol and
timolol on plasma lipid profiles in older women with ocular
hypertension or primary open-angle glaucoma. Am J Ophthalmol 1999;
127(2): 142-7.

72
47. Toris CB, Camras CB, Yablonski ME. Acute versus chronic effects of
brimonidine on aqueous humor dynamics in ocular hypertensive
patients. Am J Ophthalmol 1999; 128(1): 8-14.
48. Alm A, Widengard I. Latanoprost: experience of 2-year treatment in
Scandinavia. Acta Ophthalmol Scand 2000; 78(1): 71-6.
49. O'Donoghue EP. A comparison of latanoprost and dorzolamide in
patients with glaucoma and ocular hypertension: a 3 month, randomised
study. Ireland Latanoprost Study Group. Br J Ophthalmol 2000; 84(6):
579-82.
50. Sall K. The efficacy and safety of brinzolamide 1% ophthalmic
suspension (Azopt) as a primary therapy in patients with open-angle
glaucoma or ocular hypertension. Brinzolamide Primary Therapy Study
Group. Surv Ophthalmol 2000; 44 Suppl 2: S155-62.
51. Bron AM, Denis P, Nordmann JP, Rouland JF, Sellem E, Johansson M.
Additive IOP-reducing effect of latanoprost in patients insufficiently
controlled on timolol. Acta ophthalmologica Scandinavica 2001; 79(3):
289-93.
52. DuBiner HB, Mroz M, Shapiro AM, Dirks MS, Brimonidine vs.
Latanoprost Study G. A comparison of the efficacy and tolerability of
brimonidine and latanoprost in adults with open-angle glaucoma or
ocular hypertension: a three-month, multicenter, randomized, double-
masked, parallel-group trial. Clin Ther 2001; 23(12): 1969-83.
53. Kobayashi H, Kobayashi K, Okinami S. A comparison of intraocular
pressure-lowering effect of prostaglandin F2 -alpha analogues,
latanoprost, and unoprostone isopropyl. J Glaucoma 2001; 10(6): 487-
92.
54. Susanna R, Jr., Giampani J, Jr., Borges AS, Vessani RM, Jordao ML. A
double-masked, randomized clinical trial comparing latanoprost with
unoprostone in patients with open-angle glaucoma or ocular
hypertension. Ophthalmology 2001; 108(2): 259-63.
55. Aung T, Chew PT, Oen FT, et al. Additive effect of unoprostone and
latanoprost in patients with elevated intraocular pressure. Br J
Ophthalmol 2002; 86(1): 75-9.
56. Bergstrand IC, Heijl A, Harris A. Dorzolamide and ocular blood flow in
previously untreated glaucoma patients: a controlled double-masked
study. Acta Ophthalmol Scand 2002; 80(2): 176-82.
57. Halpern MT, Covert DW, Robin AL. Projected impact of travoprost
versus both timolol and latanoprost on visual field deficit progression
and costs among black glaucoma subjects. Trans Am Ophthalmol Soc.
2002;100:109-17
58. Fellman RL, Sullivan EK, Ratliff M, et al. Comparison of travoprost
0.0015% and 0.004% with timolol 0.5% in patients with elevated
73
intraocular pressure: a 6-month, masked, multicenter trial.
Ophthalmology 2002; 109(5): 998-1008.
59. Higginbotham EJ, Feldman R, Stiles M, Dubiner H, Fixed Combination
Investigative G. Latanoprost and timolol combination therapy vs
monotherapy: one-year randomized trial. Arch Ophthalmol 2002;
120(7): 915-22.
60. Jampel HD, Bacharach J, Sheu WP, et al. Randomized clinical trial of
latanoprost and unoprostone in patients with elevated intraocular
pressure. Am J Ophthalmol 2002; 134(6): 863-71.
61. Kampik A, Arias-Puente A, O'Brart DP, Vuori ML, European
Latanoprost Study G. Intraocular pressure-lowering effects of
latanoprost and brimonidine therapy in patients with open-angle
glaucoma or ocular hypertension: a randomized observer-masked
multicenter study. J Glaucoma 2002; 11(2): 90-6.
62. Nordmann JP, Mertz B, Yannoulis NC, et al. A double-masked
randomized comparison of the efficacy and safety of unoprostone with
timolol and betaxolol in patients with primary open-angle glaucoma
including pseudoexfoliation glaucoma or ocular hypertension. 6 month
data. Am J Ophthalmol 2002; 133(1): 1-10.
63. Pfeiffer N, European Latanoprost Fixed Combination Study G. A
comparison of the fixed combination of latanoprost and timolol with its
individual components. Graefes Arch Clin Exp Ophthalmol 2002;
240(11): 893-9.
64. Simmons ST, Earl ML, Alphagan/Xalatan Study G. Three-month
comparison of brimonidine and latanoprost as adjunctive therapy in
glaucoma and ocular hypertension patients uncontrolled on beta-
blockers: tolerance and peak intraocular pressure lowering.
Ophthalmology 2002; 109(2): 307-14; discussion 14-5.
65. Sponsel WE, Paris G, Trigo Y, Pena M. Comparative effects of
latanoprost (Xalatan) and unoprostone (Rescula) in patients with open-
angle glaucoma and suspected glaucoma. Am J Ophthalmol 2002;
134(4): 552-9.
66. Tsukamoto H, Mishima HK, Kitazawa Y, et al. A comparative clinical
study of latanoprost and isopropyl unoprostone in Japanese patients with
primary open-angle glaucoma and ocular hypertension. J Glaucoma
2002; 11(6): 497-501.
67. Camras CB, Hedman K, Group USLS. Rate of response to latanoprost or
timolol in patients with ocular hypertension or glaucoma. J Glaucoma
2003; 12(6): 466-9.
68. Cardascia N, Vetrugno M, Trabucco T, Cantatore F, Sborgia C. Effects
of travoprost eye drops on intraocular pressure and pulsatile ocular
blood flow: a 180-day, randomized, double-masked comparison with
74
latanoprost eye drops in patients with open-angle glaucoma. Current
therapeutic research, clinical and experimental 2003; 64(7): 389-400.
69. Inan UU, Ermis SS, Yucel A, Ozturk F. The effects of latanoprost and
brimonidine on blood flow velocity of the retrobulbar vessels: a 3-month
clinical trial. Acta Ophthalmol Scand 2003; 81(2): 155-60.
70. Kamal D, Garway-Heath D, Ruben S, et al. Results of the betaxolol
versus placebo treatment trial in ocular hypertension. Graefes Arch Clin
Exp Ophthalmol 2003; 241(3): 196-203.
71. Parrish RK, Palmberg P, Sheu WP, Group XLTS. A comparison of
latanoprost, bimatoprost, and travoprost in patients with elevated
intraocular pressure: a 12-week, randomized, masked-evaluator
multicenter study. Am J Ophthalmol 2003; 135(5): 688-703.
72. Erkin EF, Tarhan S, Kayikcioglu OR, Deveci H, Guler C, Goktan C.
Effects of betaxolol and latanoprost on ocular blood flow and visual
fields in patients with primary open-angle glaucoma. Eur J Ophthalmol
2004; 14(3): 211-9.
73. Kobayashi H, Iwakiri R, Kobayashi K, Okinami S. Hypotensive effect
of unoprostone as adjunct to latanoprost during multiple drug therapy for
glaucoma. Japanese Journal of Clinical Ophthalmology 2004; 58(2):
193-7.
74. Vetrugno M, Cardascia N, Cantatore F, Sborgia C. Comparison of the
effects of bimatoprost and timolol on intraocular pressure and pulsatile
ocular blood flow in patients with primary open-angle glaucoma: A
prospective, open-label, randomized, two-arm, parallel-group study.
Current therapeutic research, clinical and experimental 2004; 65(6):
444-54.
75. Walters TR, DuBiner HB, Carpenter SP, Khan B, VanDenburgh AM,
Bimatoprost Circadian IOPSG. 24-Hour IOP control with once-daily
bimatoprost, timolol gel-forming solution, or latanoprost: a 1-month,
randomized, comparative clinical trial. Surv Ophthalmol 2004; 49 Suppl
1: S26-35.
76. Wang TH, Huang JY, Hung PT, Shieh JW, Chen YF. Ocular
hypotensive effect and safety of brinzolamide ophthalmic solution in
open angle glaucoma patients. J Formos Med Assoc 2004; 103(5): 369-
73.
77. Barnebey HS, Orengo-Nania S, Flowers BE, et al. The safety and
efficacy of travoprost 0.004%/timolol 0.5% fixed combination
ophthalmic solution. Am J Ophthalmol 2005; 140(1): 1-7.
78. Camras CB, Sheu WP, United States Latanoprost-Brimonidine Study G.
Latanoprost or brimonidine as treatment for elevated intraocular
pressure: multicenter trial in the United States. J Glaucoma 2005; 14(2):
161-7.

75
79. Miglior S, Zeyen T, Pfeiffer N, et al. Results of the European Glaucoma
Prevention Study. Ophthalmology 2005; 112(3): 366-75.
80. Erkin EF, Celik P, Kayikcioglu O, Deveci HM, Sakar A. Effects of
latanoprost and betaxolol on cardiovascular and respiratory status of
newly diagnosed glaucoma patients. Ophthalmologica 2006; 220(5):
332-7.
81. Koz OG, Ozsoy A, Yarangumeli A, Kose SK, Kural G. Comparison of
the effects of travoprost, latanoprost and bimatoprost on ocular
circulation: a 6-month clinical trial. Acta Ophthalmol Scand 2007; 85(8):
838-43.
82. Martin E, Martinez-de-la-Casa JM, Garcia-Feijoo J, Troyano J, Larrosa
JM, Garcia-Sanchez J. A 6-month assessment of bimatoprost 0.03% vs
timolol maleate 0.5%: hypotensive efficacy, macular thickness and flare
in ocular-hypertensive and glaucoma patients. Eye (Lond) 2007; 21(2):
164-8.
83. Alagoz G, Gurel K, Bayer A, Serin D, Celebi S, Kukner S. A
comparative study of bimatoprost and travoprost: effect on intraocular
pressure and ocular circulation in newly diagnosed glaucoma patients.
Ophthalmologica 2008; 222(2): 88-95.
84. Brandt JD, Cantor LB, Katz LJ, et al. Bimatoprost/timolol fixed
combination: a 3-month double-masked, randomized parallel
comparison to its individual components in patients with glaucoma or
ocular hypertension. J Glaucoma 2008; 17(3): 211-6.
85. Kaback M, Scoper SV, Arzeno G, et al. Intraocular pressure-lowering
efficacy of brinzolamide 1%/timolol 0.5% fixed combination compared
with brinzolamide 1% and timolol 0.5%. Ophthalmology 2008; 115(10):
1728-34, 34 e1-2.
86. Williams RD, Cohen JS, Gross RL, et al. Long-term efficacy and safety
of bimatoprost for intraocular pressure lowering in glaucoma and ocular
hypertension: year 4. Br J Ophthalmol 2008; 92(10): 1387-92.
87. Yildirim N, Sahin A, Gultekin S. The effect of latanoprost, bimatoprost,
and travoprost on circadian variation of intraocular pressure in patients
with open-angle glaucoma. J Glaucoma 2008; 17(1): 36-9.
88. Casson RJ, Liu L, Graham SL, et al. Efficacy and safety of bimatoprost
as replacement for latanoprost in patients with glaucoma or ocular
hypertension: a uniocular switch study. Journal of glaucoma 2009;
18(8): 582-8.
89. Prata TS, Piassi MV, Melo LA, Jr. Changes in visual function after
intraocular pressure reduction using antiglaucoma medications. Eye
(Lond) 2009; 23(5): 1081-5.
90. Sharma R, Kohli K, Kapoor B, Mengi RK, Sadhotra P. The cardio-
vascular effects of topical timolol, levobunolol and betaxolol in patients

76
of chronic simple glaucoma. Journal of Clinical and Diagnostic
Research 2009; 3(4): 1615-20.
91. Zhao WJ. [Comparison of travoprost and timolol in patients with
primary open angle glaucoma and ocular hypertension]. International
Journal of Ophthalmology 2009; 9(9): 1753-4.
92. Birt CM, Buys YM, Ahmed, II, Trope GE. Prostaglandin efficacy and
safety study undertaken by race (the PRESSURE study). Journal of
glaucoma 2010; 19(7): 460-7.
93. Craven ER, Liu CC, Batoosingh A, Schiffman RM, Whitcup SM. A
randomized, controlled comparison of macroscopic conjunctival
hyperemia in patients treated with bimatoprost 0.01% or vehicle who
were previously controlled on latanoprost. Clin Ophthalmol 2010; 4:
1433-40.
94. Higginbotham EJ, Olander KW, Kim EE, Grunden JW, Kwok KK,
Tressler CS. Fixed combination of latanoprost and timolol vs individual
components for primary open-angle glaucoma or ocular hypertension: a
randomized, double-masked study. Archives of ophthalmology 2010;
128(2): 165-72.
95. Kammer JA, Katzman B, Ackerman SL, Hollander DA. Efficacy and
tolerability of bimatoprost versus travoprost in patients previously on
latanoprost: a 3-month, randomised, masked-evaluator, multicentre
study. The British journal of ophthalmology 2010; 94(1): 74-9.
96. Macky TA. Bimatoprost versus travoprost in an Egyptian population: a
hospital-based prospective, randomized study. Journal of ocular
pharmacology and therapeutics : the official journal of the Association
for Ocular Pharmacology and Therapeutics 2010; 26(6): 605-10.
97. Traverso CE, Ropo A, Papadia M, Uusitalo H. A phase II study on the
duration and stability of the intraocular pressure-lowering effect and
tolerability of Tafluprost compared with latanoprost. Journal of ocular
pharmacology and therapeutics : the official journal of the Association
for Ocular Pharmacology and Therapeutics 2010; 26(1): 97-104.
98. Nie X, Yang XH, Qin XF, Quan CJ, Yang SS. Correlation between the
development of high myopia and intraocular pressure. International
Journal of Ophthalmology 2011; 11(6): 1092-4.
99. Zhao L, Wang YL, Meng ZY, Hong H. Efficacy and safety of domestic
Latanoprost in treating with open angle glaucoma and ocular
hypertension. [Chinese]. International Journal of Ophthalmology 2011;
11(11): 1973-5.
100. Araie M, Yamazaki Y, Sugiyama K, Kuwayama Y, Tanihara H. [Phase
III clinical trial of brimonidine in patients with primary open-angle
glaucoma and ocular hypertension--comparison of the effects of
brimonidine monotherapy versus timolol monotherapy, or combination

77
brimonidine/prostaglandins therapy versus combination
placebo/prostaglandins therapy]. Nippon Ganka Gakkai Zasshi - Acta
Societatis Ophthalmologicae Japonicae 2012; 116(10): 955-66.
101. Chabi A, Varma R, Tsai JC, et al. Randomized clinical trial of the
efficacy and safety of preservative-free tafluprost and timolol in patients
with open-angle glaucoma or ocular hypertension. American journal of
ophthalmology 2012; 153(6): 1187-96.
102. Crichton AC, Vold S, Williams JM, Hollander DA. Ocular surface
tolerability of prostaglandin analogs and prostamides in patients with
glaucoma or ocular hypertension. Advances in Therapy 2013; 30(3):
260-70.
103. Delval L, Baudouin C, Gabisson P, Alliot E, Vincent B. Safety and
efficacy of unpreserved timolol 0.1% gel in patients controlled by
preserved latanoprost with signs of ocular intolerance. Journal français
d'ophtalmologie 2013; 36(4): 316-23.
104. Katz G, Dubiner H, Samples J, Vold S, Sall K. Three-month randomized
trial of fixed-combination brinzolamide, 1%, and brimonidine, 0.2%.
JAMA Ophthalmology 2013; 131(6): 724-30.
105. Nguyen QH, McMenemy MG, Realini T, Whitson JT, Goode SM. Phase
3 randomized 3-month trial with an ongoing 3-month safety extension of
fixed-combination brinzolamide 1%/brimonidine 0.2%. Journal of
Ocular Pharmacology and Therapeutics 2013; 29(3): 290-7.
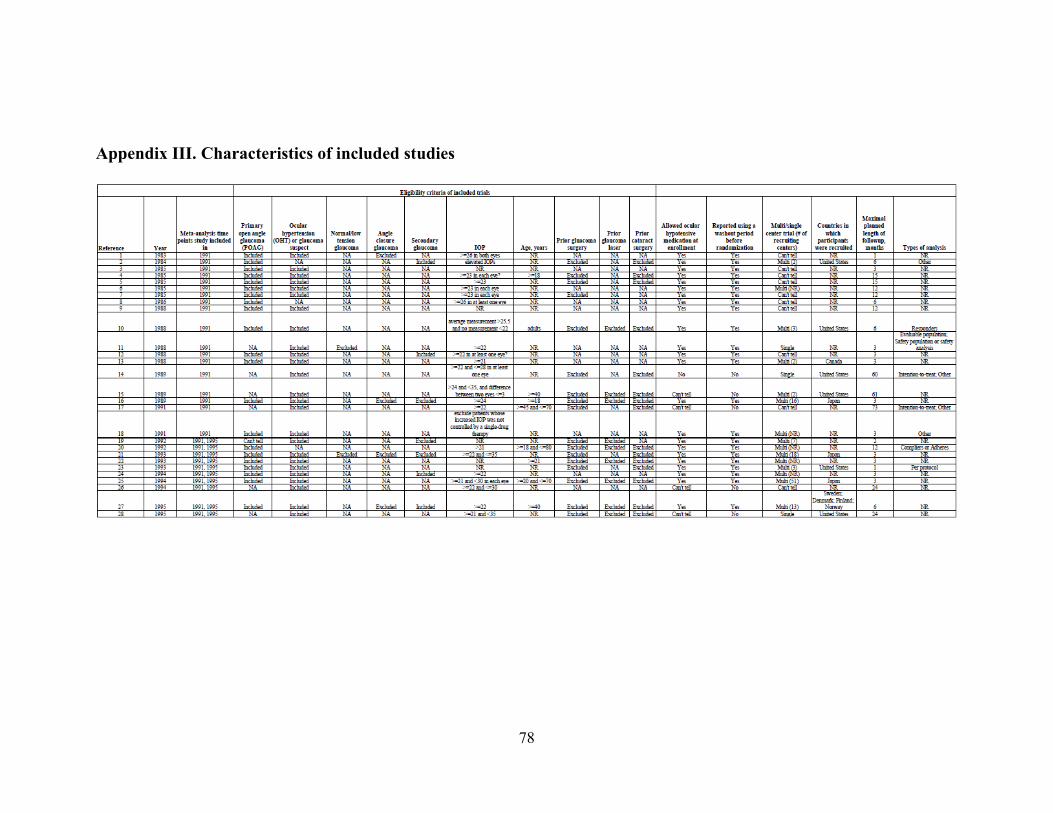
78
Appendix III. Characteristics of included studies

79
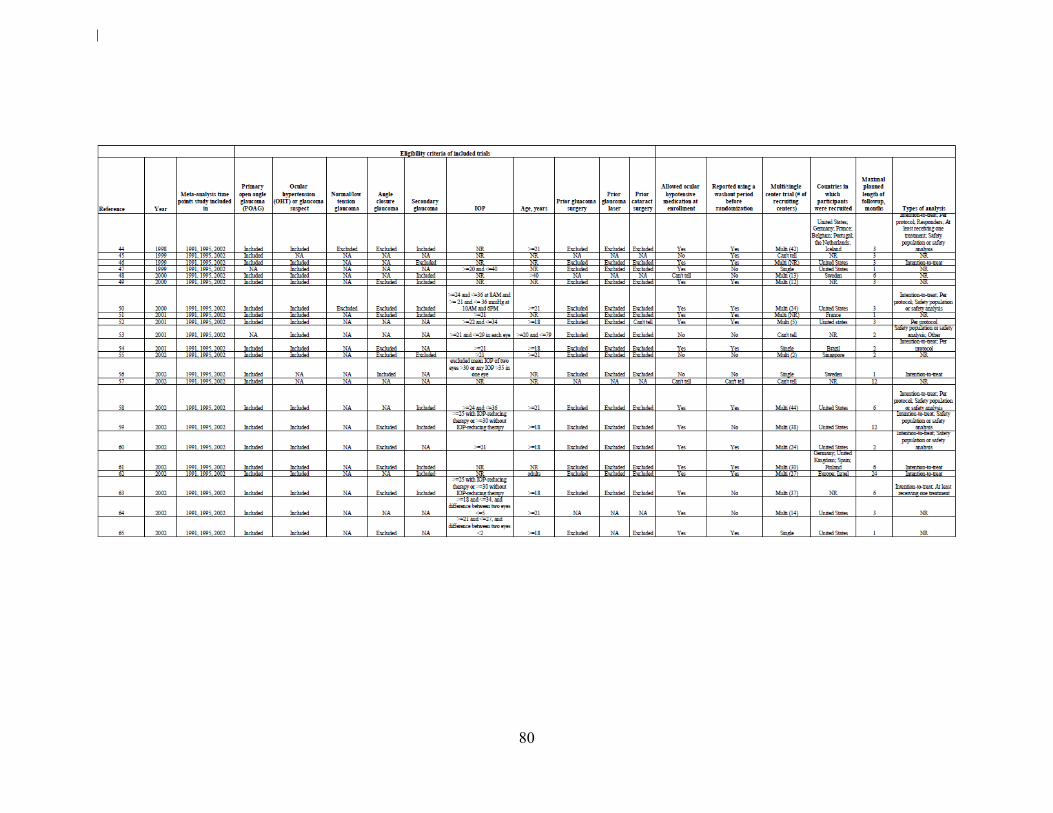
80

81

82
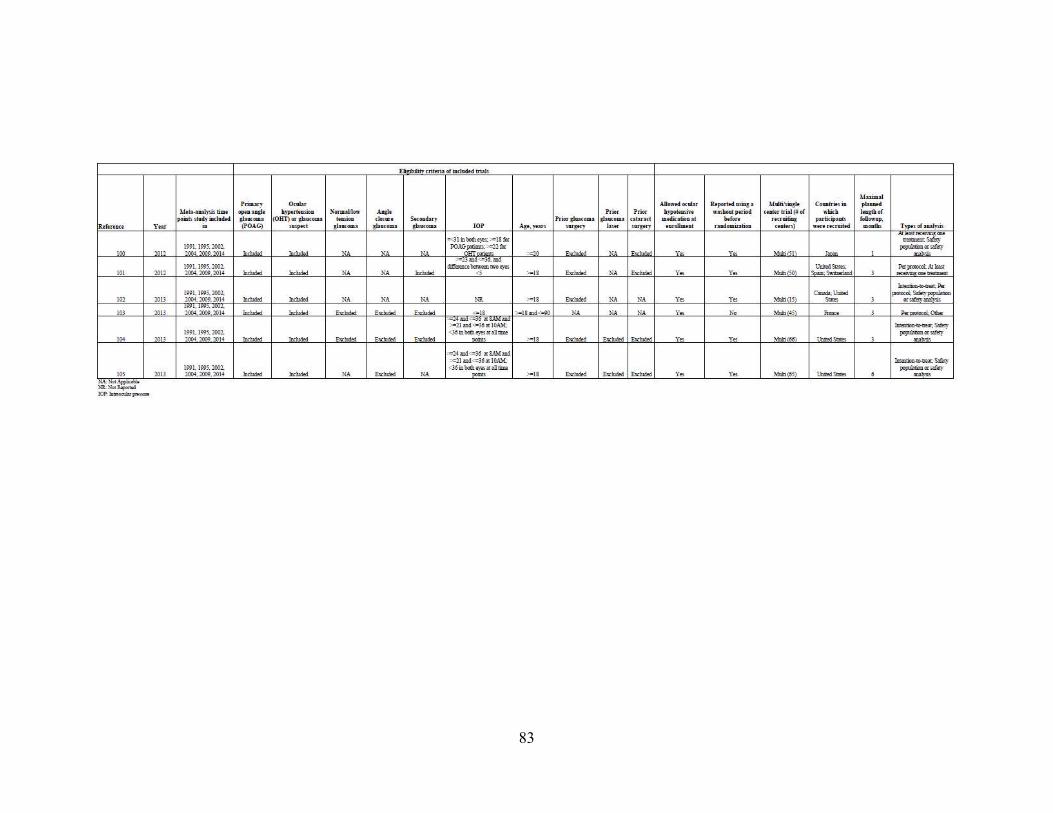
83

84
Appendix IV. Risk of bias table

85

86

87
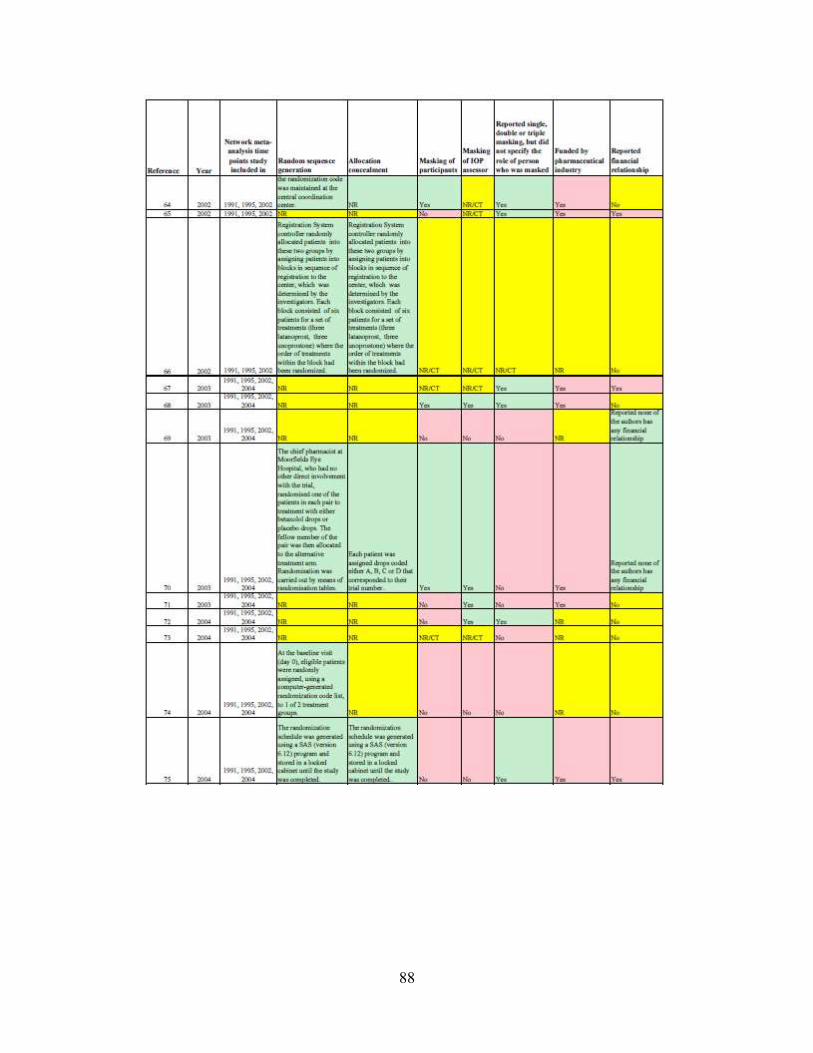
88
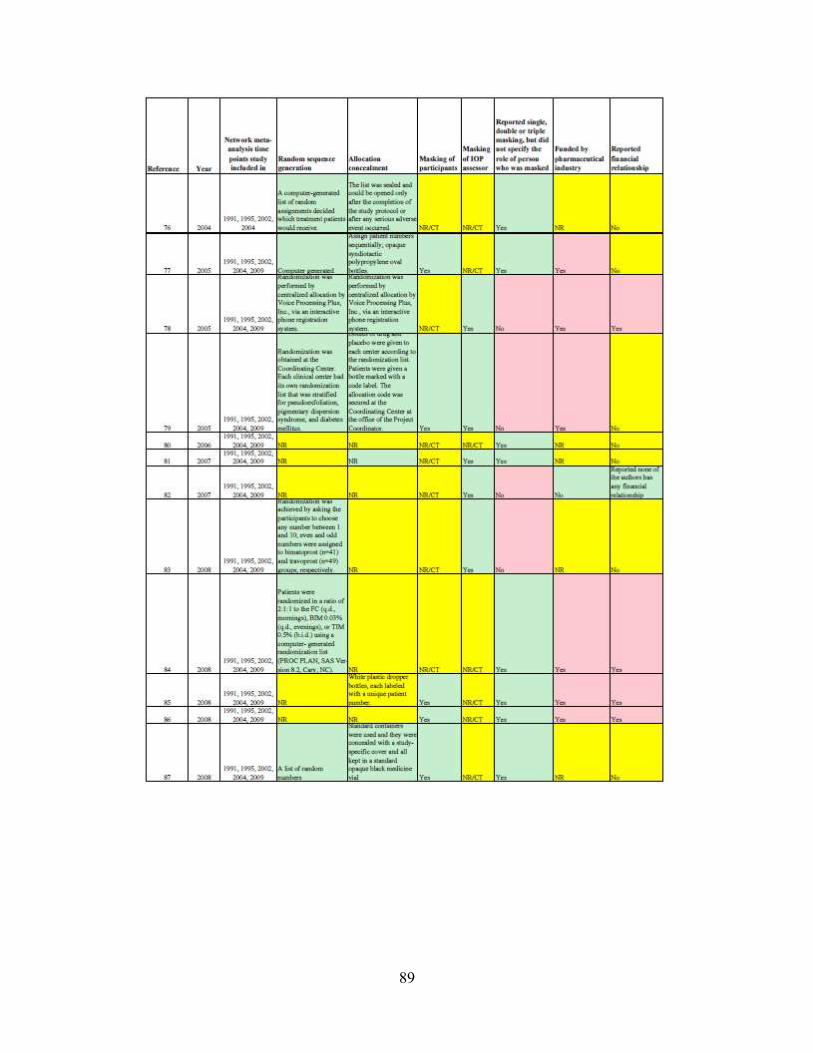
89

90
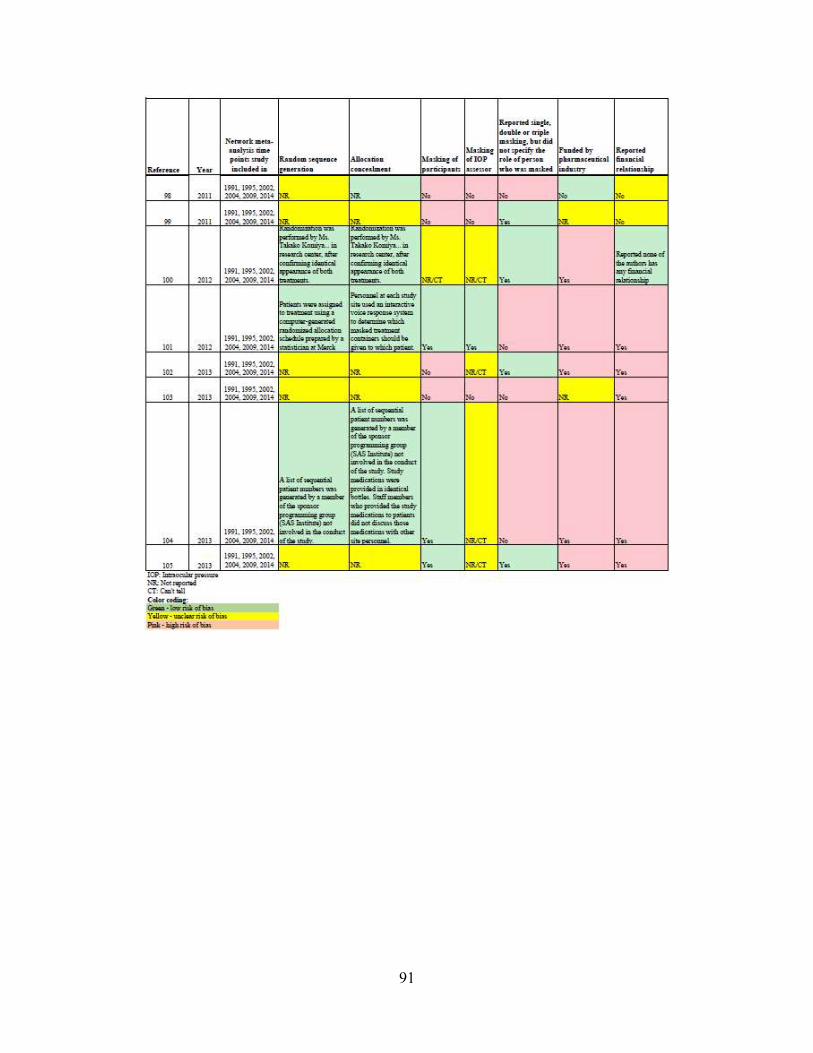
91

92
Appendix V. Pair-wise meta-analysis
App V. Table 1. Summary estimates for intraocular pressure at 3 months
derived from pair-wise meta-analysis for drugs in studies published by
1991
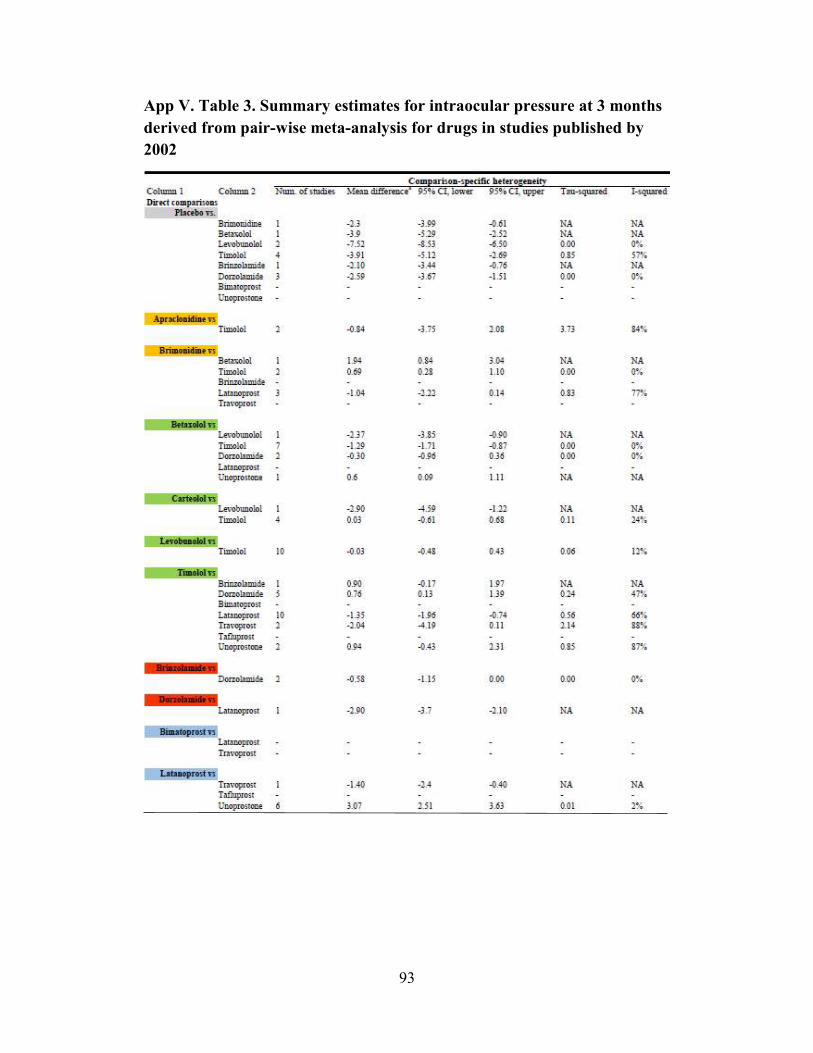
93
App V. Table 3. Summary estimates for intraocular pressure at 3 months
derived from pair-wise meta-analysis for drugs in studies published by
2002
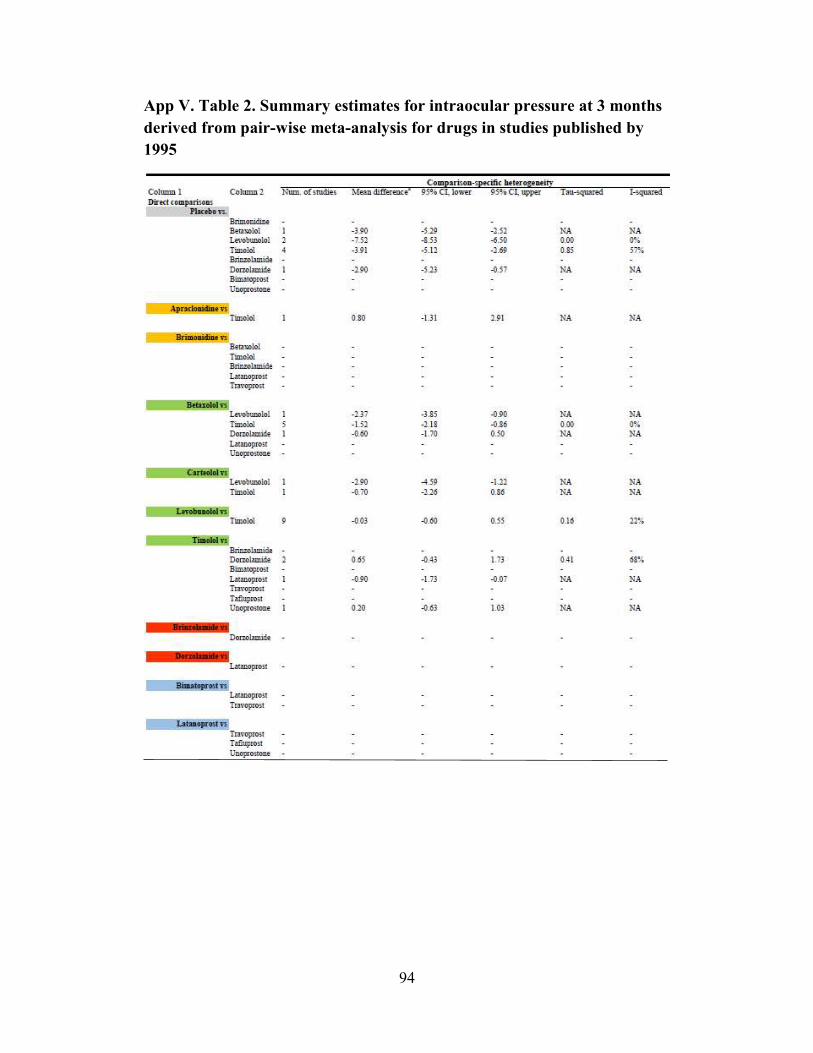
94
App V. Table 2. Summary estimates for intraocular pressure at 3 months
derived from pair-wise meta-analysis for drugs in studies published by
1995

95
App V. Table 4. Summary estimates for intraocular pressure at 3 months
derived from pair-wise meta-analysis for drugs in studies published by
2004

96
App V. Table 5. Summary estimates for intraocular pressure at 3 months
derived from pair-wise meta-analysis for drugs in studies published by
2009
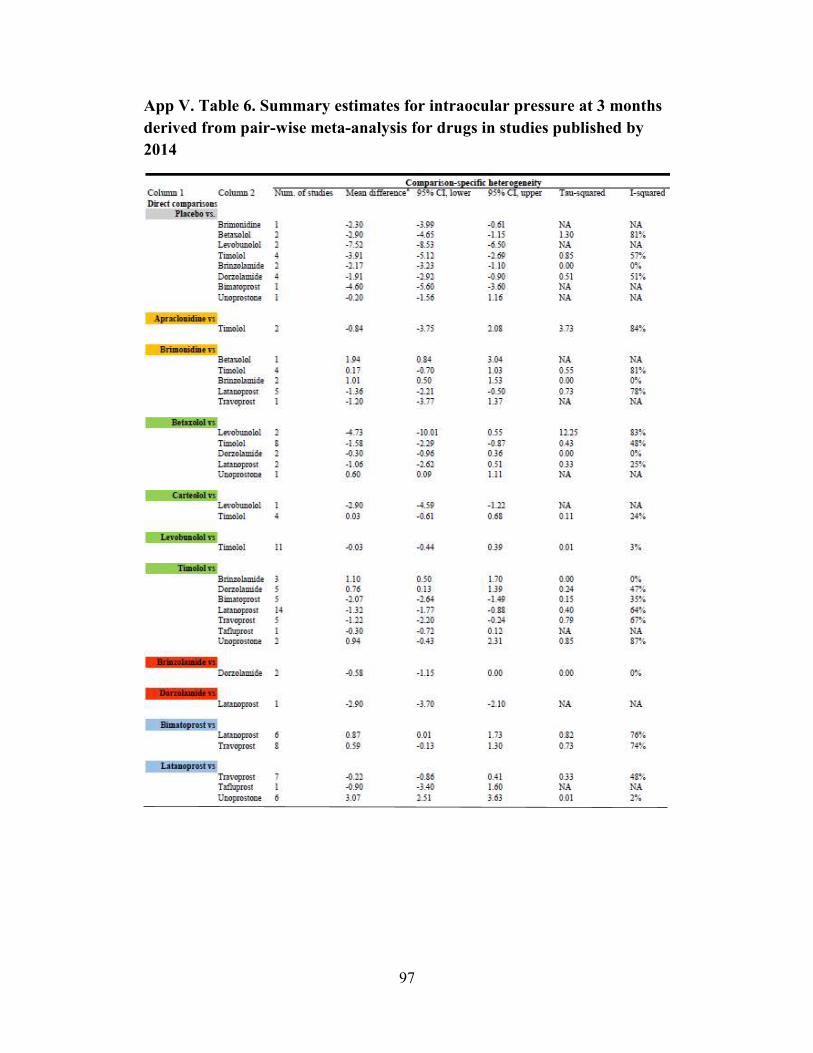
97
App V. Table 6. Summary estimates for intraocular pressure at 3 months
derived from pair-wise meta-analysis for drugs in studies published by
2014
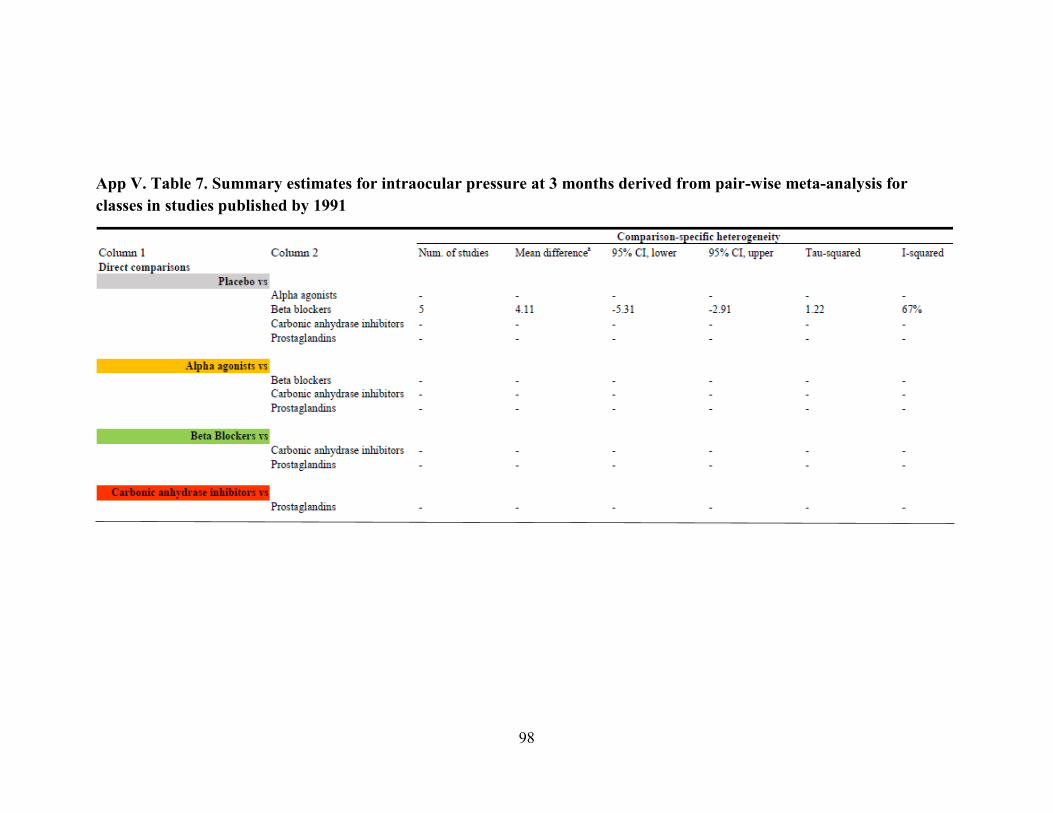
98
App V. Table 7. Summary estimates for intraocular pressure at 3 months derived from pair-wise meta-analysis for
classes in studies published by 1991

99
App V. Table 8. Summary estimates for intraocular pressure at 3 months derived from pair-wise meta-analysis for
classes in studies published by 1995

100
App V. Table 8. Summary estimates for intraocular pressure at 3 months derived from pair-wise meta-analysis for
classes in studies published by 2002
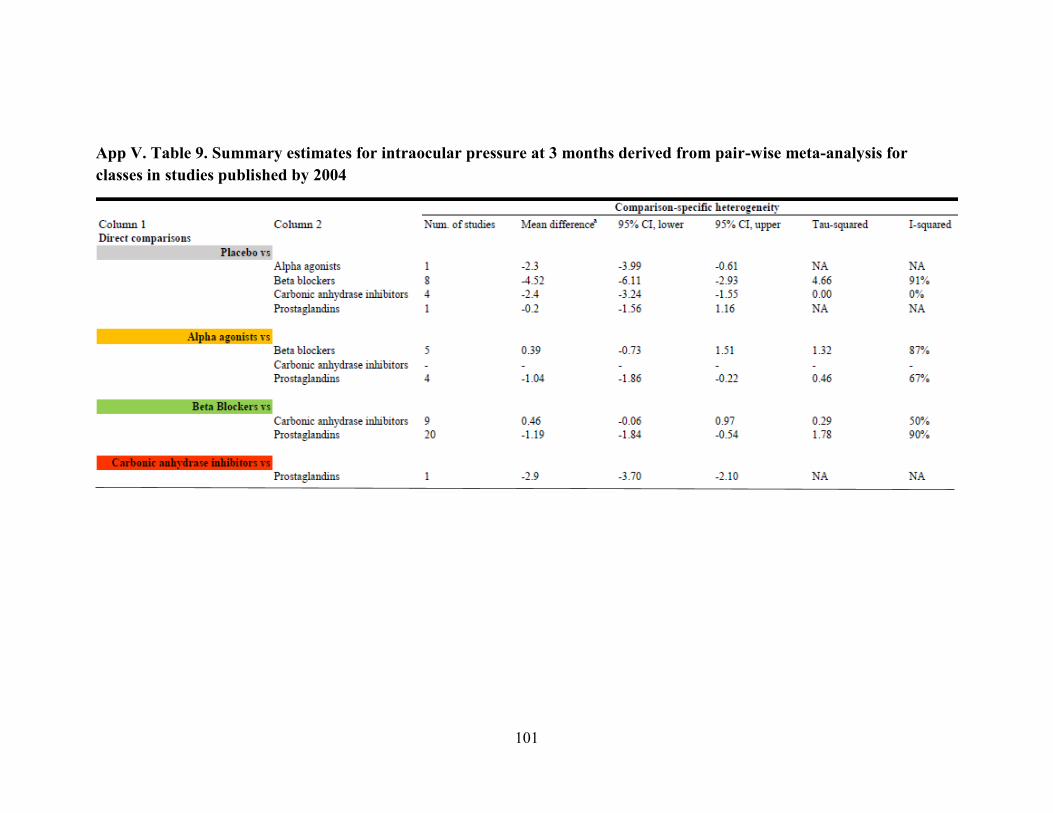
101
App V. Table 9. Summary estimates for intraocular pressure at 3 months derived from pair-wise meta-analysis for
classes in studies published by 2004

102
App V. Table 10. Summary estimates for intraocular pressure at 3 months derived from pair-wise meta-analysis for
classes in studies published by 2009

103
App V. Table 11. Summary estimates for intraocular pressure at 3 months derived from pair-wise meta-analysis for
classes in studies published by 2014
a Mean difference is calculated using the intraocular pressure of the treatment in column 2 - column 1
Mean difference > 0 favors the drug in column 1
Mean difference < 0 favors the drug in column 2
Color coding:
Grey Placebo/vehicle/no treatment
Orange Alpha-2 adrenergic agonist
Green Beta-blocker
Red Carbonic anhydrase inhibitor
Blue Prostaglandin analog
104
Curriculum Vitae
Benjamin Rouse 7926 Starburst Drive, Pikesville, MD 21208
(410) 653-3412
EDUCATION
Master of Health Sciences (MHS) in Epidemiology Expected May 2015
Johns Hopkins Bloomberg School of Public Health, Baltimore, MD
Concentration: Clinical Trials and Evidence Synthesis
G.P.A.: 3.93/4.00
University of Illinois at Chicago College of Pharmacy, Chicago, IL
Graduate-level coursework in Medicinal Chemistry and Pharmacognosy
G.P.A.: 4.00/4.00
Bachelor of Liberal Arts & Science May 2014
Harriet L. Wilkes Honors College at Florida Atlantic University, Jupiter, FL
Concentration: Chemistry
Summa cum Laude
G.P.A.: 3.917/4.000
Thesis: Presumptive and Confirmatory Tests for Illicit Drug Analogs
June 2007
Shoshana S. Cardin Jewish Community High School, Baltimore, MD G.P.A.: 3.83/4.00
RESEARCH AND WORK EXPERIENCE
Research Assistant - Johns Hopkins University February 2014-present
Contribute to systematic reviews and methodology research for the Cochrane
Eyes and Vision Group
Direct screening of literature to identify studies relevant for reviews
Extraction of relevant methodological details and results of studies for
reviews
Teaching Assistant - University of Illinois at Chicago August 2011-May 2013
Hold office hours to answer students’ questions about the course material
Proctor and grade course exams

105
Research Assistant - University of Illinois at Chicago August 2011-
December 2012
Utilize various chromatography techniques for the isolation and purification
of natural products from plants and bacteria
Structural elucidation of natural products with mass spectrometry and nuclear
magnetic resonance
BioTools Intern - Jupiter, FL August 2010-December 2010
Review literature on using infrared spectroscopy for analyzing three
dimensional structure of proteins
Work with the PROTA Fourier Transform-Infrared Protein Analyzer for
determining secondary structure of proteins
PUBLICATIONS AND PRESENTATIONS
Journal Articles
Rouse, Benjamin; Schneider, Rebecca; Smith, Eugene. Presumptive and
Confirmatory Tests using Analogs of Illicit Drugs: An Undergraduate
Instrumental Methods Exercise. Journal of Chemical Education. 2014; 19:70-
72.
Poster Presentations
University of Illinois at Chicago - March 9, 2012
Chicago, Illinois
College of Pharmacy Research Day
Bioassay-Guided Fractionation and Dereplication of Anti-Cancer Compound
from Nostoc sp. (UIC 10366)
Rouse, B, Kang, HS, Zinkus, J, Swanson, S, Orjala, J
Harriet L. Wilkes Honors College - April 15, 2011
Jupiter, FL
9th Annual Symposium for Research and Creative Projects
Presumptive and Confirmatory Tests for Illicit Drug Analogs
Rouse, B, Smith, E
University of Maryland at Baltimore County - October 30, 2010
Baltimore, Maryland
13th Annual Undergraduate Research Symposium in the Chemical and
Biological Sciences
Qualitative Analysis of Amphetamine and GHB Analogs
Rouse, B, Smith, E

106
PROFESSIONAL DEVELOPMENT
Computer skills: Microsoft Office Suite (including Word, Excel, and PowerPoint)
Statistical software: Stata, SAS, and R Packages