Culture, Assets and La Dolce Villa: Portfolio Choice of ... · Culture, Assets and La Dolce Villa:...
58
Literature Model Methodology & Data Results Conclusion Culture and Portfolios: Trust, Precautionary Savings and La Dolce Villa – Work in Progress – Johannes Fleck 1 and Adrian Monninger 2 1 European University Institute 2 Deutsche Bundesbank 20 th June 2020 Disclaimer: This presentation should not be reported as representing the views of the Deutsche Bundesbank nor the European System of Central Banks. The views expressed are those of the authors alone. J. Fleck & A. Monninger Culture and Portfolios 20 th June 2020 1 / 30
Transcript of Culture, Assets and La Dolce Villa: Portfolio Choice of ... · Culture, Assets and La Dolce Villa:...

Literature Model Methodology & Data Results Conclusion
Culture and Portfolios:Trust, Precautionary Savings and La Dolce Villa
– Work in Progress –
Johannes Fleck1 and Adrian Monninger2
1European University Institute
2Deutsche Bundesbank
20th June 2020
Disclaimer: This presentation should not be reported as representing the views of the Deutsche Bundesbank nor the EuropeanSystem of Central Banks. The views expressed are those of the authors alone.
J. Fleck & A. Monninger Culture and Portfolios 20th June 2020 1 / 30

Literature Model Methodology & Data Results Conclusion
Stylized facts - Liquid vs Illiquid Net Wealth
Liquid vs Illiquid
J. Fleck & A. Monninger Culture and Portfolios 20th June 2020 2 / 30

Literature Model Methodology & Data Results Conclusion
Stylized facts - Home Ownership Status
Way of acquiring property
J. Fleck & A. Monninger Culture and Portfolios 20th June 2020 3 / 30
Literature Model Methodology & Data Results Conclusion
This paper
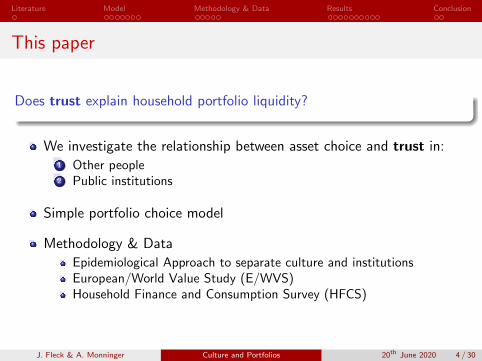
Does trust explain household portfolio liquidity?
We investigate the relationship between asset choice and trust in:1 Other people2 Public institutions
Simple portfolio choice model
Methodology & Data
Epidemiological Approach to separate culture and institutionsEuropean/World Value Study (E/WVS)Household Finance and Consumption Survey (HFCS)
J. Fleck & A. Monninger Culture and Portfolios 20th June 2020 4 / 30

Literature Model Methodology & Data Results Conclusion
Empirical results
Higher trust in public institutions...1 decreases net liquid wealth
Higher trust in other people...1 increases net liquid wealth2 increases the probability to be a home owner with a mortgage3 increases the loan-to-value ratio
J. Fleck & A. Monninger Culture and Portfolios 20th June 2020 5 / 30

Literature Model Methodology & Data Results Conclusion
Outline
1 Literature
2 Model
3 Methodology & Data
4 Results
5 Conclusion
J. Fleck & A. Monninger Culture and Portfolios 20th June 2020 6 / 30

Literature Model Methodology & Data Results Conclusion
Related papers: Household portfolio choice
1 Why are EMU hh portfolios so different?
Country specific institutions and economic environmentsChristelis, Georgarakos, and Haliassos (2013), Christelis, Ehrmann, andGeorgarakos (2017), Blanchflower and Clark (2019), Pham-Dao (2016)
Country and cohort specific exogenous eventsAmpudia and Ehrmann (2017), Malmendier and Steiny (2017)
2 Cultural norms and behavioral biases can explain differences in
Savings rates Fuchs-Schundeln et al (2019), Guin (2017), ...
Home ownership rates Huber and Schmidt (2018), ...
Asset market participation Guiso and Jappelli (2005), Guiso et al(2008), Fuchs-Schundeln and Haliassos (2020), Bhamra and Uppal (2019)
J. Fleck & A. Monninger Culture and Portfolios 20th June 2020 7 / 30
Literature Model Methodology & Data Results Conclusion
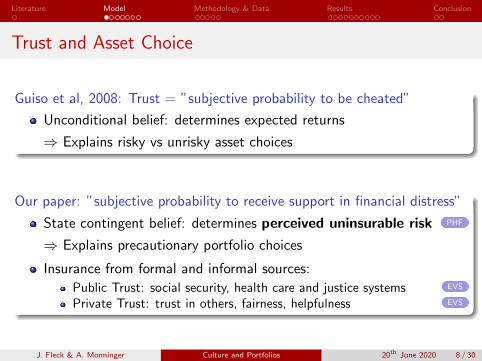
Trust and Asset Choice
Guiso et al, 2008: Trust = ”subjective probability to be cheated”
Unconditional belief: determines expected returns
⇒ Explains risky vs unrisky asset choices
Our paper: ”subjective probability to receive support in financial distress”
State contingent belief: determines perceived uninsurable risk PHF
⇒ Explains precautionary portfolio choices
Insurance from formal and informal sources:
Public Trust: social security, health care and justice systems EVS
Private Trust: trust in others, fairness, helpfulness EVS
J. Fleck & A. Monninger Culture and Portfolios 20th June 2020 8 / 30

Literature Model Methodology & Data Results Conclusion
Model - Trust in public institutions
3 period model with endowments: y1 > yG2 > yB2 = y3
Expected period 2 endowment: y j2 = pGyG2 + pBωyB2
Subjective insurance depends on trust: ωHT > ωLT ≥ 1
Assets: liquid a1, a2; illiquid A
maxa1,A,a2LTj=HT
E3∑
t=1
log(ct) (1)
s.t.
c1 = y1 − A− a1 (2)
c2 = y j2(ωj) + a1(1 + ra)− a2 (3)
c3 = y3 + A(1 + rA) + a2(1 + ra) (4)
J. Fleck & A. Monninger Culture and Portfolios 20th June 2020 9 / 30

Literature Model Methodology & Data Results Conclusion
Model - Trust in public institutions
Figure 1: Optimal liquid asset choice in the stochastic environmentJ. Fleck & A. Monninger Culture and Portfolios 20th June 2020 10 / 30

Literature Model Methodology & Data Results Conclusion
Model - Trust in other people
Same environment, but no public insurance
Continuum of agents form private risk sharing network
Expected period 2 endowment: y j2 = pG (yG2 − (ω − 1)Θ) + pB ωyB2
Risk sharing scheme reduces expected variance of y j2
J. Fleck & A. Monninger Culture and Portfolios 20th June 2020 11 / 30

Literature Model Methodology & Data Results Conclusion
Model - Trust in other people
3 asset case
J. Fleck & A. Monninger Culture and Portfolios 20th June 2020 12 / 30

Literature Model Methodology & Data Results Conclusion
Hypotheses: Trust and Precautionary Savings
1 Trust in public and private institutions and liquid wealthLiquid wealth reflects precautionary motive
H1a: Higher trust in public institutions decreases precautionary savings
Trust in others leads to reciprocity
Private insurance networks need signal or contributions
H1b: Higher trust in other individuals increases precautionary savings
J. Fleck & A. Monninger Culture and Portfolios 20th June 2020 13 / 30

Literature Model Methodology & Data Results Conclusion
Hypotheses: Trust and Tenure Choice
2 Trust in public and private institutions and home ownership ratesDecision between renting or owning with a mortgage
Renting: lower financial risk
Owning: higher financial risk (illiquid wealth, leverage)
H2a: Higher public or private trust increase the probability to be a homeowner with mortgage (as compared to being a renter)
H2b: Higher trust increases the portfolio’s loan-to-value ratio
J. Fleck & A. Monninger Culture and Portfolios 20th June 2020 14 / 30

Literature Model Methodology & Data Results Conclusion
Empirical Strategy (1/2)
Suppose household (h) portfolio choices sh are a function of
sh = fs(Xh, νh,Ωch) (5)
Xh: h’s characteristics
νh: h’s cultural norms
Ωch: institutions in h’s country of residence
Due to relationship between cultural norms and institutions ...
Ωch = Ωc
h(νh) (6)
... estimating (5) using OLS violates exogeneity assumption as
E[εh|νh] 6= 0 (7)
J. Fleck & A. Monninger Culture and Portfolios 20th June 2020 15 / 30

Literature Model Methodology & Data Results Conclusion
Empirical Strategy (2/2)
We follow the Epidemiological Approach of Fernandez (2011)
Idea: study behavior of (second generation) immigrants
Assumption for this group:
Parental cultural value transmissionCannot influence institutions
And hence:E[εh|νh] = 0 (8)
⇒ Institutions and culture are exogenous
J. Fleck & A. Monninger Culture and Portfolios 20th June 2020 16 / 30

Literature Model Methodology & Data Results Conclusion
Our data
European/World Value Study (E/WVS)1 Intensity of cultural norms (public and private trust)
⇒ Construct country-specific indicators of norm intensities
Household Finance and Consumption Survey (HFCS)1 Portfolio Items and Demographics2 Year of Immigration and Country of Birth Our data
⇒ We can identify hh Reference Person who immigrated (as child)
J. Fleck & A. Monninger Culture and Portfolios 20th June 2020 17 / 30

Literature Model Methodology & Data Results Conclusion
HFCS: Destination Countries
Figure 2: HFCS countries: dark blue is our sample
J. Fleck & A. Monninger Culture and Portfolios 20th June 2020 18 / 30

Literature Model Methodology & Data Results Conclusion
EVS/WVS: Country of Origin
Figure 3: Private Trust: darker color indicates more trust
Public
J. Fleck & A. Monninger Culture and Portfolios 20th June 2020 19 / 30

Literature Model Methodology & Data Results Conclusion
Results: H1: Trust on Liquid Wealth (OLS)
H1a: Higher trust in public institutions decreases precautionary savingsH1b: Higher trust in other individuals increases precautionary savings
1 Trust and liquid wealth: OLS
log(Yh) = α + βlog(Xh) + γ′Zh + δ′Wi + εh (9)
Yh: log liquid wealth
Xh: value indicator (private, public trust)
Zh: hh demographics
Wi : country fixed effects
J. Fleck & A. Monninger Culture and Portfolios 20th June 2020 20 / 30

Literature Model Methodology & Data Results Conclusion
Results: H1: Trust on Liquid Wealth (OLS)
Table 1: H1: Trust on Liquid Wealth (OLS) Full Table
(1)all
(2)<18
(3)all
(4)<18
(5)all
(6)<18
(7)all
(8)<18
Public TrustEurope
-0.59 -3.43***(0.60) (1.01)
World-0.81* -1.81***(0.41) (0.65)
Private TrustEurope
2.44*** 2.55**(0.63) (1.16)
World2.20*** 2.47***(0.52) (0.83)
N 1,308 454 2,111 807 1,308 454 2,111 807ControlsFixed Effects
Columns: 1-4 Public and 5-8 Private Trust. The first two use only migrants from Europe while the latter include non-Europeanmigrants. For each specification (all) uses the full sample while (<18) uses only migrants who arrived before turning 18.Significance at * p<.1, ** p<.05, *** p<.01
J. Fleck & A. Monninger Culture and Portfolios 20th June 2020 21 / 30

Literature Model Methodology & Data Results Conclusion
Results: H1: Trust on Liquid Wealth (OLS)
H1a: Higher trust in public institutions decreases precautionary savings
1 If public trust indicator 1% higher, liquid wealthdecreases by 0.8-3.4%.
⇒ Do not reject H1a
H1b: Higher trust in other individuals increases precautionary savings
2 If private trust indicator 1% higher, liquid wealthincreases by 2.2-2.6%.
⇒ Do not reject H1b
J. Fleck & A. Monninger Culture and Portfolios 20th June 2020 22 / 30
Literature Model Methodology & Data Results Conclusion
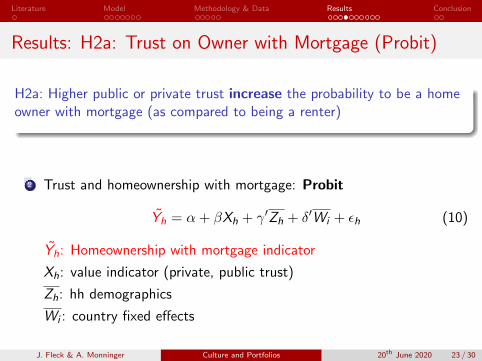
Results: H2a: Trust on Owner with Mortgage (Probit)
H2a: Higher public or private trust increase the probability to be a homeowner with mortgage (as compared to being a renter)
2 Trust and homeownership with mortgage: Probit
Yh = α + βXh + γ′Zh + δ′Wi + εh (10)
Yh: Homeownership with mortgage indicator
Xh: value indicator (private, public trust)
Zh: hh demographics
Wi : country fixed effects
J. Fleck & A. Monninger Culture and Portfolios 20th June 2020 23 / 30

Literature Model Methodology & Data Results Conclusion
Results: H2a: Trust on Owner with Mortgage (Probit)
Table 2: H2a: Trust on Home Owner with Mortgage (Probit) Full Table
(1)all
(2)<18
(3)all
(4)<18
(5)all
(6)<18
(7)all
(8)<18
Public TrustEurope
0.54*** 0.22(0.21) (0.40)
World-0.12 0.05(0.15) (0.29)
Private TrustEurope
1.35*** 0.90(0.25) (0.57)
World1.30*** 1.22***(0.20) (0.42)
N 1,036 338 1,646 562 1,036 338 1,646 562ControlsFixed Effects
Columns: 1-4 Public and 5-8 Private Trust. The first two use only migrants from Europe while the latter include non-Europeanmigrants. For each specification (all) uses the full sample while (<18) uses only migrants who arrived before turning 18.Estimates are reported as margins at means; Significance at * p<.1, ** p<.05, *** p<.01
J. Fleck & A. Monninger Culture and Portfolios 20th June 2020 24 / 30

Literature Model Methodology & Data Results Conclusion
Results: H2a: Trust on Owner with Mortgage (Probit)
H2a: Higher public or private trust increase the probability to be a homeowner with mortgage (as compared to being a renter)
Positive relationship between public trust and home ownership onlyin 1 of 4 specifications.
If the private trust indicator increases by 1 standard deviation, theprobability to be a home owner with a mortgage increases by 9.1 to10.4 %-points.
⇒ Do not reject H2a
J. Fleck & A. Monninger Culture and Portfolios 20th June 2020 25 / 30

Literature Model Methodology & Data Results Conclusion
Results: H2b: Trust on Loan-to-Value Ratio (Tobit)
H2b: Higher trust increases the portfolio’s loan-to-value ratio
3 Trust and Loan-to-Value Ratio: Tobit
Yh = α + βXh + γ′Zh + δ′Wi + εh (11)
Yh: Loan-to-Value Ratio(Mortgage
HMR
)Xh: value indicator (private, public trust)
Zh: hh demographics
Wi : country fixed effects
J. Fleck & A. Monninger Culture and Portfolios 20th June 2020 26 / 30

Literature Model Methodology & Data Results Conclusion
Results: H2b: Trust on Loan-to-Value Ratio (Tobit)
Table 3: H2b: Trust on Leverage Ratio (Tobit) Full Table
(1)all
(2)<18
(3)all
(4)<18
(5)all
(6)<18
(7)all
(8)<18
Public TrustEurope
0.46*** 0.25(0.13) (0.21)
World-0.05 0.13(0.10) (0.16)
Private TrustEurope
0.82*** 0.46(0.15) (0.30)
World0.71*** 0.56**(0.13) (0.23)
N 1,036 338 1,646 562 1,036 338 1,646 562ControlsFixed Effects
Columns: 1-4 Public and 5-8 Private Trust. The first two use only migrants from Europe while the latter include non-Europeanmigrants. For each specification (all) uses the full sample while (<18) uses only migrants who arrived before turning 18.Estimates are reported as margins at means; Significance at * p<.1, ** p<.05, *** p<.01
J. Fleck & A. Monninger Culture and Portfolios 20th June 2020 27 / 30

Literature Model Methodology & Data Results Conclusion
Results: H2b: Trust on Loan-to-Value Ratio (Tobit)
H2b: Higher trust increases the portfolio’s loan-to-value ratio
Positive relationship between public trust and loan-to-value ratioonly in 1 of 4 specifications.
If private trust indicator increases by 1 standard deviation, theloan-to-value ratio increases by 0.04-0.06.
⇒ Do not reject H2b
J. Fleck & A. Monninger Culture and Portfolios 20th June 2020 28 / 30

Literature Model Methodology & Data Results Conclusion
Robustness
Unobservable Heterogeneity in Familiarity H1-H2b
Noise in Survey Trust Measures H1-H2b
Robustness of the Private Trust Measure H1-H2b
Precautionary Motive to Save H1
Trust and Price Expectations H2b
Individual-Specific Uninsurable Risk H1-H2b
J. Fleck & A. Monninger Culture and Portfolios 20th June 2020 29 / 30

Literature Model Methodology & Data Results Conclusion
Conclusion
Does trust explain household portfolio liquidity?
Trust: ”subjective probability to receive support in financial distress”
We build a model studying the effects of trust on liquid assets choice
Using the Epidemiological Approach we find that
1 Precautionary savings are...
lower if public trust is higherhigher if private trust is higher
2 Home Ownership with mortgage
probability increases with (private) trustleverage increases with (private) trust
J. Fleck & A. Monninger Culture and Portfolios 20th June 2020 30 / 30

THANKS for your attention
We are grateful for comments and suggestions

HFCS: Liquid vs Illiquid Wealth (1/2)
back
J. Fleck & A. Monninger Culture and Portfolios 20th June 2020 0 / 1

HFCS: Liquid vs Illiquid Wealth (2/2)
back
J. Fleck & A. Monninger Culture and Portfolios 20th June 2020 0 / 1

HFCS: Way of acquiring property
back
J. Fleck & A. Monninger Culture and Portfolios 20th June 2020 0 / 1

PHF: Self-reported private trust by financial assistance
back
J. Fleck & A. Monninger Culture and Portfolios 20th June 2020 0 / 1

E/WVS: Private Trust (1/2)
back
J. Fleck & A. Monninger Culture and Portfolios 20th June 2020 0 / 1

E/WVS: Private Trust (2/2)
back
J. Fleck & A. Monninger Culture and Portfolios 20th June 2020 0 / 1

E/WVS: Public Trust
back
J. Fleck & A. Monninger Culture and Portfolios 20th June 2020 0 / 1

WVS: Public Trust
Figure 4: Public Trust: darker color signals more trust
back
J. Fleck & A. Monninger Culture and Portfolios 20th June 2020 0 / 1

Model - Trust in other people - 3 Assets
back
J. Fleck & A. Monninger Culture and Portfolios 20th June 2020 1 / 1

Our confidential data
For the E. Approach, we need answers to question RA0400
”In which country was (were) X (you) born?”It is coded in three country groups in the public HFCS files
We obtained the unrestricted/collected variable for France, Austria,Germany and Ireland
back
J. Fleck & A. Monninger Culture and Portfolios 20th June 2020 1 / 1

H1: Trust on Liquid Wealth (OLS): Controls
(1)all
(2)<18
(3)all
(4)<18
(5)all
(6)<18
(7)all
(8)<18
Germany -1.02** -1.35** -0.92*** -0.94* -1.00** -1.37** -0.89*** -0.94*(0.41) (0.64) (0.32) (0.56) (0.40) (0.65) (0.32) (0.55)
France 0.93** 1.32** 0.72*** 1.17** 0.90** 1.27** 0.81*** 1.24**(0.37) (0.58) (0.28) (0.49) (0.37) (0.58) (0.28) (0.48)
Ireland -0.96*** -0.50 -0.86*** -0.68 -1.37*** -1.36** -1.09*** -1.10**(0.35) (0.58) (0.28) (0.51) (0.36) (0.65) (0.29) (0.54)
Gross Income (ln) 0.87*** 0.93*** 0.76*** 0.83*** 0.85*** 0.96*** 0.75*** 0.87***(0.12) (0.20) (0.08) (0.14) (0.12) (0.20) (0.08) (0.14)
Illiquid Wealth (ln) 0.16*** 0.15*** 0.16*** 0.13*** 0.15*** 0.15*** 0.15*** 0.13***(0.02) (0.03) (0.01) (0.02) (0.02) (0.03) (0.01) (0.02)
Male 0.08 0.38 0.07 0.28 0.12 0.38 0.10 0.27(0.19) (0.31) (0.14) (0.21) (0.19) (0.32) (0.14) (0.21)
Age -0.23*** -0.31* -0.25*** -0.25** -0.25*** -0.33** -0.26*** -0.27**(0.07) (0.16) (0.05) (0.11) (0.07) (0.16) (0.05) (0.11)
Ageˆ2 0.00*** 0.00* 0.00*** 0.00** 0.00*** 0.00** 0.00*** 0.00**(0.00) (0.00) (0.00) (0.00) (0.00) (0.00) (0.00) (0.00)
Years in country -0.05** 0.06 -0.05*** 0.01 -0.06** 0.01 -0.05*** -0.02(0.02) (0.07) (0.02) (0.05) (0.02) (0.08) (0.02) (0.05)
Years in country ˆ2 0.00 0.00 0.00*** 0.00 0.00** 0.00 0.00*** 0.00(0.00) (0.00) (0.00) (0.00) (0.00) (0.00) (0.00) (0.00)
Married -0.15 -0.22 -0.04 -0.02 -0.08 -0.24 -0.05 -0.05(0.21) (0.34) (0.15) (0.23) (0.21) (0.34) (0.15) (0.23)
# Children -0.19 -0.27 -0.13 -0.13 -0.20 -0.38 -0.11 -0.13(0.16) (0.24) (0.10) (0.14) (0.16) (0.24) (0.10) (0.14)
Secondary Education -0.73*** -0.66* -0.83*** -0.86*** -0.63*** -0.51 -0.75*** -0.72***(0.19) (0.34) (0.14) (0.23) (0.19) (0.36) (0.14) (0.23)
Employed 0.60*** 0.20 0.42*** -0.02 0.65*** 0.30 0.44*** 0.01(0.20) (0.33) (0.14) (0.22) (0.20) (0.33) (0.14) (0.22)
Risk Taking 0.54*** 0.37 0.59*** 0.31* 0.52*** 0.32 0.57*** 0.30*(0.16) (0.26) (0.12) (0.18) (0.15) (0.26) (0.12) (0.18)
Constant 1.62 -0.55 3.07** 1.89 4.97** 5.17 5.84*** 5.36**(1.91) (3.54) (1.38) (2.44) (1.93) (3.57) (1.43) (2.48)
N 1,308 454 2,111 807 1,308 454 2,111 807
* p<.1, ** p<.05, *** p<.01; all: all immigrants; <18: max. arrival age 17; Europe vs. World: European vs. non-European country of origin
backJ. Fleck & A. Monninger Culture and Portfolios 20th June 2020 1 / 1

H2a: Trust on Owner with Mortgage (Probit): Controls
(1)all
(2)<18
(3)all
(4)<18
(5)all
(6)<18
(7)all
(8)<18
Germany 0.12*** 0.19** 0.11*** 0.19*** 0.15*** 0.22*** 0.10*** 0.21***(0.03) (0.07) (0.03) (0.07) (0.04) (0.08) (0.04) (0.08)
France 0.18*** 0.29*** 0.14*** 0.25*** 0.22*** 0.33*** 0.18*** 0.29***(0.04) (0.07) (0.03) (0.05) (0.05) (0.08) (0.03) (0.06)
Ireland 0.37*** 0.55*** 0.30*** 0.51*** 0.30*** 0.48*** 0.23*** 0.41***(0.04) (0.07) (0.03) (0.07) (0.04) (0.09) (0.04) (0.08)
Gross Income (ln) 0.18*** 0.21*** 0.19*** 0.20*** 0.17*** 0.20*** 0.18*** 0.20***(0.03) (0.05) (0.02) (0.03) (0.03) (0.05) (0.02) (0.03)
Male -0.03 0.06 0.00 0.06 -0.02 0.07 0.01 0.07(0.03) (0.07) (0.03) (0.05) (0.04) (0.07) (0.03) (0.05)
Age 0.08*** 0.10*** 0.08*** 0.12*** 0.07*** 0.10*** 0.07*** 0.12***(0.01) (0.04) (0.01) (0.03) (0.01) (0.04) (0.01) (0.03)
Ageˆ2 -0.00*** -0.00*** -0.00*** -0.00*** -0.00*** -0.00*** -0.00*** -0.00***(0.00) (0.00) (0.00) (0.00) (0.00) (0.00) (0.00) (0.00)
Years in country 0.02*** 0.01 0.02*** 0.00 0.02*** 0.00 0.02*** 0.00(0.00) (0.02) (0.00) (0.01) (0.00) (0.02) (0.00) (0.01)
Years in country ˆ2 -0.00*** 0.00 -0.00*** 0.00 -0.00*** 0.00 -0.00*** 0.00(0.00) (0.00) (0.00) (0.00) (0.00) (0.00) (0.00) (0.00)
Married 0.14*** 0.13* 0.11*** 0.14** 0.16*** 0.14* 0.12*** 0.14***(0.04) (0.07) (0.03) (0.05) (0.04) (0.07) (0.03) (0.05)
# Children 0.12*** 0.13** 0.03* 0.03 0.13*** 0.14** 0.04** 0.04(0.03) (0.06) (0.02) (0.03) (0.03) (0.06) (0.02) (0.03)
Secondary Education -0.14*** -0.13* -0.08*** -0.04 -0.11*** -0.11 -0.06** -0.02(0.04) (0.07) (0.03) (0.05) (0.04) (0.07) (0.03) (0.05)
Employed -0.04 0.09 -0.04 0.06 -0.04 0.08 -0.03 0.06(0.04) (0.07) (0.03) (0.05) (0.04) (0.07) (0.03) (0.05)
Risk Taking -0.03 -0.06 -0.03 -0.04 -0.04 -0.06 -0.04 -0.04(0.03) (0.06) (0.02) (0.04) (0.03) (0.06) (0.02) (0.04)
N 1,036 338 1,646 562 1,036 338 1,646 562
Estimates are reported as margins at means; Significance at * p<.1, ** p<.05, *** p<.01
back
J. Fleck & A. Monninger Culture and Portfolios 20th June 2020 1 / 1

H2b: Trust on Leverage Ratio (Tobit): Controls
(1)all
(2)<18
(3)all
(4)<18
(5)all
(6)<18
(7)all
(8)<18
Germany 0.08* 0.16** 0.08** 0.16*** 0.08** 0.16** 0.08** 0.15**(0.04) (0.07) (0.04) (0.06) (0.04) (0.07) (0.04) (0.06)
France 0.09** 0.15** 0.09*** 0.17*** 0.10** 0.15** 0.11*** 0.18***(0.04) (0.06) (0.03) (0.05) (0.04) (0.06) (0.03) (0.05)
Ireland 0.26*** 0.39*** 0.23*** 0.38*** 0.21*** 0.34*** 0.19*** 0.32***(0.04) (0.06) (0.03) (0.06) (0.04) (0.07) (0.03) (0.06)
Gross Income (ln) 0.08*** 0.09*** 0.08*** 0.08*** 0.07*** 0.08*** 0.07*** 0.07***(0.01) (0.02) (0.01) (0.02) (0.01) (0.02) (0.01) (0.02)
Male 0.00 0.05 0.01 0.05* 0.00 0.06* 0.01 0.05*(0.02) (0.04) (0.02) (0.03) (0.02) (0.04) (0.02) (0.03)
Age 0.05*** 0.05** 0.05*** 0.06*** 0.04*** 0.05*** 0.05*** 0.06***(0.01) (0.02) (0.01) (0.01) (0.01) (0.02) (0.01) (0.01)
Ageˆ2 -0.00*** -0.00*** -0.00*** -0.00*** -0.00*** -0.00*** -0.00*** -0.00***(0.00) (0.00) (0.00) (0.00) (0.00) (0.00) (0.00) (0.00)
Years in country 0.01*** 0.01 0.02*** 0.01* 0.01*** 0.01 0.01*** 0.01(0.00) (0.01) (0.00) (0.01) (0.00) (0.01) (0.00) (0.01)
Years in country ˆ2 -0.00*** 0.00 -0.00*** 0.00 -0.00*** 0.00 -0.00*** 0.00(0.00) (0.00) (0.00) (0.00) (0.00) (0.00) (0.00) (0.00)
Married 0.06** 0.00 0.05** 0.02 0.07*** 0.01 0.05*** 0.02(0.02) (0.04) (0.02) (0.03) (0.02) (0.04) (0.02) (0.03)
# Children 0.06*** 0.06** 0.02 0.02 0.06*** 0.06** 0.02* 0.02(0.02) (0.03) (0.01) (0.02) (0.02) (0.03) (0.01) (0.02)
Secondary Education -0.09*** -0.10** -0.06*** -0.02 -0.07*** -0.08* -0.05*** -0.02(0.02) (0.04) (0.02) (0.03) (0.02) (0.04) (0.02) (0.03)
Employed -0.01 0.06 -0.02 0.04 -0.01 0.06 -0.01 0.04(0.02) (0.04) (0.02) (0.03) (0.02) (0.04) (0.02) (0.03)
Risk Taking 0.00 0.01 0.00 0.03 0.01 0.02 0.00 0.03(0.02) (0.03) (0.01) (0.02) (0.02) (0.03) (0.01) (0.02)
N 1,036 338 1,646 562 1,036 338 1,646 562
Estimates are reported as margins at means; Significance at * p<.1, ** p<.05, *** p<.01
back
J. Fleck & A. Monninger Culture and Portfolios 20th June 2020 1 / 1

H1: Trust on Liquid Wealth (OLS): Native Spouse
(1)all
(2)<18
(3)all
(4)<18
(5)all
(6)<18
(7)all
(8)<18
Public TrustEurope
-0.85 -3.47***(0.61) (1.00)
World-0.81** -1.76***(0.41) (0.65)
Private TrustEurope
2.07*** 2.07*(0.65) (1.19)
World1.92*** 2.19***(0.53) (0.84)
Spouse 0.74*** 0.85** 0.63*** 0.67*** 0.51** 0.68* 0.52*** 0.59**(0.22) (0.37) (0.16) (0.25) (0.23) (0.38) (0.16) (0.25)
N 1,308 454 2,111 807 1,308 454 2,111 807back
J. Fleck & A. Monninger Culture and Portfolios 20th June 2020 1 / 1

H2a: Trust on Owner with Mortgage (Probit): NativeSpouse
(1)all
(2)<18
(3)all
(4)<18
(5)all
(6)<18
(7)all
(8)<18
Public TrustEurope
0.42** 0.21(0.21) (0.40)
World-0.11 0.07(0.15) (0.29)
Private TrustEurope
1.15*** 0.87(0.26) (0.58)
World1.11*** 1.14***(0.20) (0.42)
Spouse 0.15*** 0.05 0.17*** 0.09 0.11*** 0.02 0.14*** 0.06(0.04) (0.08) (0.03) (0.06) (0.04) (0.08) (0.03) (0.06)
N 1,036 338 1,646 562 1,036 338 1,646 562back
J. Fleck & A. Monninger Culture and Portfolios 20th June 2020 1 / 1

H2b: Trust on Leverage Ratio (Tobit): Native Spouse
(1)all
(2)<18
(3)all
(4)<18
(5)all
(6)<18
(7)all
(8)<18
Public TrustEurope
0.39*** 0.25(0.13) (0.21)
World-0.04 0.14(0.09) (0.16)
Private TrustEurope
0.72*** 0.46(0.15) (0.31)
World0.60*** 0.53**(0.13) (0.23)
Spouse 0.09*** 0.01 0.11*** 0.04 0.07** 0.00 0.09*** 0.03(0.03) (0.04) (0.02) (0.03) (0.03) (0.05) (0.02) (0.03)
N 1,036 338 1,646 562 1,036 338 1,646 562back
J. Fleck & A. Monninger Culture and Portfolios 20th June 2020 1 / 1

H1: Trust on Liquid Wealth (OLS): High vs Low Trust
(1)all
(2)<18
(3)all
(4)<18
(5)all
(6)<18
(7)all
(8)<18
Public TrustEurope
-0.23 -1.26***(0.21) (0.39)
World-0.20 -0.54**(0.14) (0.23)
Private TrustEurope
0.56* 0.11(0.28) (0.44)
World0.33** 0.35(0.16) (0.26)
N 1,308 454 2,111 807 1,308 454 2,111 807back
J. Fleck & A. Monninger Culture and Portfolios 20th June 2020 1 / 1
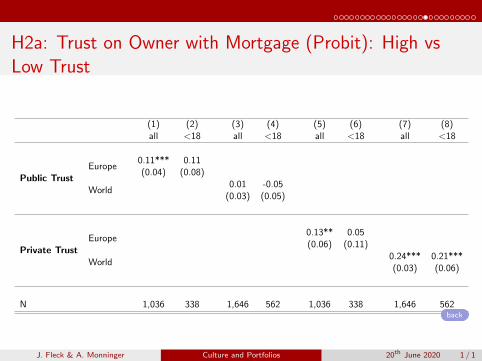
H2a: Trust on Owner with Mortgage (Probit): High vsLow Trust
(1)all
(2)<18
(3)all
(4)<18
(5)all
(6)<18
(7)all
(8)<18
Public TrustEurope
0.11*** 0.11(0.04) (0.08)
World0.01 -0.05
(0.03) (0.05)
Private TrustEurope
0.13** 0.05(0.06) (0.11)
World0.24*** 0.21***(0.03) (0.06)
N 1,036 338 1,646 562 1,036 338 1,646 562back
J. Fleck & A. Monninger Culture and Portfolios 20th June 2020 1 / 1

H2b: Trust on Leverage Ratio (Tobit): High vs Low Trust
(1)all
(2)<18
(3)all
(4)<18
(5)all
(6)<18
(7)all
(8)<18
Public TrustEurope
0.10*** 0.09**(0.02) (0.04)
World0.03** 0.03(0.02) (0.03)
Private TrustEurope
0.07* 0.02(0.04) (0.06)
World0.17*** 0.10***(0.02) (0.04)
N 1,036 338 1,646 562 1,036 338 1,646 562back
J. Fleck & A. Monninger Culture and Portfolios 20th June 2020 1 / 1

H1: Trust on Liquid Wealth (OLS): Civic Indicator
(1)all
(2)<18
(3)all
(4)<18
(5)all
(6)<18
(7)all
(8)<18
Civic IndicatorEurope
1.68*** 0.94(0.62) (1.27)
World1.97*** 2.04**(0.46) (0.82)
PassiveEurope
2.33 5.14(2.62) (4.92)
World0.54 1.25
(1.80) (3.28)
ActiveEurope
1.05 -2.93(2.57) (4.51)
World3.11** 2.63(1.45) (2.45)
N 1,308 454 2,111 807 1,308 454 2,111 807back
J. Fleck & A. Monninger Culture and Portfolios 20th June 2020 1 / 1
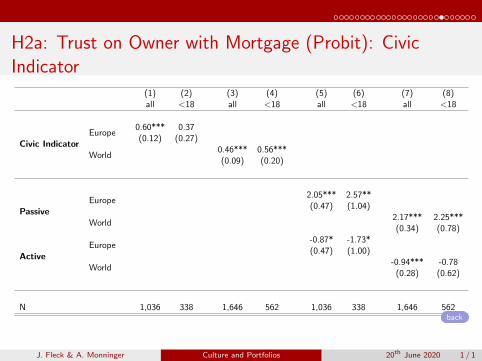
H2a: Trust on Owner with Mortgage (Probit): CivicIndicator
(1)all
(2)<18
(3)all
(4)<18
(5)all
(6)<18
(7)all
(8)<18
Civic IndicatorEurope
0.60*** 0.37(0.12) (0.27)
World0.46*** 0.56***(0.09) (0.20)
PassiveEurope
2.05*** 2.57**(0.47) (1.04)
World2.17*** 2.25***(0.34) (0.78)
ActiveEurope
-0.87* -1.73*(0.47) (1.00)
World-0.94*** -0.78
(0.28) (0.62)
N 1,036 338 1,646 562 1,036 338 1,646 562back
J. Fleck & A. Monninger Culture and Portfolios 20th June 2020 1 / 1

H2b: Trust on Leverage Ratio (Tobit): Civic Indicator
(1)all
(2)<18
(3)all
(4)<18
(5)all
(6)<18
(7)all
(8)<18
Civic IndicatorEurope
0.37*** 0.25*(0.07) (0.14)
World0.27*** 0.29***(0.06) (0.11)
PassiveEurope
1.25*** 0.77(0.29) (0.55)
World1.38*** 0.97**(0.22) (0.41)
ActiveEurope
-0.51* -0.24(0.29) (0.52)
World-0.64*** -0.24
(0.18) (0.33)
N 1,036 338 1,646 562 1,036 338 1,646 562back
J. Fleck & A. Monninger Culture and Portfolios 20th June 2020 1 / 1

H2b: Trust on Leverage Ratio (Tobit): Current Values
(1)all
(2)<18
(3)all
(4)<18
(5)all
(6)<18
(7)all
(8)<18
Public TrustEurope
0.37*** 0.15(0.10) (0.17)
World-0.02 0.09(0.08) (0.13)
Private TrustEurope
0.70*** 0.42*(0.12) (0.24)
World0.61*** 0.52***(0.10) (0.18)
N 1,036 338 1,646 562 1,036 338 1,646 562back
J. Fleck & A. Monninger Culture and Portfolios 20th June 2020 1 / 1

H1: Trust on Precautionary Motive to Save (Probit)
(1)all
(2)<18
(3)all
(4)<18
(5)all
(6)<18
(7)all
(8)<18
Public TrustEurope
-0.25 -0.63**(0.19) (0.32)
World-0.24* -0.23(0.14) (0.23)
Private TrustEurope
0.29 -0.49(0.22) (0.44)
World0.42** 0.14(0.18) (0.31)
N 1,308 454 2,111 807 1,308 454 2,111 807back
J. Fleck & A. Monninger Culture and Portfolios 20th June 2020 1 / 1

H1: Trust on Liquid Wealth (OLS): Un-insurable incomerisk
(1)all
(2)<18
(3)all
(4)<18
(5)all
(6)<18
(7)all
(8)<18
Public TrustEurope
-1.74 -6.52***(1.20) (1.90)
World-1.80** -4.01***(0.84) (1.31)
Private TrustEurope
4.48*** 4.10(1.36) (2.62)
World4.12*** 4.36**(1.06) (1.77)
Self-Employed 0.87** 1.07* 0.71*** 0.81** 0.79** 1.10** 0.68*** 0.79**(0.34) (0.55) (0.24) (0.36) (0.34) (0.55) (0.24) (0.36)
Sector FE
N 1,308 454 2,111 807 1,308 454 2,111 807back
J. Fleck & A. Monninger Culture and Portfolios 20th June 2020 1 / 1

H2a: Trust on Owner with Mortgage (Probit):Un-insurable income risk
(1)all
(2)<18
(3)all
(4)<18
(5)all
(6)<18
(7)all
(8)<18
Public TrustEurope
0.55*** 0.31(0.21) (0.36)
World-0.06 0.03(0.15) (0.27)
Private TrustEurope
1.32*** 0.85(0.25) (0.54)
World1.29*** 1.24***(0.20) (0.42)
Self-Employed 0.23*** 0.21* 0.21*** 0.23*** 0.21*** 0.20* 0.20*** 0.23**(0.06) (0.11) (0.05) (0.09) (0.06) (0.11) (0.05) (0.09)
Sector FE
N 1,036 338 1,646 562 1,036 338 1,646 562back
J. Fleck & A. Monninger Culture and Portfolios 20th June 2020 1 / 1

H2b: Trust on Leverage Ratio (Tobit): Un-insurableincome risk
(1)all
(2)<18
(3)all
(4)<18
(5)all
(6)<18
(7)all
(8)<18
Public TrustEurope
0.45*** 0.27(0.13) (0.21)
World-0.01 0.12(0.10) (0.15)
Private TrustEurope
0.75*** 0.48(0.15) (0.30)
World0.66*** 0.59***(0.13) (0.23)
Self-Employed 0.12*** 0.04 0.13*** 0.12** 0.10** 0.04 0.12*** 0.11**(0.04) (0.07) (0.03) (0.05) (0.04) (0.07) (0.03) (0.05)
Sector FE
N 1,036 338 1,646 562 1,036 338 1,646 562back
J. Fleck & A. Monninger Culture and Portfolios 20th June 2020 1 / 1