Culture & Inclusion
23
Culture & Inclusion: Results from Hope’s 2021 Pulse Survey Frost Center Friday October 15, 2021
Transcript of Culture & Inclusion
Culture & Inclusion:Results from Hope’s 2021 Pulse Survey
Frost Center FridayOctober 15, 2021
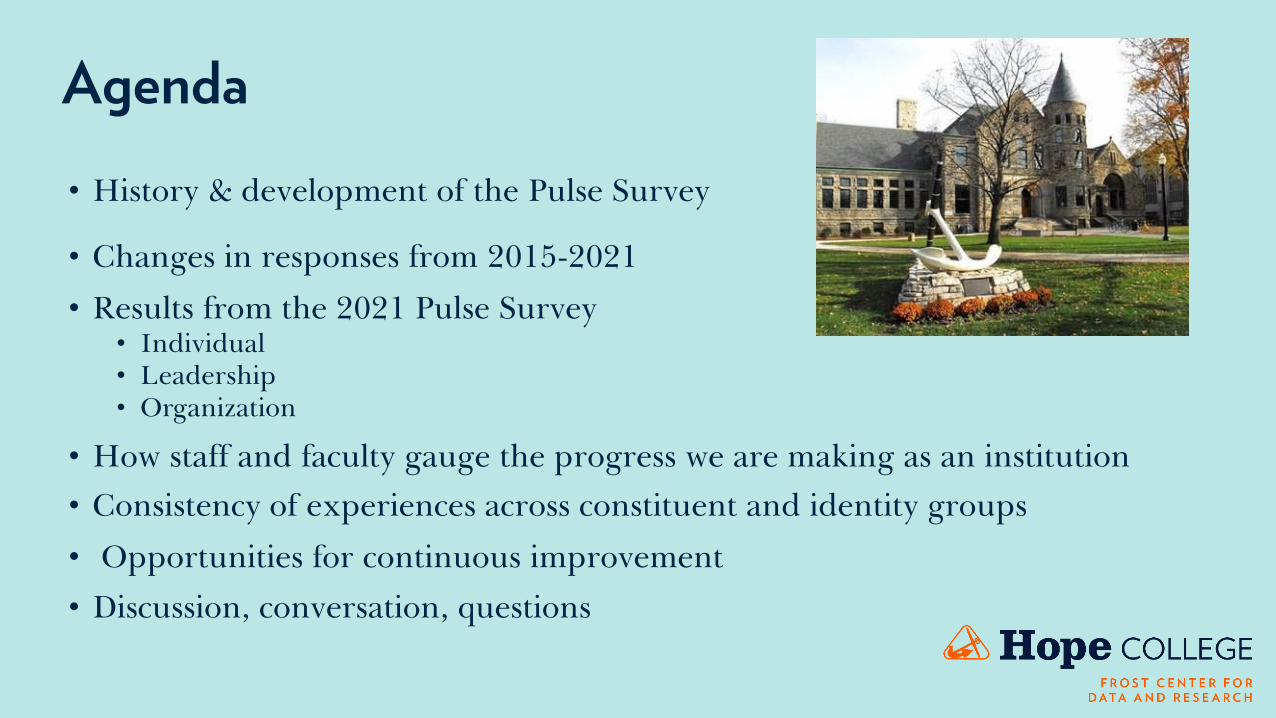
Agenda• History & development of the Pulse Survey
• Changes in responses from 2015-2021
• Results from the 2021 Pulse Survey• Individual• Leadership• Organization
• How staff and faculty gauge the progress we are making as an institution • Consistency of experiences across constituent and identity groups
• Opportunities for continuous improvement
• Discussion, conversation, questions

History of the Pulse Survey at Hope
• Timeline• 2015 Great Place to Work® Trust Index© Employee Survey
• A standardized and reliable instrument developed by the Great Place to Work Institute (GPTW) to measure the 5 dimensions of trust within an organization: Credibility, Respect, Fairness, Pride and Camaraderie; Hope-Specific items
• Hope for the World 2025 [SP KPIs 1.4.3, 1.4.4, 4.3.3, 4.3.6, 6.3.2, 6.3.3]
• 2017 Great Place to Work® Trust Index© Employee Survey
• 2019 Pulse Survey [combination of scale items and open-ended items; ORG & WkGrpperspective; progress scale]
• 2021 Pulse Survey [scale items; progress scale for each item; ORG perspective only]

How the 2019 Pulse Survey was Developed
• Culture Task Force – developed 2019 Pulse Survey
• Background & Rationale – a number of factors were considered:• the culture content we might want to assess • our Higher Learning Commission (HLC) timeline • survey fatigue for our community • the nimbleness of response • cost
• The resulting items represented a combined approach, incorporating qualitative/open-ended items proposed by President Scogin (love about Hope, change, biggest opportunities, biggest challenges) as well as the Hope Specific items from the GPTW Trust Index Survey
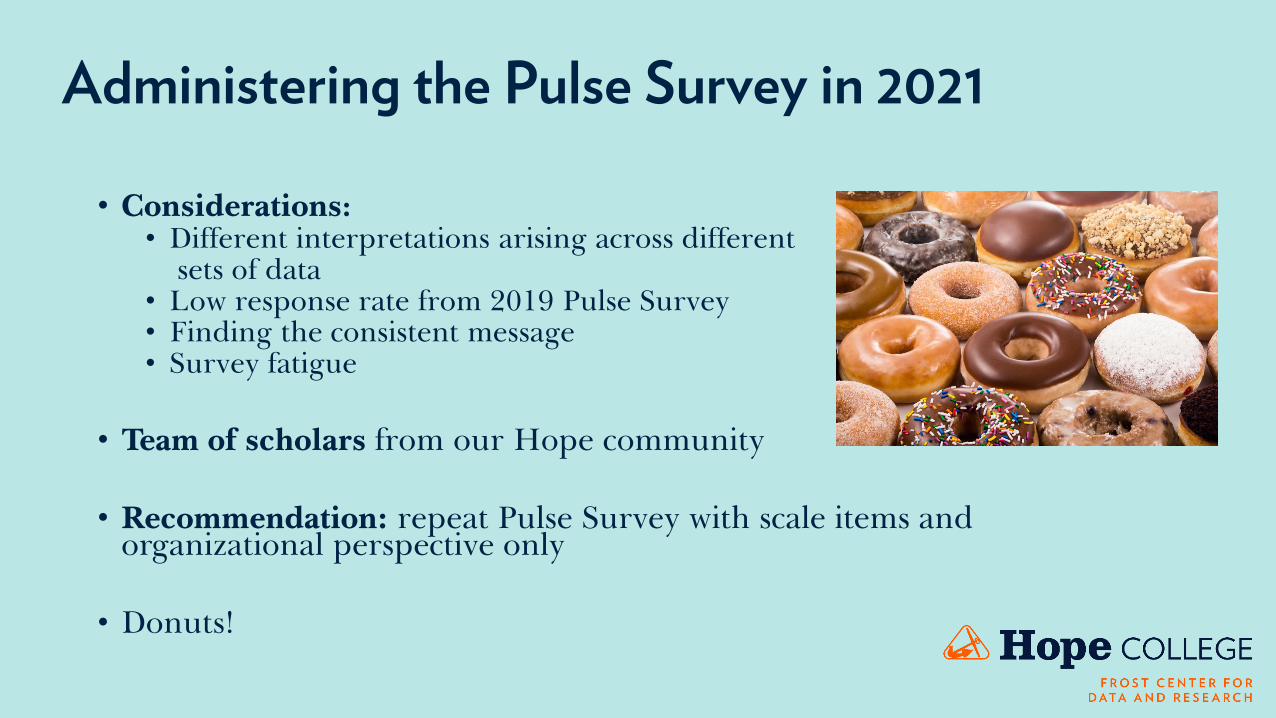
Administering the Pulse Survey in 2021
• Considerations:• Different interpretations arising across different
sets of data• Low response rate from 2019 Pulse Survey• Finding the consistent message • Survey fatigue
• Team of scholars from our Hope community
• Recommendation: repeat Pulse Survey with scale items and organizational perspective only
• Donuts!

Pulse Survey Items and Scoring
• Types of statements:• “I” statements – I have a clear understanding of the college's mission.
• Leadership statements – Leadership demonstrates its commitment to creating a diverse and inclusive workplace.
• Organizational statements – People with varied physical, cognitive and emotional abilities are treated fairly here.
• Scoring:• Survey measures consistency of employee experience: “Almost always untrue” to
“Almost always true”• Scores are presented in % positive: “Often true” (4) or “Almost always true” (5)• Progress scale: worse, about the same, moving in the right direction

High-Level Findings from 2015-2021• 10 of 14 item scores increased from 2015 to 2021
• In each of the 18 items from 2019 & 2021, 89% or more of respondents indicated we are moving in the right direction or we’ve remained the same
• From 2015-2021, staff & faculty understanding of and working to achieve the college’s mission consistently scored high for all constituent and identity groups
• While most overall item scores improved from 2015-2019, results point to marked differences in the experiences of Hope constituent and identity groups
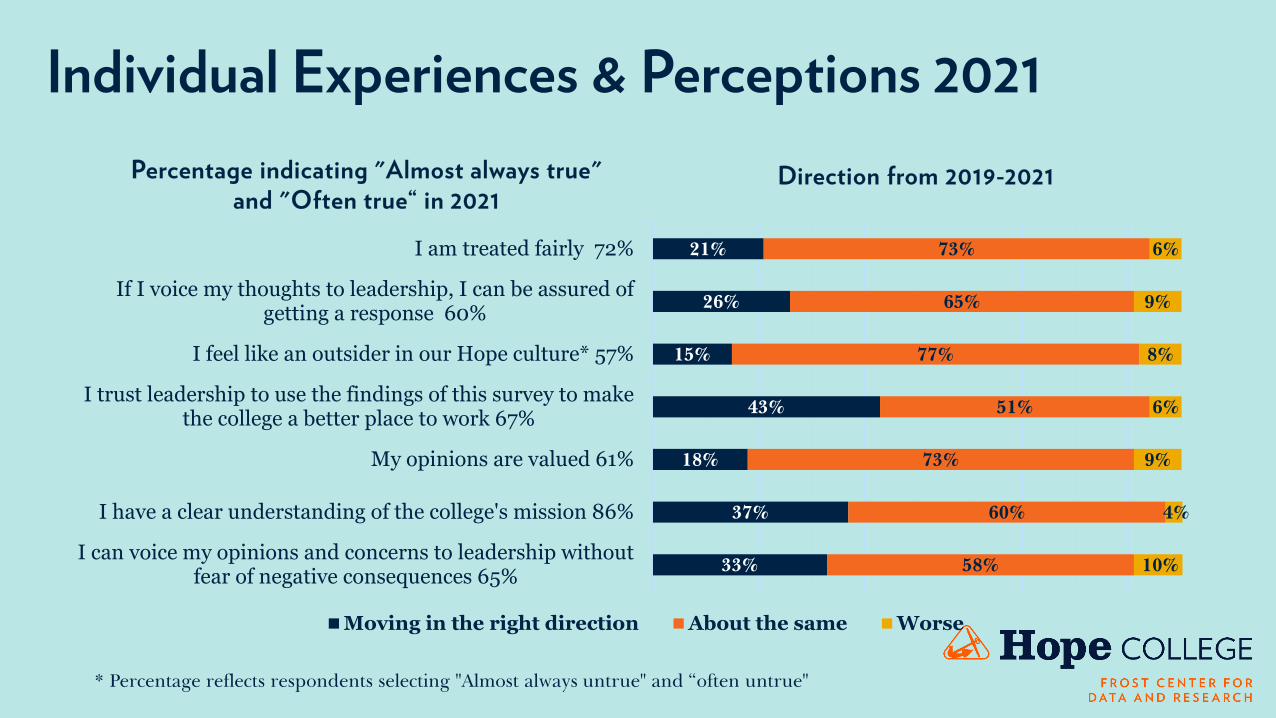
Individual Experiences & Perceptions 2021
33%
37%
18%
43%
15%
26%
21%
58%
60%
73%
51%
77%
65%
73%
10%
4%
9%
6%
8%
9%
6%
I can voice my opinions and concerns to leadership withoutfear of negative consequences 65%
I have a clear understanding of the college's mission 86%
My opinions are valued 61%
I trust leadership to use the findings of this survey to makethe college a better place to work 67%
I feel like an outsider in our Hope culture* 57%
If I voice my thoughts to leadership, I can be assured ofgetting a response 60%
I am treated fairly 72%
Percentage indicating "Almost always true" and "Often true“ in 2021
Moving in the right direction About the same Worse
Direction from 2019-2021
* Percentage reflects respondents selecting "Almost always untrue" and “often untrue"

Assessment of Leadership 2021
52%
55%
32%
44%
40%
58%
4%
5%
10%
Leadership demonstrates sensitivity and understanding intheir interactions with people of different races, ethnicities
and cultures 66%
Leadership demonstrates its commitment to creating adiverse and inclusive workplace 64%
Leadership acts in the best interest of employees whenmaking decisions 56%
Percentage indicating "Almost always true" and "Often true“ in 2021
Moving in the right direction About the same Worse
Direction from 2019-2021

Organizational Values 1. Our actions demonstrate that we value diversity 50% of all 2021 respondents indicated this is “Almost always true” and “Often true”
-5% change in item score from 2015-2021
Scored lowest in 2021 by Staff & Faculty of Color (35%)
Scored highest in 2021 by Staff (56%)
Staf
f & F
acul
ty o
f Col
or
Facu
lty
Staf
f & F
acul
ty w
ith a
Dis
abili
ty
Wom
en
Ove
rall
Staf
f & F
acul
ty w
ithou
t a D
isab
ility
Men
Whi
te S
taff
& F
acul
ty
Staf
f
0%
10%
20%
30%
40%
50%
60%
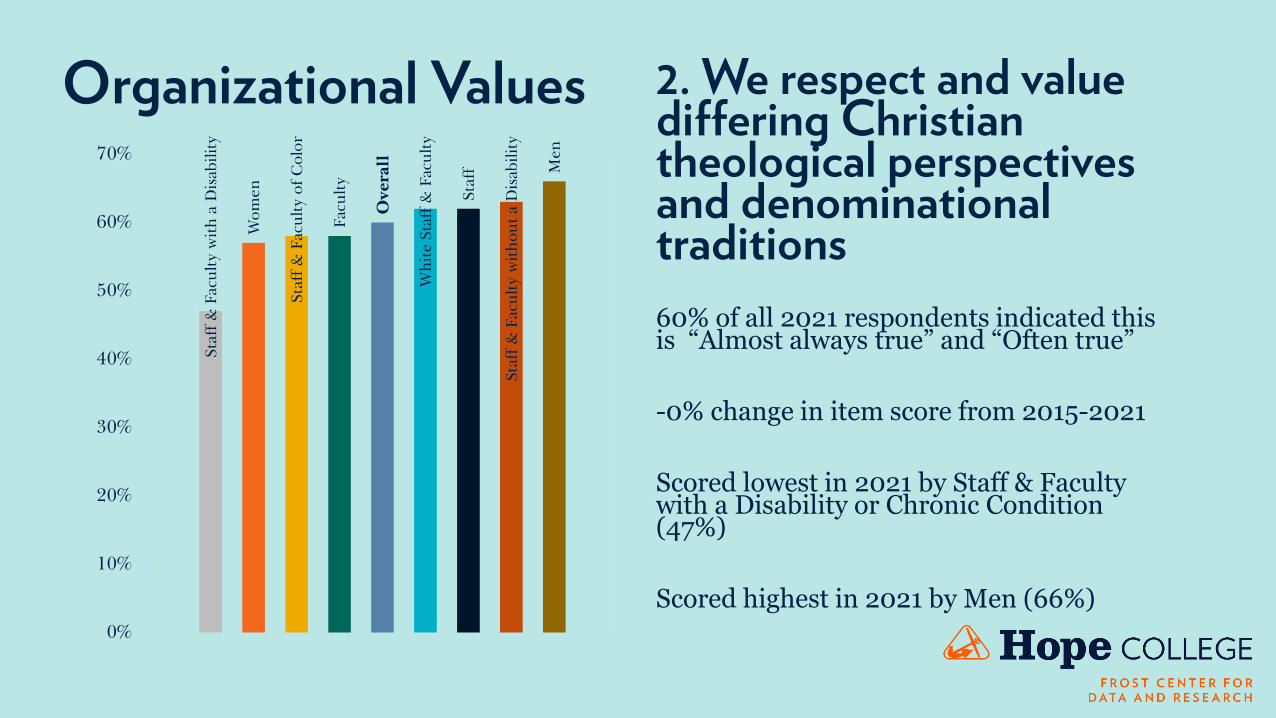
Organizational Values 2. We respect and value differing Christian theological perspectives and denominational traditions60% of all 2021 respondents indicated this is “Almost always true” and “Often true”
-0% change in item score from 2015-2021
Scored lowest in 2021 by Staff & Faculty with a Disability or Chronic Condition (47%)
Scored highest in 2021 by Men (66%)
Staf
f & F
acul
ty w
ith a
Dis
abili
ty
Wom
en
Staf
f & F
acul
ty o
f Col
or
Facu
lty
Ove
rall
Whi
te S
taff
& F
acul
ty
Staf
f
Staf
f & F
acul
ty w
ithou
t a D
isab
ility
Men
0%
10%
20%
30%
40%
50%
60%
70%

Organizational Values 3. People with varied physical, cognitive and emotional abilities are treated fairly here64% of all 2021 respondents indicated this is “Almost always true” and “Often true”
-10% change in item score from 2015-2021
Scored lowest in 2021 by Staff & Faculty with a Disability or Chronic Condition (53%)
Scored highest in 2021 by Men (73%)
Staf
f & F
acul
ty w
ith a
Dis
abili
ty
Wom
en
Facu
lty
Ove
rall
Whi
te S
taff
& F
acul
ty
Staf
f
Staf
f & F
acul
ty o
f Col
or
Staf
f & F
acul
ty w
ithou
t a D
isab
ility
Men
0%
10%
20%
30%
40%
50%
60%
70%
80%

Organizational Values 4. We demonstrate sensitivity and understanding in our interactions with people with different worldviews 50% of all 2021 respondents indicated this is “Almost always true” and “Often true”
-0% change in item score from 2015-2021
Scored lowest in 2021 by Staff & Faculty of color (42%)
Scored highest in 2021 by Men (56%)
Staf
f & F
acul
ty o
f Col
or
Facu
lty
Wom
en
Ove
rall
Staf
f & F
acul
ty w
ith a
Dis
abili
ty
Staf
f & F
acul
ty w
ithou
t a D
isab
ility
Whi
te S
taff
& F
acul
ty
Staf
f
Men
0%
10%
20%
30%
40%
50%
60%

Organizational Values 5. We value discourse dialogue about issues on which opinions differ52% of all 2021 respondents indicated this is “Almost always true” and “Often true”
+5% change in item score from 2015-2021
Scored lowest in 2021 Faculty (46%)
Scored highest in 2021 by Staff & Faculty with a Disability (59%)
Facu
lty
Staf
f & F
acul
ty o
f Col
or
Wom
en
Ove
rall
Staf
f & F
acul
ty w
ithou
t a D
isab
ility
Whi
te S
taff
& F
acul
ty
Staf
f
Men
Staf
f & F
acul
ty w
ith a
Dis
abili
ty
0%
10%
20%
30%
40%
50%
60%
70%

Consistency of Experience: Staff and Faculty
66%
56%
62%
87%
90%
67%
62%
65%
46%
41%
48%
84%
93%
64%
59%
63%
I feel like an outsider in our Hope culture*
Our actions demonstrate that we value diversity.Leadership acts in the best interest of employees when
making decisions.I have a clear understanding of the college's mission.
The work I do helps achieve the college's mission.Leadership demonstrates sensitivity and understanding
in their interactions with people of different races,…My opinions are valued.
People with varied physical, cognitive and emotionalabilities are treated fairly here.
(Percentage of respondents indicating “Almost always true” and “Often true”)
Staff 2021 (n=233) Faculty 2021 (n=190)
* Reverse Scale: Percentage reflects respondents selecting "Almost always untrue" and “often untrue"
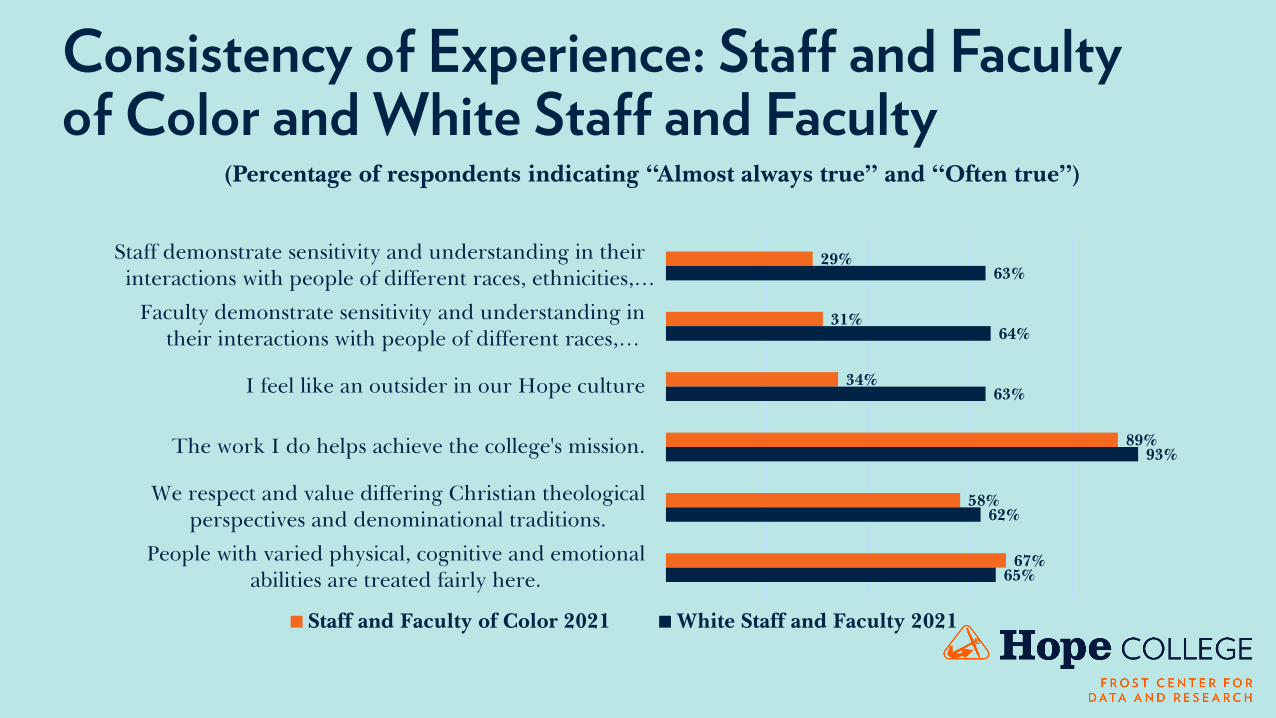
Consistency of Experience: Staff and Faculty of Color and White Staff and Faculty
29%
31%
34%
89%
58%
67%
63%
64%
63%
93%
62%
65%
Staff demonstrate sensitivity and understanding in theirinteractions with people of different races, ethnicities,…
Faculty demonstrate sensitivity and understanding intheir interactions with people of different races,…
I feel like an outsider in our Hope culture
The work I do helps achieve the college's mission.
We respect and value differing Christian theologicalperspectives and denominational traditions.
People with varied physical, cognitive and emotionalabilities are treated fairly here.
(Percentage of respondents indicating “Almost always true” and “Often true”)
Staff and Faculty of Color 2021 White Staff and Faculty 2021

Consistency of Experience: Persons with and without Disability or Chronic Condition
50%
41%
59%
91%
69%
50%
78%
59%
77%
92%
70%
50%
I can voice my opinions and concerns to leadershipwithout fear of negative consequences.
I feel like an outsider in our Hope culture*
I am treated fairly
The work I do helps achieve the college's mission.
I trust leadership to use the findings of this survey tomake the college a better place to work.
We demonstrate sensitivity and understanding in ourinteractions with people with different worldviews
(Percentage of respondents indicating “Almost always true” and “often true”)
With Disability/Chronic Condition 2021 (n=33) Without Disability/Chronic Condition (n=349)

Consistency of Experience: Women and Men
78%
73%
64%
72%
58%
92%
87%
61%
60%
51%
59%
59%
91%
87%
I am treated fairly
People with varied physical, cognitive and emotionalabilities are treated fairly here.
Leadership acts in the best interest of employees whenmaking decisions.
Leadership demonstrates its commitment to creating adiverse and inclusive workplace.
I feel like an outsider in our Hope culture*
The work I do helps achieve the college's mission.
I have a clear understanding of the college's mission.
(Percentage of respondents indicating “Almost always true” and “often true”)
Male/Man Staff 2021 (n=169) Female/Women Staff 2021 (n=216)
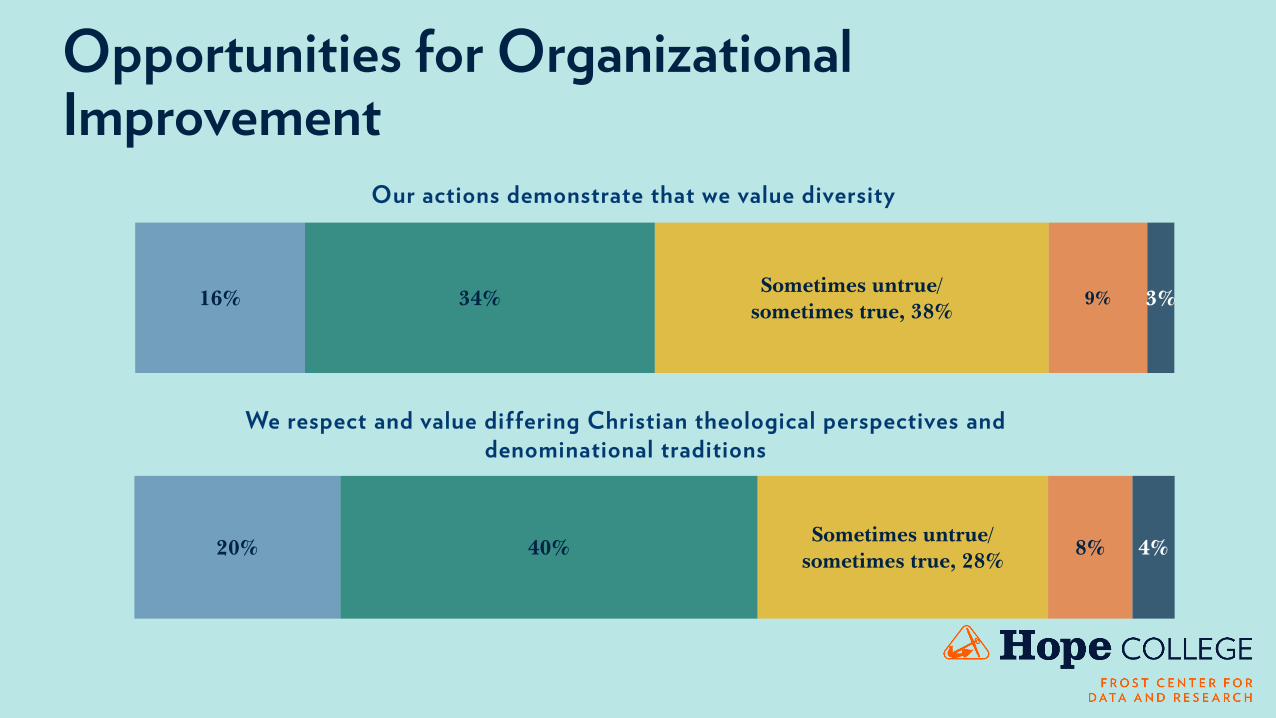
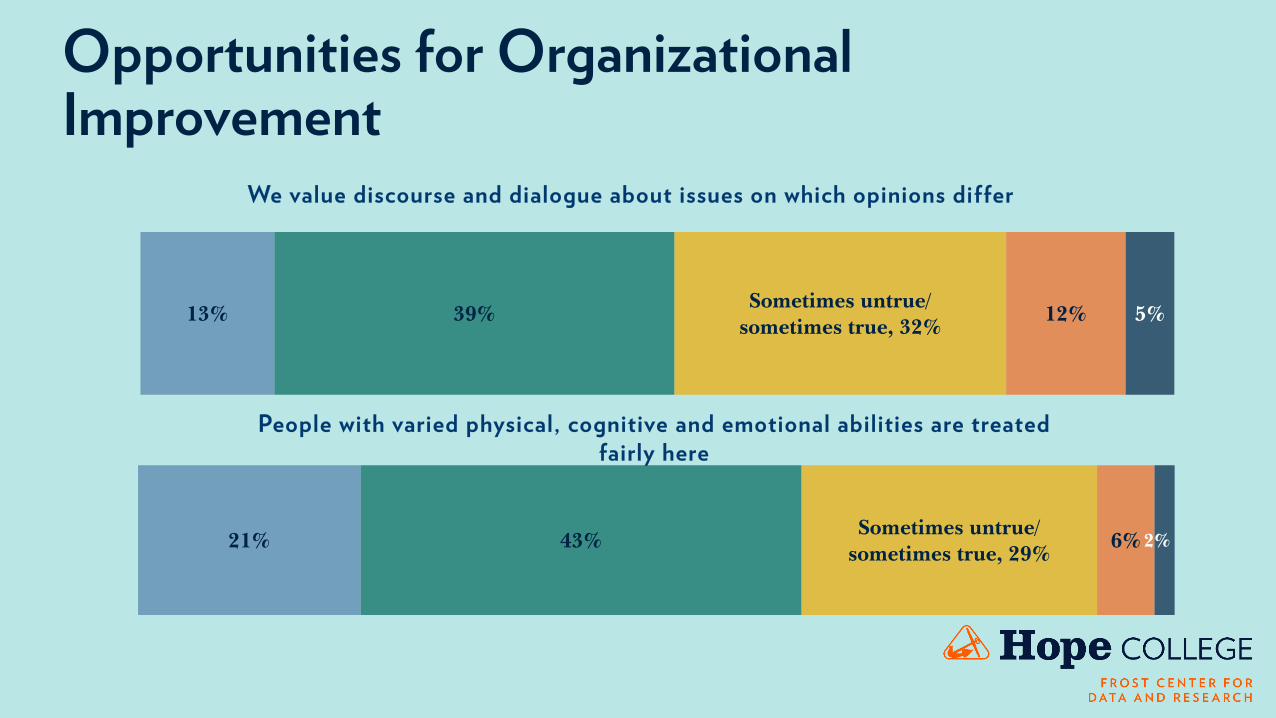
Opportunities for Organizational Improvement
16% 34%Sometimes untrue/
sometimes true, 38%9% 3%
Our actions demonstrate that we value diversity
20% 40%Sometimes untrue/
sometimes true, 28%8% 4%
We respect and value differing Christian theological perspectives and denominational traditions
Opportunities for Organizational Improvement
13% 39%Sometimes untrue/
sometimes true, 32%12% 5%
We value discourse and dialogue about issues on which opinions differ
21% 43%Sometimes untrue/
sometimes true, 29%6% 2%
People with varied physical, cognitive and emotional abilities are treated fairly here
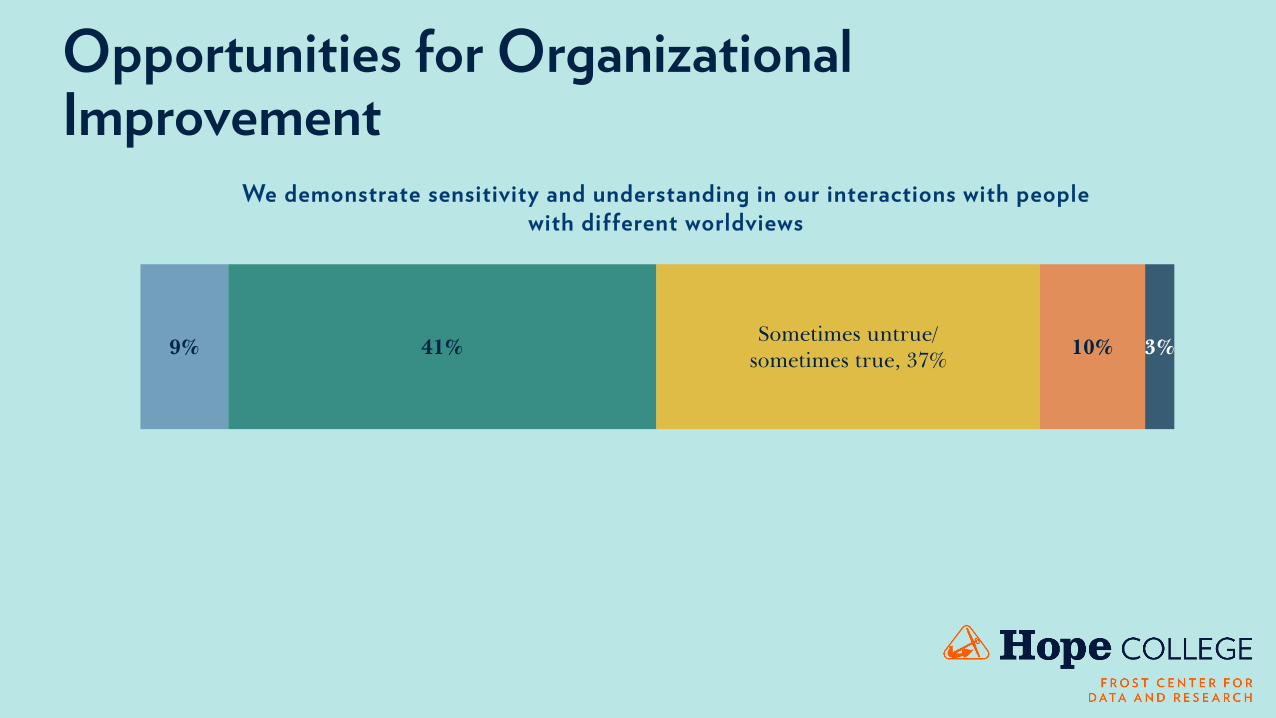
Opportunities for Organizational Improvement
9% 41%Sometimes untrue/
sometimes true, 37% 10% 3%
We demonstrate sensitivity and understanding in our interactions with people with different worldviews
Contact Information & ResourcesSonja Trent-Brown
Kathy Kremer• [email protected]
Campus Climate Data: https://hope.edu/offices/frost-research-center/institutional-research/campus-climate-data/
Inclusive Excellence: https://hope.edu/inclusive/
Culture and Inclusion: https://hope.edu/offices/culture-inclusion/
hope.edu/data
Discussion, conversation, questions
• Who at Hope College (positions or departments) would benefit from the information shared today?
• Thinking about your own work at Hope, how might you use what you’ve learned today?
• How might data from this biannual survey continuously inform decisions?