Culturally Sensitive Care for Seniors Queenie Choo Chief Executive Officer.

Acta Informatica Pragensia, 2020, 9(2), 132–153
DOI: 10.18267/j.aip.137
Original Article
132 ACTA INFORMATICA PRAGENSIA Volume 09 | Number 02 | 2020
Culturally Sensitive Website Elements and Features: A Cross-National Comparison of Websites from Selected Countries
Radim Cermak 1
Abstract
The goal of this case study is to compare websites from 9 different countries―Austria, Chile, China, Japan, Latvia, Nigeria, Saudi Arabia, the US and the Czech Republic―and, based on this comparison, to provide the missing linking of website elements with cultural dimensions for better cultural adaptation of web content. Hofstede’s cultural dimensions were used for the selection of countries for this study. To examine the influence of culture on websites, countries with extreme values of cultural dimensions were selected. An important benefit is that this study takes into account all of Hofstede's cultural dimensions, including the latest one (indulgence vs restraint). For each country 50 websites were selected from areas that most closely reflect the culture of the country. The main focus was on the selection of an appropriate representative sample of websites for each state. A total of 450 pages was analyzed. For each website, 42 web elements determined as the most important were monitored. Moreover, the presence of various types of social networks and five general characteristics were monitored. The findings show that culture influences website design. The results of this study reveal a connection between website elements and Hofstede’s cultural dimensions. For example, headlines are important for countries with a high value of individualism, uncertainty avoidance, and a low value of power distance and indulgence. Newsletters are associated with a high value of indulgence and a low value of long-term orientation and search option with a high value of power distance. Overall, about 20 culturally sensitive website elements were identified. The study also provides a comprehensive overview of website characteristics for each of the selected countries. For UX designers, web localization specialists, academicians, and web developers, this study provides an original view into culturally sensitive website elements and features.
Keywords: Culture, E-commerce, Hofstede's cultural dimensions, Human-computer interaction, Webdesign, Website.
1 Introduction
With the spread of the Internet, the importance of websites for companies but also for
individuals and public and state institutions is increasing. Websites are now one of the most
important information channels. Currently, the website is for many people the first place to
visit when they look for information about a product or a company. The importance of this
media can be demonstrated also by the numbers. The amount of money invested in Internet
advertising grows every year. Sales in the e-commerce area grow every year as well.
1 Department of Systems Analysis, Faculty of Informatics and Statistics, Prague University of Economics and Business,
W. Churchill Sq. 1938/4, 130 67 Prague, Czech Republic

133 ACTA INFORMATICA PRAGENSIA Volume 09 | Number 02 | 2020
Many companies now operate outside of their home country. They are often part of a market
with a different culture. This results in the need to adapt communication in a way that will be
understood by users from a different culture. Companies should avoid any misunderstandings.
It means that if a company wants to communicate adequately and effectively with people
from different cultures, it is necessary to localize the company’s websites.
When discussing localization, we must start from the premise that the website is a culturally
sensitive medium. Many studies have already investigated the question of whether culture
affects websites. Among the first attempts to determine whether a website is a culturally
sensitive medium, and how this cultural sensitivity is shown, are following studies (Marcus &
Gould, 2000; Marcus, 2003; Simon, 2001). Many studies have already tried to find the
differences between websites from different countries and formulate general conclusions
(Wurtz, 2005; Cyr & Trevor-Smith, 2004; Singh, Baack 2004). Other studies have examined
the impact of culture on users’ acceptance and ease of use (Li et al., 2009; Cyr, 2008;
Daryanto et al., 2013). Yet other studies have tried to create a framework that would connect
web elements and features with cultural properties (Singh & Matsuo, 2002; Wurtz, 2005;
Karacay-Aydin et al., 2009). The study (Shneor, 2012) offers information about the influences
of the decision to create a localized website in a foreign country. The study (Reinecke &
Bernstein, 2013) tested an adaptive user interface on users from Rwanda, Switzerland,
Thailand, and on multicultural users. The study (Singh et al., 2013) offers an insight into the
current state of B2B websites based on content analysis of websites from the US and South
Korea. The result is the proposal of a comprehensive framework for measuring the degree of
localization of websites in a B2B environment.
The study (Calabrese et al., 2014) shows a constant topicality of the investigated issue. The
result of the study, based on comprehensive literature research, content analysis, and
contingency analysis, is that the website is not a culturally neutral medium at all, and the
localization of the website is one of the key factors of business success. The cultural
sensitivity of websites is also shown also in the study (Nordhoff et al., 2018), where authors
compared websites from 44 countries. They found that the design of websites with a global
reach is more homogenized compared to local websites. According to (Radziszewska, 2019),
culture dimensions (defined by Hofstede and Hall) influence e-commerce website design
because local cultures influence consumer online behavior and expected B2C website quality
characteristics. All mentioned studies clearly show the cultural sensitivity of websites.
Perhaps the best evidence of the cultural sensitivity of websites is offered by the study
(Vyncke & Brengman, 2010). This study provides an overview of an entire decade of website
cultural sensitivity research. The result of this study confirms the hypothesis that websites
aligned with a given culture are more effective than websites that ignore cultural values in
areas of usefulness, ease of use, generating positive attitude, positive intentions, and overall
effectiveness. This study confirms the importance of research focusing on the creation of
websites for various cultural areas.
As can be seen from the above-mentioned studies, by localization is not meant just a pure
translation. For a comprehensive localization of websites, it is necessary to adjust also website
content and design. Relatively many studies have already dealt with the question of how to
perform localization of content and design. These studies were devoted to determining
culturally sensitive properties and their subsequent linking with cultural dimensions.
Cultural properties are in the literature mostly represented by Hofstede's cultural dimensions
(Singh & Matsuo, 2002; Sachau & Hutchinson, 2012; Calabrese et al., 2014) or Hall´s
cultural dimensions, or more precisely by a combination of these cultural dimensions, see e.g.

134 ACTA INFORMATICA PRAGENSIA Volume 09 | Number 02 | 2020
(Singh et al., 2003; Karacay-Aydin et al., 2009; Yalcin et al., 2011). Hofstede’s cultural
dimensions are in this area the most frequently used way to “describe” cultural properties. It is
important to mention that there are also critics of this concept. One of the most serious
criticisms can be found in the study (McSweeney, 2002a). According to it, Hofstede’s cultural
dimensions are based on fundamentally flawed assumptions which make the whole concept of
cultural dimensions invalid. The main drawback concerns the use of average IBM responses
that cannot reflect ‘the’ national average and questions whether he was able to adequately
depict national cultures and national cultural differences. The study (Imm et al., 2007)
compares Hofstede’s and Schwartz’s framework of values and points out that Hofstede's
cultural dimensions may not properly evaluate cultural view on certain sectors. Ailon (2008)
stressed that Hofstede’s work simplifies the reality and is Western-oriented with a tendency to
separate the West and “the Rest”.
Another criticism focuses in particular on methodological weaknesses. This is related to the
average values that are used to characterize different nations. The critics say that each national
culture is itself quite differentiated (Průcha, 2007, pp. 183, 184). This opinion can be
supported for example by the study (Pratap & Kumar, 2019). The authors have proven
cultural differences regarding website elements within selected cultural zones in India. The
criticism often concerns also the failure of dimensions to consider cultural changes over time
(Kirkman et al., 2006). Hofstede himself summarizes the most common criticism in five
points in his study (Hofstede, 2002). He also adds his defence, which indicates the adequacy
of the concept. This article was questioned by McSweeney (2002b). He points out that
Hofstede’s defence is characterized by evasion and points out inconsistencies in Hofstede’s
reply. McSweeney’s reply is important because it stresses the importance of the fact that
culture is a really complex concept with more levels. It also reminds us that the model of
national culture could be problematic. In case it's considered as a necessary simplification of
reality, this concept could be helpful and has its defenders. The adequacy of the use of
Hofstede's cultural dimensions is proven also by (Steenkamp, 2001). He identified this
framework as rigorous and comprehensive and therefore very suitable for the development of
a theory in the field of international marketing. The framework has also been extensively
tested in the context of literature devoted to advertising and marketing, see e.g. (Albers-Miller
& Gelb, 1996; Milner & Collins, 2000; Zandpour et al., 1994). The use of this framework was
also later extended to the study of web communication, see (Singh & Matsuo, 2004; Singh et
al., 2005 a, b). The advantages of this framework are also confirmed by (Tang & Koveos,
2008), stating that Hofstede's dimensions have a much greater impact than any other cultural
framework and according to (Kirkman et al., 2006), Hofstede’s framework is the best mainly
due to the clarity and simplicity of use. The correctness of cultural dimensions was validated
also within the field of neuroscience. Studies (Delude, 2008; Chavanne, 2007) confirmed
cross-national differences related to individualism and collectivism1.
It is important that none of the studies that investigated the linking of website features with
cultural dimensions take into account the complete set of Hofstede's cultural dimensions. For
example, the study (Ahmed et al., 2009) considers the cultural dimension of power distance
and Hall’s dimension of context. The study (Sachau & Hutchinson, 2012) considers power
1 Culture is a complex concept that covers many things related to our way of living. It has many layers and cannot be
classified easily. However, for scientific purposes, we have to handle it somehow and the best option is currently still
Hofstede’s cultural framework. Even if itis just a necessary simplification of reality. This case study uses the same approach
as many other studies that investigated cultural differences. It is not the goal of this study to argue whether Hofstede’s
cultural framework is worth using or not. It is also important to explicitly say that when “culture” is mentioned in this study,
it is always meant as national culture. Using this nomenclature is in line with the use of cultural dimensions for the
characterization of national culture and cultural differences among countries.

135 ACTA INFORMATICA PRAGENSIA Volume 09 | Number 02 | 2020
distance, context, and uncertainty avoidance; (Wurtz, 2005) considers power distance and
context; (Karacay-Aydin et al., 2009) consider uncertainty avoidance, individualism and
collectivism, masculinity and femininity and context; (Singh et al., 2005b) focus on
individualism and collectivism, uncertainty avoidance, power distance, masculinity and
femininity and context.
Furthermore, none of the studies offers a link of specific website elements with cultural
dimensions – this is identified as a major knowledge gap within the investigated literature.
The result is usually just a general statement or a common description of features. An
example might be the feature Company hierarchy information corresponding to a high value
of power distance. This feature is described as follows: Information about the ranks of
company personnel, information about an organizational chart, and information about
country managers (Singh et al., 2005b). The feature "We" approach corresponding to a high
value of collectivism is reflected in the use of words such as we, ours, together (Karaçay-
Aydin et al., 2010); the feature Web visitor support corresponding to a high value of
uncertainty avoidance that is described as help section, link to how to use the Web site,
information on how to use a computer, and / or a Frequently Asked Questions (FAQs) section
(Sachau & Hutchinson, 2012). A final example can be the general statement provide strong
support or with the help of wizards corresponding to a high value of power distance
(Reinecke & Bernstein, 2011).
The main goal of this case study is to focus on the missing linking of website elements
with cultural dimensions for better cultural adaptation of web content. An additional
goal is to examine websites’ general features and provide a comprehensive overview of
website characteristics for each of the selected countries. Another benefit of this study is that
it considers all Hofstede’s cultural dimensions, including the newest dimension called
indulgence vs restraint. Culturally sensitive website elements are identified, based on the
content analysis of websites from 9 culturally different countries of the world. The mentioned
elements were linked with Hofstede’s cultural dimensions and as such created a set of
culturally influenced website elements. Selected countries are presented in the Methodology
section. The findings should be useful mainly for UX designers and website localization
specialists. For example, when a UX designer is creating a design for the website of a
company that sells its products in Japan and in the US, he or she can create a localized design
that will be intuitive and easy to use for users from both countries.
2 Methodology
A case study approach was used to investigate culture-specific website elements. Case study
is a relevant research method, confirmed by literature (Yin, 2014). A case study should cover
the following steps: determine the research question, choose the research design, prepare to
collect the data, collect the data, analyse the data and share the data.
The first step of case study is defining the research question. In our case, the researched
question was defined as follows: “Are there any differences in the web design approach and
used website elements between the selected countries?” The answer to this question should
help us to achieve our primary goal – to determine the missing linking of website elements
with cultural dimensions for better cultural adaptation of web content.
The research design is based on the content analysis of websites from different countries,
comprehensive literature research and a final synthesis of results. The preparation phase was
mainly focused on considering how the data was to be gathered, which countries should be
136 ACTA INFORMATICA PRAGENSIA Volume 09 | Number 02 | 2020
included in the selection and which websites and website elements should be considered for
data gathering.
The collection of the data was executed using content analysis according to the approach
described in detail below in this chapter. Once the data was gathered, it was analysed and
compared with the results from literature research. Case study results should be shared via the
publication in scientific journals.
It is important to say that as this study used a qualitative research method, the results are not
generalizable, though they provide an insight into culturally sensitive web design. The
following paragraphs describe in detail the research design that was used.
Content analysis was used for comparison of websites from different countries. The author
analysed the content of the website in terms of preselected web elements. This is a commonly
used procedure applied for example in studies (Hashim et al., 2007; Adam et al., 2014;
Karacay-Aydin et al., 2009; Ahmed et al., 2009; Singh et al., 2013). As a result of content
analysis, a dataset was created of website elements displayed on websites from different
countries. This dataset was then analysed more deeply and based on that, the final results
were stated.
The subject of the content analysis were websites from the selected countries. In total 50,
websites were selected from each country and 42 web elements were monitored on each
website. Moreover, the use of social networks and the general properties were monitored as
well. These included: information density, overall colour, saturation/brilliance, text to
graphics ratio, and overall complexity of web design (evaluation is presented below).
The values of Hofstede's cultural dimensions were extremely important for the choice of
countries. Hofstede's cultural dimensions are commonly used as the master key for
distinguishing countries in terms of their cultural differences. Despite the already mentioned
criticism of the use of cultural dimensions, this is the most appropriate way. It is the most
frequently used method in scientific literature. As an example, the following studies could be
mentioned: (Ahmed et al., 2009; Vyncke & Brengman, 2010; Yalcin et al., 2011; Li et al.,
2009; Karacay-Aydin et al., 2009). The difference between cultures was the main factor for
the selection of countries. For a better comparison, countries with the most extreme values of
cultural dimensions are needed.
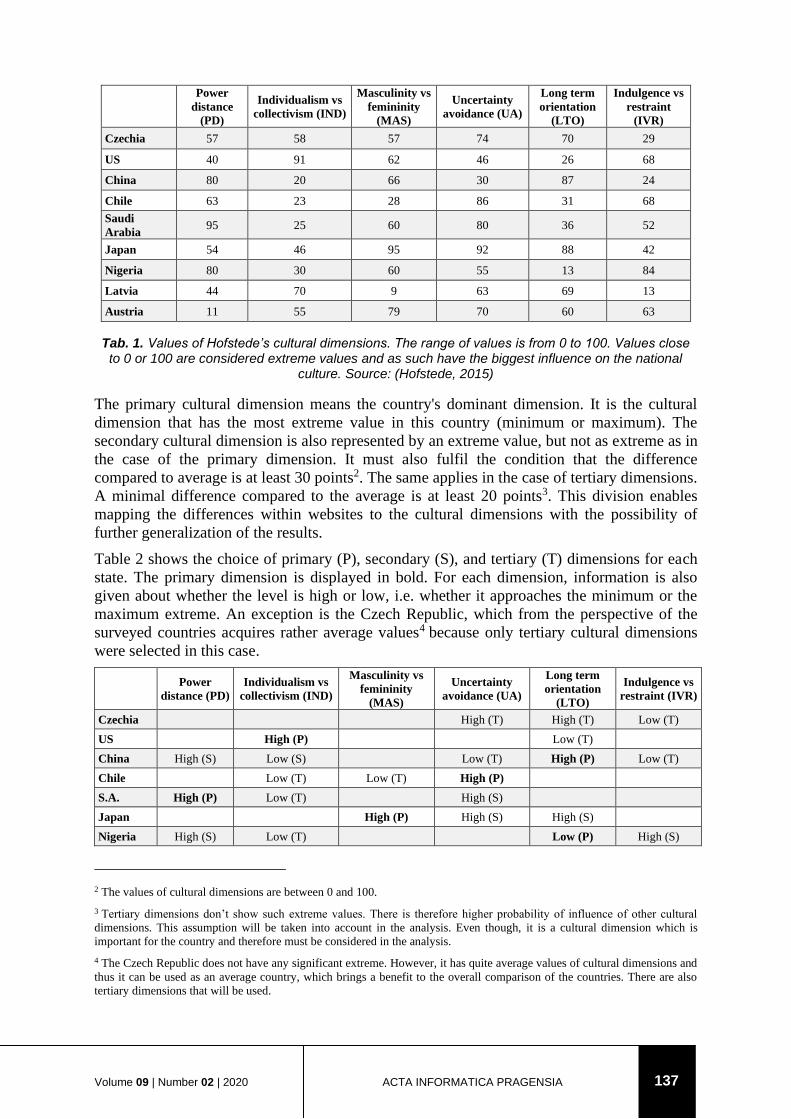
The following countries were chosen for the comparison: the Czech Republic (Czechia), the
United States (US), China, Chile, Saudi Arabia, Nigeria, Latvia, Japan, and Austria. Within
this selection, some countries represent the extreme values of Hofstede's cultural dimensions,
which is necessary for the purposes of this work. Some selected countries are also countries
that are very often used for cultural comparison by other authors (US and China (Li et al.,
2009; Singh et al., 2003), US and Japan (Singh & Matsuo, 2002), US, China and Japan (Singh
et al., 2005b)). An exception is Czechia, which was chosen because it is the author’s home
country and has not yet been investigated from this perspective. Table 1 shows all the
countries and their values of Hofstede’s cultural dimensions.
To determine the dependence of the web elements on the cultural dimensions, it was
necessary to define the dominant cultural dimensions. For each country, one primary cultural
dimension was established. A secondary and a tertiary dimension was also set to enable a
more complex view and generalization. This division will subsequently be used for the
analysis of web elements and their linking to the cultural characteristics of the selected
countries.
137 ACTA INFORMATICA PRAGENSIA Volume 09 | Number 02 | 2020
Power
distance
(PD)
Individualism vs
collectivism (IND)
Masculinity vs
femininity
(MAS)
Uncertainty
avoidance (UA)
Long term
orientation
(LTO)
Indulgence vs
restraint
(IVR)
Czechia 57 58 57 74 70 29
US 40 91 62 46 26 68
China 80 20 66 30 87 24
Chile 63 23 28 86 31 68
Saudi
Arabia 95 25 60 80 36 52
Japan 54 46 95 92 88 42
Nigeria 80 30 60 55 13 84
Latvia 44 70 9 63 69 13
Austria 11 55 79 70 60 63
Tab. 1. Values of Hofstede’s cultural dimensions. The range of values is from 0 to 100. Values close to 0 or 100 are considered extreme values and as such have the biggest influence on the national
culture. Source: (Hofstede, 2015)
The primary cultural dimension means the country's dominant dimension. It is the cultural
dimension that has the most extreme value in this country (minimum or maximum). The
secondary cultural dimension is also represented by an extreme value, but not as extreme as in
the case of the primary dimension. It must also fulfil the condition that the difference
compared to average is at least 30 points2. The same applies in the case of tertiary dimensions.
A minimal difference compared to the average is at least 20 points3. This division enables
mapping the differences within websites to the cultural dimensions with the possibility of
further generalization of the results.
Table 2 shows the choice of primary (P), secondary (S), and tertiary (T) dimensions for each
state. The primary dimension is displayed in bold. For each dimension, information is also
given about whether the level is high or low, i.e. whether it approaches the minimum or the
maximum extreme. An exception is the Czech Republic, which from the perspective of the
surveyed countries acquires rather average values4 because only tertiary cultural dimensions
were selected in this case.
Power
distance (PD)
Individualism vs
collectivism (IND)
Masculinity vs
femininity
(MAS)
Uncertainty
avoidance (UA)
Long term
orientation
(LTO)
Indulgence vs
restraint (IVR)
Czechia High (T) High (T) Low (T)
US High (P) Low (T)
China High (S) Low (S) Low (T) High (P) Low (T)
Chile Low (T) Low (T) High (P)
S.A. High (P) Low (T) High (S)
Japan High (P) High (S) High (S)
Nigeria High (S) Low (T) Low (P) High (S)
2 The values of cultural dimensions are between 0 and 100.
3 Tertiary dimensions don’t show such extreme values. There is therefore higher probability of influence of other cultural
dimensions. This assumption will be taken into account in the analysis. Even though, it is a cultural dimension which is
important for the country and therefore must be considered in the analysis.
4 The Czech Republic does not have any significant extreme. However, it has quite average values of cultural dimensions and
thus it can be used as an average country, which brings a benefit to the overall comparison of the countries. There are also
tertiary dimensions that will be used.

138 ACTA INFORMATICA PRAGENSIA Volume 09 | Number 02 | 2020
Power
distance (PD)
Individualism vs
collectivism (IND)
Masculinity vs
femininity
(MAS)
Uncertainty
avoidance (UA)
Long term
orientation
(LTO)
Indulgence vs
restraint (IVR)
Latvia High (T) Low (P) Low (S)
Austria Low (P) High (T) Low (T)
Tab. 2. Assessment of each country from the cultural dimensions perspective. Cultural dimensions with extreme values are considered as primary (P), high or low values are taken as secondary (S) and
tertiary (T) cultural dimensions. Average values are not considered. This assessment helps to determine the influence of cultural dimensions on selected countries. Source: Author.
Websites were selected to reflect the culture of the country as much as possible. The aim was
also to create a representative sample – to have websites from different sectors and targeting
different age groups and audiences.
Therefore, the first step was to identify the sectors that would be used for analysis. These
sectors should vary and be mainly connected with the local clientele. That should force
website owners and developers to create a website that is designed especially for local users.
This should mean that these websites will maximally reflect the culture of the country.
The following sectors were selected: automotive (mainly focusing on car repair shops, service
stations, car showrooms, tire services or services associated with the use of motor vehicles),
food (focus on restaurants and other forms of eating), accommodation (focus on local forms
of accommodation such as guesthouses, hostels, apartments, etc.), furniture (especially
custom-made furniture or furniture showrooms) and website creation. To search for these
websites, the following primary keywords/phrases were used: car repair shop, restaurant,
guest house, custom furniture, website creation.
Google was used as the main search engine (specifically Google advanced search). It enables
setting the country and the language of websites. Logically, the appropriate keyword was
always used, e.g. for Czech websites the keyword autoservis (car repair shop) was used and
the advanced search was then set to search sites in the Czech language and the region
of Czech Republic. The exception was the search for Chinese and Japanese sites. Local search
engines, which were used for these countries, are more popular in these countries and thus
should provide better results. In the case of China, the search engine at baidu.com was used,
and in the case of Japan it was the search engine at izito.jp. Czech websites were searched
first. Keywords were then translated into English and used to track down websites in the US.
English translations were then used for further translation into other languages. Google
translator was used to translate the keywords. The searched keywords were always translated
into the appropriate language before they were used for searching. In some cases, it was still
necessary to specify the results more clearly. For such cases, the country’s name was added to
the keyword. When even this did not help, it was necessary to add an even more specific
keyword – a city from the selected country (if such specification was used, it was always the
country's capital). These restrictions were applied mainly because in many cases the search
results for the keyword offered a jumble of aggregators and graders. Websites of specific
companies then could not be traced. This limitation concerns mainly China and to some
extent also Saudi Arabia and Japan.
The top 10 entries were selected this way. One rule was applied to the selection of websites: if
a website has another language version, this version must not be different from the major
version in terms of web design (i.e. web graphics, web layout elements, content and site
structure). This rule should eliminate the possibility of the influence of web elements by
already implemented web design localization.
139 ACTA INFORMATICA PRAGENSIA Volume 09 | Number 02 | 2020
For content analysis, it was also necessary to choose web elements that would be tracked on
the website. For this purpose, the most important web elements that could be found on a
common website were selected. To select such web elements, a discussion was conducted
with three experts within the field of website development with more than seven years’
experience (Cermak, 2017). The result is based on the consensus of these three specialists.
Altogether, 42 elements were identified:
Logo; Sidebar; Navigation – vertical, horizontal, multi-level, iconic, pictorial; Banner or
slider – static, animated, full-width, small; Contact – e-mail, telephone, address; Map; Form;
Online chat; News – headline, image, annotation, text; Events; Newsletter; Search – complete,
just search icon; Reference; Forum; FAQ; Links section; Picture; Video; Sitemap; Slogan or
motto of the company; Symbols – general and culturally (nationally) specific; Headlines – h1,
h2, h35; Personalization; https.
for the presence of each element on the homepage was monitored the presence. Other
monitored elements were social networks and general site properties (information density,
overall colour, saturation/brilliance, text to graphics ratio and overall complexity of web
design). The evaluation of these characteristics was based on the Likert scale 1 to 5, where 1
means the lowest value for a given property and 5 the highest value.
To derive some generalized conclusions, we must combine the results with the primary,
secondary and tertiary cultural dimensions. To obtain these generalizable conclusions, it was
first necessary to determine the degree of element depiction depending on the cultural
dimension.
The process was as follows:
1) Cultural dimensions that we previously marked as primary, secondary and tertiary
were given a score as follows: primary = 6 points, secondary = 3 points, tertiary = 1.5
points (in the cases when the value of the difference from the average is equal to or
greater than 24), 1 point (if the difference value was within the range of 20 to 23
points)6
2) For every cultural dimension, the value of a difference was calculated between the
values of displayed elements within countries with high and low value of this
dimension. Only countries with primary, secondary or tertiary dimensions were
counted.
3) The value of difference was calculated for such pairs. This value gives us the
assessment of a given cultural dimension.
4) The multiple of values from point 1 and 3 was used as a scale to rank the value from
point 2.
5) The degree of element depiction was determined as an average value from point 2
using weights from point 4.
In this way, all elements were evaluated depending on the cultural dimensions.
5 Headlines were determined based on their appropriate marking with tags in the source code. Thus, if the page had optically
highlighted text that was not marked by a tag, this headline was ignored. This limitation had to applied to ensure consensus
within the differentiation of headlines and another highlighted text. At the same time, these elements could not be omitted
because they are one of the most fundamental elements of each website.
6 This nuance in the score was made to achieve higher accuracy within the assessment of importance. The second, more
important, reason was the fact that the values of tertiary dimensions are closer to the average values and therefore there is a
higher probability of interference with other cultural dimensions. The main emphasis was therefore on primary dimensions.

140 ACTA INFORMATICA PRAGENSIA Volume 09 | Number 02 | 2020
3 Results
Table 3 shows the percentage in which web elements occurred on websites. Some of the
determined elements did not occur at all or in a very small number. No statements could be
made regarding such elements. These elements were therefore excluded 7 from further
investigation: online chat, https, website personalization, forum, FAQ, displaying of icon
search without search field, displaying the text of news and events. From all surveyed
countries, only Japan had a 16% presence of FAQ and 12% presence of events. The type of
search where only an icon is shown was for the purpose of the following analysis merged
under a general term of search because this division proved to be irrelevant.
Elements Czechia US China Chile S.A. Nigeria Latvia Japan Austria
Vertical nav. 88% 1% 84% -3% 88% 1% 82% -5% 92% 5% 98% 11% 80% -7% 84% -3% 88% 1%
Horizontal nav. 20% 2% 22% 4% 12% -6% 16% -2% 18% 0% 10% -8% 14% -4% 26% 8% 24% 6%
Multilevel nav. 46% 12% 56% 22% 40% 6% 32% -2% 30% -4% 38% 4% 16% -18% 14% -20% 34% 0%
Iconic nav. 44% -3% 42% -5% 48% 1% 34% -13% 50% 3% 48% 1% 38% -9% 74% 27% 44% -3%
Pictorial nav. 24% 0% 20% -4% 18% -6% 14% -10% 6% -18% 30% 6% 28% 4% 46% 22% 32% 8%
E-mail 52% 6% 42% -4% 44% -2% 54% 8% 28% -18% 38% -8% 58% 12% 30% -16% 66% 20%
Phone 68% -3% 74% 3% 82% 11% 90% 19% 48% -23% 60% -11% 72% 1% 64% -7% 84% 13%
Address 64% 8% 68% 12% 54% -2% 72% 16% 26% -30% 48% -8% 52% -4% 54% -2% 66% 10%
Form 46% 2% 70% 26% 34% -10% 52% 8% 40% -4% 40% -4% 22% -22% 46% 2% 44% 0%
Online chat 8% 4% 0% -4% 4% 0% 2% -2% 6% 2% 8% 4% 6% 2% 0% -4% 4% 0%
Newsletter 14% 1% 26% 13% 10% -3% 6% -7% 10% -3% 24% 11% 2% -11% 2% -11% 24% 11%
Banner – static 22% 0% 30% 8% 14% -8% 20% -2% 16% -6% 8% -14% 30% 8% 40% 18% 20% -2%
Banner – animated 64% -2% 68% 2% 80% 14% 72% 6% 62% -4% 84% 18% 48% -18% 54% -12% 62% -4%
Banner – full-width 34% -1% 34% -1% 36% 1% 40% 5% 38% 3% 34% -1% 46% 11% 26% -9% 30% -5%
Banner – small 6% -12% 8% -10% 8% -10% 4% -14% 40% 22% 10% -8% 14% -4% 60% 42% 14% -4%
Search 8% -7% 16% 1% 18% 3% 14% -1% 38% 23% 10% -5% 6% -9% 16% 1% 8% -7%
Only icon 2% -1% 6% 3% 0% -3% 4% 1% 2% -1% 8% 5% 4% 1% 0% -3% 4% 1%
Reference 32% -5% 48% 11% 34% -3% 40% 3% 38% 1% 32% -5% 38% 1% 38% 1% 34% -3%
Sidebar 42% 6% 40% 4% 32% -4% 28% -8% 38% 2% 24% -12% 30% -6% 46% 10% 48% 12%
Logo 98% 0% 100% 2% 98% 0% 98% 0% 100% 2% 98% 0% 96% -2% 100% 2% 92% -6%
Https 0% 0% 0% 0% 0% 0% 2% 2% 2% 2% 0% 0% 0% 0% 0% 0% 0% 0%
Links section 46% -4% 58% 8% 54% 4% 36% -14% 58% 8% 46% -4% 26% -24% 76% 26% 54% 4%
Personalization 0% 0% 0% 0% 0% 0% 0% 0% 0% 0% 0% 0% 0% 0% 0% 0% 0% 0%
Forum 0% 0% 0% 0% 0% 0% 0% 0% 0% 0% 0% 0% 0% 0% 0% 0% 0% 0%
FAQ 0% -3% 6% 3% 0% -3% 0% -3% 2% -1% 4% 1% 0% -3% 16% 13% 0% -3%
News: headline 58% 14% 40% -4% 58% 14% 28% -16% 60% 16% 18% -26% 28% -16% 78% 34% 28% -16%
News: picture 38% 7% 34% 3% 34% 3% 30% -1% 46% 15% 12% -19% 28% -3% 30% -1% 26% -5%
News: annotation 38% 17% 24% 3% 14% -7% 16% -5% 38% 17% 8% -13% 16% -5% 22% 1% 14% -7%
News – text 2% 1% 0% -1% 0% -1% 0% -1% 0% -1% 4% 3% 0% -1% 2% 1% 2% 1%
Events 6% 2% 2% -2% 0% -4% 0% -4% 4% 0% 6% 2% 0% -4% 12% 8% 2% -2%
Sitemap 12% -1% 10% -3% 14% 1% 12% -1% 16% 3% 4% -9% 0% -13% 40% 27% 10% -3%
Picture 84% -2% 70% -16% 76% -10% 86% 0% 84% -2% 96% 10% 88% 2% 100% 14% 94% 8%
Video 12% -1% 14% 1% 14% 1% 22% 9% 18% 5% 4% -9% 8% -5% 18% 5% 4% -9%
Map 36% 14% 40% 18% 4% -18% 20% -2% 14% -8% 14% -8% 28% 6% 22% 0% 16% -6%
h1 62% 18% 44% 0% 22% -22% 30% -14% 34% -10% 30% -14% 50% 6% 64% 20% 58% 14%
h2 70% 14% 70% 14% 38% -18% 38% -18% 54% -2% 38% -18% 66% 10% 78% 22% 48% -8%
h3 64% 18% 40% -6% 26% -20% 40% -6% 58% 12% 50% 4% 46% 0% 56% 10% 38% -8%
Slogan 30% -5% 50% 15% 42% 7% 22% -13% 12% -23% 26% -9% 22% -13% 68% 33% 40% 5%
7 These elements should be part of other types of websites. Https is typically used when a website contains a client section,
the ability to login to your account, etc. That is typically the case of e-shops. Online forms, FAQs, forums, and events could
be expected within a selected cross-section of websites, but this expectation was not confirmed. Online forms, forums and
FAQs are probably more typical for websites with online services such as hosting. Events would then be expected mainly at
sites of various organizations and government units.

141 ACTA INFORMATICA PRAGENSIA Volume 09 | Number 02 | 2020
Elements Czechia US China Chile S.A. Nigeria Latvia Japan Austria
Symbols: gen. 76% 21% 46% -9% 50% -5% 62% 7% 62% 7% 32% -23% 42% -13% 74% 19% 48% -7%
Symbols: cult. 24% -4% 14% -14% 50% 22% 32% 4% 36% 8% 6% -22% 6% -22% 56% 28% 26% -2%
Tab. 3. The frequency of presence of website elements in each country. The left columns for each country show the total percentage value of depiction. The right columns provide the percentage
difference of values compared to average value. Higher differences – above 20% – are highlighted in bold. Source: Author.
The Table 3 shows the presence of website elements in each country. The left column
represents the total percentage value. The right column represents the percentage difference in
values compared to the average. A closer look at the right column shows that the biggest
differences are in the use of multi-level navigation, contact details, small banners, depiction of
news, headlines, links section, slogan and symbols. On the other hand, there is a similarity in
the use of the main navigation, banner (or slider), search, references, sidebar, sitemap, images
and videos.
It is easy to observe that current websites have some common features, which undoubtedly
stems from the principles of website development as well as from the trends and best
practices that prevail in this field. On the other hand, despite these linking attributes, websites
are specifically influenced by the country, that is, by the culture of the country in which they
were created.
Table 4 shows the use of social networks on websites. Results show that the most used social
networks are Facebook, followed by Twitter and Google+. Other popular social networks are
YouTube, Instagram, Pinterest and LinkedIn. Among the companies engaged in
accommodation and hospitality, TripAdvisor is popular.
Czechia US China Chile S.A. Nig. Lat. Jap. Aus.
Facebook 56% 78% 14% 78% 76% 60% 58% 44% 52%
Twitter 16% 70% 10% 54% 74% 52% 48% 36% 18%
G+ 24% 40% 4% 24% 36% 18% 18% 16% 16%
YouTube 10% 10% 0% 18% 38% 12% 6% 4% 2%
Instagram 6% 16% 2% 10% 24% 14% 8% 6% 0%
Pinterest 6% 16% 2% 8% 12% 6% 10% 2% 8%
Vimeo 2% 2% 0% 4% 0% 0% 2% 0% 2%
LinkedIn 4% 16% 2% 14% 14% 8% 2% 0% 4%
TripAdvisor 10% 10% 8% 22% 8% 8% 10% 4% 10%
Yelp 4% 4% 0% 0% 0% 0% 0% 0% 2%
Foursquare 2% 0% 0% 0% 4% 2% 2% 0% 0%
Flickr 0% 2% 2% 2% 4% 0% 0% 0% 0%
StumbleUpon 0% 2% 0% 0% 2% 0% 2% 0% 0%
Behance 0% 0% 0% 0% 2% 0% 2% 0% 0%
Houzz 0% 2% 0% 0% 0% 2% 2% 0% 0%
Zomato 2% 0% 0% 0% 0% 0% 0% 0% 0%
Weibo 0% 0% 20% 0% 0% 0% 0% 0% 0%
QQ (im.qq.com) 0% 0% 20% 0% 0% 0% 0% 0% 0%
WeChat 0% 0% 12% 0% 0% 0% 0% 0% 0%
Hostelbookers 0% 0% 0% 2% 0% 0% 0% 0% 0%
MySpace 0% 0% 0% 0% 4% 0% 0% 0% 0%
iTunes 0% 0% 0% 0% 2% 0% 0% 0% 0%
Snapchat 0% 0% 0% 0% 2% 0% 0% 0% 0%
Draugiem.lv 0% 0% 0% 0% 0% 0% 18% 0% 0%
Hatena.ne.jp 0% 0% 0% 0% 0% 0% 0% 4% 0%
Line.me 0% 0% 0% 0% 0% 0% 0% 6% 0%
Xing.com 0% 0% 0% 0% 0% 0% 0% 0% 2%
Tab. 4. The use of social networks on websites from selected countries. Source: Author.

142 ACTA INFORMATICA PRAGENSIA Volume 09 | Number 02 | 2020
The biggest differences are on Chinese websites. The previously mentioned social networks
are used only by a fraction of companies on Chinese websites compared to the rest of the
countries. The reason is mainly that Chinese companies use local favourite social networks
and forms of communication. An example might be the use of Weibo, the microblogging
Chinese equivalent of Twitter, or the use of locally favourite chat applications QQ or WeChat.
In China, it is also very frequent to use QR codes8 that lead directly to a company’s profile.
Minor differences can be found among other states. In general, social networks are used
slightly less in the Czech Republic and Austria, especially Twitter is not so popular there. A
higher use of Google+ can be noticed in the US; in Saudi Arabia there is a higher use rate of
YouTube and Instagram. It is worth mentioning the use of the network Draugiem.lv in Latvia.
This is a local version of the social network Frype.com. This social network was recorded
only on Latvian websites.
It is quite straightforward that presence on social networking sites is related to the target
audience and that there are differences regarding the most popular social networks across the
world. The results are in line with these general assumptions and, moreover, they can help to
provide an insight regarding the importance of social networks within selected countries.
A general website feature overview is shown in Table 5. The results confirm that there are
differences between states. The highest information density can be found mainly in Japan, the
lowest in Chile and Latvia. The highest overall colour was found in Chile, the lowest in Saudi
Arabia. Saturation was also the highest in Chile, followed by Nigeria, at the opposite pole
were websites in Saudi Arabia. The graphics to text ratio was the highest in Chile and the
largest text to graphics ratio was in the US and Austria. The complicated or more complex
structure was on websites from China and Japan, a simple structure can be found mainly on
websites from Chile, followed by the US and Latvia.
Czechia US China Chile S.A. Nig. Lat. Jap. Aus. Average
Information density 2,06 1,46 2,28 1,28 1,74 1,58 1,32 3 1,96 1,85
Overall colour 2,06 1,94 2,68 3 1,77 2,32 1,98 2,34 1,98 2,23
Saturation/brilliance 3,26 3,12 2,98 3,8 2,19 3,54 2,68 2,7 3,06 3,04
Text to graphics ratio 3,2 2,88 3,66 4,28 3,23 3 3,24 3,16 2,9 3,28
Web design complexity 1,68 1,32 2,28 1,14 1,4 1,62 1,36 2,18 1,38 1,6
Tab. 5. Differences in general features of websites. Each website was evaluated on Likert scale from 1 to 5. 1 means that a feature was not observed, and 5 means that it was typical for the given website.
The displayed values represent averages of all analysed websites. Source: Author.
4 Discussion
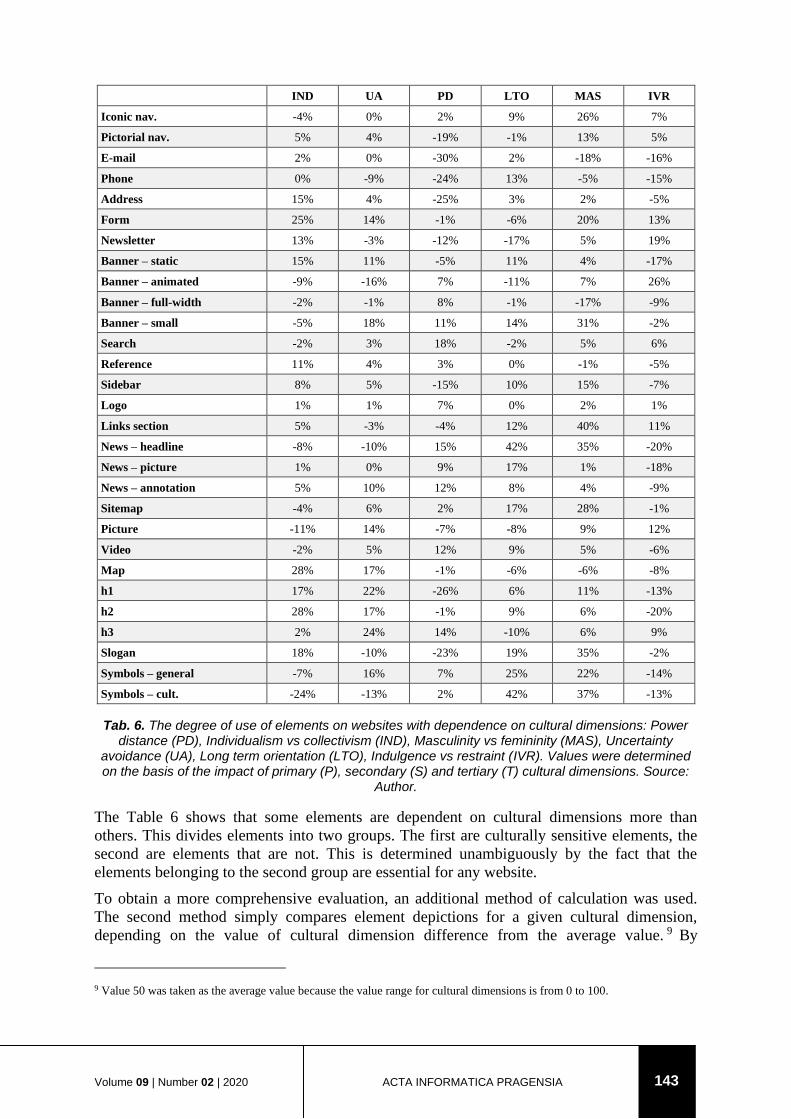
According to the approach described in the last part of the methodology section, Table 6 was
created, showing complete results.
IND UA PD LTO MAS IVR
Vertical nav. -5% -3% 3% -9% 5% 15%
Horizontal nav. 7% 8% -8% 5% 10% -4%
Multi-level nav. 16% -12% -2% -9% 3% 14%
8 About 40% of Chinese websites contained a QR code, which is typically directed to any of the chat platforms or other social
networks. QR codes were also recorded on websites from Chile and Japan (but in both cases only in 4% of websites).
143 ACTA INFORMATICA PRAGENSIA Volume 09 | Number 02 | 2020
IND UA PD LTO MAS IVR
Iconic nav. -4% 0% 2% 9% 26% 7%
Pictorial nav. 5% 4% -19% -1% 13% 5%
E-mail 2% 0% -30% 2% -18% -16%
Phone 0% -9% -24% 13% -5% -15%
Address 15% 4% -25% 3% 2% -5%
Form 25% 14% -1% -6% 20% 13%
Newsletter 13% -3% -12% -17% 5% 19%
Banner – static 15% 11% -5% 11% 4% -17%
Banner – animated -9% -16% 7% -11% 7% 26%
Banner – full-width -2% -1% 8% -1% -17% -9%
Banner – small -5% 18% 11% 14% 31% -2%
Search -2% 3% 18% -2% 5% 6%
Reference 11% 4% 3% 0% -1% -5%
Sidebar 8% 5% -15% 10% 15% -7%
Logo 1% 1% 7% 0% 2% 1%
Links section 5% -3% -4% 12% 40% 11%
News – headline -8% -10% 15% 42% 35% -20%
News – picture 1% 0% 9% 17% 1% -18%
News – annotation 5% 10% 12% 8% 4% -9%
Sitemap -4% 6% 2% 17% 28% -1%
Picture -11% 14% -7% -8% 9% 12%
Video -2% 5% 12% 9% 5% -6%
Map 28% 17% -1% -6% -6% -8%
h1 17% 22% -26% 6% 11% -13%
h2 28% 17% -1% 9% 6% -20%
h3 2% 24% 14% -10% 6% 9%
Slogan 18% -10% -23% 19% 35% -2%
Symbols – general -7% 16% 7% 25% 22% -14%
Symbols – cult. -24% -13% 2% 42% 37% -13%
Tab. 6. The degree of use of elements on websites with dependence on cultural dimensions: Power distance (PD), Individualism vs collectivism (IND), Masculinity vs femininity (MAS), Uncertainty
avoidance (UA), Long term orientation (LTO), Indulgence vs restraint (IVR). Values were determined on the basis of the impact of primary (P), secondary (S) and tertiary (T) cultural dimensions. Source:
Author.
The Table 6 shows that some elements are dependent on cultural dimensions more than
others. This divides elements into two groups. The first are culturally sensitive elements, the
second are elements that are not. This is determined unambiguously by the fact that the
elements belonging to the second group are essential for any website.
To obtain a more comprehensive evaluation, an additional method of calculation was used.
The second method simply compares element depictions for a given cultural dimension,
depending on the value of cultural dimension difference from the average value. 9 By
9 Value 50 was taken as the average value because the value range for cultural dimensions is from 0 to 100.

144 ACTA INFORMATICA PRAGENSIA Volume 09 | Number 02 | 2020
multiplying this value and the percentage rate of element depiction difference, and then
averaging these values, the degree of element occurrence was obtained. The results of this
calculation method were very similar to those of the first calculation. For a more detailed
comparison of these two approaches, see Table 7 with normalized values.
General Based on P, S and T dimensions
IND UA PD LTO MAS IVR IND UA PD LTO MAS IVR
Vertical nav. -0,17 -0,06 0,20 -0,18 0,16 0,18 -0,12 -0,07 0,07 -0,21 0,12 0,36
Horizontal nav. 0,18 0,16 -0,24 0,12 0,23 0,01 0,17 0,19 -0,19 0,12 0,23 -0,09
Multi-level nav. 0,22 -0,42 -0,01 -0,44 0,12 0,33 0,37 -0,28 -0,04 -0,20 0,08 0,32
Iconic nav. -0,11 0,19 0,12 0,40 0,64 -0,06 -0,09 0,00 0,05 0,21 0,62 0,16
Pictorial nav. 0,24 0,13 -0,42 0,39 0,36 -0,06 0,11 0,10 -0,44 -0,03 0,31 0,12
E-mail 0,27 -0,06 -0,66 0,14 -0,40 -0,13 0,04 -0,01 -0,70 0,04 -0,43 -0,37
Phone 0,06 -0,16 -0,51 0,19 -0,21 -0,02 0,00 -0,21 -0,56 0,31 -0,12 -0,34
Address 0,39 -0,04 -0,68 0,06 -0,07 0,13 0,35 0,10 -0,58 0,08 0,05 -0,12
Form 0,32 0,04 -0,21 -0,45 0,33 0,54 0,59 0,33 -0,03 -0,15 0,47 0,31
Newsletter 0,20 -0,24 -0,19 -0,42 0,22 0,42 0,30 -0,06 -0,28 -0,39 0,13 0,45
Banner - static 0,41 0,21 -0,34 0,35 0,08 -0,23 0,35 0,25 -0,12 0,26 0,10 -0,40
Banner - animated -0,40 -0,35 0,38 -0,41 0,12 0,41 -0,21 -0,38 0,17 -0,25 0,16 0,61
Banner - full-width -0,01 -0,06 0,10 -0,09 -0,40 -0,13 -0,04 -0,02 0,18 -0,03 -0,40 -0,20
Banner - small -0,17 0,60 0,22 0,49 0,73 -0,14 -0,13 0,42 0,26 0,34 0,74 -0,04
Search -0,23 0,04 0,42 -0,32 0,09 0,19 -0,04 0,07 0,43 -0,05 0,11 0,14
Reference 0,18 0,00 -0,07 -0,12 -0,05 0,07 0,26 0,10 0,07 0,01 -0,03 -0,11
Sidebar 0,24 0,16 -0,33 0,30 0,40 -0,07 0,18 0,11 -0,36 0,24 0,35 -0,17
Logo -0,02 0,01 0,12 -0,03 0,02 0,01 0,03 0,01 0,17 0,01 0,05 0,03
Links section -0,04 0,11 0,05 0,27 0,99 0,17 0,11 -0,06 -0,09 0,29 0,95 0,26
News – headline -0,17 0,27 0,42 1,00 0,81 -0,64 -0,19 -0,23 0,36 1,00 0,83 -0,47
News – picture 0,01 0,09 0,15 0,20 0,02 -0,27 0,01 -0,01 0,21 0,41 0,03 -0,43
News – annotation 0,11 0,23 0,18 0,07 0,08 -0,19 0,11 0,23 0,29 0,18 0,11 -0,20
Sitemap -0,15 0,31 0,07 0,41 0,58 -0,06 -0,09 0,13 0,06 0,40 0,67 -0,01
Picture -0,18 0,33 -0,09 0,10 0,17 0,10 -0,25 0,33 -0,16 -0,18 0,20 0,27
Video -0,13 0,14 0,18 0,03 -0,01 -0,03 -0,04 0,11 0,28 0,22 0,12 -0,14
Map 0,68 0,11 -0,37 -0,11 -0,17 -0,05 0,66 0,41 -0,02 -0,15 -0,15 -0,18
h1 0,66 0,44 -0,75 0,54 0,33 -0,28 0,41 0,52 -0,61 0,14 0,27 -0,30
h2 0,79 0,29 -0,39 0,46 0,20 -0,42 0,67 0,39 -0,03 0,22 0,14 -0,48
h3 0,08 0,44 0,18 -0,06 0,08 -0,03 0,04 0,58 0,33 -0,24 0,14 0,20
Slogan 0,40 -0,06 -0,51 0,65 0,87 -0,04 0,42 -0,23 -0,53 0,45 0,82 -0,05
Symbols – general -0,12 0,55 0,09 0,54 0,31 -0,32 -0,17 0,38 0,17 0,59 0,51 -0,33
Symbols – cult. -0,62 0,24 0,31 0,85 0,74 -0,30 -0,57 -0,31 0,05 1,00 0,86 -0,31
Tab. 7. Comparison of values received from the calculation with consideration of primary (P), secondary (S) and tertiary (T) cultural dimension with values given by the calculation without the
impact of P, S and T cultural dimensions. Both methods have very similar results. Values related to Hofstede’s cultural dimensions are: Power distance (PD), Individualism vs collectivism (IND),
Masculinity vs femininity (MAS), Uncertainty avoidance (UA), Long term orientation (LTO), Indulgence vs restraint (IVR). Source: Author.

145 ACTA INFORMATICA PRAGENSIA Volume 09 | Number 02 | 2020
Table 7 clearly shows that both methods offer very similar values, which confirms the
correctness of the procedure. However, we can notice some differences due to the fact that the
occurrence of a given element can be influenced by several cultural dimensions. This means
mainly that the one cultural dimension could lead to the presence of an element, but another
one could lead to the suppression of the same element. To make general conclusions, values
from method one will therefore be used. This method takes into account the extreme values of
cultural dimensions for the country, which should, at least to some extent, shield any
interaction with other elements of cultural dimensions.10
4.1 Culturally sensitive web elements
From the previous tables, it can be seen that due to the similar values of cultural dimensions
from examined states certain elements prove to be significant for more cultural dimensions.
This is logical, because if two countries are close in more cultural dimensions and we
compare these with a country that has different values in given cultural dimensions, the same
elements may be in the comparison evaluated as significant for more cultural dimensions. In
this case, it is necessary to take into account the difference in the value of the presence of the
element. It is also necessary to take into account the values of cultural dimensions in the
countries where such cultural dimension was marked as primary or secondary.
Taking into account what has been mentioned above, we can derive the following linking of
website elements and cultural dimensions. Table 8 shows all significant elements depending
on each cultural dimension. These are any elements that reached significant difference values.
It can be seen that in many cases there are elements that are linked to more cultural
dimensions. This is not necessarily wrong. We can see it as reflecting that the presence of the
element on a website in a state with a certain extreme value of cultural dimension should have
a positive effect on user acceptance and ease of use.
IND H2 Map Form Slogan H1
COL Symbols –
cult.
UA(H) H3 H1 Banner –
small Map
Symbols –
general H2
UA(L) Banner –
animated
PD(H) Search
PD(L) E-mail H1 Address Phone Slogan Pictorial
nav.
LTO(H) Symbols –
cult.
News –
headline
Symbols –
general Slogan
News –
picture Sitemap
LTO(L) Newsletter
MAS(H) Links section Symbols –
cult.
News –
headline Slogan
Banner –
small Sitemap
Iconic
nav.
Symbols –
general Form
MAS(L) E-mail Banner –
full-width
IVR(H) Banner –
animated Newsletter
IVR(L) H2 News –
headline
News –
picture
Banner –
static
Tab. 8. Website elements depending on cultural dimensions: Power distance (PD), Individualism vs collectivism (IND vs COL), Masculinity vs femininity (MAS), Uncertainty avoidance (UA), Long term orientation (LTO), Indulgence vs restraint (IVR). H means high value. L means low value. Each row
10 To eliminate the interactions of cultural dimensions, i.e. the influence of different cultural dimensions on element depiction
is not completely possible. It is because of the complexity of the culture. This method should eliminate this fact as much as
possible.
146 ACTA INFORMATICA PRAGENSIA Volume 09 | Number 02 | 2020
contains culturally sensitive elements related to the cultural dimension from the first column. Source: Author.
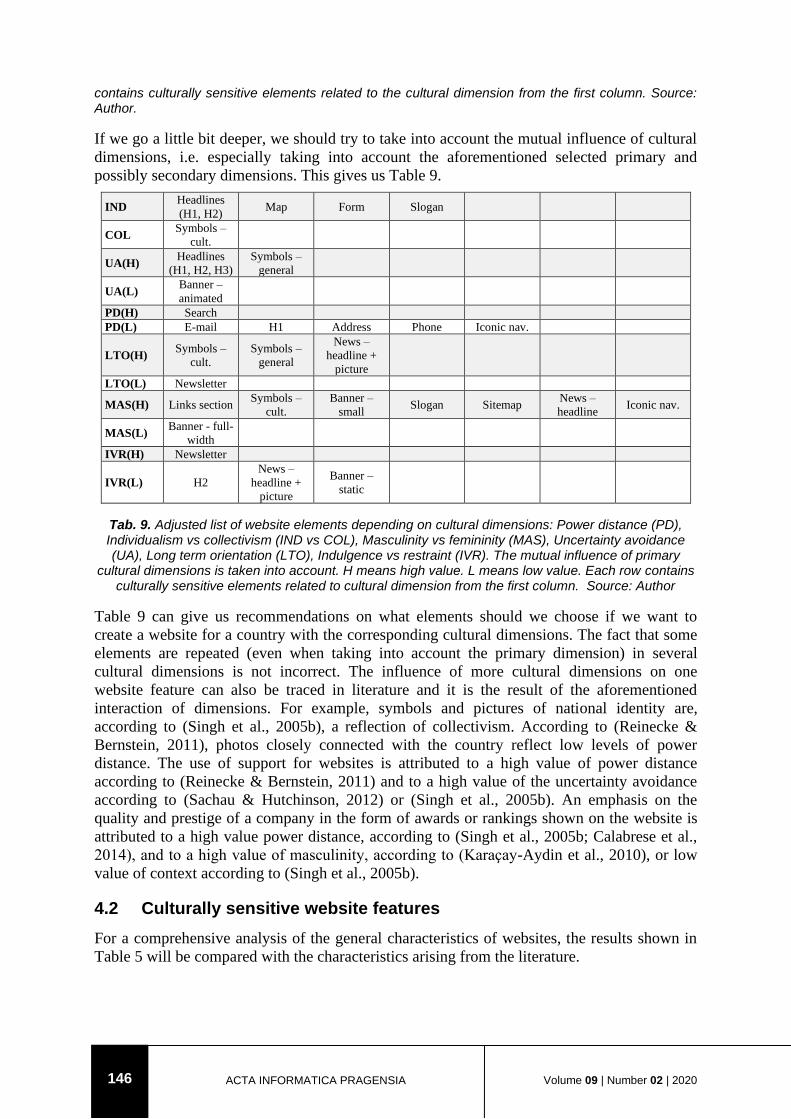
If we go a little bit deeper, we should try to take into account the mutual influence of cultural
dimensions, i.e. especially taking into account the aforementioned selected primary and
possibly secondary dimensions. This gives us Table 9.
IND Headlines
(H1, H2) Map Form Slogan
COL Symbols –
cult.
UA(H) Headlines
(H1, H2, H3)
Symbols –
general
UA(L) Banner –
animated
PD(H) Search
PD(L) E-mail H1 Address Phone Iconic nav.
LTO(H) Symbols –
cult.
Symbols –
general
News –
headline +
picture
LTO(L) Newsletter
MAS(H) Links section Symbols –
cult.
Banner –
small Slogan Sitemap
News –
headline Iconic nav.
MAS(L) Banner - full-
width
IVR(H) Newsletter
IVR(L) H2
News –
headline +
picture
Banner –
static
Tab. 9. Adjusted list of website elements depending on cultural dimensions: Power distance (PD), Individualism vs collectivism (IND vs COL), Masculinity vs femininity (MAS), Uncertainty avoidance (UA), Long term orientation (LTO), Indulgence vs restraint (IVR). The mutual influence of primary
cultural dimensions is taken into account. H means high value. L means low value. Each row contains culturally sensitive elements related to cultural dimension from the first column. Source: Author
Table 9 can give us recommendations on what elements should we choose if we want to
create a website for a country with the corresponding cultural dimensions. The fact that some
elements are repeated (even when taking into account the primary dimension) in several
cultural dimensions is not incorrect. The influence of more cultural dimensions on one
website feature can also be traced in literature and it is the result of the aforementioned
interaction of dimensions. For example, symbols and pictures of national identity are,
according to (Singh et al., 2005b), a reflection of collectivism. According to (Reinecke &
Bernstein, 2011), photos closely connected with the country reflect low levels of power
distance. The use of support for websites is attributed to a high value of power distance
according to (Reinecke & Bernstein, 2011) and to a high value of the uncertainty avoidance
according to (Sachau & Hutchinson, 2012) or (Singh et al., 2005b). An emphasis on the
quality and prestige of a company in the form of awards or rankings shown on the website is
attributed to a high value power distance, according to (Singh et al., 2005b; Calabrese et al.,
2014), and to a high value of masculinity, according to (Karaçay-Aydin et al., 2010), or low
value of context according to (Singh et al., 2005b).
4.2 Culturally sensitive website features
For a comprehensive analysis of the general characteristics of websites, the results shown in
Table 5 will be compared with the characteristics arising from the literature.

147 ACTA INFORMATICA PRAGENSIA Volume 09 | Number 02 | 2020
Based on the findings from several studies that focused on research about the relation of
website features and culture, the following characteristics were determined for each country.
Those characteristics were selected that were relevant to the characteristics observed in this
study. The following studies were used: (Reinecke & Bernstein, 2011; Singh et al., 2005b;
Calabrese et al., 2014; Karaçay-Aydin et al., 2010; Sachau & Hutchinson, 2012).
The Czech Republic
• High uncertainty avoidance: organized information hierarchy, linear navigation paths,
showing the position of the user, sitemap, search, clear navigation and preventing
errors, use of colour, web visitor support
• High long-term orientation: most information at interface level, content can be
arranged around a focal area
US
• High individualism: use of colour to encode information, high text-to-image ratio, low
multimodality, monotonously coloured interface, personalization
• Low long-term orientation: reduced information density, content highly structured into
small units
China
• High long-term orientation: most information at interface level, content can be
arranged around a focal area
• High power distance: linear navigation, few links, minimized navigation possibilities,
structured data, little information at first level, providing strong support with the help
of wizards
• High collectivism: traditional colours and images, high image-to-text ratio, high
multimodality, colourful interface, newsletter, symbols and pictures of national
identity
• Low uncertainty avoidance: most information at interface level, complex interfaces,
nonlinear navigation, variety of choices
Chile
• High uncertainty avoidance: organized information hierarchy, linear navigation paths,
showing the position of the user, sitemap, search, clear navigation and preventing
errors, use of colour, web visitor support
• High collectivism: traditional colours and images, high image-to-text ratio, high
multimodality, colourful interface, newsletter, symbols and pictures of national
identity
• Low masculinity: little saturation, pastel colours, allowing exploration and different
paths to navigate, multiple choices
Saudi Arabia
• High power distance: linear navigation, few links, minimized navigation possibilities,
structured data, little information at first level, providing strong support with the help
of wizards

148 ACTA INFORMATICA PRAGENSIA Volume 09 | Number 02 | 2020
• High uncertainty avoidance: organized information hierarchy, linear navigation paths,
showing the position of the user, sitemap, search, clear navigation and preventing
errors, use of colour, web visitor support
• High collectivism: traditional colours and images, high image-to-text ratio, high
multimodality, colourful interface, newsletter, symbols and pictures of national
identity
Japan
• High masculinity: highly contrasting, bright colours, restricted navigation possibilities,
limited choices
• High uncertainty avoidance: organized information hierarchy, linear navigation paths,
showing the position of the user, sitemap, search, clear navigation and preventing
errors, use of colour, web visitor support
• High long-term orientation: most information at interface level, content can be
arranged around a focal area
Nigeria
• Low long-term orientation: reduced information density, content highly structured into
small units
• High power distance: linear navigation, few links, minimized navigation possibilities,
structured data, little information at first level, providing strong support with the help
of wizards
• High collectivism: traditional colours and images, high image-to-text ratio, high
multimodality, colourful interface, newsletter, symbols and pictures of national
identity
Latvia
• Low masculinity: little saturation, pastel colours, allowing exploration and different
paths to navigate, multiple choices
• High individualism: use of colour to encode information, high text-to-image ratio, low
multimodality, monotonously coloured interface, personalization
Austria
• Low power distance: different access and navigation possibilities, nonlinear
navigation, data does not have to be structured, most information at interface level,
hierarchy of information less deep, support is only rarely needed
• High masculinity: highly contrasting, bright colours, restricted navigation possibilities,
limited choices
• High uncertainty avoidance: organized information hierarchy, linear navigation paths,
showing the position of the user, sitemap, search, clear navigation and preventing
errors, use of colour, web visitor support
If we summarize these findings, we should expect in the Czech Republic a simple structure
slightly in contrast with content arranged around a central area, the use of colour and high
information density. In the United States, we should expect the use of colour to encode the
information, high text-to-image ratio, low colour, low information density and structured web,

149 ACTA INFORMATICA PRAGENSIA Volume 09 | Number 02 | 2020
i.e. low complexity. For China, the theory implies a high proportion of images and high use of
colours. Information density and overall complexity could be either small or high. Here is the
theory not consistent, it would be probably dependent on the influence of the dominant
cultural dimension. According to the theory, Chile should be characterized by a simple
structure, high ratio of images, the use of colours and, in contrast, small saturation, the use of
pastel colours and greater complexity. Sites in Saudi Arabia should show simplicity, low
information density, the use of colours and a high proportion of graphics. Japanese sites
should exhibit a high use of colours and saturation, simple and sophisticated navigation and
clear structure in contrast with the content arranged around a focal area and a higher
information density. Sites in Nigeria should have a low information density, should be simple,
coloured with a higher level of graphics. Latvian sites should have low colour and saturation,
a more complex structure, a small proportion of graphics and colour usage for information
encoding. Finally, websites from Austria should be characterized by a high information
density and colour saturation. Information regarding the complexity is inconsistent (from high
uncertainty avoidance can be derived small complexity and from low power distance can be
derived high complexity).
If we compare the measured data with the theory, we can find consensus in most cases. Let us
take a closer look at the ambiguous values. In the Czech Republic, the complexity of the site
appears to be problematic, as it should be simple according to the theory, but slightly higher
values are shown. This is no doubt influenced by contrasting layout options for website
content that can make sites more complex. Higher saturation for sites from the United States
can be attributed to the use of colour to encode information. This results in the use of contrast
and highly saturated colours for important elements. The most difficult situation is in the case
of China. It is an example of a country that has cultural dimensions that influence websites in
a way that does not match. According to the high long-term orientation, Chinese sites should
be very complex with a large amount of information. In contrast, according to high power
distance, websites should contain little information and a clear and simple structure. Slightly
simplified, it is the contrast between simplicity and complexity. The frequency (information
density: 22x1, 16x2, 0x3, 3x4 and 9x5; complexity: 22x1, 12x2, 4x3, 7x4 and 5x5) shows that
in China, mostly simpler sites are crated with a low information density. But on the other
hand, there are also more complex sites with a higher information density.
In Chile, the contrast is mainly in properties derived from low masculinity. However, this
dimension has, in comparison with two more dominant dimensions, certainly less influence.
Another variable may also be a temperament typical for South America, which refers to the
colours and directness. In Saudi Arabia, the contrast is in the use of colours, which should be
higher. Mainly pastel colours are used there, i.e. brown, ochre, yellow, orange, combined with
a blue or green. However, these are colours that are traditional within the given culture. We
are thus observing a predominant influence of traditions. Japanese websites are the most
complicated. This country has three extreme cultural dimensions. Japanese sites thus show at
a first glance many serious contradictions. Japanese websites should be simpler with clear
navigation and at the same time should have a complex structure with much information
presented. Japanese websites are created in the way described. There are simple sites on the
one side, but on the other side, there are more often complex and information-rich sites. In
such cases, these sites are usually completed by sitemaps or well-structured graphical
navigation.
For Nigeria, what might be seen as problematic is the not very high value of graphics-to-text
ratio. This may be due to the overall higher level of simplicity, or straightforwardness, of
Nigerian sites. The problem with the values of the Latvian sites can be seen in particular in

150 ACTA INFORMATICA PRAGENSIA Volume 09 | Number 02 | 2020
the complexity which should be higher but is in fact very low. The reason for this
contradiction can be found in the low context of this culture11. Low context, according to the
theory, points to a simple structure and clear communication of information. In Austria, there
is a slight conflict in the value of colour, which should be higher. Colours on these websites
are used primarily for highlighting important elements, which corresponds with a higher value
of saturation. Complex structure is then "overridden" by simplicity, which is based on the
other two dimensions. The analysis implies that the data are in harmony, despite the minor
nuances discussed above.
The final findings concern the common elements observed across the websites from analysed
countries. Website development, just like any other craft, has its own principles that are fixed,
regardless of where the website was created. Therefore, the average website presents many
common characteristics that can be described as the building blocks. If we are to determine
the format of an average culture-independent site, such a website should include in the header
a company’s logo and menu, in the body a slider (which will be interactive with high
probability), images, title, news, symbols to simplify the communication of selected
information, and in the footer will very probably be contact information (phone, e-mail
address) and block links.
From the results it is evident that there are web elements and features that are the so-called
essential part of websites, but also elements that are influenced by culture. These findings
give us also an answer to our research question: “Are there any differences in web design
approach and used website elements between the selected countries?” The results clearly
support the answer that websites are culturally sensitive and that used website elements differ
according to the country of origin.
This case study based on the content analysis of websites from several countries has provided
new insights regarding the linking of web elements and characteristics with culture
(characterized by Hofstede's cultural dimensions). A comparison with theory suggests that it
is definitely not a comprehensive and exhaustive list. Culture is very complex and this
multidisciplinary filed is still very little explored, thus additional detailed researches are
required. Some elements are in fact reflected in more cultural dimensions and, vice versa, one
country may have, due to the specific values of cultural dimensions, conflicting
recommendations. It is therefore important to focus mainly on these issues and determine
whether it is a result of various important influences within the culture, whether it is the
interaction of dominant cultural dimensions, or whether it was just a misleading finding
within the results or theory.
Acknowledgement
The paper was processed with support from internal grant F4/1/2019 at the Faculty
of Informatics and Statistics, Prague University of Economics and Business.
ORCID
Radim Cermak http://orcid.org/0000-0002-6886-7642
11 Low versus high context is one of Hall’s cultural dimensions representing a different categorization of culture.

151 ACTA INFORMATICA PRAGENSIA Volume 09 | Number 02 | 2020
References
Adam, S., Featherstone, M., & Day, K. W. H. (2014). A comparison of the marketing capabilities of SME websites in Australian and U.S. domains. Journal of Technology Research, 5, 1–20.
Ahmed, T., Mouratidis, H., & Preston, D. (2009). Website design guidelines: High power distance and high-context culture. International Journal of Cyber Society and Education, 2(1), 47–60.
Ailon, G. (2008). Mirror, Mirror on the Wall: Culture’s Consequences in A Value Test of its Own Design. Academy of Management Review, 33(4), 885–904. https://doi.org/10.5465/amr.2008.34421995
Albers-Miller, N. D., & Gelb, B. D. (1996). Business Advertising Appeals as a Mirror of Cultural Dimensions: A Study of Eleven Countries. Journal of Advertising, 25(4), 57–70. https://doi.org/10.1080/00913367.1996.10673512
Calabrese, A., Capece, G., Di Pillo, F., & Martino, F. (2014). Cultural adaptation of web design services as critical success factor for business excellence. Cross Cultural Management: An International Journal, 21(2), 172–190. https://doi.org/10.1108/ccm-09-2012-0070
Cermak, R. (2017). Metodika pro lokalizaci webových stránek z pohledu webdesignu. Dissertation thesis. University of Economics, Prague.
Chavanne, D. (2007) Neuroscience and Culture. http://neuroeconomics.typepad.com/neuroeconomics/2007/01/neuroscience_an.html
Cyr, D. (2008). Modeling Web Site Design Across Cultures: Relationships to Trust, Satisfaction, and E-Loyalty. Journal of Management Information Systems, 24(4), 47–72. https://doi.org/10.2753/mis0742-1222240402
Cyr, D., & Trevor-Smith, H. (2004). Localization of Web design: An empirical comparison of German, Japanese, and United States Web site characteristics. Journal of the American Society for Information Science and Technology, 55(13), 1199–1208. https://doi.org/10.1002/asi.20075
Daryanto, A., Khan, H., Matlay, H., & Chakrabarti, R. (2013). Adoption of country‐specific business websites. Journal of Small Business and Enterprise Development, 20(3), 650–660. https://doi.org/10.1108/jsbed-04-2013-0048
Delude, C. M. (2008). Culture influences brain function, study shows. MIT TechTalk, 52(14), 4.
Hashim, N. H., Hasan, H., & Sinnapan, S. (2007). Australian Online Newspapers: A Website content analysis approach to measure interactivity. In ACIS 2007 Proceedings (56). https://aisel.aisnet.org/acis2007/56
Hofstede, G. (2002). Dimensions do not exist: A reply to Brendan McSweeney. Human Relations, 55(11), 1355–1361. https://doi.org/10.1177/00187267025511004
Hofstede, G. (2015, December 8). Dimension data matrix. http://geerthofstede.nl/
Karacay-Aydin, G., Akben-Selcuk, E., & Aydin-Altinoklar, A. E. (2009). Cultural Variability in Web Content: A Comparative Analysis of American and Turkish Websites. International Business Research, 3(1), 97–103. https://doi.org/10.5539/ibr.v3n1p97
Kirkman, B. L., Lowe, K. B., & Gibson, C. B. (2006). A quarter century of Culture’s Consequences: a review of empirical research incorporating Hofstede’s cultural values framework. Journal of International Business Studies, 37(3), 285–320. https://doi.org/10.1057/palgrave.jibs.8400202
Li, X., Hess, T. J., McNab, A. L., & Yu, Y. (2009). Culture and acceptance of global web sites. ACM SIGMIS Database: The DATABASE for Advances in Information Systems, 40(4), 49–74. https://doi.org/10.1145/1644953.1644959
Marcus, A. (2003). Are you cultured?. New Architect, 8(3), 28-31.
Marcus, A., & Gould, E. W. (2000). Crosscurrents: cultural dimensions and global Web user-interface design. Interactions, 7(4), 32–46. https://doi.org/10.1145/345190.345238
McSweeney, B. (2002a). Hofstede’s Model of National Cultural Differences and their Consequences: A Triumph of Faith - a Failure of Analysis. Human Relations, 55(1), 89–118. https://doi.org/10.1177/0018726702551004
McSweeney, B. (2002b). The essentials of scholarship: A reply to Geert Hofstede. Human Relations, 55(11), 1363–1372. https://doi.org/10.1177/00187267025511005
Milner, L. M., & Collins, J. M. (2000). Sex-Role Portrayals and the Gender of Nations. Journal of Advertising, 29(1), 67–79. https://doi.org/10.1080/00913367.2000.10673604
Nordhoff, M., August, T., Oliveira, N. A., & Reinecke, K. (2018). A Case for Design Localization: Diversity of Website Aesthetics in 44 Countries. In Proceedings of the 2018 CHI Conference on Human Factors in

152 ACTA INFORMATICA PRAGENSIA Volume 09 | Number 02 | 2020
Computing Systems (Paper 337, pp. 1–12). Association for Computing Machinery. https://doi.org/10.1145/3173574.3173911
Pratap S., & Kumar J. (2019). A Dimensional Analysis Across India to Study How National Cultural Diversity Affects Website Designs. In: Chakrabarti A. (ed.) Research into Design for a Connected World. Smart Innovation, Systems and Technologies (pp. 653–664). Springer. https://doi.org/10.1007/978-981-13-5977-4_55
Průcha, J. (2007). Interkulturní psychologie. Portál.
Radziszewska, A. (2019). Cultural Determinants of E-commerce Website Quality Assessment. In Proceedings of the 42nd International Scientific Conference on Economic and Social Development (pp. 17–25). Varazdin Development and Entrepreneurship Agency.
Reinecke, K., & Bernstein, A. (2011). Improving performance, perceived usability, and aesthetics with culturally adaptive user interfaces. ACM Transactions on Computer-Human Interaction, 18(2), 1–29. https://doi.org/10.1145/1970378.1970382
Reinecke, K., & Bernstein, A. (2013). Knowing What A User Likes: A Design Science Approach To Interfaces That Automatically Adapt To Culture. MIS Quarterly, 37(2), 427–453.
Sachau, L. L., & Hutchinson, S. R. (2012). Trends in culturally relevant interface design features for Latino Web site users. Educational Technology Research and Development, 60(6), 1033–1050. https://doi.org/10.1007/s11423-012-9270-5
Shneor, R. (2012). Influences of Culture, Geography and Infrastructure on Website Localization Decisions. Cross Cultural Management, 19(3), 352–374.
Imm Ng, S., Anne Lee, J., & Soutar, G. N. (2007). Are Hofstede’s and Schwartz’s value frameworks congruent? International Marketing Review, 24(2), 164–180. https://doi.org/10.1108/02651330710741802
Simon, S. J. (2001). The impact of culture and gender on web sites. ACM SIGMIS Database, 32(1), 18–37. https://doi.org/10.1145/506740.506744
Singh, N., & Matsuo, H. (2002). Measuring cultural adaptation on the web: a study of US and Japanese web sites. In Advances in Consumer Research (pp. 271–272). Association for Consumer Research.
Singh, N. (2003). Culture and the world wide web: A cross-cultural analysis of web sites from France, Germany and USA. In AMA Winter Educators’Conference Proceedings (vol. 14). American Marketing Association.
Singh, N., Zhao, H., & Hu, X. (2003). Cultural Adaptation on the Web. Journal of Global Information Management, 11(3), 63–80. https://doi.org/10.4018/jgim.2003070104
Singh, N., & Baack, D. W. (2006). Web Site Adaptation: A Cross-Cultural Comparison of U.S. and Mexican Web Sites. Journal of Computer-Mediated Communication, 9(4), 71–86. https://doi.org/10.1111/j.1083-6101.2004.tb00298.x
Singh, N., Kumar, V., & Baack, D. (2005a). Adaptation of cultural content: evidence from B2C e‐commerce firms. European Journal of Marketing, 39(1/2), 71–86. https://doi.org/10.1108/03090560510572025
Singh, N., Zhao, H., & Hu, X. (2005b). Analyzing the cultural content of web sites. International Marketing Review, 22(2), 129–146. https://doi.org/10.1108/02651330510593241
Singh, N., Park, J. E., & Kalliny, M. (2012). A framework to localize international business to business web sites. ACM SIGMIS Database, 44(1), 56. https://doi.org/10.1145/2436239.2436243
Steenkamp, J. E. M. (2001). The role of national culture in international marketing research. International Marketing Review, 18(1), 30–44. https://doi.org/10.1108/02651330110381970
Tang, L., & Koveos, P. E. (2008). A framework to update Hofstede’s cultural value indices: economic dynamics and institutional stability. Journal of International Business Studies, 39(6), 1045–1063. https://doi.org/10.1057/palgrave.jibs.8400399
Vyncke, F., & Bergman, M. (2010). Are culturally congruent websites more effective? An overview of a decade of empirical evidence. Journal of Electronic Commerce Research, 11(1), 14–29.
Wurtz, E. (2005). Intercultural Communication on Web sites: A Cross-Cultural Analysis of Web sites from High-Context Cultures and Low-Context Cultures. Journal of Computer-Mediated Communication, 11(1), 274–299. https://doi.org/10.1111/j.1083-6101.2006.tb00313.x
Yalcin, S., Singh, N., Dwivedi, Y. K., Apil, A. R., & Sayfullin, S. (2011). Culture and localization on the web: Evidence from multinationals in Russia and Turkey. Journal of Electronic Commerce Research, 12(1), 94–114.
Yin, R. K. (2014). Case Study Research Design and Methods. Sage.
153 ACTA INFORMATICA PRAGENSIA Volume 09 | Number 02 | 2020
Zandpour, F., Campos, V., Catalano, J., Chang, C., Cho, Y. D., Hoobyar, R., Jiang, S., Lin, M., Madrid, S., Scheideler, H., & Osborn, S. T. (1994). Global Reach and Local Touch: Achieving Cultural Fitness in TV Advertising. Journal of Advertising Research, 34(5), 35–63.
Copyright © 2020 by the author(s). Licensee Prague University of Economics and Business, Czech Republic. This article is an open access article distributed under the terms and conditions of the Creative Commons Attribution License (CC BY), which permits use, distribution and reproduction in any medium, provided the original publication is properly cited, see http://creativecommons.org/licenses/by/4.0/. No use, distribution or reproduction is permitted which does not comply with these terms.
The article has been peer-reviewed.
Editorial record: First submission received on 29 May 2020. Revisions received on 30 August 2020 and 17 September 2020. Accepted for publication on 21 September 2020. The editor in charge coordinating the peer-review of this manuscript and approving it for publication was Stanislava Mildeova .