cultural tourism investment and resident quality of life
89
CULTURAL TOURISM INVESTMENT AND RESIDENT QUALITY OF LIFE: A CASE STUDY OF INDIANAPOLIS, INDIANA Christopher Scott Gullion Submitted to the faculty of the University Graduate School in partial fulfillment of the requirements for the degree Master of Science in the Department of Tourism, Conventions, and Event Management, Indiana University May 2013
Transcript of cultural tourism investment and resident quality of life

CULTURAL TOURISM INVESTMENT AND
RESIDENT QUALITY OF LIFE:
A CASE STUDY OF INDIANAPOLIS, INDIANA
Christopher Scott Gullion
Submitted to the faculty of the University Graduate School in partial fulfillment of the requirements
for the degree Master of Science
in the Department of Tourism, Conventions, and Event Management, Indiana University
May 2013
ii
Accepted by the Faculty of Indiana University, in partial fulfillment of the requirements for the degree of Master of Science.
_________________________________
Sotiris Hji-Avgoustis PHD, Chair
_________________________________
Yao-Yi Fu PHD
_________________________________
Soonhwan Lee DSM, MS
Master’s Thesis Committee

iii
DEDICATION
This thesis is dedicated to the loving memory of
Kermit and Phyllis Toler; and Ernie and Lavon Gullion.

iv
ACKNOWLEDGEMENTS
It is important for me to give thanks to the many people who helped me in the
production of this thesis. If it were not for the continued support of my thesis committee,
fellow colleagues, family and friends, this thesis would not have been possible.
I must give thanks to Sotiris Hji-Avgoustis, chair of my thesis committee, for his
excellent guidance. I give thanks to committee members Yao-Yi Fu and Soonhwan Lee
for guiding me and going over various drafts of the thesis. I also give thanks to Thomas
Jackson, Senior Consultant at the Indiana Statistical Consulting Center at Indiana
University for his guidance and support concerning statistical methods used in this thesis.
I give thanks to Carina King, Suosheng Wang, Amanda Cecil, Rafael
Bahamonde, and James Gladden for making my transition into the Department of
Tourism, Conventions, and Event Management as smooth as possible and providing the
education and assistance I needed to achieve my goals. I extend this thanks to the
entire School of Physical Education and Tourism Management.
I acknowledge the staff of the University Library at Indiana University – Purdue
University – Indianapolis for their help in location of services and articles that assisted in
the production of this thesis.
Lastly, but certainly not least, I would like to give thanks to my family and
friends. If it was not for the continued love and support of my mother Daisy, father
Steven, and fiancé Jessica Waskom this thesis would not have been possible. I give a
very special thanks to Jordan McBride and Kira Davad Ferris for their help and
camaraderie during my graduate studies.

v
ABSTRACT
Christopher Scott Gullion
CULTURAL TOURISM INVESTMENT AND QUALITY OF LIFE:
A CASE STUDY OF INDIANAPOLIS, INDIANA
This thesis will explore issues concerning cultural tourism investment and
resident quality of life in the Midwestern city of Indianapolis, Indiana. It is important to
understand from a cultural tourism perspective how further attempts to grow and invest in
tourism will affect resident perception of quality of life and future cultural tourism
investment. To achieve this goal, data from the 2012 Indianapolis Quality of Life survey
was statistically analyzed to specifically examine how residents’ perceived quality of life
affects cultural tourism investment. This allows for the study of what city-service
attributes (i.e. safety, attractions, transportation, et cetera) identify as potential indicators
of whether residents’ perception of quality of life affects cultural tourism investment and
if there were any correlations between demographic factors of age, gender, ethnicity, and
household income with the perception that investing in cultural events and attractions for
tourists is good for residents.
Results indicated that several key city-service attributes identify as potential
indicators of whether residents’ perception of quality of life in Indianapolis affects
residents’ perceptions that investing in cultural tourism for tourists is good for residents.
In addition, several key city-service attributes identified as potential indicators of
residents’ perception of quality of life in Indianapolis excluding perceptions of cultural

vi
tourism investment. Finally, results indicated that demographic factors of gender, age,
ethnicity, and income were not significant when it came to affecting the perception that
investing in cultural events and attractions for tourists is good for residents.
Sotiris Hji-Avgoustis PHD, Chair

vii
TABLE OF CONTENTS
List of Tables ................................................................................................................ix List of Figures ...............................................................................................................x List of Plates .................................................................................................................xi Chapter One: Introduction ............................................................................................1 Background of the Study ..............................................................................................3 Statement of the Problem ..............................................................................................6 Purpose of the Study .....................................................................................................6 Hypothesis.....................................................................................................................6 Need for Study ..............................................................................................................7 Delimitations .................................................................................................................9 Limitations ....................................................................................................................9 Assumptions ..................................................................................................................9 Definitions.....................................................................................................................10 Chapter Two: Literature Review ..................................................................................13 Introduction ...................................................................................................................13 Resident Satisfaction and Tourism Development Support ...........................................13 Indicators of Resident Perceptions of Cultural Tourism..........................................18 Demographic Factors ...............................................................................................20 Quality of Life of Residents in Urban Environments ...................................................22 Impacts of Cultural Tourism .........................................................................................25 Summary .......................................................................................................................28 Chapter Three: Methodology ........................................................................................30 Introduction ...................................................................................................................30 Preparations and Location.............................................................................................30 Selection of Subjects .....................................................................................................31 Procedures for Data Collection .....................................................................................31 Instrument Design .........................................................................................................32 Method of Analysis .......................................................................................................33 Summary .......................................................................................................................35 Chapter Four: Data Analysis and Discussion ...............................................................36 Introduction ...................................................................................................................36 Sample Characteristics .................................................................................................37 Effects of City-Service Attributes and Quality of Life on Cultural Tourism Investment ......................................................................................................39

viii
Effects of Demographics on Cultural Tourism Investment ..........................................56 Summary .......................................................................................................................58 Chapter Five: Summary, Implications, and Recommendations....................................60 Summary .......................................................................................................................60 Implications...................................................................................................................60 Recommendations .........................................................................................................61 Appendices Appendix A: 2012 Indianapolis Quality of Life Survey ...............................................64 Appendix B: Zip Code Data ........................................................................................69 References .....................................................................................................................71 Curriculum Vitae

ix
LIST OF TABLES Table 1: Survey Items Used in Study ....................................................................................36 Table 2: 2012 Indianapolis Quality of Life Survey Demographic Profile .............................38 Table 3: Pearson Correlations of City-Service Attributes .....................................................41 Table 4: Descriptive Statistics of City-Service Attributes .....................................................41 Table 5: ANOVA for Analysis of City-Service Attributes and Resident Perception of Quality of Life ............................................................................................42 Table 6: Parameter Estimates of City-Service Attributes ......................................................44 Table 7: Simple Main Effects for City-Service Attributes ....................................................47 Table 8: Simple Main Effects for Resident Perception of Quality of Life ............................48 Table 9: ANOVA for Analysis of Demographics and Perception of Cultural Tourism Investment ..........................................................................................................57 Table 10: ANOVA for Analysis of Demographics and Resident Perception of Quality of Life...................................................................................................................58 Table 11: 2012 Indianapolis Quality of Life Survey Zip Code Data .....................................69
x
LIST OF FIGURES Figure 1: Simple Main Effects of item 8N with item 5A and item 7 .....................................50 Figure 2: Simple Main Effects of item 8N with item 5B and item 7 .....................................51 Figure 3: Simple Main Effects of item 8N with item 5G and item 7 .....................................52 Figure 4: Simple Main Effects of item 8N with item 5H and item 7 .....................................53 Figure 5: Simple Main Effects of item 8N with item 5I and item 7 ......................................54 Figure 6: Simple Main Effects of item 8N with item 5J and item 7 ......................................54 Figure 7: Simple Main Effects of item 8N with item 5K and item 7 .....................................55

xi
LIST OF PLATES Plate 1: 2012 Indianapolis Quality of Life Survey Zip Code Map Top Eight Reported Zip Codes .........................................................................................70

1
Chapter One
INTRODUCTION
The question of whether tourism has positive or negative impacts on the perceived
quality of life of residents is an ongoing debate in the field of tourism studies. These
economical, societal, and psychological impacts are important to examine in the wake of
tourism growth in the Midwestern city of Indianapolis, Indiana. Uniquely, this study will
examine how cultural tourism investment is affected by residents’ perception of quality
of life and if there are any potential indicators of this interaction.
Indianapolis is a burgeoning cultural and sports tourism market that seeks to
attract tourists to the city and reinvigorate residents. As tourism has grown in
Indianapolis, the Department of Tourism, Conventions and Event Management at Indiana
University – Purdue University – Indianapolis (IUPUI) identified the need to study the
impacts of this growth on the perceived quality of life of residents of the city. Residents’
perceived quality of life is important to study because, as according to Faulkner and
Tideswell (2010), the impacts of tourism must be monitored on a continuous basis in
order to avoid negative effects. Specifically, it is important to measure aspects such as,
“mental and physical happiness, culture, and environmental health and safety” (Cecil, Fu,
Wang, & Avgoustis, 2010). The continued study of these aspects is important to analyze
because tourism programs and policies often rely heavily on economic statistics, which
can thus create imbalanced results (Cecil, Fu, Wang, & Avgoustis, 2010). Tourism
development, according to Hester (1990), is often treated as the “panacea for poverty”
despite the fact that for many communities tourism development brings forth a loss of
community, local culture and traditions, and the destruction of valuable cultural and

2
natural resources. According to McCool and Martin (1994), tourism should help promote
resident quality of life and it is important to study resident attitudes in order to better
handle negative impacts of tourism.
The best way to gauge resident quality of life is by directly surveying residents in
the city of Indianapolis to measure their perception of quality of life and to evaluate their
observations concerning cultural tourism development and investment (Cecil, Fu, Wang,
& Avgoustis, 2010). This allows for the relationship between residents’ perceived
quality of life and cultural tourism development and investment to be explored. Much of
the background research concerning resident quality of life in Indianapolis has been done
in the last nine years. This research has been conducted from within the Department of
Tourism, Conventions, and Event Management at IUPUI. Research has focused on the
development of a measure to study quality of life of the resident population of
Indianapolis and assess the impacts of tourism on the local population.
Each year from 2004 to 2012, a research team of faculty, undergraduate and
graduate students employs a convenience sampling technique to survey residents in high-
traffic areas of downtown Indianapolis. All research participants voluntarily submit to
the survey and must be eighteen years of age or older and live in Indianapolis or the
surrounding counties. Face-to-face surveys were utilized due to the higher response rate
in comparison to other survey methods (Cecil, Fu, Wang, & Avgoustis, 2008).
In order to develop equilibrium between tourist satisfaction and resident quality of
life, cities such as Indianapolis, must encourage future economic growth, embrace
cultural tourism and embark on initiatives to develop and expand tourism development
(Wang, Fu, Cecil, & Avgoustis, 2006). These stark changes do not have to come at the

3
cost of resident quality of life and through the study of resident perceptions and desires,
the negative effects of tourism can be mitigated.
Background of the Study
After a series of cultural tourism initiatives in Indianapolis beginning in 2002
aimed at improving resident quality of life, a study was developed to evaluate non-
economic measures for the city of Indianapolis before full implementation of these
initiatives took place (Avgoustis, Cecil, Fu, & Wang, 2005). One of the main purposes of
the study was to establish a baseline index of how residents view their own quality of life
and also determine any “relationships between the level of awareness by residents of the
city’s cultural tourism initiative and their quality of life ratings” (Avgoustis, Cecil, Fu, &
Wang, 2005). This study focused on three dimensions to determine if a relationship
between quality of life and cultural tourism awareness exists (Avgoustis, Cecil, Fu, &
Wang, 2005). These three dimensions (physical characteristics, environmental
characteristics and emotional, mental and spiritual characteristics) were adapted from a
model developed by Raphael, Steinmetz, and Renwick (1998). This model, which was
originally a health-based approach to studying community quality of life in Toronto,
Canada and other North American cities, was a useful tool because it put emphasis on
resident perceptions of what they determine as satisfactory in regards to quality of life
(Avgoustis, Cecil, Fu, & Wang, 2005). The results of this study indicated that resident
perceptions of the three dimensions “significantly correlated with their understanding of
cultural tourism in Indianapolis” (Avgoustis, Cecil, Fu, & Wang, 2005).
In 2007 a study was published that focused on predicting residents’ perceptions of
cultural tourism attractiveness. This study did not research resident quality of life, but

4
certain aspects of the Indianapolis Quality of Life study were utilized in this study. Since
the purpose of this study was to measure residents’ perceptions of the city’s cultural
tourism development, certain attributes were developed to better measure this aspect.
Twenty-six city-service attributes were developed that represented different city-services
and facilities in Indianapolis; such as, parks, transportation, and safety (Fu, Cecil, Wang,
& Avgoustis, 2007). Several items regarding safety, transportation, infrastructure,
cleanliness, and attractions/shopping that were refined in this study would be
incorporated into future Indianapolis quality of life studies.
In 2008 a continuation of the Indianapolis Quality of Life study was published
with 2006 survey data. The purpose of this study was to analyze trends in the data since
the first study in 2004. The 2006 study was post full implementation of cultural tourism
initiatives by the city of Indianapolis that were aimed at improving resident quality of
life. This study measured the same three dimensions and as in the 2004 study results
indicated that resident perceptions of the three dimensions had significant correlation
with their understanding of cultural tourism in Indianapolis (Cecil, Fu, Wang, &
Avgoustis, 2008).
In 2010, consecutive year’s longitudinal data from the Indianapolis Quality of
Life study was published. The research reported five-year study data collected between
2004 and 2008. The goal of the study was to analyze overall trends in the data since the
first study in 2004. It is indicated that throughout the study certain quality of life
attributes have been included in the survey. These additions were five-point Likert-scale
questions that were grouped into the following five categories: overall health, frequency
of physical activity, happiness, stress level, and sense of community (Cecil, Fu, Wang, &

5
Avgoustis, 2010). An additional five-point Likert-scale question, “overall satisfaction
with the quality of life in Indianapolis”, was added in the 2007 and 2008 survey (Cecil,
Fu, Wang, & Avgoustis, 2010).
In addition, cultural tourism and sports tourism related items were developed.
These items asked residents to reflect upon their awareness of cultural tourism/sports
tourism campaigns, perceived benefits of cultural tourism/sports tourism to the city, their
satisfaction and enjoyment with tourism, dependence on public and private support, and
the overall potential success of cultural tourism/sports tourism marketing campaigns in
Indianapolis (Cecil, Fu, Wang, & Avgoustis, 2010). The study measured the consistent
items in the survey from 2004 to 2008; such as, enjoyment of cultural attractions,
awareness of accomplishments and potential future success (Cecil, Fu, Wang, &
Avgoustis, 2010).
Results indicated steady improvement in overall resident awareness of cultural
tourism campaigns and the study concluded “that there are no evidence to differentiate
individuals’ perceptions of their quality of life based upon one’s gender, age, ethnicity,
income, and length of residency” (Cecil, Fu, Wang, & Avgoustis, 2010). Overall the
results indicate that there were not any significant increases in quality of life ratings of
Indianapolis residents in relation to cultural tourism development and there were no
strong relationships between residents’ overall quality of life and their perceptions of the
importance of cultural tourism development (Cecil, Fu, Wang, & Avgoustis, 2010). An
implication from this study suggests that resident level of awareness pertaining to the
importance of cultural tourism development is still low and there is room for

6
improvement in marketing and support for cultural tourism initiatives in Indianapolis
(Cecil, Fu, Wang, & Avgoustis, 2010).
Statement of the Problem
The problem of the study was to examine how residents’ perceived quality of life
affects cultural tourism investment. This study utilizes research regarding resident
quality of life conducted by Amanda Cecil, Yao-Yi Fu, Suosheng Wang, and Sotiris Hji-
Avgoustis from the Department of Tourism, Conventions and Event Management within
the School of Physical Education and Tourism Management at IUPUI.
Purpose of the Study
The purpose of the study was to examine city-service attributes to determine if
they act as potential indicators of whether residents’ perception of quality of life affects
cultural tourism investment using data from the 2012 Indianapolis Quality of Life Study.
This data was used to determine what residents thought concerning various city-service
attributes and cultural tourism in Indianapolis. Demographic information was also
collected. The study addressed the problem with the following research questions:
− What city-service attributes are identified as potential indicators of whether
residents’ perception of quality of life affects cultural tourism investment?
− Were there any correlations between demographic factors of age, gender,
ethnicity, and household income with the perception that investing in cultural
events and attractions for tourists is good for residents?
Hypothesis
For this study two null hypotheses were utilized as a guide to examine how
residents’ perceived quality of life and demographics affect cultural tourism investment.
7
− There are no city-service attributes that serve as potential indicators of
whether residents’ perception of quality of life affects cultural tourism
investment.
− There are no correlations between demographic factors such as; age, gender,
ethnicity, and household income with the perception that investing in cultural
events and attractions for tourists is good for residents.
Need for the Study
Indianapolis is built for tourism and as tourism continues to grow it is vital to
study the impacts of tourism on residents (Indianapolis Convention & Visitors
Association, 2012; Wang Fu, Cecil & Avgoustis, 2006; Wood, 2007). According to
Cecil, et al (2010) the impacts of cultural tourism in urban environments are not well
understood. In an urban environment it is crucial to achieve social and economic
prosperity. A catalyst for this prosperity is a robust economy spurned by strong
development in various economic sectors including tourism. In addition, it is essential to
have a safe place for residents to live, access to education and housing, ample community
involvement, and art and entertainment experiences for residents to enjoy.
According to Anderreck and Nyaupane (2010), improvements in quality of life
can be achieved through the “development of tourism products that can also be enjoyed
by residents, such as festivals, restaurants, natural and cultural attractions, and outdoor
recreation opportunities”. Indianapolis’ efforts to improve quality of life for residents
and also improve cultural tourism offerings has manifested in various forms.
Indianapolis hosts many cultural and ethnic festivals; invests in museums such as the
Eiteljorg Museum of American Indians and Western Art, Indianapolis Children’s

8
Museum, Indianapolis Museum of Art, and the Indiana State Museum; and is continuing
to develop the Cultural Trail which connects all five downtown cultural districts. These
might be important developments for cultural tourism but it is also crucial to maintain
and develop services that promote resident satisfaction with cultural tourism (Cecil, Fu,
Wang, & Avgoustis, 2008).
Growth in Indianapolis tourism can be expected to climb with recent tourism
achievements such as the 2012 Super Bowl, which promoted greater tourist awareness of
the city and, as many of these large-scale events do, it encouraged creation of new
facilities and infrastructure (Indianapolis Convention & Visitors Association, 2012).
New facilities and infrastructure include: Lucas Oil Stadium; additions to the Indiana
Convention Center which now offers 745,000 square feet of exhibition space; a brand
new one-thousand room J.W. Marriott hotel; and city-wide beautification planning
(Indianapolis Convention & Visitors Association, 2012). According to the Indianapolis
Convention & Visitors Association (2012) twenty-two million visitors (up from twenty
million in 2010) were attracted to Indianapolis in 2011 and generated roughly $3.95
billion dollars in economic impact.
It is important then, to understand from a cultural tourism perspective how further
attempts to grow and invest in cultural events and attractions will affect resident
perception of quality of life and vice-versâ. This study will benefit the continued study of
tourism impacts in Indianapolis and other communities while providing beneficial
information regarding resident quality of life and cultural tourism investment.

9
Delimitations
The following are delimitations of this study and the 2012 Indianapolis Quality of
Life survey:
− Study participants were selected using a convenience sampling technique during
various cultural and sporting events in the city of Indianapolis during September
and October of 2012.
− Focus of this study is solely on cultural tourism and excludes sports tourism (see
definitions). Note: This is only a delimitation of the study not the survey.
− Study participants must be 18 years of age and Indianapolis residents or residents
of the surrounding counties.
Limitations
The following are limitations of this study and the 2012 Indianapolis Quality of
Life survey:
− Attitudes of the sampled population may have been influenced by the cultural and
sporting events they were attending and/or were occurring during the survey
period.
− Data gathered is self-reported and thus cannot be independently verified and may
be biased (the sampled population was primarily people attending cultural and
sporting events).
Assumptions
This study and the 2012 Indianapolis Quality of Life survey were conducted
based on the following assumptions:
− Participants responded truthfully.
10
− Participants were residents of Indianapolis and/or the surrounding counties.
− Participants were at least 18 years of age.
Definitions
It is important for this study to define ‘cultural tourism’ and ‘quality of life’;
which the definitions will serve two main purposes: (1) to establish for the reader what
cultural tourism and quality of life can encompass and (2) to better utilize the 2012
Indianapolis Quality of Life survey.
So what is cultural tourism? This question, which is seemingly easy to answer, is
actually a quite complicated consideration. This problem stems from the troubles of
defining culture itself; a problem that has long intimidated philosophers and
anthropologists. English anthropologist Edward Tylor defined culture as a “complex
whole that incorporated knowledge, belief, art, morals, laws, and customs that are
acquired as a member of society” (Tylor, 1871). American anthropologist Clifford
Geertz once defined culture in a more symbolic approach as:
“an historically transmitted pattern of meanings embodied in symbols, a
system of inherited conceptions expressed in symbolic forms by means of
which men communicate, perpetuate, and develop their knowledge about
and their attitudes toward life” (Geertz, 1973).
If we understand cultural tourism to encompass a cultures art, morals, beliefs,
customs and knowledge, then we must consider the scope of things that fall under
cultural tourism to be quite large. The 2012 Indianapolis Quality of Life survey will
utilize the following cultural tourism definition: ‘experiencing the diverse mosaic of
places, traditions, arts, celebrations and experiences that the Indianapolis area offers to

11
residents and visitors. It is an important component of an overall tourism plan that
emphasizes the total Indianapolis experience’. This definition is actually written on the
survey for respondents to read and consider while answering various cultural tourism and
quality of life related questions.
In the end, what people consider cultural tourism will vary vastly; some may
consider sporting events cultural tourism, while others would not; and some people may
only consider attractions such as outdoor theatre and art galleries to be cultural tourism.
Although the definition does leave out sporting events (another section of the 2012
Indianapolis Quality of Life survey defines and asks questions related to sports tourism),
the definition encompasses what is typically considered cultural tourism.
Quality of life can be vague, not easily defined, and have different meanings for
different people. The World Health Organization defines quality of life as: “individuals’
perception of their position in life in the context of the culture and value systems in which
they live and in relation to their goals, expectations, standards and concerns” (World
Health Organization, 1997). As Lloyd and Little (2007) remark; quality of life “is
considerably value-laden and values differ across individuals and cultures”. Thusly, as
Iwasaki (2007) suggests “people living in different situations see different things as
essential to a meaningful existence”. For some a high quality of life may mean better
schools and better access to healthcare; while for others a high quality of life may signify
wealth or access to leisure activities. For this thesis I have chosen to utilize the World
Health Organizations definition of quality of life. This definition has been repeated by
others in the field, namely Iwasaki (2007), and illustrates the importance of individuals’

12
perception concerning quality of life and does not interfere with the continuation of this
study.

13
Chapter Two
LITERATURE REVIEW
Introduction
The purpose of the study was to examine city-service attributes to determine if
they act as potential indicators of whether residents’ perception of quality of life affects
cultural tourism investment. This literature review highlights the importance of tourism
impact studies and demonstrates the varying viewpoints concerning how best to study
and measure these impacts. As cultural tourism continues to grow throughout the world
and in cities like Indianapolis, it is important to examine research related to cultural
tourism impacts and resident quality of life (Wang, Fu, Cecil, & Avgoustis 2006; Wood,
2007).
This chapter reviews the existing literature regarding the study of cultural tourism
and related impacts on quality of life and cultural tourism development. The literature
review begins with a general overview of resident satisfaction and tourism development
support, which discusses indicators of resident perceptions of cultural tourism and
demographic factors. Next, a review of literature concerning the quality of life of
residents in urban environments is presented; followed by a review of literature
concerning the impacts of cultural tourism. Ultimately, it is important to have a thorough
understanding of previous work so that we can better interpret the role that cultural
tourism has in the life of residents of Indianapolis.
Resident Satisfaction and Tourism Development Support
To better understand residents’ perceived quality of life and the impacts of
cultural tourism in cities such as Indianapolis it is beneficial to review factors affecting
14
resident satisfaction and tourism development. Cities are frequently using events such as
the Olympics, World Fairs, and the Super Bowl; which are unmistakably important in
terms of marketing and tourism benefits, to encourage tourism development and growth
(Richards & Wilson, 2004). These events often spur revitalization of the local economy,
infrastructure improvements, and improvement of city image (Richards & Wilson, 2004).
Though these large scale events are important it is also vital to remain loyal to local
culture, customs, and ideology (Jelincic, 2002). Thus, as often is the case, these local
cultures and customs are promoted through tourism development as cities seek new ways
of attracting visitors (Richards & Wilson, 2004). If cultural events are properly planned
and managed, they can contribute considerably to the local economy, especially if these
events are considered as “attractors of tourist flows” (Bracalente, et al., 2011). The
‘cultural environment’ of cities and rural areas is an important stimulus for tourism, but
resident concerns must be considered during all stages of tourism development (Throsby,
2009).
Though tourism development is vital to the longevity of cultural events held
within cities such as Indianapolis; inevitably, gaps emerge between support for tourism
development and resident satisfaction (McCool & Martin, 1994). It is at this juncture
when the development and promotion of cultural events, festivals, and various other
events for tourists meets scrutiny (Twynam & Johnston, 2010; Getz 1991). Andereck
and Vogt (2000) discuss that though the impacts of tourism have been studied for a long
time, little effort and time has been devoted to studying the relationship between resident
attitudes and support for tourism development. This development has the potential to

15
have lasting impacts on local residents and according to Ramkissoon and Nunkoo (2011);
“tourism has been found to alter the social and internal structure of a society”.
Brida, Disegna, and Osti (2011) advise that since successful tourism development
relies on the generosity of local residents it is crucial to respect the desires of the resident
population. Brida, et al studied tourism impacts and attitudes toward tourism policies and
discovered that while residents agreed that tourism attracted more investments and
spending, tourism is also believed to have increased the price of local goods and services
(including real estate) for residents (Brida, Disegna, & Osti, 2011). These negative
aspects can have strong negative influences on residents’ perception of tourism.
A key step in tourism development plans is gaining resident support, thus it is
important to understand what shapes residents attitudes toward tourism. Ross (1992)
along with Cooke (1982) and Loukissas (1983) suggest that greater care should be taken
with tourism development so as to avoid any potential negative impacts for residents.
According to Matarrita-Cascante (2010), interaction between residents and tourists
promotes the exchange of ideas which can lead to economic and social progress, but as
McCool and Martin (1994) discuss, tourism can bring forth challenges for residents that
other industries do not, such as; crime increases, disruption, population increases,
conflicts in values, and impacts on local culture. Oviedo-Garcia, et al (2008) explores
residents’ perceptions of tourism and highlights economic, cultural, and environmental
effects as being determinants of residents’ attitudes towards tourism development and
planning. It is determined that the level of personal benefits gained from tourism
influences resident perceptions regarding tourism impacts, thus affecting resident support
of tourism development and planning (Oviedo-Garcia, Castellanos-Verdugo, & Martin-

16
Ruiz, 2008). Thus, it is crucial to consider the divide between residents who receive
social and economic benefits from tourism and those who do not. Sharma and Dyer
(2009) studied this dilemma and discovered that people who receive direct economic
benefit from tourism were more likely to agree with statements concerning economic
benefits and were less likely to agree with statements concerning negative impacts of
tourism. The study highlights the fact that there is an association between the level of
resident involvement with tourism and their perceived social and economic benefit from
tourism. This study has unique implications for tourism development in that policies
should focus on providing jobs and attracting investments into the community, which can
benefit resident quality of life. Aref (2011) suggests the strongest tourism impacts are
often linked with emotional and community well-being, and income and employment.
Tourism development will create divides amongst residents who support
development and those who do not. This can be due to loyalty to tourism development
either from social or economic perspectives and this will impact perceptions of tourism
and quality of life (Andriotis & Vaughan, 2003). Andriotis and Vaughan (2003) state
that, “benefits from tourism are often concentrated in the hands of a limited number of
people who have the capital to invest in tourism at the expense of other segments of the
community”. This can be magnified in urban environments and thus anti-tourist
segments can emerge. Careful tourism development planning can help prevent such
negative tourism outcomes and provide balance in the local community. Studies
conducted by Chen (2000), which explored urban residents’ attitudes toward tourism
development and sought to understand their perceptions of tourism and Chen (2001) that
explored the development of a tourism impact assessment scale have made important

17
leaps in the understanding of the impacts that cultural tourism has on residents in urban
environments. Chen (2000) indicated that residents loyal to tourism development
overlooked negative impacts; while non-loyal residents were more concerned with
infrastructure problems and land value. This study highlights the importance of
evaluating the essential role that residents in urban environments play in tourism
development.
Kim (2002) studies how tourism development affects resident satisfaction and
discusses how residents’ attitudes toward tourism change during different levels of
tourism development. For example, during early stages of tourism development some
residents may feel stress when demand for more public services and infrastructure is at its
peak; while during the maturation stage of tourism development resident satisfaction is
often higher. Getz (1994) supports the notion that as tourism passes the maturation stage
of development resident support can often decrease. Economic downturns, tourism
facility declination, and the failure of tourism to provide desired benefits to residents can
result in increased negative attitudes toward tourism (Getz, 1994). These development
stages appear to be an expansion or progression from Doxey’s Irridex. The term irridex
refers to ‘irritation continuum’, and describes how interactions between resident and
tourist change from desirable to antagonistic through the stages of tourism development
(Smith & Krannich, 1998). G.V. Doxey’s 1975 work established principal models of
resident attitudes, which according to Harrill (2004) were used to “define attitudes of
residents resulting from social impacts in a destination community”. Doxey’s model
suggests that early stages of tourism development are met with optimism concerning the
economic potential that tourism offers. Later stages of development, however, are met

18
with increased resident apathy which can thus lead to stages of annoyance and
antagonism (Harrill, 2004).
Indicators of Resident Perceptions of Cultural Tourism
There are many factors that can effect resident satisfaction and acceptance of
tourism development. Explaining and predicting success of cultural tourism is an
important topic in tourism studies related to resident satisfaction and quality of life. As
mentioned in chapter one, it is important to identify potential predictors and indicators of
whether resident perception of quality of life affects cultural tourism investment because
these factors could be potentially useful in continuing studies related to cultural tourism
investments and resident perception of quality of life. So what are predictors and
indicators? A predictor variable is essentially an independent variable that may
potentially represent a ‘cause’; whereas an indicator may not be a direct cause but
‘points’ researchers in the direction of a potential cause (Furr & Bacharach, 2008).
Diener and Suh (1997) discuss economic, social and subjective indicators of quality of
life and suggest that social indicators and subjective well-being measures are crucial in
evaluating society. Diener and Suh state that ‘objective’ social indicators like homicide
rates are based on quantitative statistics rather than subjects perceived notion of well-
being and subjective well-being indicators primarily deal with respondents own “internal
judgment of well-being”.
A 2009 study by Yamada, Heo, King, and Fu investigated the relationship
between urban residents’ life satisfaction and five life domains; these domains were
health perception, wealth, safety, community pride, and cultural tourism (Yamada, Heo,
King, & Fu, 2009). This study was concerned with what makes people happy and what

19
affects life satisfaction. Results indicated these five life domains were significantly
related to life satisfaction; interestingly health perception, wealth and community pride
were the strongest indicators. Furthermore, a positive relationship was found between
cultural tourism and life satisfaction, which is important for the continued study of
cultural tourism impacts on resident quality of life. As Cecil, et al (2008) suggest, the
quality of life in urban populations is important if a city such as Indianapolis hopes to
achieve strong economic prosperity through tourism development.
Faulkner and Tideswell (2010) report relatively positive attitudes toward tourism
development in the urban sprawl of the Gold Coast of Australia. As tension between
tourism and urban development rise, the authors determine that residents’ involvement in
tourism, proximity to tourist activity, and length of residence were notable attributes that
effected resident perception of tourism. In addition, and as suggested by Cecil, et al
(2010), in destinations with mature tourist infrastructure and support, residents were less
antagonistic toward tourism (Faulkner & Tideswell, 2010).
Fu, Cecil, Wang, and Avgoustis (2007) identify city-service factors that predict
success of cultural tourism from residents’ point-of-view. Twenty-six city-service
attributes (social indicators) were developed that represented different city-services and
facilities in Indianapolis; such as, parks, transportation and safety (Fu, Cecil, Wang, &
Avgoustis, 2007). In addition, two objectives were identified (1) “To what extent can the
variation of attractiveness of cultural tourism be explained by the set of city-service
attributes”? (2) “Which city-service dimensions may play a significant role in
determining Indianapolis’ attractiveness as a cultural tourism destination based on the
perceptions of Indianapolis residents”? Fu, et al (2007) conclude that
20
“landscape/architectural services, hospitality services, transportation/infrastructure
services and leisure services” were important city-service factors that predict success of
cultural tourism in Indianapolis. Fu, et al suggest that the main objective of a city’s
cultural tourism initiative is “to increase residents’ awareness of the city’s cultural
attractions and their cultural participation” and thus the more awareness residents have of
cultural tourism the more likely they will be to support it.
Demographic Factors
McGehee and Andereck (2004) examined factors predicting resident attitudes
toward tourism in various communities in Arizona. The authors state that there have
been numerous studies attempting to find relationships between an individual’s
characteristics (demographics, personal benefits from tourism, community attachment, et
cetera) and attitudes toward tourism development. Generally, studies have shown that
residents whose livelihood depends on the tourism industry or “perceive a greater level of
economic gain tend to have a more positive perception of tourism’s economic impact
than other residents” (McGehee & Andereck, 2004). Interestingly, McGehee and
Andereck (2004) suggest that studies are inconclusive as to whether demographics have a
relationship with tourism attitudes.
On the contrary, according to Hong Long and Kayat (2011), demographics often
play an integral part in the understanding and acceptance of tourism development and
planning. Hong Long and Kayat (2011) while working on a study in Vietnam to
determine resident perceptions toward tourism development in Cuc Phuong National
Park, discovered that certain demographic factors such as; age, gender, ethnicity, place of
birth, marital status, level of education, income, job status, and length of residency

21
impacted residents’ perceptions toward tourism. Huh and Vogt (2007) identified several
socioeconomic factors that explain resident attitudes’ toward tourism; such as, age,
income, length of residency, and gender. Huh and Vogt suggest that older residents were
more likely to see the positive impacts of tourism and overlook negative impacts.
Furthermore, Huh and Vogt (2007) discuss Girard and Gartners’ 1993 study that
investigated short and long term second homeowners in Wisconsin. The study
discovered that long term residents were less supportive of further tourism development.
This echoes research conducted by McCool and Martin (1994), which concluded that the
longer a resident lives in a community the less supportive of tourism development they
tend to be. In further support of the notion that long term residents tend to have negative
feelings for further tourism development; a study conducted in York, England by Snaith
and Haley (1999) examined various socioeconomic variables; such as, income, age,
gender, length of residence, home ownership, distance of residence and determined that
length of residency and home ownership were associated with their opinions related to
tourism. Residents who were new to York were determined to be less hesitant to further
tourism development (Snaith & Haley, 1999; Huh & Vogt, 2007).
Gender, which is another strong indicator of residents’ attitudes toward tourism,
was determined by Mason and Cheyne (2000) to be an important factor to consider in
regards to tourism development in a rural region of New Zealand. The study found that
though males were more supportive of tourism development than females; females were
often more concerned with the negative impacts of tourism compared to males. In
addition, female respondents indicated that they had higher expectations for future
tourism job placements and business opportunities.

22
Quality of Life of Residents in Urban Environments
This study continues research into resident perception of quality of life in
Indianapolis and focuses specifically on whether resident perception of quality of life
affects cultural tourism investment. Thus, this study will mirror in many respects the
same methodological approach that previous research utilizing the Indianapolis Quality
of Life survey has utilized. In effort to study resident satisfaction/quality of life and
tourism sustainability studies must identify, measure and consider the entire scope of
impacts that tourism can have on the resident population (Yunis, 2004). Most studies
examine structural factors such as various social categories and local attractions; while
others examine the needs and values of residents (Inglehart & Rabier, 1986).
Avgoustis, et al (2005) during development of the Indianapolis Quality of Life
survey utilized an adapted model from Raphael, et al (1998) to design and pilot-test the
survey. That particular study focused attention on certain community dimensions that
affect the quality of life of residents. Quality of life was assessed by the following
indicators: “’being,’ which reflects who the individual is and has physical components;
‘belonging,’ which involves people’s relationship with their environments; and
‘becoming,’ which involves individual activities to achieve individual emotional, mental
and spiritual goals, hopes and aspirations”.
Anderreck and Nyaupane (2010) state that, “few tourism studies have measured
quality of life in the way it is most often measured in sociological studies”, and to
measure quality of life two indicators can be used: (1) objective circumstances, and (2)
subjective circumstances. In addition, Anderreck and Nyaupane suggest that measures
can be absolute or relative and compare quality of life to some ideal standard; studies can

23
also measure aspects of quality of life and community services and how these relate to
resident satisfaction. Objective quality of life measures often include economic factors
such as employment and income; and social factors that include family structure,
recreation and environmental factors (Anderreck & Nayaupane, 2010). Subjective
quality of life measures often focus on emotions and values, happiness, life-satisfaction
and standard of living (Anderreck & Nayaupane, 2010).
For this study it was important to examine quality of life research that
concentrated on urban environments. Urban tourism faces many of the same problems of
rural tourism only in a more concentrated and more populous environment. In rural
communities tourism can often be viewed as a method to bring in fresh economic growth
and prosperity but as Smith and Krannich (1998) suggest, it can also bring negative social
impacts. According to Matarrita-Cascante (2010), rural areas often “lack economic
diversity and adequate infrastructure, rely on a limited number of industries, and contain
a less educated and healthy population”. Nevertheless, rural residents desire to improve
their quality of life and remain proactive in their attempts to control tourism
development. Jurowski and Brown (2001) explored resident involvement in rural tourism
development and discovered that involved residents valued their quality of life higher
than noninvolved residents despite there being “no statistically significant differences in
how involved versus noninvolved citizens evaluate the potential impacts of tourism”.
The involved residents were more interested in tourism that would preserve local culture
and rejected a new convention center and theme parks.
Focusing on urban environments like Indianapolis, Wang, et al (2006) has
suggested that the impact of cultural tourism upon urban environments is still not fully

24
understood. Quality of life studies in urban environments can be especially important
due to the complicated structure of life in cities. Indianapolis, with a city population of
around 830,000 and a metropolitan population of nearly 1,800,000 people, is a big city
that has avoided ‘tourism overkill’ and shares a relative harmonious existence between
tourists and residents (United States Census Bureau, 2012). Nevertheless, negative
impacts of tourists may cause residents to resent tourism. A study done by Queens
University Belfast discovered while monitoring a cultural event for two years that
resident levels of satisfaction with tourism were highest during year one due to the
perceived economic benefits and infrastructure improvements; while in year two resident
satisfaction with tourism declined significantly (Queens University Belfast, 2005).
Policies regarding cultural tourism development were studied by Garcia (2004) in
the context of an urban European environment. The study examines the role of culture in
cities and examines in detail the European City/Capital of Culture program in Glasgow
and Barcelona, which transformed and regenerated cultural activity in these cities.
Garcia suggests five key things to consider for urban markets that may be considering the
development of cultural tourism or hallmark infrastructures: sustainability of capital
investment and building schemes; all levels of community involved in local consultation;
facilitate creation and maintenance of local culture for local consumption and cultural
export; ensure that cultural investments bring communities together and not alienate
people and their environment; and measure the cultural and economic impact of cultural
investments.
To better understand quality of life one must consider residents’ needs and
expectations. Research done for this study focused mainly on resident perceptions of

25
quality of life and resident attitudes toward tourism with less attention paid to economic
indicators of resident quality of life. This is mainly due to the numerous components that
can affect economic satisfaction of residents and due to the fact that the Indianapolis
Quality of Life survey does not specifically address these issues.
Impacts of Cultural Tourism
It is essential to analyze impacts of cultural tourism on resident populations,
particularly in regard to social impacts. Social impacts can focus on numerous issues that
affect the daily and long term lives of residents and these issues are often multifaceted in
nature. After analyzing factors that affect resident satisfaction and quality of life, it is
important to discuss potential positive and negative impacts of cultural tourism.
According to Huh (2002), cultural tourism and heritage tourism are the fasting growing
segments in the tourism industry. Studies concerning cultural tourism have tended to
focus mainly on economic and environmental impacts; however, current research (like
this case study) has begun to consider the consequences of social and cultural impacts on
residents and the local community (Queens University Belfast, 2005). Brunt and Cortney
(1999), state that there is a wide “range of sociocultural impacts related to tourism
development, the tourist-host interaction, and resulting influences”. Societal impacts of
tourism can be so great and lasting that it is prudent to study these impacts before tourism
development plans are initiated. These impacts can lead to long-term and gradual
changes in society, beliefs, and even cultural practices (Brunt & Cortney, 1999). Brunt
and Cortney argue that this is caused by the “demand from tourists of instant culture” and
this may result in the host country becoming “culturally dependent on the tourism
generating country”.
26
Social impacts include various components such as economics, infrastructure, and
other sociopolitical issues. Tourism instigates social changes and can bring about many
new opportunities, thus it can have positive and negative effects on local economies
(Harrison, 1992). Employment is an important issue in regards to tourism development
and as Mathieson and Wall (1982) suggest, “tourism modifies the internal structure of the
community, dividing it into those who have/have not a relationship with
tourism/tourists”. Though this issue might not have any clear resolutions, there are
positive aspects, such as the erosion of gender segregation due to the fact that
“employment in tourism demands flexible working patterns” (Crompton & Sanderson,
1990). In addition, as Urry (1991) suggests, “there are more opportunities for women in
tourism, which provides many with a greater degree of economic independence”. The
socioeconomic benefits that tourism affords are often countered by “dependency and
reinforcement of social discrepancies”, such as congestion and overcrowding (Burns &
Holden, 1995). In addition, Burns and Holden (1995) suggest “pressure for change is
politically intracultural initiated by entrepreneurs or politicians in response to community
pressure”.
Beyond these economic and sociopolitical issues the very infrastructure of cities
and urban areas are impacted as well. Venice, Italy is a prime example of an urban
landscape transformed by tourism. Venice adapted its economy to satisfy the demands of
tourism. This has reshaped Venice’s commercial districts to reflect popular pathways
that tourists often travel while leaving many places often not visited by tourists with
decreasing access to goods sellers and resources (Zanini, Lando, & Bellio, 2008). Urban
tourism has invariably changed the landscape of Venice. The waterfront and St. Mark’s

27
Square were originally “developed for the purpose of receiving tradesmen arriving by
sea” (Zanini, Lando, & Bellio, 2008). Areas like St. Mark’s square are devoid of any
housing and are relegated to commercial use for overpriced eateries, shops, and other
tourist related businesses and uses. Zanini, et al (2008) suggest that “the tourist
phenomenon alters the existing system by pushing the city increasingly towards a tourism
mono-culture and contemporaneously reducing the variability of economic activities
present in the area”.
Not all infrastructural changes are negative as suggested by Demirkaya and Cetin
(2010) in a study concerning social and cultural tourism impacts in Antalya, Turkey.
Findings suggested that tourism development increased the mobility of women and
young adults, infrastructure was improved, supply of services was increased, and
consequently quality of life improved for local residents.
Generally, development for resident benefit is often overshadowed by
development for tourist benefit. Sharpley (1994) asserts that “tourism improves quality
of life through improvements to infrastructure” and usually benefit both residents and
tourists, but as McKercher (1993) suggests, “preference for investment in profit centers
(e.g., swimming pools) rather than cost centers (e.g., sewage systems)” is often the case.
Cultural impacts include influences that affect cultural heritage and sense of
community. Cultural heritage is vital to preserve and is an important factor when
discussing positive and negative effects of tourism. This importance is manifold due to
the fact that cultural resources are often what attract tourists (Borkovic-Vrtiprah & Ban,
2002). Coccossis (2009) explores cultural heritage, sustainable tourism, development
assistance, and various financial and management topics. In relation to topics concerning

28
resident and tourist satisfaction, Coccossis states that “culture and cultural heritage are
crucial to people’s identity, self-respect and dignity”. Coccossis lists positive and
negative impacts of tourism that are crucial to the understanding of resident and tourist
satisfaction. Positive impacts include: “building community pride; enhancing the sense
of identity of a community or region; promoting intercultural/international understanding;
encouraging revival or maintenance of traditional crafts; enhancing external support for
minority groups and preservation of their culture; broadening community horizons;
providing funding for site preservation and management; and enhancing local and
external appreciation and support for cultural heritage”. Negative impacts include:
“commodification and cheapening of culture and traditions; alienation and loss of cultural
identity; undermining of local traditions and ways of life; displacement of traditional
residents; increased division between those who do and do not benefit from tourism;
conflict over (and at times loss of) land rights and access to resources (including the
attractions themselves); damage to attractions and facilities; loss of authenticity and
historical accuracy in interpretation; and selectivity in which heritage attractions are
developed”.
Summary
This chapter presented existing literature regarding the study of cultural tourism
and related impacts on quality of life and cultural tourism development. Specifically,
literature concerning the quality of life of residents in urban environments was reviewed.
Furthermore, impacts of cultural tourism were reviewed; which provided insight into the
various components that can ultimately affect resident quality of life. Importantly,
literature concerning resident satisfaction and tourism development support was

29
discussed. In addition, this section discussed indicators of resident perceptions of cultural
tourism. This is important because a crucial component to this study is determining how
quality of life and levels of resident satisfaction concerning various city-service attributes
potentially affect cultural tourism investment.

30
Chapter Three
METHODOLOGY
Introduction
The purpose of the study was to examine city-service attributes to determine if
they act as potential indicators of whether residents’ perception of quality of life affects
cultural tourism investment. Using univariate analysis of variance (ANOVA) and
correlations; the researcher attempted to ascertain (1) what city-service attributes identify
as potential indicators of whether residents’ perception of quality of life in Indianapolis
affects residents’ perception that investing in cultural events and attractions for tourists is
good for residents; and (2) if there were any correlations between demographic factors of
age, gender, ethnicity, and household income with the perception that investing in
cultural events and attractions for tourists is good for residents. The methods that were
used to address this research problem are described in the following sections:
preparations and location; selection of subjects; procedures for data collection; instrument
design; method of analysis; and summary.
Preparations and Location
Arrangements were made to conduct the annual Indianapolis Quality of Life
survey in Fall 2012 and with these arrangements a human subjects compliance agreement
was submitted to Indiana University’s Institutional Review Board on my behalf by Carina
King. As with previous quality of life surveys all federal regulations and university
policies were observed.
The Indianapolis Quality of Life survey was conducted over a span of several
weeks at various cultural and sporting events in the city of Indianapolis during September

31
and October of 2012. These events and venues granted prior approval for use in the
study and many of these locations have been used in previous quality of life studies. The
locations for the Indianapolis Quality of Life survey included high-traffic areas such as
Indianapolis Colts home games at Lucas Oil Stadium; Butler University football games at
the Butler Bowl; the IUPUI regatta along the central canal; Indianapolis Irish Fest;
Indianapolis Sister Cities International Festival, and Indy Germanfest.
Selection of Subjects
Survey participants were selected using a convenience sampling technique (which
selects subjects that are readily available at survey location) as in past surveys with a goal
of surveying around 300 residents. Ultimately, 318 residents responded to the four-page
survey that took five to ten minutes to complete. Most of the events attended have well
over a thousand visitors, such as Indianapolis Irish Fest which attracted over 50,000
attendees in 2006 (Indy Irish Fest, 2012). Due to these large crowds convenience
sampling is often the best approach and because of the various events visited over the
course of several weeks generalizations of the larger resident population can be made.
The survey is anonymous and names are not required.
Procedures for Data Collection
Data were collected via a four-page paper and pencil questionnaire that was
administered by Christopher Gullion, Sotiris Hji-Avgoustis, Carina King, and Jordan
McBride. Participants filled out the questionnaire with a provided pencil/ink pen and
clipboard. No other methods of data collection were employed. The administration of
the survey occurred at various times and days of the week depending on the schedule of
cultural and sporting events selected to attend.

32
Instrument Design
The instrument for this study was the 2012 Indianapolis Quality of Life survey
(see Appendix A). No questions were altered or changed specifically for this study. The
survey is considered reliable and valid. According to Fu, Cecil, Wang, and Avgoustis
(2007) the Cronbach’s alpha for the study was reported as .937, which excluded two city-
service attributes that were determined to have low internal associations. The survey
assumes that “certain community dimensions affect people’s quality of life” and
measures the perceived value and awareness of cultural tourism and sports tourism
(Cecil, Fu, Wang, & Avgoustis, 2010; King, Wang, & Avgoustis 2011).
In its current form, the Indianapolis Quality of Life survey consists of four main
sections: community involvement/sense of community; cultural tourism and Indianapolis;
sports tourism and Indianapolis; and demographics. In total there are seventeen
questions; most questions utilize a Likert-scale and have multiple sub-questions.
Including sub-questions, there are a total of sixty-two questions. Likert-scale questions
utilize a five-point scale and range from strongly agree (1) to strongly disagree (5).
The community involvement/sense of community section contains questions
examining sense of community, safety, and key city-service attributes such as:
cleanliness, parks and gardens, crime, pollution, attractions, transportation, and traffic. In
addition, this section asks participants to evaluate their overall satisfaction with the
quality of life in Indianapolis. This is the only question in the survey that directly asks
about residents’ perceived quality of life.
The cultural tourism and Indianapolis section contains sixteen Likert-scale
questions (plus one non-Likert-scale question) that reflect resident perception and address

33
cultural tourism promotion, investment and funding; destination image of Indianapolis;
cultural attractions and events; host-tourist interactions; and community spirit. In
addition, this section asks participants to choose important factors that cultural tourism
projects in Indianapolis depend on. Cultural tourism is defined in this section for
participants to review while responding to questions.
The sports tourism and Indianapolis section contains sixteen Likert-scale
questions that reflect resident perception and address sports tourism promotion,
investment and funding; sporting events and activities; destination image of Indianapolis;
host-tourist interactions; and community spirit. Sports tourism is defined in this section
for participants to review while responding to questions. No questions from this section
were utilized for this study.
The final section asks various demographic questions. These questions include
gender, relationship status, zip code of residence, age, race or ethnic background, annual
household income, and length of time lived in Indianapolis.
Method of Analysis
As with previous work utilizing the Indianapolis Quality of Life survey data was
entered into Statistical Package for Social Science (SPSS) which is quantitative statistical
software and the significance level was set at 0.05. See Table 1 in Chapter Four for a
Key describing all items used in this study. Item 7 was reversed-scored to match the
Likert-scale arrangement for the other items. The data was analyzed by performing a
descriptive analysis and frequencies were identified.
A two-way factorial ANOVA was performed to examine potential indicators of
whether residents’ perception of quality of life in Indianapolis affects residents’

34
perception that investing in cultural events and attractions for tourists is good for
residents. This allows for examination of the possible interactions between various city-
service attributes (item 5) and resident perception of quality of life (item 7) on resident
perception of cultural tourism investment (item 8N). Item 8N, which questions whether
investing in cultural events and attractions for tourists is good for residents, served as the
dependent variable; item 7, which questions resident perception of quality of life, and the
city-service attributes indicated in item 5 served as the independent variables. A simple
main effects analysis was performed on city-service attributes following a significant
interaction to determine effects on the different levels of item 7.
Parameter estimates were obtained from an additional ANOVA for the city-
service attributes to determine the impact on resident perception of quality of life if the
scores were to move one unit (from agree to strongly agree et cetera) along the Likert-
scale. Item 7 served at the dependent variable and the city-service attributes indicated in
item 5 served as the independent variables. A correlation of these city-service attributes
was also conducted.
Another ANOVA was performed to examine if there were any correlations
between the demographic factors of age, gender, ethnicity, and household income with
the perception that investing in cultural events and attractions for tourists is good for
residents. These demographic factors were chosen based on important socioeconomic
factors identified by McCool and Martin (1994), Cecil, Fu, Wang, and Avgoustis (2010)
and Long and Kayat (2011). Item 8N served as the dependent variable and the
demographics of age, gender, ethnicity, and household income served as the independent
variables.

35
In addition, other statistical analyses were performed to examine data from the
2012 Indianapolis Quality of Life survey. For example, an ANOVA was performed to
examine demographics and resident perception of quality of life. Item 7 served as the
dependent variable and the demographics of age, gender, ethnicity, and household
income served as the independent variables.
Summary
The 2012 Quality of Life survey consists of sixty-two questions and consists of
four categories: community involvement/sense of community, cultural tourism and
Indianapolis, sports tourism and Indianapolis, and demographics. The survey was
conducted over a span of several weeks at various cultural and sporting events in the city
of Indianapolis during Fall 2012. These events and venues granted prior approval for use
in the study. Participants were selected using a convenience sampling technique as in
past surveys with a goal of surveying around 300 residents. In all, 318 residents
responded. Respondents measured their own perception of their quality of life and their
satisfaction with various elements of tourism in Indianapolis.
Statistical analysis was performed to determine what city-service attributes
identify as potential indicators of whether residents’ perception of quality of life in
Indianapolis affects residents’ perception that investing in cultural events and attractions
for tourists is good for residents; and if there was any correlations between demographic
factors of age, gender, ethnicity, and household income with the perception that investing
in cultural events and attractions for tourists is good for residents. Other statistical
analyses were conducted such as ANOVAs and correlations to further examine data from
the 2012 Indianapolis Quality of Life survey as needed.
36
Chapter Four
DATA ANALYSIS AND DISCUSSION
Introduction
The purpose of the study was to examine city-service attributes to determine if
they act as potential indicators of whether residents’ perception of quality of life affects
cultural tourism investment. This study has allowed for the examination of various
aspects of the study that relate directly to resident perception of quality of life and
cultural tourism investment.
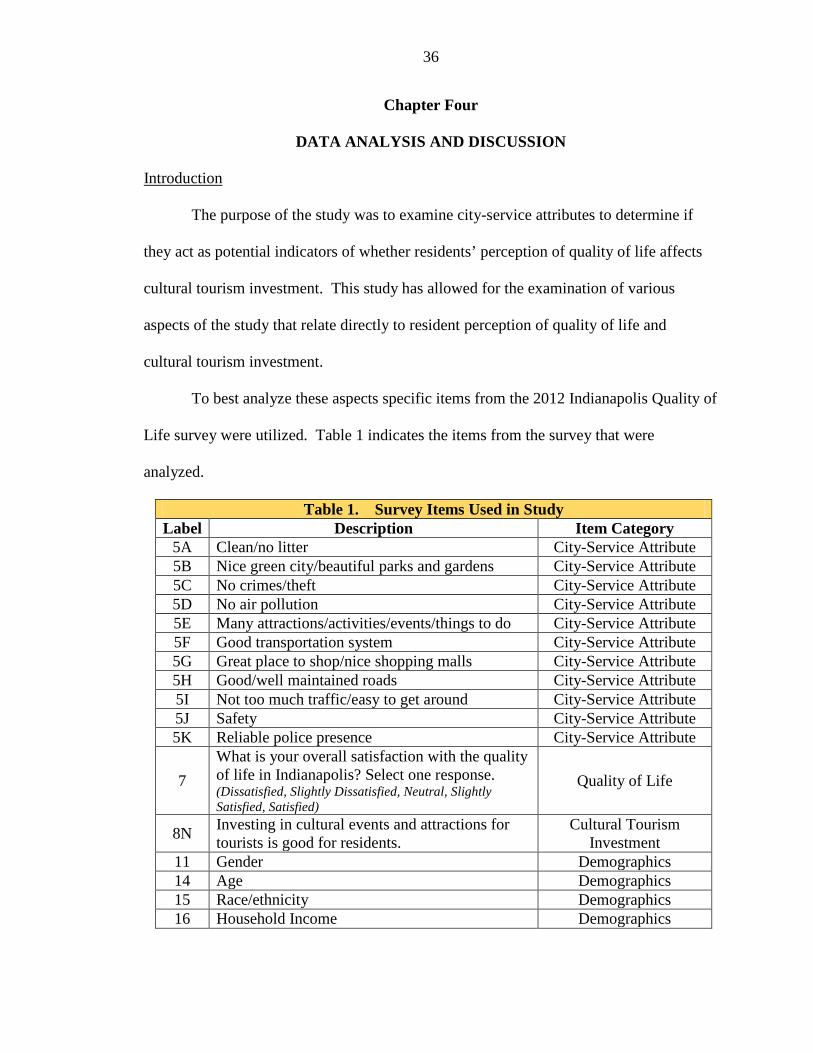
To best analyze these aspects specific items from the 2012 Indianapolis Quality of
Life survey were utilized. Table 1 indicates the items from the survey that were
analyzed.
Table 1. Survey Items Used in Study Label Description Item Category
5A Clean/no litter City-Service Attribute 5B Nice green city/beautiful parks and gardens City-Service Attribute 5C No crimes/theft City-Service Attribute 5D No air pollution City-Service Attribute 5E Many attractions/activities/events/things to do City-Service Attribute 5F Good transportation system City-Service Attribute 5G Great place to shop/nice shopping malls City-Service Attribute 5H Good/well maintained roads City-Service Attribute 5I Not too much traffic/easy to get around City-Service Attribute 5J Safety City-Service Attribute 5K Reliable police presence City-Service Attribute
7 What is your overall satisfaction with the quality of life in Indianapolis? Select one response. (Dissatisfied, Slightly Dissatisfied, Neutral, Slightly Satisfied, Satisfied)
Quality of Life
8N Investing in cultural events and attractions for tourists is good for residents.
Cultural Tourism Investment
11 Gender Demographics 14 Age Demographics 15 Race/ethnicity Demographics 16 Household Income Demographics
37
This chapter presents data from the statistical analyses discussed in the previous
chapter. Data is then analyzed and results are discussed. First, sample characteristics are
presented. This is followed by analysis of the main research questions. The chapter ends
with a summary of the major findings of this study. In summation of the goals of this
research, this study sought to:
− Examine what city-service attributes are identified as potential indicators of
whether residents’ perception of quality of life affects cultural tourism
investment.
− Examine if there were any correlations between demographic factors of age,
gender, ethnicity, and household income with the perception that investing in
cultural events and attractions for tourists is good for residents.
Sample Characteristics
This study uses data from the 2012 Indianapolis Quality of Life survey. A
convenience sample of 318 residents that live in Indianapolis and the surrounding
counties and who were older than eighteen years of age was taken for this study. All 318
surveys were either fully or partially completed. This is consistent with previous years
study data. Response rates were adequate for study specific items: 5, 7, 8N, 11, 14, 15
and 16. Response rates for demographic information were not uncharacteristically
different than previous year’s data. It was not necessary to remove any data and all data
from the collected surveys were utilized.
Table 2 highlights the demographic profile of survey respondents. There were
more males than females in the sample. Most participants were either married/partnered
or single. A majority of the participants (64%) lived within the Interstate 465 beltway or

38
within a zip code that overlapped partly beyond the Interstate 465 beltway. See Table 11
and Plate 1 in Appendix B for complete zip code data. A majority of the participants
were aged 18 to 30, which comprised nearly half of the total participants. Most
participants were White, non-Hispanic origin; followed by Black, non-Hispanic origin. A
majority of the participants reported a household income range of $0 to $90,000, which
comprised 87% of the total participants. Just over half of all participants (56.6%)
reported to have lived in Indianapolis four or more years.
Table 2. 2012 Indianapolis Quality of Life Survey Demographic Profile
Frequency Valid
Percent (%)
Frequency
Valid Percent
(%)
Gender Male 169 54.0
Relationship Status
Married/ Partnered 139 44.4
Divorced 20 6.4
Female 144 46.0 Single 147 47.0 Other 7 2.2
Age
18-30 141 45.5
Ethnicity
Hispanic 10 3.2 31-43 74 23.9 Black 39 12.5 44-56 54 17.4 White 206 66.0
57-72 37 11.9 Asian/ Pacific 31 9.9
>72 4 1.3
Native American 2 .6
Mixed Ethnicity 13 4.2
No Answer 11 3.5
Resi-dency
<1 year 29 9.3
Household Income (USD)
$0-$30,000 99 32.1 <2 years 37 11.9 $30,000-
$60,000 85 27.6
<4 years 69 22.2 $60,001-
$90,000 84 27.3
<10 years 65 20.9 $90,001-
$120,000 19 6.2
>10 years 111 35.7
$120,001-$150,000 10 3.2
>$150,000 11 3.6
The demographic profile of the 2012 Indianapolis Quality of Survey is
comparable to previous years demographic profile data. There were no major
demographic changes of note and any noticeable differences can be attributed to the

39
convenience sampling method. Participants were generally positive in concern of the
perception of their quality of life. The average score for item 7, which directly examined
resident perception of quality of life, was 4.48 on a five-point scale (1 = dissatisfied; 5 =
satisfied). This indicates that residents of Indianapolis were satisfied with their perceived
quality of life. In response to item 9 (In your opinion, successful cultural tourism
projects in Indianapolis mainly depend on which of the following factors?), participants
rated ‘invest in community’s quality of life’ near last ahead of ‘preserve local customs’ in
terms of importance; ‘organize festivals and events’, ‘preserve historic sites and
attractions’, ‘promote museums and galleries’, and ‘link the arts and tourism in
communities’ were rated considerably higher.
Effects of City-Service Attributes and Quality of Life on Cultural Tourism Investment
This section will discuss the analysis of city-service attributes that identify as
potential indicators of whether residents’ perception of quality of life in Indianapolis
affects residents’ perception that investing in cultural events and attractions for tourists is
good for residents. Furthermore, this section will explain whether the statistical results
allow for acceptance or rejection of the null hypothesis: ‘there are no city-service
attributes that serve as potential indicators of whether residents’ perception of quality of
life in Indianapolis affects residents’ perception that investing in cultural events and
attractions for tourists is good for residents’.
It was relevant to examine city-service attributes to determine if there were any
potential indicators of whether residents’ perception of quality of life affects residents’
perception that investing in cultural events and attractions for tourists is good for
residents. First, a correlation was run between city-service attributes to determine how

40
well the attributes correlate with one another (see Table 3). The correlation produced
interesting groupings of city-service attributes. All items were either moderately or
strongly positively correlated with each other. Highlights of some of the strongest
correlations include items 5A and 5B which were strongly correlated, r = .64, p = .000.
Items 5C and 5D were very strongly correlated, r = .80, p = .000. Items 5G and 5K were
strongly correlated, r = .65, p = .000. Item 5H was strongly correlated with item 5G, r =
.66, p = .000; item 5I, r = .66. p = .000; item 5J, r = .66, p = .000; and item 5K, r = .69, p
= .000. Finally, items 5J and 5K were very strongly correlated, r = .82, p = .000. Table 4
illustrates descriptive statistics such as the mean and standard deviations for each city-
service attribute included in the final analysis. The means for city-service attributes
indicate that on average most participants responded agreeably and for a few city-service
attributes (5C, 5D, and 5F) responses were closer to neutral.
Most correlations appear to be due to the similarity of the city-service attributes.
For example, item 5A and item 5B were strongly correlated. Both of these attributes
evoke a desire for cleanliness and a beautiful cityscape. In addition, item 5C and item 5D
were very strongly correlated and this may indicate a desire for a hospitable, safe, and
healthy place to live, work, and play.
However, some correlations were more directly related to residents’ perception of
their overall safety. For example, item 5G and item 5K were strongly correlated; perhaps
reflecting the need for a safe shopping environment. In addition, item 5H was strongly
correlated with item 5G, item 5J, and item 5K; tending to reflect an overall desire for safe
commuting and living conditions in Indianapolis. Finally, continuing the trend that tends
to reveal an overall concern with safety, items 5J and 5K were very strongly correlated.

41
Table 3. Pearson Correlations for City-Service Attributes Analysis of City-Service Attributes and Resident Perception of Quality of Life # 5A 5B 5C 5D 5E 5F 5G 5H 5I 5J 5K
5A 1 .637 .397 .411 .493 .362 .407 .482 .401 .478 .422 5B .637 1 .346 .279 .549 .292 .429 .448 .371 .481 .494 5C .397 .346 1 .802 .299 .597 .294 .471 .426 .397 .376 5D .411 .279 .802 1 .316 .565 .274 .455 .501 .348 .313 5E .493 .549 .299 .316 1 .248 .520 .480 .494 .501 .543 5F .362 .292 .597 .565 .248 1 .268 .349 .316 .211 .228 5G .407 .429 .294 .274 .520 .268 1 .661 .468 .573 .653 5H .482 .448 .471 .455 .480 .349 .661 1 .661 .656 .689 5I .401 .371 .426 .501 .494 .316 .468 .661 1 .586 .569 5J .478 .481 .397 .348 .501 .211 .573 .656 .583 1 .821 5K .422 .494 .376 .313 .543 .228 .653 .689 .569 .821 1
An ANOVA was ran with item 7 (What is your overall satisfaction with the
quality of life in Indianapolis?) as the dependent variable and city-service attributes (item
5) as the independent variables (see Table 5). Results from the ANOVA indicated that
there was a significant main effect for the city-service attributes of 5A F(1, 302) = 6.71, p
= .010; 5F F(1, 302) = 5.74, p = .017; 5J F(1, 302) = 6.84, p = .009 ; and 5K F(1, 302) =
4.32, p = .038. The remaining city-service attributes were not significant. Items 5D
F(1,302) = .061, p = .805 and 5E F(1,302) = .001, p = .976 were highly insignificant.
Table 4. Descriptive Statistics for City-Service Attributes Analysis of City-Service Attributes and Resident Perception of Quality of Life
# City-Service Attribute N Mean Std. Deviation 5A Clean/no litter 314 1.76 .840 5B Nice green city/beautiful parks and gardens 313 1.69 .853 5C No crimes/theft 314 2.64 1.073 5D No air pollution 311 2.48 1.115 5E Many attractions/activities/events/things to do 313 1.54 .693 5F Good transportation system 313 3.11 1.213 5G Great place to shop/nice shopping malls 312 1.61 .778 5H Good/well maintained roads 314 1.91 .946 5I Not too much traffic/easy to get around 310 1.96 1.025 5J Safety 313 1.73 .870 5K Reliable police presence 313 1.76 .911

42
Thus, items 5A, 5F, 5J, and 5K are factors that are shown to be good indicators of
resident perception of quality of life. The remaining factors are not good indicators of
resident perception of quality of life. Perceptions of safety can impact an individual’s
health and wellbeing and the use of these as indicative measures of quality of life are
common throughout research related to resident quality of life as referenced by
Anderreck and Nayaupane (2010). This result relates with Yamada, et al (2009), which
linked health perception and safety with higher quality of life. The significance of item
5F, which concerns transportation in Indianapolis is an interesting outcome. Indeed,
transportation concerns can fall under the umbrella of overall general safety in the city
and have outstanding effects on resident quality of life; but also these concerns can reflect
a deeper concern (or lack thereof) residents have about transportation issues in
Table 5. ANOVA Analysis of City-Service Attributes and Resident Perception of Quality of Life
# Source df Mean Square F Sig. Observed
Power Corrected Model 11 5.180 8.832 .000 1.000
5A Clean/no litter 1 3.934 6.707 .010 .733 5B Nice green city/beautiful parks and
gardens 1 1.470 2.506 .114 .351
5C No crimes/theft 1 .972 1.658 .199 .250 5D No air pollution 1 .036 .061 .805 .057 5E Many
attractions/activities/events/things to do
1 .001 .001 .976 .050
5F Good transportation system 1 3.367 5.741 .017 .666 5G Great place to shop/nice shopping
malls 1 .253 .431 .512 .100
5H Good/well maintained roads 1 .420 .716 .398 .135 5I Not too much traffic/easy to get
around 1 .125 .213 .645 .075
5J Safety 1 4.013 6.842 .009 .741 5K Reliable police presence 1 2.536 4.323 .038 .545
Total 303 Corrected Total 302
R Squared = .250 (Adjusted R Squared = .222) Dependent Variable: item 7 (What is your overall satisfaction with the quality of life in Indianapolis?)

43
Indianapolis. These issues, as of the writing of this thesis, are being directly addressed
through the emergence of extensive transportation initiatives developed by Indy Connect,
which is a partnership of the Indianapolis Metropolitan Planning Organization, Central
Indiana Transportation Authority, and IndyGo (Indy Connect, 2012). Research
conducted by Howard (2007) regarding transportation issues and quality of life indicated
a difference in perception towards the importance of various quality of life factors
dependent on their travel mode. For example, residents dependent solely on bus
transportation rated their quality of life lower than residents who commuted on bicycles
(Howard, 2007). Ultimately, research indicated transportation was an important
determinant of quality of life. Safety and transportation in the city of Indianapolis,
though outside the scope of this thesis, will continue to be important aspects to consider
when gauging resident perception of quality of life in Indianapolis.
Parameter estimates (B) are reported in Table 6 and give more insight into how
city-service attributes potentially effect resident perception of quality of life. These
results were obtained from a ANOVA ran with item 7 serving as the dependent variable
and the city-service attributes indicated in item 5 as the independent variables. Results
indicated that city-service attributes 5B, 5F, 5H, and 5I could potentially effect resident
perception of quality of life. If the scores for these items were to increase by one unit the
outcome (item 7) would decrease by one unit. Results indicated that city-service
attributes 5A, 5C, 5D, 5E, 5G, 5J, and 5K could potentially effect resident perception of
quality of life. If the scores for these items were to increase by one unit the outcome
(item 7) would increase by one unit. The sign of the coefficient indicates the direction of
the relationship between the covariates and the outcome. Negative coefficients suggest

44
as one item increases, the other item decreases. If a coefficient is positive it means there
is a positive relationship between the covariate and outcome (Field, 2010).
If the scores for items 5A, 5C, 5D, 5E, 5G, 5J, and 5K were to increase by one
unit, then resident perception of quality of life would increase by one unit. Many of
these city-service attributes relate to public health and safety; such as, items 5A, 5C, 5D,
5J, and 5K. It is logical that if resident perception of these city-service attributes were to
increase then resident perception of quality of life would also increase. As mentioned
before, health and safety are crucial factors in overall quality of life. However, city-
service attributes such as 5E and 5G relate more to entertainment and shopping. Though
not as important as health and safety, some residents may benefit from access to these
services and quality of life may increase due to these available community assets.
Contrariwise, results indicated that if the scores for items 5B, 5F, 5H, and 5I were
to increase by one unit, then resident perception of quality of life would decrease by one
unit. This is a negative relationship and negative coefficients suggest as one item
increases, the other item decreases. This result may reflect what survey participants
Table 6. Parameter Estimates Analysis of City-Service Attributes
and Resident Perception of Quality of Life # City-Service Attribute B
5A Clean/no litter .193 5B Nice green city/beautiful parks and gardens -.117 5C No crimes/theft .096 5D No air pollution .018 5E Many attractions/activities/events/things to do .003 5F Good transportation system -.114 5G Great place to shop/nice shopping malls .056 5H Good/well maintained roads -.070 5I Not too much traffic/easy to get around -.031 5J Safety .261 5K Reliable police presence .206
45
considered important in their daily lives. For example we can further examine items 5F,
5H, and 5I; which mainly deal with transportation and infrastructure issues. Responses
concerning these city-service attributes may reflect demographics of the survey. To
better understand this I examined public transportation statistics in Indianapolis.
According to the Indianapolis Public Transportation Corporation (IndyGo) (2010), “over
70% of IndyGo riders are low-income and transit-dependent”. In addition, 75% of
passengers were between the ages of 25-64; 73% percent of passengers had household
incomes of less than $35,000; and 65% of passengers are Black/African-American, while
nearly one-third are White/Caucasian (IndyGo, 2010). Furthermore, according to IndyGo
(2010), “college/university students do not comprise a significant portion of existing
IndyGo ridership”. IndyGo ridership demographics suggest most passengers are low-
income but are not students. In comparison, most survey participants were between 18-
30 years old and 66% of participants reported White/Caucasian ethnicity. Though 32%
of participants reported an income of $0-$30,000; 68% of participants reported an income
greater than $30,000. Therefore, it can be inferred that most people who are dependent
on public transportation may not be able to afford to attend cultural and sporting events
like the events sampled for the 2012 Indianapolis Quality of Life study. Utilizing data in
this manner is useful in understanding the role that demographics play in important
decisions regarding resident quality of life and cultural tourism investment. Therefore, it
may be beneficial to discuss ways to include residents of Indianapolis in the quality of
life survey that have less-opportunities to attend cultural and sporting events in the city.
Next, after statistically examining the city-service attributes and their effect on
resident perception of quality of life, a two-way factorial ANOVA was ran to examine

46
what city-service attributes identify as potential indicators of whether residents’
perception of quality of life in Indianapolis affects residents’ perception that investing in
cultural events and attractions for tourists is good for residents. Item 8N (Investing in
cultural events and attractions for tourists is good for residents) served as the dependent
variable and item 7 (What is your overall satisfaction with the quality of life in
Indianapolis?) and the city-service attributes indicated in item 5 served as the
independent variables. Specifically, each individual city-service attribute (item 5A, 5B,
et cetera) was individually examined along with item 7 as the independent variables in an
ANOVA with the dependent variable item 8N. A significant F value suggests a
significant main effect and when there are multiple independent variables this also
indicates an interaction between the two independent variables (Wang, Fu, Cecil, &
Avgoustis, 2006).
Results from the ANOVA indicated several interactions between city-service
attributes and resident perception of quality of life on residents’ perception of whether
investing in cultural events and attractions for tourists is good for residents. Therefore,
the null hypothesis is rejected. There was a statistically significant interaction between
item 5A and item 7 on item 8N, F(9,310) = 2.37, p = .014; item 5B and item 7 on item
8N, F(9,309) = 2.01, p = .038; 5G and item 7 on item 8N, F(9,308) = 2.89, p = .003; 5H
and item 7 on item 8N, F(11,310) = 2.605, p = .004; 5I and item 7 on item 8N, F(13,307)
= 2.41, p = .004; 5J and item 7 on item 8N, F(12,309) = 3.13, p = .000; and 5K and item
7 on item 8N, F(11,309) = 3.78, p = .000. Items 5C, 5D, 5E, and 5F did not have
statistically significant interactions with item 7 on item 8N.

47
To further examine these affects, a simple main effects analysis was then
performed on the significant city-service attributes and resident perception of quality of
life. In consideration of city-service attributes (see Table 7) there was a statistically
significant difference in item 8N score between levels of item 5A with item 7 scores of 1,
2 and 5; item 5B with item 7 scores of 1 and 5; item 5G with item 7 scores of 3 and 4;
item 5H with item 7 scores of 4 and 5; item 5I with item 7 scores of 3 and 5; item 5J with
item 7 scores of 3, 4 and 5; and item 5K with item 7 scores of 3, 4 and 5.
Table 7. Simple Main Effects for City-Service Attributes (Item 5)
Items Levels of Item 7 df F Sig.
5A with 7 (1) Satisfied (2) Slightly Satisfied (3) Neutral (4) Dissatisfied (5) Slightly Dissatisfied
(3,293) (4,293) … … (1,293)
4.89 2.53 … … 7.27
.002
.041 … … .007
5B with 7 (1) Satisfied (2) Slightly Satisfied (3) Neutral (4) Dissatisfied (5) Slightly Dissatisfied
(3,292) … … … (2,292)
4.57 … … … 5.34
.004 … … … .005
5G with 7 (1) Satisfied (2) Slightly Satisfied (3) Neutral (4) Dissatisfied (5) Slightly Dissatisfied
… … (3,292) (2,292) …
… … 2.84 6.53 …
… … .038 .043 …
5H with 7 (1) Satisfied (2) Slightly Satisfied (3) Neutral (4) Dissatisfied (5) Slightly Dissatisfied
… … … (3,291) (1,291)
… … … 5.09 9.83
… … … .002 .002
5I with 7 (1) Satisfied (2) Slightly Satisfied (3) Neutral (4) Dissatisfied (5) Slightly Dissatisfied
… … (4,286) … (2,286)
… … 2.44 … 5.33
… … .047 … .005
5J with 7 (1) Satisfied (2) Slightly Satisfied (3) Neutral (4) Dissatisfied (5) Slightly Dissatisfied
… … (4,289) (3,289) (3,289)
… … 2.63 3.57 4.08
… … .034 .015 .007

48
In consideration of resident perception of quality of life (see Table 8) there was a
statistically significant difference in item 8N score between levels of item 7 with item 5A
scores of 1, 2, 3 and 4; item 5B scores of 1, 2, 3 and 5; item 5G scores of 1, 2, 3 and 4;
item 5H scores of 1, 2 and 3; item 5I scores of 1, 2, 3, 4 and 5; item 5J scores of 1, 2, 3, 4
and 5; and item 5K scores of 1, 2, 3, 4 and 5.
Table 7 (cont.) Simple Main Effects for City-Service Attributes (Item 5)
Items Levels of Item 7 df F Sig.
5K with 7 (1) Satisfied (2) Slightly Satisfied (3) Neutral (4) Dissatisfied (5) Slightly Dissatisfied
… … (4,290) (3,290) (2,290)
… … 4.05 5.25 5.56
… … .003 .002 .004
Dependent Variable: item 8N (Investing in cultural events and attractions for tourists is good for residents)
Table 8. Simple Main Effects for Resident Perception of Quality of Life (Item 7)
Items Levels of Item 5 df F Sig. 7 with 5A
(1) Strongly Agree (2) Agree (3) Neutral (4) Disagree (5) Strongly Disagree
(4,293) (3,293) (2,293) (4,293) …
17.70 10.86 4.36 5.01 …
.000
.000
.014
.001 …
7 with 5B (1) Strongly Agree (2) Agree (3) Neutral (4) Disagree (5) Strongly Disagree
(3,292) (4, 292) (3,292) … (1,292)
13.91 14.89 6.94 … 6.33
.000
.000
.000 … .012
7 with 5G (1) Strongly Agree (2) Agree (3) Neutral (4) Disagree (5) Strongly Disagree
(3,292) (4,292) (3,292) (3,292) …
9.80 14.13 6.44 8.59 …
.000
.000
.000
.000 …
7 with 5H (1) Strongly Agree (2) Agree (3) Neutral (4) Disagree (5) Strongly Disagree
(3,291) (3,291) (4,291) … …
10.05 8.30 17.44 … …
.000
.000
.000 … …

49
Results of the simple main effects indicate that if participants tended to agree with
items 5A, 5B, 5G, 5H, 5I, 5J, and/or 5K; and perceived resident quality of life as
satisfactory; then participants tended to agree that investing in cultural events and
attractions for tourists is good for residents. This provides some insight into how
residents of Indianapolis feel about their own personal lives and how they feel about the
community as a whole. Residents who generally felt that the city of Indianapolis was
clean, beautiful, safe, had well maintained roads and shopping centers, and had a more
satisfactory perception of their quality of life, tended to agree that investments into
cultural attractions is good for residents of Indianapolis. However, further analysis
revealed split perceptions toward the notion that investing in cultural events and
attractions for tourists is good for residents if participants tended to disagree with items
5A, 5B, 5G, 5H, 5I, 5J, and/or 5K; and perceived resident quality of life as
dissatisfactory. This is perhaps due to investments toward cultural attractions and events
Table 8 (cont.) Simple Main Effects for Resident Perception of Quality of Life (Item 7)
Items Levels of Item 5 df F Sig.
7 with 5I (1) Strongly Agree (2) Agree (3) Neutral (4) Disagree (5) Strongly Disagree
(3,286) (4,286) (4,286) (3,286) (3,286)
7.86 11.62 10.14 2.88 5.08
.000
.000
.000
.036
.002
7 with 5J (1) Strongly Agree (2) Agree (3) Neutral (4) Disagree (5) Strongly Disagree
(3,289) (4,289) (4,289) (4,289) (1.289)
11.06 9.67 6.63 4.39 4.90
.000
.000
.000
.002
.028
7 with 5K (1) Strongly Agree (2) Agree (3) Neutral (4) Disagree (5) Strongly Disagree
(3,290) (3,290) (4,290) (4,290) (1,290)
10.71 5.93 12.34 6.34 4.94
.000
.001
.000
.000
.027
Dependent Variable: item 8N (Investing in cultural events and attractions for tourists is good for residents)

50
not being as important to residents of Indianapolis who have a dissatisfactory perception
of their quality of life and feel that the city is unclean, unsafe, and has poorly maintained
roads and inadequate shopping. Neutral responses to the aforementioned city-service
attributes and dissatisfactory responses of resident perception of quality of life tended to
produce split responses toward whether investing in cultural events and attractions for
tourists is good for residents.
Towards producing a better understanding of these results we can easier
understand each simple main effect by examining each individual city-service attribute.
Figure 1 reveals that participants who had a tendency to agree with item 5A and who
had a satisfactory perception of their quality of life tended to respond in agreement to
item 8N. Participants who had a tendency to disagree with item 5A and who had a
dissatisfactory perception of their quality of life tended to respond in disagreement to
item 8N. In addition, participants who had a tendency to agree with item 5A and who

51
had a dissatisfactory perception of their quality of life tended to respond in disagreement
or neutrality to item 8N.
Figure 2 reveals that participants who had a tendency to agree with item 5B and
who had a satisfactory perception of their quality of life tended to respond in agreement
to item 8N. Participants who had a tendency to disagree with item 5B and who had a
dissatisfactory perception of their quality of life tended to respond in agreement or
neutrality to item 8N. In addition, participants who had a tendency to agree with item 5B
and who had a dissatisfactory perception of their quality of life tended to responded in
neutrality or disagreement to item 8N.
Figure 3 reveals that participants who had a tendency to agree with item 5G and
who had a satisfactory perception of their quality of life tended to respond in agreement
to item 8N. Participants who had a tendency to disagree with item 5G and who had a
dissatisfactory perception of their quality of life tended to respond in disagreement to
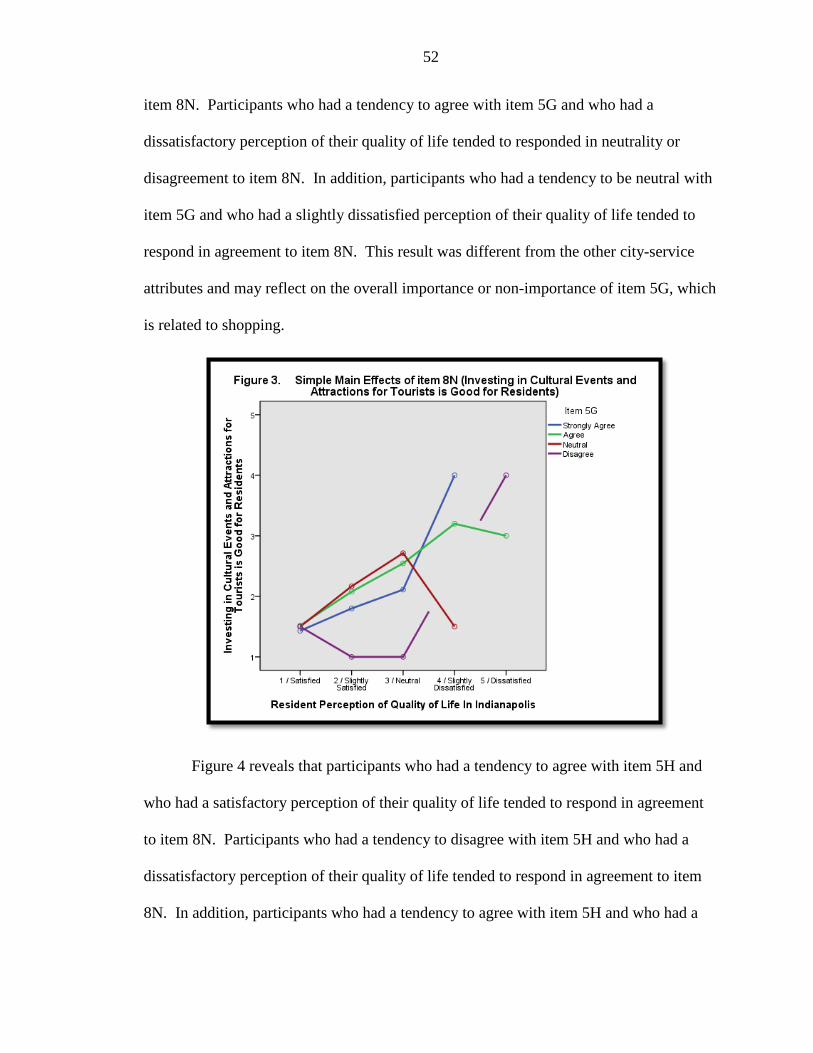
52
item 8N. Participants who had a tendency to agree with item 5G and who had a
dissatisfactory perception of their quality of life tended to responded in neutrality or
disagreement to item 8N. In addition, participants who had a tendency to be neutral with
item 5G and who had a slightly dissatisfied perception of their quality of life tended to
respond in agreement to item 8N. This result was different from the other city-service
attributes and may reflect on the overall importance or non-importance of item 5G, which
is related to shopping.
Figure 4 reveals that participants who had a tendency to agree with item 5H and
who had a satisfactory perception of their quality of life tended to respond in agreement
to item 8N. Participants who had a tendency to disagree with item 5H and who had a
dissatisfactory perception of their quality of life tended to respond in agreement to item
8N. In addition, participants who had a tendency to agree with item 5H and who had a
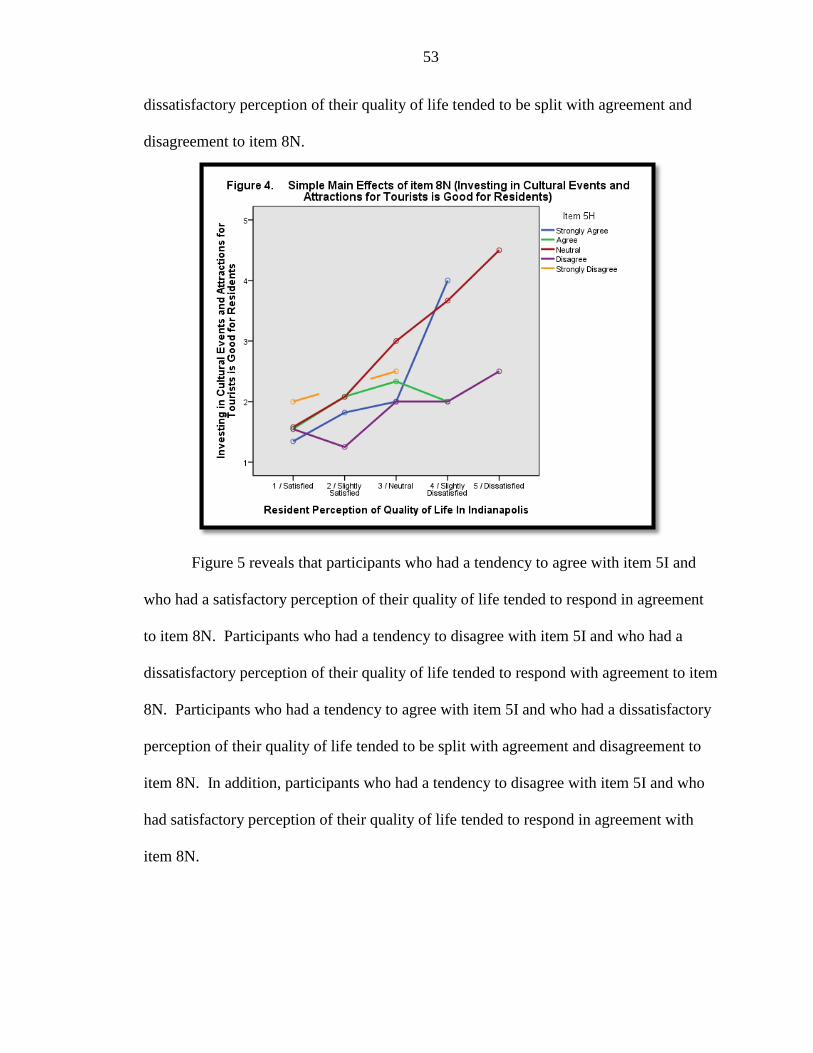
53
dissatisfactory perception of their quality of life tended to be split with agreement and
disagreement to item 8N.
Figure 5 reveals that participants who had a tendency to agree with item 5I and
who had a satisfactory perception of their quality of life tended to respond in agreement
to item 8N. Participants who had a tendency to disagree with item 5I and who had a
dissatisfactory perception of their quality of life tended to respond with agreement to item
8N. Participants who had a tendency to agree with item 5I and who had a dissatisfactory
perception of their quality of life tended to be split with agreement and disagreement to
item 8N. In addition, participants who had a tendency to disagree with item 5I and who
had satisfactory perception of their quality of life tended to respond in agreement with
item 8N.

54
Figure 6 reveals that participants who had a tendency to agree with item 5J and
who had a satisfactory perception of their quality of life tended to respond in agreement
to item 8N. Participants who had a tendency to disagree with item 5J and who had a

55
dissatisfactory perception of their quality of life tended to be split with agreement and
disagreement to item 8N. Participants who had a tendency to agree with item 5J and who
had a dissatisfactory perception of their quality of life tended to respond with
disagreement and neutrality to item 8N. In addition, participants who had a tendency to
disagree with item 5J and who had a dissatisfactory or neutral perception of their quality
of life tended to be split with agreement and disagreement to item 8N.
Figure 7 reveals that participants who had a tendency to agree with item 5K and
who had a satisfactory perception of their quality of life tended to respond in agreement
to item 8N. Participants who had a tendency to disagree with item 5K and who had a
dissatisfactory perception of their quality of life tended to be split with agreement and
disagreement to item 8N. Participants who had a tendency to agree with item 5K and
who had a dissatisfactory perception of their quality of life tended to be split with

56
agreement and disagreement to item 8N. In addition, participants who had a tendency to
disagree with item 5K and who had a dissatisfactory or neutral perception of their quality
of life tended to be split with agreement and disagreement to item 8N. Item 5J and item
5K were very similar due to both items relating to public safety and policing.
Reviewing the statistical tests done to examine what city-service attributes
identify as potential indicators of whether residents’ perception of quality of life in
Indianapolis affects residents’ perception that investing in cultural events and attractions
for tourists is good for residents; it is clear that a pattern of important city-service
attributes has emerged. Safety, cleanliness, and transportation issues are important to
residents of Indianapolis and these city-service attributes greatly impact resident quality
of life, and thus the perception that investing in cultural events and attractions for tourists
is good for residents.
Effects of Demographics on Cultural Tourism Investment
This section will discuss the analysis of whether there were any differences in the
perception that investing in cultural events and attractions for tourists is good for
residents associated with different groups using the following demographic factors (age,
income, ethnicity, and gender). Refer back to Table 2 for highlights of the demographic
profile of survey respondents. The demographic factors served as the independent
variables and the dependent variable was item 8N (Investing in cultural events and
attractions for tourists is good for residents). In addition, this section will explain
whether the statistical results allow for acceptance or rejection of the null hypothesis:
‘there are no correlations between demographic factors such as; age, gender, ethnicity,
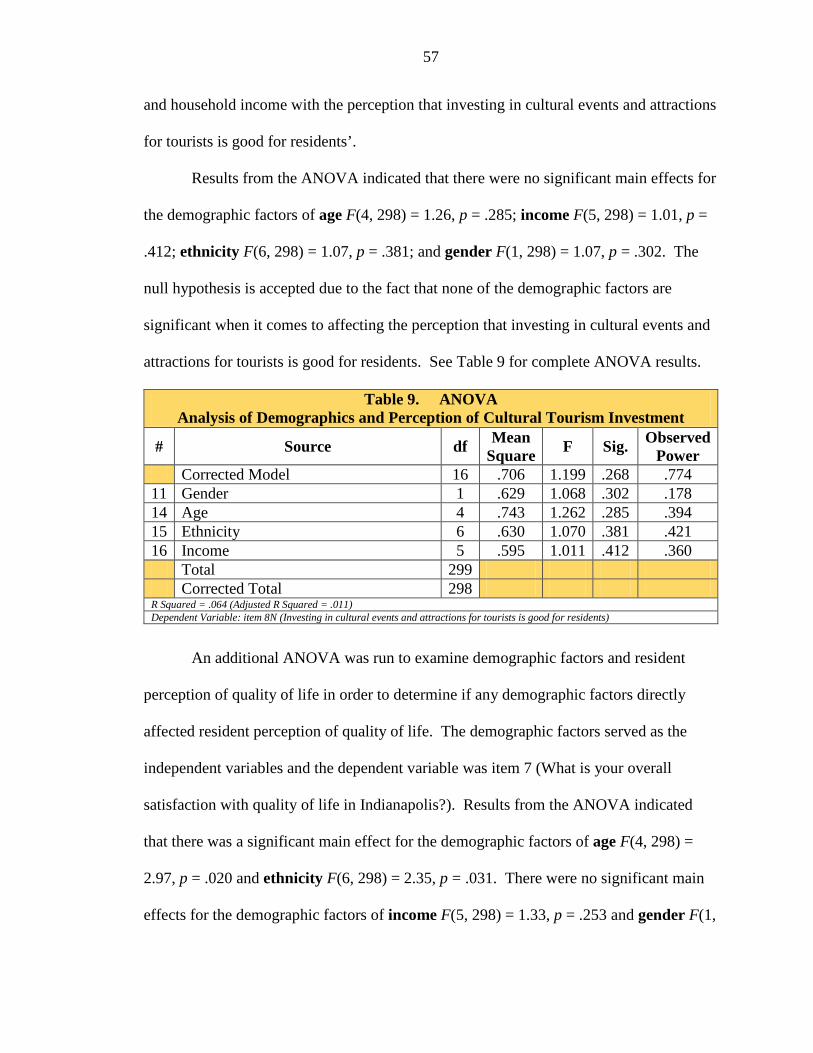
57
and household income with the perception that investing in cultural events and attractions
for tourists is good for residents’.
Results from the ANOVA indicated that there were no significant main effects for
the demographic factors of age F(4, 298) = 1.26, p = .285; income F(5, 298) = 1.01, p =
.412; ethnicity F(6, 298) = 1.07, p = .381; and gender F(1, 298) = 1.07, p = .302. The
null hypothesis is accepted due to the fact that none of the demographic factors are
significant when it comes to affecting the perception that investing in cultural events and
attractions for tourists is good for residents. See Table 9 for complete ANOVA results.
An additional ANOVA was run to examine demographic factors and resident
perception of quality of life in order to determine if any demographic factors directly
affected resident perception of quality of life. The demographic factors served as the
independent variables and the dependent variable was item 7 (What is your overall
satisfaction with quality of life in Indianapolis?). Results from the ANOVA indicated
that there was a significant main effect for the demographic factors of age F(4, 298) =
2.97, p = .020 and ethnicity F(6, 298) = 2.35, p = .031. There were no significant main
effects for the demographic factors of income F(5, 298) = 1.33, p = .253 and gender F(1,
Table 9. ANOVA Analysis of Demographics and Perception of Cultural Tourism Investment
# Source df Mean Square F Sig. Observed
Power Corrected Model 16 .706 1.199 .268 .774
11 Gender 1 .629 1.068 .302 .178 14 Age 4 .743 1.262 .285 .394 15 Ethnicity 6 .630 1.070 .381 .421 16 Income 5 .595 1.011 .412 .360 Total 299 Corrected Total 298
R Squared = .064 (Adjusted R Squared = .011) Dependent Variable: item 8N (Investing in cultural events and attractions for tourists is good for residents)
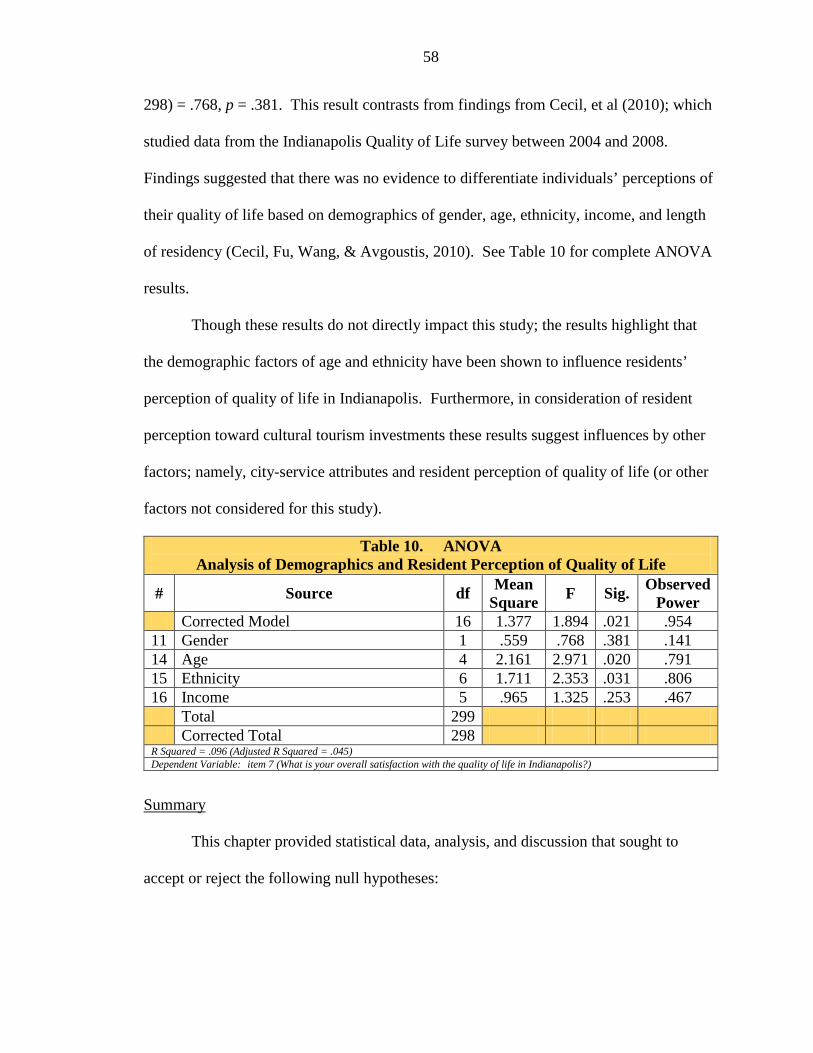
58
298) = .768, p = .381. This result contrasts from findings from Cecil, et al (2010); which
studied data from the Indianapolis Quality of Life survey between 2004 and 2008.
Findings suggested that there was no evidence to differentiate individuals’ perceptions of
their quality of life based on demographics of gender, age, ethnicity, income, and length
of residency (Cecil, Fu, Wang, & Avgoustis, 2010). See Table 10 for complete ANOVA
results.
Though these results do not directly impact this study; the results highlight that
the demographic factors of age and ethnicity have been shown to influence residents’
perception of quality of life in Indianapolis. Furthermore, in consideration of resident
perception toward cultural tourism investments these results suggest influences by other
factors; namely, city-service attributes and resident perception of quality of life (or other
factors not considered for this study).
Summary
This chapter provided statistical data, analysis, and discussion that sought to
accept or reject the following null hypotheses:
Table 10. ANOVA Analysis of Demographics and Resident Perception of Quality of Life
# Source df Mean Square F Sig. Observed
Power Corrected Model 16 1.377 1.894 .021 .954
11 Gender 1 .559 .768 .381 .141 14 Age 4 2.161 2.971 .020 .791 15 Ethnicity 6 1.711 2.353 .031 .806 16 Income 5 .965 1.325 .253 .467 Total 299 Corrected Total 298
R Squared = .096 (Adjusted R Squared = .045) Dependent Variable: item 7 (What is your overall satisfaction with the quality of life in Indianapolis?)

59
− There are no city-service attributes that serve as potential indicators of
whether residents’ perception of quality of life affects cultural tourism
investment.
− There are no correlations between demographic factors such as; age, gender,
ethnicity, and household income with the perception that investing in cultural
events and attractions for tourists is good for residents.
Hypothesis one was rejected based on a two-way factorial ANOVA that was run
to examine what city-service attributes identify as potential indicators of whether
residents’ perception of quality of life in Indianapolis affects residents’ perception that
investing in cultural events and attractions for tourists is good for residents. Results from
the ANOVA indicated several interactions between city-service attributes and resident
perception of quality of life on residents’ perception of whether investing in cultural
events and attractions for tourists is good for residents. To further examine these
interactions, a simple main effects analysis was then performed on the significant city-
service attributes (items 5A, 5B, 5G, 5H, 5I, 5J, and 5K) and resident perception of
quality of life.
Hypothesis two was accepted based on an ANOVA run to examine whether there
were any differences in the perception that investing in cultural events and attractions for
tourists is good for residents associated with different groups using the following
demographic factors (age, income, ethnicity, and gender). Results indicated that none of
the demographic factors were significant when it came to effecting the perception that
investing in cultural events and attractions for tourists is good for residents.

60
Chapter Five
SUMMARY, IMPLICATIONS, AND RECOMMENDATIONS
Summary
The purpose of the study was to examine city-service attributes to determine if
they act as potential indicators of whether residents’ perception of quality of life affects
cultural tourism investment. This data was used to determine what residents thought
concerning various city-service attributes and cultural tourism in Indianapolis.
Demographic information was also collected. The study addressed the problem with the
following research questions:
− What city-service attributes are identified as potential indicators of whether
residents’ perception of quality of life affects cultural tourism investment?
− Were there any correlations between demographic factors of age, gender,
ethnicity, and household income with the perception that investing in cultural
events and attractions for tourists is good for residents?
Residents of Indianapolis and the surrounding area who were eighteen years of
age or older were a convenient sample used to survey resident perception of quality of
life. Demographics of the survey participants and city-service attributes were analyzed
and examined for significant correlation with items relating to resident perception of
quality of life and cultural tourism investment.
Implications
The findings of this study have unique academic and applied implications in the
continued study of tourism in Indianapolis, Indiana. This study provided research related
to the study of quality of life in Indianapolis and reported statistics for the 2012
61
Indianapolis Quality of Life survey. The data and statistical analysis reported in this
study will serve as valuable information for future endeavors concerning cultural tourism
and quality of life in Indianapolis.
The identification of city-service attributes that significantly impact resident
perception of quality of life and city-service attributes that, in conjunction with resident
perception of quality of life, affect how residents perceive cultural tourism investments is
important information that can be utilized by future researchers, tourism planners and
policymakers in Indianapolis. The analysis revealed what city-service attributes are
important to residents of Indianapolis and demographic factors that affect resident
perception of quality of life. The continued examination of these city-service attributes
may help to identify areas of public service that need to be improved.
This study demonstrates that resident level of awareness pertaining to the benefits
of cultural tourism investment are relatively low. Tourism planners, officials, and
researchers can utilize this knowledge to better facilitate methods to gain resident support
for cultural tourism investment and development. In addition, this research can be
utilized to better understand the needs of residents and how tourism and various city-
services impact their quality of life. If cultural tourism planners and other tourism
officials better understand methods to gain resident support for cultural tourism
investment then they can maximize economic and cultural tourism gains for the city.
Recommendations
The Indianapolis Quality of Life survey has been continually updated since the
beginning of the survey in the early 2000’s. It is imperative to continue to elicit feedback
concerning the study, instrument, and goals of the research. It is crucial to strive to

62
obtain a representative sample of Indianapolis and to gain satisfactory responses using the
convenience sample survey technique. Ultimately, the goals of tourism research should
be to focus on the crossroads of where tourist and resident satisfaction intersect and
attempt to find equilibrium between the desires and needs of both groups.
Future studies specifically examining resident perception of quality of life in
Indianapolis would benefit from an increased scope of the survey. Expanding survey
locations to further reach communities that are outside of downtown would produce
results that better encapsulate the wide socio-demographic aspects of the city and be
more representative of the population. A limitation of the Indianapolis Quality of Life
survey is that participants may be influenced by the cultural and sporting events they
were attending and/or were occurring during the survey period. Future studies should
work on ways to mitigate this impact for a less biased sample. It may be beneficial to
discuss ways to include residents of Indianapolis in the quality of life survey that have
less-opportunities to attend cultural and sporting events in the city. Importantly,
continued research should examine methods to increase resident quality of life using
specific data concerning important city-service attributes and demographic factors.
Concerning future studies related to resident perception of cultural tourism
investment it is advised to design an instrument to solely examine this issue. This would
produce more accurate results and remove any problems associated with an instrument
not specifically designed to study resident perception of cultural tourism investment. It
would be beneficial to obtain a more representative sample of the population of
Indianapolis by altering and adding surveying locations throughout Marion and
surrounding counties. In addition, it is crucial to consider what may affect resident

63
perception of cultural tourism investment and new methods to explore this topic should
be considered. For example, other items not analyzed for this study from the Indianapolis
Quality of Life survey could be analyzed. For example, it may be necessary to examine
cultural tourism funding and the role of public subsidies.
In order to progress this research, studies should be done to understand how to
better educate residents as to the benefits of cultural tourism investment. Furthermore,
new quantitative statistical methods should be explored to better analyze data and yield
new findings.
I suggest future studies also include sports tourism. This thesis specifically
focused on cultural tourism to better present data regarding this issue; however, I believe
future studies that examine both cultural and sports tourism could be beneficial. Aspects
such as city-services and resident perception of quality of life could be examined from
both cultural and sports tourism perspectives. This approach could produce beneficial
results regarding cultural and sports tourism investment and potentially highlight
demographic characteristics unique to cultural tourism and sports tourism supporters in
the city of Indianapolis.

64
Appendix A
2012 INDIANAPOLIS QUALITY OF LIFE SURVEY
COMMUNITY INVOLVEMENT/SENSE OF COMMUNITY
1. How much do you agree with the following statement? Circle one response.
2. What were the reasons you selected your response to question 1 above? Check all that apply.
3. How safe do you feel in the following situations? Circle one response for each statement.
How safe do you feel…
Very Safe
Safe Neither Safe or unsafe
Unsafe Very Unsafe
In your home during the daytime 1 2 3 4 5 In your neighborhood during the daytime 1 2 3 4 5 In downtown Indianapolis during the daytime 1 2 3 4 5 In your home after dark 1 2 3 4 5 In your neighborhood after dark 1 2 3 4 5 In downtown Indianapolis after dark 1 2 3 4 5
The Department of Tourism, Conventions and Event Management is conducting a 2012 Indianapolis Quality of Life Study of residents. You must be an Indianapolis resident, 18 or older to participate in the study. Your name is not required and only group results will be reported. The survey will take about 10 minutes to complete. Thank you for your time and valuable information. If you have questions, please contact us at 317.278.1647 or [email protected].
I feel a sense of community with others in Indianapolis and am able to share my interests and concerns.
Strongly Agree Neutral Strongly Disagree
1 2 3 4 5
____ Family connections in Indianapolis ____ Similar/different interests, leisure pursuits, stage of life ____ Interest in community activities ____ Ease to meet people ____ People’s approachability and friendliness ____ Other

65
4. If you felt “unsafe” and “very unsafe” in any parts of Q3 above, for what reasons did you say this? Check all that apply.
5. How much do you agree or disagree with the statement, “I feel a sense of pride in the way Indianapolis looks and feels in regards to ______.” Circle one response for each statement.
Strongly Agree
Agree Neutral Disagree Strongly Disagree
Clean/no litter 1 2 3 4 5 Nice green city/beautiful parks and gardens
1 2 3 4 5
No crimes/theft 1 2 3 4 5 No air pollution 1 2 3 4 5 Many attractions/activities/events/things to do
1 2 3 4 5
Good transportation system 1 2 3 4 5 Great place to shop/nice shopping malls 1 2 3 4 5 Good/well maintained roads 1 2 3 4 5 Not too much traffic/easy to get around 1 2 3 4 5 Safety 1 2 3 4 5 Reliable police presence 1 2 3 4 5
6. More and more people from different cultures and traditions are moving to Indianapolis. Overall, do you think this makes Indianapolis ______. Select one response.
7. What is your overall satisfaction with the quality of life in Indianapolis? Select one response.
____ Traffic e.g. busy roads/heavy traffic/fast cars/lack of pedestrian crossings ____ Other environmental dangers e.g. unsafe playgrounds/rivers/open drains ____ Stranger danger e.g. undesirable residents/strange people/transients ____ Crime ____ Bullying ____ Other
____ A much better place to live ____ A better place to live ____ Makes no difference ____ A worse place to live
A much worse place to live
____ Dissatisfied ____ Slightly Dissatisfied ____ Neutral ____ Slightly Satisfied ____ Satisfied

66
CULTURAL TOURISM AND INDIANAPOLIS
Cultural tourism is defined as experiencing the diverse mosaic of places, traditions, arts, celebrations and experiences that the Indianapolis area offers to residents and visitors. It is an important component of an overall tourism plan that emphasizes the total Indianapolis experience.
8. Use the above definition of cultural tourism and circle one response for each statement below.
Strongly Agree
Agree Neutral Disagree Strongly Disagree
I am aware of the city’s recent accomplishments in cultural tourism.
1 2 3 4 5
I am aware of the city’s plans for developing the Cultural Trail.
1 2 3 4 5
Indianapolis has the potential to succeed as a cultural tourism destination.
1 2 3 4 5
Cultural tourism helps create a positive image of Indianapolis.
1 2 3 4 5
Promoting cultural tourism can raise the profile of Indianapolis in other parts of the world.
1 2 3 4 5
Cultural tourism results in more attractions and events for the benefit of residents.
1 2 3 4 5
Cultural tourism is good for the Indianapolis economy.
1 2 3 4 5
I enjoy the cultural attractions the city offers.
1 2 3 4 5
I enjoy the city wide events and festivals.
1 2 3 4 5
I’m more aware of the city’s culture because of cultural tourism promotion.
1 2 3 4 5
Meeting and talking to tourists is a positive experience.
1 2 3 4 5
Meeting tourists from around the world is life enriching.
1 2 3 4 5
Special events and festivals help create a community spirit across the city.
1 2 3 4 5
Investing in cultural events and attractions for tourists is good for residents.
1 2 3 4 5
More should be done to promote cultural tourism in Indianapolis.
1 2 3 4 5
Funding of cultural tourism is the responsibility of local government.
1 2 3 4 5

67
9. In your opinion, successful cultural tourism projects in Indianapolis mainly depend on which of the following factors? Check all that apply.
SPORTS TOURISM AND INDIANAPOLIS
Sports tourism refers to travel to watch or participate in sports related activities. It capitalizes on the relationship between tourism and the high-profile, multi-billion dollar sports industry.
10. Use the above definition of sports tourism and circle one response for each statement below.
Strongly Agree
Agree Neutral Disagree Strongly Disagree
I am aware of the city’s recent accomplishments in sports tourism (Super Bowl 2012, 2011 Big Ten Football Title Game)
1 2 3 4 5
I am aware of the city’s plans for attracting major sports events.
1 2 3 4 5
Indianapolis has the potential to succeed as a sports tourism destination.
1 2 3 4 5
Sports tourism helps create a positive image of Indianapolis.
1 2 3 4 5
Promoting sports tourism can raise the profile of Indianapolis in other parts of the world.
1 2 3 4 5
Sports tourism results in more attractions and events for the benefit of residents.
1 2 3 4 5
Sports tourism is good for the Indianapolis economy.
1 2 3 4 5
I enjoy sports related activities I can participate in.
1 2 3 4 5
I enjoy sports related events that I can attend.
1 2 3 4 5
I’m more aware of the city’s sports related offerings because of sports tourism promotion.
1 2 3 4 5
Meeting and talking to tourists is a positive experience.
1 2 3 4 5
____ Preserve local customs ____ Organize festivals and events ____ Preserve historic sites and heritage attractions ____ Promote museums and galleries ____ Link the arts and tourism in communities ____ Invest in community’s quality of life ____ Others (please specify) ___________________________________________

68
Meeting tourists from around the world is life enriching.
1 2 3 4 5
Sports related events and activities help create a community spirit across the city.
1 2 3 4 5
Investing in sports is good for residents. 1 2 3 4 5 More should be done to promote sports tourism in Indianapolis.
1 2 3 4 5
Funding of sports tourism is the responsibility of local government.
1 2 3 4 5
DEMOGRAPHICS
11. What is your gender? ____ Male ____ Female
12. What is your relationship status? ____ Married/Partnered ____ Divorced ____ Single ____ Other
13. What is the zip code of your residence? ______________
14. What is your age? ____13-30 ____31-43 ____44-56 ____57-72 ____Above 73
15. Which of the following represents your race or ethnic background? Select one.
16. Which of the following levels best describes your annual household income?
17. How long have you lived in Indianapolis? If you moved away and returned, please included past occasions when you lived here.
____ Hispanic ____ Black, not of Hispanic origin ____ White, not of Hispanic origin ____ Asian or Pacific Islander ____ American Indian/Alaskan Native ____ Do not wish to answer ____ Mixed ethnicity
____ $0 - $30,000 ____ $90,001 - $120,000 ____ $30,001 - $60,000 ____ $120,001 - $150,000 ____ $60,001 - $90,000 ____ Over $150,000
____ Less than 1 year ____ 4 years to just under 10 years ____ 1 year to just under 2 years ____ 10 years of more ____ 2 years to just under 4 years

69
Appendix B
ZIP CODE DATA
Table 11. 2012 Indianapolis Quality of Life Survey Zip Code Data Zip Code Frequency Zip Code Frequency 46011 1 46218 2 46032 3 46219 5 46033 4 46220 6 46037 2 46221 1 46038 3 46224 3 46040 1 46225 10 46060 1 46226 1 46074 4 46227 5 46077 1 46228 6 46101 1 46229 1 46107 1 46231 6 46108 1 46234 3 46113 7 46235 2 46123 3 46237 16 46131 1 46239 11 46140 2 46240 7 46142 4 46241 1 46143 1 46250 9 46161 1 46254 2 46162 1 46255 1 46167 1 46256 7 46181 1 46259 1 46183 2 46260 4 46184 1 46261 1 46201 20 46266 1 46202 39 46268 7 46203 14 46270 1 46204 23 46275 1 46205 6 46278 3 46206 1 46280 1 46208 13 46815 1 46213 1 47904 1 46214 2 47905 1 46217 3 60561 1

70
Plate 1. 2012 Indianapolis Quality of Life Survey Zip Code Map Top Eight Reported Zip Codes
46201 46202
46203
46204
46208
46225
46237 46239
Adapted from www.city-data.com 2013
Zip Code and Frequency Reported 46201 = 20 46204 = 23 46237 = 16 46202 = 39 46208 = 13 46239 = 11 46203 = 14 46225 = 10

71
REFERENCES
Andereck, K., & Vogt, C. (2000). The Relationship Between Residents' Attitudes Toward Tourism and Tourism Development Options. Journal of Travel Research, 39(27), 27-36.
Anderreck, K., & Nayaupane, G. (2010). Exploring the Nature of Tourism and Quality of
Life Perceptions among Residents. Journal of Travel Research, 50(3), 248-260. Andriotis, K., & Vaughan, R. (2003). Urban Residents Attitudes Toward Tourism
Development: The Case of Crete. Journal of Travel Research, 42, 172-185. doi:10.1177/0047287503257488
Aref, F. (2011). The Effects of Tourism on Quality of Life: A Case Study of Shiraz, Iran.
Life Science Journal, 8(2), 26-30. Avgoustis, S., Cecil, A., Fu, Y.-Y., & Wang, S. (2005). Exploring the Relationship
Between Cultural Tourism and Quality of Life. ISTTE Conference, (p. 14). Borkovic-Vrtiprah, V., & Ban, I. (2002). The Role of Cultural Heritage in Tourism. In D.
A. Jelincic (Ed.), Culture: A Driving Force for Urban Tourism - Application of Experiences to Countries in Transition (pp. 107-118). Dubrovnik: Institute for International Relations Zagreb.
Bracalente, B., Chirieleison, C., Cossignani, M., Ferrucci, L., Gigliotti, M., & Ranalli, M.
G. (2011). The Economic Effects of Cultural Events: The Pintoricchio Exhibition in Perugia. Event Management, 15, 137-149.
Brida, J. G., Disegna, M., & Osti, L. (2011). Residents Perceptions of Tourism Impacts
and Attitudes Towards Tourism Policies in a Small Mountain Community. Benchmarking: An International Journal, 30. Retrieved from http://dx.doi.org/10.2139/ssrn.1839244
Brunt, P., & Cortney, P. (1999). Host Perceptions of Sociocultural Impacts. Annals of
Tourism Research, 26(3), 493-515. Burns, P., & Holden, A. (1995). Tourism: A New Perspective. London: Prentice-Hall. Cecil, A., Fu, Y.-Y., Wang, S., & Avgoustis, S. (2008). Exploring Resident Awareness of
Cultural Tourism and It's Impact on Quality of Life. European Journal of Tourism Research, 1(1), 39-52.
Cecil, A., Fu, Y.-Y., Wang, S., & Avgoustis, S. (2010). Cultural Tourism and Quality of
Life: A Longitudinal Study. European Journal of Tourism Research, 54-66. Chen, J. (2000). An Investigation of Urban Residents' Loyalty to Tourism. Journal of
Hospitality & Tourism Research, 5-19.

72
Chen, J. (2001). Assessing and Visualizing Tourism Impacts from Urban Residents' Perspective. Journal of Hospitality & Tourism Research, 235-250.
City-Data.com. (2013, February 20). Indianapolis Zip Code Map. Retrieved from
http://www.city-data.com/zipmaps/Indianapolis-balance-Indiana.html Coccossis, H. (2009). Sustainable Tourism and Cultural Heritage. Cooke, K. (1982). Guidelines for Socially Appropriate Tourism Development in British
Columbia. Journal of Travel Research, 21, 22-28. Crompton, R., & Sanderson, K. (1990). Gendered Jobs and Social Change. London:
Unwin Hyman. Demirkaya, H., & Cetin, T. (2010). Residents' Perception on the Social and Cultural
Impacts of Tourism in Alanya (Antalya-Turkey). Ekev Akademi Dergisi, 14(42), 383-392.
Diener, E., & Suh, E. (1997). Measuring Quality of Life: Economic, Social, and
Subjective Indicators. Social Indicators Research, 40(1/2), 189-216. Doxey, G. (1975). A Causation Theory of Visitor-Resident Irritants, Methodology, and
Research Inferences. Sixth annual conference proceedings of the Travel Research Association (pp. 195-198). San Diego: Travel and Tourism.
Faulkner, B., & Tideswell, C. (2010). A Framework for Monitoring Community Impacts
of Tourism. Journal of Sustainable Tourism, 5(1), 3-28. Field, A. (2010). Discovering Statistics Using SPSS. Sussex, United Kingdom: Sage. Fu, Y. Y., Cecil, A., Wang, S., & Avgoustis, S. (2007). Predicting Residents' Perceptions
of Cultural Tourism Attractiveness. Tourism Today, 7, 125-138. Furr, R., & Bacharach, V. (2008). Psychometrics: An Introduction. Thousand Oaks:
Sage. Garcia, B. (2004, November). Cultural Policy and Urban Generation in Western
European Cities: Lessons from Experience, Prospects for the Future. Local Economy, 19(4), 312-326.
Geertz, C. (1973). The Interpretation of Cultures. New York: Basic Books, Inc. Getz, D. (1991). Festivals, Special Events and Tourism. New York: Van Nostrand
Reinhold.

73
Getz, D. (1994). Residents' Attitudes Towards Tourism: A Longitudinal Study in Spey Valley, Scotland. Journal of Tourism Management, 247-258.
Girard, T., & Gartner, W. (1993). Second Home Second View: Host Community
Perceptions. Annals of Tourism Research, 20(4), 685-700. Harrill, R. (2004). Resident's Attitudes Toward Tourism Development: A Literature
Review with Implications for Tourism Planning. Journal of Planning Literature, 18(1), 1-16. doi:0885412203260306
Harrison, D. (1992). Tourism to Less Developed Countries: The Social Consequences in
Tourism and the Less Developed Countries. London: Bellhaven. Hester, J. (1990). The Sacred Structure of Small Towns. Small Town, 20, 2-21. Howard, J. (2007). How Much Does Transportation Affect Your Life? Retrieved from
Transportation Demand Management Research Center: http://www.commuterpage.com/research/study_list.asp?jobID=ACCS016&studyID=91
Huh, C., & Vogt, C. (2007). Changes in Residents' Attitudes Toward Tourism Over
Time: A Cohort Analytical Approach. Journal of Travel Research, 446-455. Huh, J. (2002). Tourist Satisfaction with Cultural / Heritage Sites: The Virginia Historic
Triangle. Blacksburg: Virginia Polytechnic Institute and State University. Indianapolis Convention & Visitors Association. (2012). Retrieved December 2012, from
Visit Indy: http://visitindy.com/indianapolis-about-icva Indy Connect. (2013, February 20). Retrieved from Indy Connect:
http://www.indyconnect.org/pages/home/ Indy Irish Fest. (2012, March 15). Indy Irish Fest. Retrieved from Indy Irish Fest:
http://www.indyirishfest.com/sponsors/becomesponsor.html IndyGo. (2010). IndyGo Market Assessment. Indianapolis. Retrieved from
www.indygo.net:8080/.../IndyGoMarketAssessment_Part2.pdf Inglehart, R., & Rabier, J. (1986). Aspirations Adapt to Situations--But Why Are the
Belgians so Much Happier Than the French? In F. Andrews, Research on the Quality of Life (pp. 1-56). Ann Arbor: Insitutue for Social Research, University of Michigan.
Iwasaki, Y. (2007). Leisure and Quality of Life in an International and Multicultural
Context: What are Major Pathways Linking Leisure to Quality of Life. Social Indicators Research, 82, 233-264. doi:10.1007/s11205-006-9032-z
74
Jelincic, D. A. (2002). Croatian Cultural Tourism Development Strategy. Culture: A Driving Force for Urban Tourism - Application of Experiences to Countries in Transition (pp. 1-166). Zagreb: Insitute for International Relations.
Jurowski, C., & Brown, D. (2001). A Comparison of the Views of Involved Versus
Noninvolved Citizens on Quality of Life and Tourism Development. Journal of Hospitality and Tourism Research, 25, 355-370. doi:10.1177/109634800102500401
Kim, K. (2002). The Effects of Tourism Impacts upon Quality of Life of Residents in the
Community. Blacksburg, Virginia, United States: Virgnia Polytechnic Institute and State University.
King, C., Wang, S., & Avgoustis, S. (2011). Perceptions about Expanding a City's
Tourism Economy Through Sport and Culture: The Case of Indianapolis' Event Tourism Segment. Tourism Today, 11, 40-53.
Lloyd, K., & Little, D. (2007). Quality of Life, Aren't We Always Searching for That?
How Women Can Achieve Enchanced Quality of Life Through Participation in Outdoor Adventure Recreation. Journal of the Canadian Association for Leisure Studies, 29(2), 147-180.
Long, P. H., & Kayat, K. (2011). Residents' Perceptions of Tourism Impact and Their
Support for Tourism Development: The Case Study of Cuc Phuong National Park, Ninh Binh Province, Vietnam. European Journal of Tourism Research, 123-146.
Loukissas, P. (1983). Public Participation in Community Tourism Planning: A Gaming
Simulation Approach. Journal of Travel Research, 22, 18-23. Mason, P., & Cheyne, J. (2000). Residents' Attitudes to Proposed Tourism Development.
Annals of Tourism Research, 27(2), 391-411. Matarrita-Cascante, D. (2010). Changing Communities, Community Satisfaction, and
Quality of Life: A View of Multiple Perceived Indicators. Social Indicators Research, 98, 105-127. doi:10.1007/s11205-009-9520-z
Mathieson, A.. Wall, G. (1982). Tourism: Economic, Physical and Social Impacts.
Harlow: Longman. McCool, S., & Martin, S. (1994). Community Attachment and Attitudes Toward Tourism
Development. Journal of Travel Research, 29(34). McGehee, N. G., & Andereck, K. L. (2004). Factors Predicting Rural Residents' Support
of Tourism. Journal of Travel Research, 43, 131-140.

75
McKercher, B. (1993). Some Fundamental Truths about Tourism: Understanding Tourism's Social and Environmental Impacts. Journal of Sustainable Tourism, 1(1), 6-16.
Oviedo-Garcia, M. A., Castellanos-Verdugo, M., & Martin-Ruiz, D. (2008). Gaining
Residents' Support for Tourism and Planning. International Journal of Tourism Research, 10, 95-109. doi:10.1002/jtr.644
Queens University Belfast. (2005). Definition of Key Indicators for the Analysis of the
Impact of Cultural Tourism Strategies on Urban Quality of Life. Belfast: Queens University Belfast.
Ramkissoon, H., & Nunkoo, R. (2011). City Image and Perceived Tourism Impact:
Evidence from Port Louis, Mauritius. International Journal of Hospitality & Tourism Administration, 12, 123-143. doi:10.1080/15256480.2011.564493
Raphael, D., Steinmetz, B., & Renwick, R. (1998). How to carry out a community quality
of life project: A manual, a health promotion approach to understanding communities. Toronto: University of Toronto.
Richards, G., & Wilson, J. (2004, September). The Impact of Cultural Events on City
Image: Rotterdam, Cultural Capital of Europe 2001. Urban Studies, 41(10), 1931-1951.
Ross, G. (1992). Resident Perceptions of the Impact of Tourism on an Australian City.
Journal of Travel Research, 13-17. Sharma, B., & Dyer, P. (2009). Residents' Involvement in Tourism and Their Perceptions
of Tourism Impacts. Benchmarking: An International Journal, 16(3), 351-371. Sharpley, R. (1994). Tourism, Tourists and Society. Huntingdon: ELM. Smith, M., & Krannich, R. (1998). Tourism Dependence and Resident Attitudes. Annals
of Tourism Research, 25(4), 783-802. Snaith, T., & Haley, A. (1999). Residents' Opinions of Tourism Development in the
Historic City of York, England. Tourism Management, 20(5), 595-603. Throsby, D. (2009). Tourism, Heritage and Cultural Sustainability. In L. F. Girard, & P.
Nijkamp, Cultural Tourism and Sustainable Local Development (pp. 13-30). Twynam, G. D., & Johnston, M. (2010). Changes in Host Community Reactions to a
Special Sporting Event. Current Issues in Tourism, 7(3), 242-261. Tylor, E. (1871). Primitive Culture. New York: J.P. Putnam's Sons.

76
United States Census Bureau. (2012, November 5). Retrieved from United States Census Bureau: http://quickfacts.census.gov/qfd/states/18/1836003.html
Urry, J. (1991). The Sociology of Tourism. In Progress in Tourism, Recreation and
Hospitality Management (Vol. 3, pp. 48-57). Wang, S., Fu, Y.-Y., Cecil, A., & Avgoustis, S. (2006). Residents' Perceptions of
Cultural Tourism and Quality of Life - A Longitudinal Approach. Tourism Today, 47-61.
Wood, K. (2007). Resident Volunteer Perceptions of Sport Tourism Impacts: A Case
Study of Indianapolis, Indiana. Bloomington, Indiana: Indiana University. World Health Organization. (1997). Measuring Quality of Life. Geneva: World Health
Organization. Retrieved 2012, from http://www.who.int/mental_health/media/68.pdf
Yamada, N., Heo, J., King, C., & Fu, Y.-Y. (2009). Life Satisfaction of Urban Residents:
Do Health Perception, Wealth, Safety, Community Pride, and Cultural Tourism Matter? International CHRIE Conference (p. 8). Amherst: University of Massachusetts.
Yunis, E. (2004). Indicators to Measure Sustainability in Tourism. 7th International
Forum on Tourism Statistics (p. 5). Stockholm: World Tourism Organization. Zanini, F., Lando, F., & Bellio, M. (2008). Effects of Tourism on Venice: Commercial
Changes Over 30 Years. Working Papers, 2-20.
CURRICULUM VITAE
Christopher Scott Gullion Education
• M.A., Tourism, Conventions, and Event Management Indiana University – Purdue University – Indianapolis: May 2013
• M.A., Anthropology Ball State University, Muncie, Indiana: July 2008
• B.S., Anthropology Ball State University, Muncie, Indiana: August 2005 Studied abroad in the United Kingdom and Italy. Summer 2004
Professional Experience • Department of Tourism, Conventions, and Event Management
Graduate Research Assistant Indiana University – Purdue University – Indianapolis December 2011 – May 2013
• Applied Archaeological Laboratories Field Archaeologist and Laboratory Assistant Department of Anthropology, Ball State University Muncie, Indiana May 2005 – August 2007
Professional Memberships • Member, American Anthropological Association
Honors and Awards
• Graduate Research Assistantship, Indiana University – Purdue University – Indianapolis
• Lambda Alpha National Anthropology Honor Society, Alpha Chapter of Indiana
Areas of Research Interest • Cultural tourism development • Resident quality of life • Transportation and infrastructure • Tourism anthropology
Conferences and Research Presentations
• IUPUI Research Day, Indianapolis, Indiana April 2013 o Invited Poster Session
Volunteer Experience • Volunteer, Eiteljorg Museum of American Indians and Western Art • Volunteer, Indiana State Museum
Organizational and Research Experience
• Graduate research assistantship related research for the Department of Tourism, Conventions, and Event Management at Indiana University – Purdue University – Indianapolis. Spring 2012 – May 2013
o Graduate student handbook o Tourism program research o Procurator duties
• Catalogued Clark Wissler archives at Ball State University. Spring 2006 • Organization of Anthropology Club activities. Fall 2005 • Developed, organized, and participated in leadership activities for Student Action
Team of Ball State University. Fall 2003
Collegiate Activities • Member, Anthropology Club, Ball State University, 2004-2007 • Member, Student Action Team, Ball State University, 2002-2003