CULTURAL IDENTITY AND WILLINGNESS TO PROTECT AND … · 1 Cultural identity and willingness to...
20
CULTURAL IDENTITY AND WILLINGNESS TO PROTECT AND PRESERVE ART Claudio Detotto Marta Meleddu Marco Vannini WORKING PAPERS 2017/02 CONTRIBUTI DI RICERCA CRENOS !"#!
Transcript of CULTURAL IDENTITY AND WILLINGNESS TO PROTECT AND … · 1 Cultural identity and willingness to...
CULTURAL IDENTITY AND WILLINGNESS TO PROTECT AND PRESERVE ART
Claudio Detotto Marta Meleddu Marco Vannini
�
WORKING PAPERS
2 0 1 7 / 0 2
C O N T R I B U T I D I R I C E R C A C R E N O S
FISCALITÀ LOCALE E TURISMO LA PERCEZIONE DELL’IMPOSTA DI SOGGIORNO E DELLA
TUTELA AMBIENTALE A VILLASIMIUS
Carlo Perelli Giovanni Sistu Andrea Zara
QUADERNI DI LAVORO
2 0 1 1 / 0 1
T E M I E C O N O M I C I D E L L A S A R D E G N A
!"#!$

C E N T R O R I C E R C H E E C O N O M I C H E N O R D S U D ( C R E N O S )
U N I V E R S I T À D I C A G L I A R I U N I V E R S I T À D I S A S S A R I
C R E N O S w a s s e t u p i n 1 9 9 3 w i t h t h e p u r p o s e o f o r g a n i s i n g t h e j o i n t r e s e a r c h e f f o r t o f e c o n o m i s t s f r o m t h e t w o S a r d i n i a n u n i v e r s i t i e s ( C a g l i a r i a n d S a s s a r i ) i n v e s t i g a t i n g d u a l i s m a t t h e i n t e r n a t i o n a l a n d r e g i o n a l l e v e l . C R E N o S ’ p r i m a r y a i m i s t o i m p r o v e k n o w l e d g e o n t h e e c o n o m i c g a p b e t w e e n a r e a s a n d t o p r o v i d e u s e f u l i n f o r m a t i o n f o r p o l i c y i n t e r v e n t i o n . P a r t i c u l a r a t t e n t i o n i s p a i d t o t h e r o l e o f i n s t i t u t i o n s , t e c h n o l o g i c a l p r o g r e s s a n d d i f f u s i o n o f i n n o v a t i o n i n t h e p r o c e s s o f c o n v e r g e n c e o r d i v e r g e n c e b e t w e e n e c o n o m i c a r e a s . T o c a r r y o u t i t s r e s e a r c h , C R E N o S c o l l a b o r a t e s w i t h r e s e a r c h c e n t r e s a n d u n i v e r s i t i e s a t b o t h n a t i o n a l a n d i n t e r n a t i o n a l l e v e l . T h e c e n t r e i s a l s o a c t i v e i n t h e f i e l d o f s c i e n t i f i c d i s s e m i n a t i o n , o r g a n i z i n g c o n f e r e n c e s a n d w o r k s h o p s a l o n g w i t h o t h e r a c t i v i t i e s s u c h a s s e m i n a r s a n d s u m m e r s c h o o l s . C R E N o S c r e a t e s a n d m a n a g e s s e v e r a l d a t a b a s e s o f v a r i o u s s o c i o - e c o n o m i c v a r i a b l e s o n I t a l y a n d S a r d i n i a . A t t h e l o c a l l e v e l , C R E N o S p r o m o t e s a n d p a r t i c i p a t e s t o p r o j e c t s i m p a c t i n g o n t h e m o s t r e l e v a n t i s s u e s i n t h e S a r d i n i a n e c o n o m y , s u c h a s t o u r i s m , e n v i r o n m e n t , t r a n s p o r t s a n d m a c r o e c o n o m i c f o r e c a s t s . w w w . c r e n o s . i t i n f o @ c r e n o s . i t
C R E N O S – C A G L I A R I V I A S A N G I O R G I O 1 2 , I - 0 9 1 0 0 C A G L I A R I , I T A L I A
T E L . + 3 9 - 0 7 0 - 6 7 5 6 4 0 6 ; F A X + 3 9 - 0 7 0 - 6 7 5 6 4 0 2
C R E N O S - S A S S A R I V I A M U R O N I 2 3 , I - 0 7 1 0 0 S A S S A R I , I T A L I A
T E L . + 3 9 - 0 7 9 - 2 1 3 5 1 1 T i t l e : C U L T U R A L I D E N T I T Y A N D W I L L I N G N E S S T O P R O T E C T A N D P R E S E R V E A R T I S B N : 9 7 8 8 8 9 3 8 6 0 2 7 7 F i r s t Ed i t i on : Feb rua ry 2017 C u e c e d i t r i c e © 2 0 1 7 b y S a r d e g n a N o v a m e d i a S o c . C o o p . V i a B a s i l i c a t a n . 5 7 / 5 9 - 0 9 1 2 7 C a g l i a r i T e l . e F a x + 3 9 0 7 0 2 7 1 5 7 3

1
Cultural identity and willingness to protect and preserve art
Claudio Detotto
University of Corsica and CRENoS
Marta Meleddu University of Sassari and CRENoS
Marco Vannini
University of Sassari and CRENoS
Abstract The aim of this paper is to analyse the willingness to pay of art-goers for the protection and preservation of cultural artefacts. To this purpose, a discrete choice experiment approach is employed. The experiment took place in 2011 during a major exhibition dedicated to the artist Costantino Nivola (1911-1988). His works, especially those based on the novel sand-casting technique, are known worldwide and many of them were produced after he moved from Sardinia (Italy) to the United States (where he lived from 1939 to his death in 1988). Over this period he never cut his ties with his native land. As a result, both the American and the Sardinian culture affect and show up in his works. In this context, the discrete choice experiments allowed us to estimate not only the price that people are prepared to pay for the security of Nivola's artefacts but also the contribution of non-market components, such as identity, to preserve those objects. Accounting for heterogeneity, the empirical findings show that among visitors there is a substantial willingness to partially cover the cost of preserving the cultural heritage, with significant differences related to the characteristics of the collections considered. Keywords: Cultural heritage; Discrete Choice Experiment; Identity; Mixed Logit. Jel classification: C25, D60, D61, Z11

2
1. Introduction According to many special reports (e.g. OECD, 2015, 2009; ATLAS, 2007; Europa
Nostra, 2005), cultural tourism is one of the largest and fastest growing global tourism markets and cultural assets are increasingly being used to promote destinations. Whether tangible or intangible, these assets are crucial for branding and marketing places worth visiting and their multivalue nature needs proper assessment for sound cultural policy and management. Economics competes and interacts with other disciplines in an effort to understand the net benefits to stakeholders of the infinite manifestations (objects, sites, monuments, traditions and so on) of cultural heritage. Not an easy task, as "the concept of what is heritage has evolved and expanded, and new groups have joined the specialists in its identification. These groups of citizens, of professionals from other fields, and of representatives of special interests arrive in the heritage field with their own criteria and opinions—their own “values”—which often differ from our own as heritage specialists."(de la Torre and Mason, 2002, p. 3). One implication of this trend is the need to investigate what these new groups think about the cultural significance of heritage and to incorporate their opinions into the policy processes.
We share the view that "cultural heritage is a mixed good, framed over a multidimensional, multivalue, and multiattribute environment, generating private and public/collective benefits for current, potential, and future users and even for nonusers" (see Mourato and Mazzanti, 2002, p. 52), and realize that while a large proportion of cultural goods and services are traded in markets many are not. Following the economic approach, revealed preference (RP) and stated preference techniques (SP) can be applied in these cases. The former infer the value to the public of nonmarket goods by looking at surrogate markets, but even when such associated markets exist, they are unable to estimate option and nonuse values. The latter use hypothetical markets or scenarios to elicit individual preferences, allowing for the estimation of the full range of nonuse values. In particular, SP formats such as choice modelling, by describing a good or policy in terms of its component attributes, allow to infer values (in money terms) not only for the good/policy as a whole but also for each of its attributes.
Here we apply the discrete choice experiment (DCE) method to investigate individuals’ willingness to pay for the protection and preservation of a hypothetical art collection (see below) controlling for intangible elements and respondents heterogeneity. In particular, we deliberately performed the experiment on the venue of a major temporary exhibition that featured all artworks that could enter the hypothetical collection of interest. Hence, respondents had the opportunity to figure out directly the core elements of the different scenarios. Visitors were asked to choose over a set of permanent collections spawned from the current show by combining different levels of four attributes. These were selected in order to elicit separate values for the various functions of interest, namely creation of a permanent collection, identity representation, tourism facilities and security of the artworks. From a policy perspective the study may help to configure optimally cultural attractors both in terms of security level and curatorial design. Moreover, it can shed some light on the true cost of crimes against art (see Detotto and Vannini, 2010) when identity values matter.
The article is organized as follows. Section 2 discusses the methodological background and the economic literature. Section 3 describes the data and the empirical

3
application while Section 4 presents the econometric framework. Empirical results and welfare implications are presented in Section 5. Section 6 concludes.
2. The methodological background
Total economic values can be split in use and non-use components. While use values arise from individual willingness to pay (WTP) to visit cultural sites, non-use values derive from people WTP to preserve those assets despite visiting them or not. Altruistic, bequest and existence value compose the total non-use value. The first component embeds the fact that others may experience cultural goods while bequest value refers to preservation for future generations. The conservation of cultural good as such identifies the existence value.
Knowledge of use and non-use values may help to calibrate cultural policies, allocating resources upon rigorous pricing of costs and benefits, both in the public and private sector. Within the SP approach, survey based method like discrete choice experiment (DCE) and contingent valuation (CV) allow to uncover willingness to pay and compute non-use values. Under CV respondents are questioned directly about WTP for a given good or change; under DCE they choose among selected alternative configurations of the given good (scenarios) and WTP is indirectly inferred.
DCE studies relevant to our exercise are Mazzanti (2003), on visitors' preferences toward cultural goods and services at Borghese Gallery in Rome (Italy); Choi et al. (2010), on the economic value of the Old Parliament House in Australia; Jaffry and Apostolakis (2011), on individual preferences over different managerial initiatives at the British Museum; Lourenço-Gomes et al. (2013), on individuals' heterogeneity and the relative importance of the Alto Douro Wine Region landscapes, a UNESCO world cultural heritage site in Northern Portugal. Also, Miller et al. (2015), exploring via DCE the role of cultural attributes in freshwater valuation in New Zealand, found that welfare estimates may be biased if cultural values are ignored. Finally, it is worth stressing the limited scope for value transfer applications in heritage-related exercises due to the heterogeneity and complexity of heritage assets and the still scanty heritage valuation literature (Provins et al. 2008).
According to the DCE format, respondents have to select their preferred scenario, i.e. the one that produces the greatest utility allowing trade-offs between attributes. One can determine which attributes significantly influence the choices and hence the marginal contribution that each single characteristic adds to individual’s utility simply repeating choices and varying attribute levels (Morrison and Bennet, 2000). To combine attributes and levels, two main approaches exist: a full factorial design, where all possible combinations are encompassed, and a fractional factorial design, where a sample of all combinations yields estimates of the main effects of interest (Hoyos, 2010). The full design may lead to biased estimates since individuals could have some problems in managing simultaneously multiple choices. Namely, when the number of choices increases, the probability to obtain reliable preferences decreases due to a sense of confusion and overwhelm among respondents. To overcome such limits, the “orthogonal main effect design”, a fractional factorial proposed by Louviere et al. 2000, is used.
An important advantage of DCE models stems from its capability to reduce strategic biases due to false respondents answers in the attempt to influence the provision of

4
public goods or policy (Blamey et al. 1999) and to agree with interviewer's requests (Shulruf et al. 2011).
3. The DCE empirical application
The DCE questionnaire presented in this study has been administered at a temporary exhibition entitled “I follow the thin black line: drawings by Costantino Nivola”, held in Sassari (Sardinia, Italy) from June to September 2011 (for interpretative texts and pictures of every item on display see the exhibition catalogue by Altea and Camarda, 2011).
Costantino Nivola was an important figure in the context of the mid-century international debate on the relationship between art and architecture, the so-called “synthesis of the arts”, and at the same time was an artist deeply attached to his native Sardinian culture, which influenced most of his aesthetic course. Interest on his work dwindled by the mid-1960 with the rise of post-media art, to revive recently in connection with the renewed scholarly attention to the issue of the synthesis of the arts.
Born in 1911 to a very poor family in a village of rural Sardinia, Nivola studied graphics in the High Institute of Decorative Arts (ISIA) in Monza. He was a pupil of Edoardo Persico, Marcello Nizzoli and Giuseppe Pagano, among the key figures of the Milanese architectural modernism (or “Rationalism”, as it was called in Italy). Pagano, the director of the leading journal for modern architecture Casabella, invited him to collaborate in several officially organized propaganda exhibitions, notably the VI Triennale in Milan (1936) and the International Paris Exposition of Decorative and Industrial Arts (1937). In 1936 Nivola was hired by the Olivetti company as art director of its new-born Publicity Office and in this capacity designed some of the firm’s most iconic posters and campaigns. This promising début was interrupted in 1938, when the antifascist Nivola had to move to Paris and then to New York. There he managed to earn a living by working as a graphic designer for Interiors and other magazines. An eye-opening encounter with Le Corbusier, who was to become his mentor and friend (Boesiger, 1953), marked his conversion to modernist painting and sculpture, prompting him to undertake a new path of research, stimulated also by the discovery of the sand-casting technique (cement casting from modelled sand). The greatly successful commission of a sand cast wall relief for the Olivetti showroom in New York, designed by the BBPR studio (1954), launched his career as a sculptor for architecture. This was the first of a long series of projects carried out in collaboration with famous architects such as Marcel Breuer, Josep Lluís Sert and Eero Saarinen. Significant examples of these works can be seen at Science Centre (Harvard University), Morse and Stiles College (Yale University) and various estates and playgrounds in NYC. Nivola worked mainly as a public artist until, in the early 1960s, he started to be influenced by his rediscovery of traditional materials such as terracotta, marble and bronze, which prompted him to realize first the small figurative sculptures of the Beds and Beaches, then a series of solemn, semi-abstract figures alluding to motherhood as a Mediterranean mythic figure and a universal symbol of generative power.
Featuring 150 drawings and illustrations made between 1941 and 1980, the exhibition in Sassari documented the central and most productive phases of the artist's career: from his first period in New York, shortly after his flight from Fascist Italy, divided between commercial graphics and exploratory works (1940-1945), to the biting drawings of political and social criticism he had begun working on since 1968. The show was divided

5
into five thematic sections spatially arranged in such a way to have a uniform impact upon visitors’ paths and behaviour. To classify the pieces on show on the basis of their identity value is quite a difficult task. While identity values operate at the style level through formal references to prehistoric Sardinian and Mediterranean sculpture or to local handicraft, they can be more easily identified at the iconographic level (i.e. subjects dealing with Sardinian life and traditions). So, both the spectrum of subjects and the questions addressed make it possible to try an assessment of the role played by these components for different types of viewers.
The questionnaire consisted of three parts, with a total of 15 questions besides the DCE part. The first was designed to enquire motivations behind the visit to the show as well as to gather opinions about cultural goods and heritage fruition.
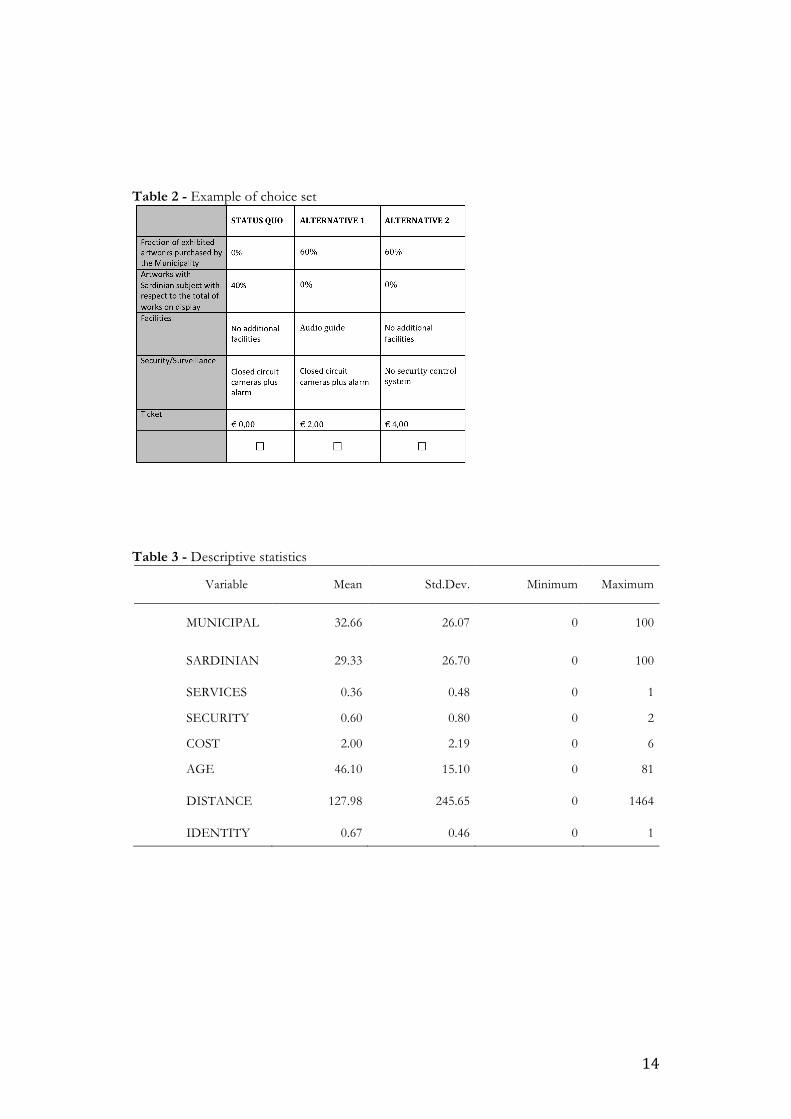
In the second part, devoted to the DCE, five attributes described the main characteristics of the exhibition, namely MUNICIPAL, SARDINIAN, SERVICES, SECURITY and COST, and each attribute was divided in levels (Table 1). Given the attributes and their levels, the complete factorial design implied 128 combinations (24x23x12). In order to reduce the number of choices, an orthogonal fractional factorial design was employed in SPSS that identified ten different choice sets, each consisting of three scenarios. An invariant option (status quo) featured in each choice set and represented the current situation while the alternatives were the hypothetical scenarios. This scheme helped respondents to distinguish the current offer from the alternatives proposed under new policy scenarios. Table 2 shows an example of a choice set used in the analysis. Since each choice set, except for the status quo, is different, in each round respondent dealt with a unique combination of attributes and scenarios.
MUNICIPAL is the fraction of total exhibits that might be bought by the local municipality in order to make the collection permanently available to the public. Since at the time of the exhibition all artworks were on loan from private collections, the status quo level was set at 0%. Other levels (40%, 60% and 100%) speculate about the public investment decision.
The attribute SARDINIAN represents the fraction of total items on display with prominent or exclusive identity traits to be featured in the hypothesized local permanent collection. Such variable should capture respondents’ attachment to identity values. The status quo has been set at 40% while the other levels are 0% and 100%.
SERVICE indicates the availability of special (i.e. not ordinary like the cathalogue or the explanatory panels) devices concerning the exhibition. In the status quo such additional devices are absent while in the alternative option audioguides are provided.
SECURITY identifies the security system of the exhibition area. A closed circuit camera and an intruder alarm represent the status quo. Alternatives are: 1) a security bag checkpoint in addition to the status quo; 2) no security system at all. The attribute intends to estimate respondents’ attitudes to protect the artefacts from theft and vandalism.
COST indicates the cost of the ticket, with the entry free of charge representing the status quo. Three additional levels are also considered: 2, 4 and 6 euros, respectively. This attribute measures respondents’ welfare changes across profiles-alternatives in monetary terms.
The last part of the survey focused on individual characteristics of respondents, namely AGE, DISTANCE and IDENTITY. AGE indicates the age of the respondent.

6
DISTANCE is a continuous variable, expressed in kilometres, that cares for the place of residence of respondents. IDENTITY is a dummy variable that takes value one if the respondent strongly believes that “cultural heritage should include everything that contributes to the identity of a place and of a population” and zero otherwise.
The face-to-face interviews were conducted during the period July-August 2011 by trained interviewers. A total of 150 survey questionnaires, 1.5% of an attendance of 10,000, were successfully collected. Table 3 provides the descriptive statistics of the variables under study. 4. The Econometric baseline theory
The DCE approach comes from the Random Utility Theory (RUT), developed by Thurstone (1927) and McFadden (1974), which models consumer utility according to a set of individual behavioural rules and an indirect utility function with a random component that influence population choice behaviour. RUT describes the indirect utility of an individual i facing a generic choice j as depending on an observed deterministic component ( ) and an
unobserved stochastic component ( ). Therefore, the utility function is written as
(1)
The representative individual i is assumed to choose alternative j from set m if
alternative j yields the highest utility. Formally, individual i will choose alternative j if and only if:
(2)
Assuming that the error term is independent and identically distributed (IID)
with an extreme value (Gumbel) distribution, the probability to choose a particular alternative j is explained by the systematic component . Given the vector of attributes of
alternative j (Xj) and the monetary cost of the attributes (Cj), the indirect utility function has the following form:
(3)
with
(4)
where asc is the alternative specific constant that captures the average impact of all
factors not included in V(.). Since it is impossible to observe Uij, the probability of an individual i to choose
alternative j over m elements is calculated as follows:
Vijεij
Uij =Vij +εij
Uij >Uil ⇒Vj +εij >Vl +εil ∀l ≠ j, l ∈ m
εij
Vj
Uij = ascj +V (Xj,Cj )+εij
Vj (Xj,Cj ) = βxX j' +βcCj
'

7
. (5)
Substituting (4) and (3) in (5), gives
(6) Equation (6) can be estimated using the Conditional Logit (CL) model that shapes
the expected utility according to the characteristics of the alternatives (Xj). The drawback of CL is that it posits homogeneous tastes and preferences and relies on the independence from irrelevant alternatives assumption (IIA): a serious weakness, implied by the independence of the error terms across the different options, for many researchers (Baltagi, 2011; Chang and Lusk, 2011).
The alternative Mixed Logit model (MXL) may reach a better balance. It approximates any random utility model (McFadden and Train, 2000), handles unobserved
heterogeneity and relaxes the IIA assumption. The model assumes that the parameters are normally distributed and the indirect utility function takes the form:
(7)
where . More precisely, indicates the population mean while
is
the random term that follows a normal distribution ( ) and represents
individuals' preferences. Accordingly, the indirect utility function takes the following form:
(8)
where cares for the individual heterogeneity and is the standard deviation of
the marginal distribution of . MXL model assumes that preferences are heterogeneous toward the attributes and homogeneous toward the cost attribute, while the joint error
( ) is correlated across alternatives. Therefore the probability that individual i will
choose alternative j from choice set m is:
Pij =expVj
expVll=1
m
∑
Pij =exp(ascj +βxX j
' +βcCj' )
exp(ascl +βxXl' +βcCl
' )l=1
m
∑
βx
Uij = ascj +βiX'j +βcC
'j +εij
βi = βx +σ i βx σ i
σ i ≈ N(0,∑βx)
Uij = ascj +βxX'j +D
'jσ i +βcC
'j +εij
X 'j D'
j
βi
D'jσ i +εij

8
(9) This approach control for preference heterogeneity assuming that the weighted
coefficients follow a normal distribution. A further brand of heterogeneity can be captured by including interactions terms between the socio-economic characteristics of the respondents and attributes of the good to be valued. All these approaches allow to estimate the marginal rates of substitution (or marginal WTP) for each attribute, taken as welfare measures (Morrison and Bennet, 2004). In other words, each element of the vector can
be interpreted as the marginal utility of a given attribute, while represents the marginal utility of the ticket price. The marginal willingness to pay, or implicit price (IP), associated with an increase in the value of an attribute A identifies the opportunity cost of a unit change in that attribute and is estimated by the formula:
(10)
Equation (10) provides the value in monetary terms of changes in the individual
utility function in response to changes in the attribute levels. 5. Results 5.1 The logit models
The empirical models presented in the previous section have been estimated using Nlogit (Greene, 2002). Since neither the theoretical nor the empirical literature agree on the best approach, we implement four different estimations. The simplest is the basic conditional logit (CL) model. Then, the mixed logit (MXL) is employed to overcome some limitations of CL as previously discussed. These models include only attribute parameters in the deterministic part of the utility function, specified as:
!!" = !!!"#!" + !!!"#$%$&'(!" + !!!"#$%&%"&!" + !!!"#$%&"!!" +
!!!"#$%&'(!" + !!!"#$!" (11)
where ASC is a dummy that equals 1 for the alternatives and 0 for the status quo, and it is included in the model in order to capture some heterogeneity in the output. Mixed models also help us to determine whether the parameters are fixed or random. A random parameter
Pij =exp(ascj +βxX
'j +D
'jσ i +βcC
'j +εij )
exp(ascl +βxX'l +D
'lσ i +βcC
'l +εil )
l=1
m
∑
βx
βC
IPA = −(βA + βAnXn )
n∑
(βC + βCnXn )n∑

9
indicates the existence of heterogeneity in the estimates over the sample population around the mean.
The final two models (MXLII and MXLIII) further explore preference heterogeneity by introducing interaction terms in the regression. The first step of the analysis requires the estimation of a full model involving the complete set of interaction variables. Next, only the variables with parameters displaying a probability value equal/lower than 0.13 are kept. Here the interactions that survived were municipal and distance, identity with services, security and cost, and cost with age. In the final specification they turned out to be significant at least at the 10% level. Therefore, the deterministic part in the utility function is represented by:
!!" = !!!"#!" + !!!"#$%$&'(!" + !!!"#$%&%"&!" + !!!"#$%&"!!" +
!!!"#$%&'(!" + !!!"#$!" + !!!"#$%$&'(!" ∗ !"#$%&'(! + !!!"#$%&"!!" ∗!"#$%!%&! + !!!"#$%&'(!" ∗ !"#$%!%&! + !!"!"!!!" ∗ !"#$%!%&! + !!!!"#$!" ∗!"#!
(12) Additional individual specific characteristics, such as gender, income, education and
civil status, were also considered, but none of them turned out to be statistically significant. Table 4 shows the output of the CL, MXL, MXLII and MXLIII estimations in
columns (1)-(4), respectively. Mainly, the difference between the CL and MXL/MXLII/III models is due to the inclusion of random variables in the latter. The difference between MXLII and MXLIII concerns the distribution of the parameters. The MXLII assumes the normal distribution for all the parameters while the MXLIII maintains that assumption only for the random parameters. The number of Halton random draws employed is 500 in order to secure a stable set of parameter estimates.
The four specifications produce quite similar results. The overall fit of the models, as measured by McFadden’s ρ2 , which is similar to R2 in linear regression analysis, seem rather small, but as pointed out by Louviere et al. (2000), values of ρ2 between 0.2 and 0.4 can suggest a very good fit of the model. In this respect, MXLII and MXLIII seem to perform better than the other specifications. A result consistent with the calculated log-likelihoods (MXLII and MXLIII have the highest values) and confirmed by the likelihood-ratio tests of each of these models against the null hypothesis of MXL as well as by the Akaike information criteria (AIC).
Looking at the lower panel of Table 4, that presents the derived standard deviation of the parameter distributions, we see that in general no standard deviations are statistically significant except for SERVICES, suggesting the presence of heterogeneity around the mean only for this attribute.
Looking more closely at the MXLIII estimates, we note that all the coefficients have the expected a priori signs and are statistically significant. The upper panel of Table 4 presents the estimated parameters of the choice attributes. MUNICIPAL has a positive coefficient (0.013) indicating that visitors would appreciate the acquisition by the local government of Nivola’s artefacts to create a permanent collection. Also positive is the SARDINIAN coefficient (0.011), indicating a marginal interest by respondents for the identity feature of the items on display. Likewise, the coefficients associated with SERVICES (1.144) and

10
SECURITY (0.636) show that ceteris paribus an increase in either the available services for visitors or a higher level of security to protect the artefacts increase utility. On the contrary, the COST coefficient is negative and significant (-0.492), meaning that respondents are less likely to select more expensive alternatives. Likewise, the negative sign of the ASC (-0.937) indicates that, ceteris paribus, respondents prefer the status quo to the alternatives. It is well known that this effect, which is substantial in important real decisions (Samuelson and Zeckhauser, 1988) and is found in many cultural studies (Snowball, 2008), may be the consequence of the so-called status-quo bias, whereby choices are driven by contextual factors related to information provision and respondent cognition rather than economic preferences. It is also well known that removing this potential bias by omitting the alternative specific constant would destroy the starting point from which to calculate changes in welfare.
As it appears in the second panel of Table 4, individual characteristics and beliefs play a role in the model. In this regard, a general-to-specific methodology is run in order to reach a more parsimonious specification based upon information criteria, diagnostic tests and statistically significant coefficients.
The signs of the interacted terms conform to expectations. As the distance of visitors place of residence increases (MUNICIPAL*DISTANCE = 0.0002), respondents prefer the local municipality to buy more artefacts. As respondents’ age increases (COST*AGE = 0.007) so does the ticket one is prepared to pay for the exhibition. Finally, the interaction of experiment attributes with identity, reveals that those who hold strong views on identity are less interested in additional services (SERVICES*IDENTITY = -1.008) and in more security protection (SECURITY*IDENTITY = -0.495) but are willing to contribute more to preserve the overall collection (COST*IDENTITY = 0.007). Thus, the effect of a taste variable like identity is to make people more willing to employ resources in order to support a public permanent collection. Ancillary amenities do not produce such utility improvement.
Overall, people positively value the municipality buying Nivola’s artefacts, especially if they do not live close to the city hosting the exhibition, and they are also willing to contribute for it by paying additional entrance fees to support such a scenario. 5.2 Welfare Measures
Welfare measures are deduced from the estimated parameters in the form of implicit prices (IP) of the non-monetary attributes. The marginal rate of substitution between the change in the exhibition attributes and the marginal utility of income, represented by the coefficient of the payment vehicle, is determined according to Equation 10. Hence, IP represents the monetary value of the welfare change associated with a 1% variation in a given attribute. The implicit prices can also be used to identify which attribute is more important to respondents, an information which can be used by policymakers to allocate resources to the attributes with the highest welfare impact.
The computation has been run employing Wald procedure with the Delta method in Limdep-Nlogit in order to test IP significance levels. Accordingly, nonlinear functions are calculated for each of the exhibition attributes. Table 5 reports estimates and standard errors for IP. For comparison, estimates are calculated based on the four estimated models (CL, MXL, MXLII and MXLIII).

11
Joint tests of nonlinear restrictions (Wald test) are statistically significant at least at the 5% level in each estimated model. Looking at MXLIII column, t-tests show that implicit prices (IP) estimates are statistically significant at 1% level for all the attributes. In other words, the IP related to the attribute MUNICIPAL values about €0.026 representing the monetary value of the welfare change associated with a 1% variation in the number of artefacts bought by the municipality. A one-per-cent increase in the number of Sardinian artefacts and in the level of artefacts protection produces positive welfare variation equal to €0.022 and €1.291, respectively. An increase in the number of available services cause a welfare variation of €2.322. The implicit prices allow us to measure the welfare associated with any combination of attributes. In this way, it is possible to estimate the welfare change of going from the status quo to any virtual or selected scenario. For example, in case the municipality bought 100% of the artefacts, of which 40% are related to Sardinian features, and introducing additional security systems (such as alarm bag checks), the per visitor welfare change (p) will be calculated as follows: p = € 0.026*100 + € 0.022*40 + € 2.322+ € 1.291). Hence, p = € 7.093. Multiplying this latter value for the number of people in the relevant audiences will give an idea of the welfare benefits of the proposed change.
Summing up, the results indicate that there is a substantial WTP for the Nivola collection and its conservation, and that respondents place different values on the changes from the status quo to alternative scenarios. Moreover, their choices are affected by identity values. The latter appear to influence preferences and utility both at a direct as well as at an indirect level. 6. Conclusions
This study has employed the discrete choice experiment methodology to evaluate individual preferences for the preservation and security of a collection of artefacts with significant, but not exclusive, identity features. The approach identifies individuals’ willingness to respond positively or negatively to particular security and conservation policies. Furthermore, the derived empirical estimates allow one to translate individuals’ preferences into monetary values through calculation of the marginal willingness to contribute. The empirical findings indicate that there is a positive willingness to pay to acquire the art collection under study and to provide for its protection and conservation. Identity considerations positively influence this behaviour.
Respondents value positively the municipality buying Nivola’s artefacts, even more so the further away they live from the main city. Visitors who assert that cultural heritage should include everything that contributes to the identity of a place and of a community are willing to contribute to the conservation hypothesis by paying additional entrance fees to support such a scenario. Conversely, the provision of additional services or security systems doesn't impact their utility.
Despite the problems about generalizing the results from this first experiment, our findings do support the idea that identity adds economic value to cultural goods. Moreover, building on this application, further insights can be gained from a follow-up with visitors to the new (in terms of layout, design and atmosphere) Nivola Museum in Orani, the artist's birthplace (http://www.museonivola.it).
12
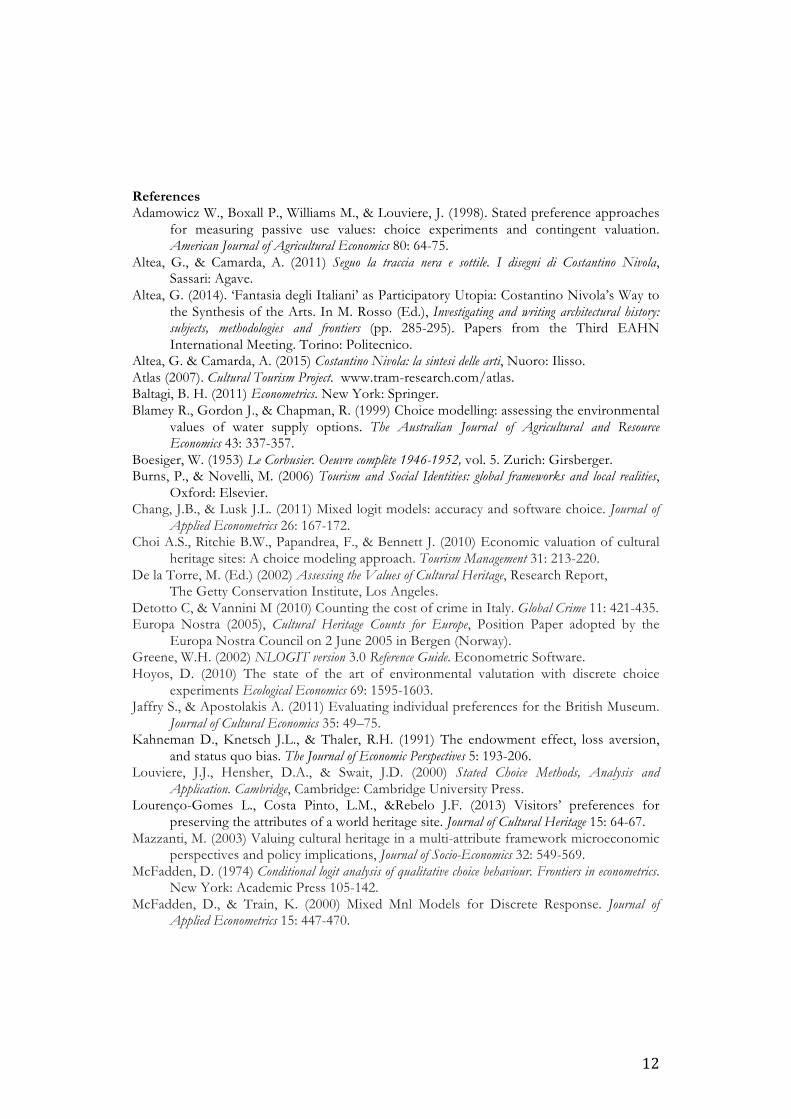
References Adamowicz W., Boxall P., Williams M., & Louviere, J. (1998). Stated preference approaches
for measuring passive use values: choice experiments and contingent valuation. American Journal of Agricultural Economics 80: 64-75.
Altea, G., & Camarda, A. (2011) Seguo la traccia nera e sottile. I disegni di Costantino Nivola, Sassari: Agave.
Altea, G. (2014). ‘Fantasia degli Italiani’ as Participatory Utopia: Costantino Nivola’s Way to the Synthesis of the Arts. In M. Rosso (Ed.), Investigating and writing architectural history: subjects, methodologies and frontiers (pp. 285-295). Papers from the Third EAHN International Meeting. Torino: Politecnico.
Altea, G. & Camarda, A. (2015) Costantino Nivola: la sintesi delle arti, Nuoro: Ilisso. Atlas (2007). Cultural Tourism Project. www.tram-research.com/atlas. Baltagi, B. H. (2011) Econometrics. New York: Springer. Blamey R., Gordon J., & Chapman, R. (1999) Choice modelling: assessing the environmental
values of water supply options. The Australian Journal of Agricultural and Resource Economics 43: 337-357.
Boesiger, W. (1953) Le Corbusier. Oeuvre complète 1946-1952, vol. 5. Zurich: Girsberger. Burns, P., & Novelli, M. (2006) Tourism and Social Identities: global frameworks and local realities,
Oxford: Elsevier. Chang, J.B., & Lusk J.L. (2011) Mixed logit models: accuracy and software choice. Journal of
Applied Econometrics 26: 167-172. Choi A.S., Ritchie B.W., Papandrea, F., & Bennett J. (2010) Economic valuation of cultural
heritage sites: A choice modeling approach. Tourism Management 31: 213-220. De la Torre, M. (Ed.) (2002) Assessing the Values of Cultural Heritage, Research Report, The Getty Conservation Institute, Los Angeles. Detotto C, & Vannini M (2010) Counting the cost of crime in Italy. Global Crime 11: 421-435. Europa Nostra (2005), Cultural Heritage Counts for Europe, Position Paper adopted by the
Europa Nostra Council on 2 June 2005 in Bergen (Norway). Greene, W.H. (2002) NLOGIT version 3.0 Reference Guide. Econometric Software. Hoyos, D. (2010) The state of the art of environmental valutation with discrete choice
experiments Ecological Economics 69: 1595-1603. Jaffry S., & Apostolakis A. (2011) Evaluating individual preferences for the British Museum.
Journal of Cultural Economics 35: 49–75. Kahneman D., Knetsch J.L., & Thaler, R.H. (1991) The endowment effect, loss aversion,
and status quo bias. The Journal of Economic Perspectives 5: 193-206. Louviere, J.J., Hensher, D.A., & Swait, J.D. (2000) Stated Choice Methods, Analysis and
Application. Cambridge, Cambridge: Cambridge University Press. Lourenço-Gomes L., Costa Pinto, L.M., &Rebelo J.F. (2013) Visitors’ preferences for
preserving the attributes of a world heritage site. Journal of Cultural Heritage 15: 64-67. Mazzanti, M. (2003) Valuing cultural heritage in a multi-attribute framework microeconomic
perspectives and policy implications, Journal of Socio-Economics 32: 549-569. McFadden, D. (1974) Conditional logit analysis of qualitative choice behaviour. Frontiers in econometrics.
New York: Academic Press 105-142. McFadden, D., & Train, K. (2000) Mixed Mnl Models for Discrete Response. Journal of
Applied Econometrics 15: 447-470.

13
Miller, S., Tait, S., & Saunders, C. (2015) Estimating indigenous cultural values of freshwater: A choice experiment approach to Māori values in New Zealand, Ecological Economics 118: 2017-214.
Morrison, M., & Bennett, J. (2004) Valuing New South Wales rivers for use in benefit transfer. Australian Journal of Agricultural and Resource Economics 48: 591-611.
Mourato, S., & Mazzanti, M. (2002) Economic Valuation of Cultural Heritage: Evidence and Prospects, pp- 51-72 in M. De la Torre (2002).
OECD (2014) Tourism and the Creative Economy. Paris: OECD OECD (2009) The impact of culture on tourism, Paris: OECD Provin A., Pearce D., Ozdemiroglu E., Mourato S., & Morse-Jones S. (2008) Valuation of
the historic environment: the scope for using economic valuation evidence in the appraisal of heritage-related projects. Progress in Planning 69:131–175.
Samuelson. W., & Zeckhauser, R. (1988) Status Quo Bias in Decision Making, Journal of Risk and Uncertainty 1: 7-59.
Shulruf B., Hattie J., & Dixon, R. (2011) Intertwinement of individualist and collectivist attributes and response sets. Journal of Social, Evolutionary, and Cultural Psychology 5: 51-65.
Snowball J. D., (2008) Measuring the Value of Culture, Berlin: Springer. Thurstone, L. L. (1926) A Law of Comparative Judgment. Psychological Review 34: 273-286. White, L. K., & Frew, E. A. (2011). Tourism and National Identities: An International Perspective,
Oxon: Routledge.
Tables Table 1 - Attributes and levels of the choice set
14
Table 2 - Example of choice set
Table 3 - Descriptive statistics
Variable Mean Std.Dev. Minimum Maximum
MUNICIPAL 32.66 26.07 0 100
SARDINIAN 29.33 26.70 0 100
SERVICES 0.36 0.48 0 1
SECURITY 0.60 0.80 0 2
COST 2.00 2.19 0 6
AGE 46.10 15.10 0 81
DISTANCE 127.98 245.65 0 1464
IDENTITY 0.67 0.46 0 1

15
Table 4 - Conditional Logit (CL) and Mixed Logit (MXL - MXLII - MXLIII) estimates (N = 4500) Parameter estimates CL MXL MXLII MXLIII Variable Coeff. SE Coeff. SE Coeff. SE Coeff. SE MUNICIPAL 0.016*** 0.003 0.014*** 0.003 0.012*** 0.003 0.013*** 0.003 SARDINIAN 0.007*** 0.001 0.010*** 0.002 0.011*** 0.001 0.011*** 0.001 SERVICES 0.399*** 0.094 0.424*** 0.135 1.184*** 0.486 1.144*** 0.297 SECURITY 0.232*** 0.049 0.293*** 0.059 0.644*** 0.096 0.636*** 0.093 COST -0.127*** 0.021 -0.105*** 0.028 -0.520*** 0.094 -0.492*** 0.074 ASC -0.942*** 0.160 -0.888*** 0.234 -0.850*** -0.246 -0.937*** 0.074 Heterogeneity in mean. Parameter*Variable MUNICIPAL*DISTANCE 0.18*10-04*** 0.65*10-05 0.17*10-04*** 0.56*10-05 SERVICES* IDENTITY -1.057*** 0.375 -1.008*** 0.352 SECURITY* IDENTITY -0.508*** 0.110 -0.495*** 0.105 COST* IDENTITY 0.088* 0.050 0.083* 0.047 COST*AGE 0.007*** 0.001 0.007*** 0.001 (MUNICIPAL) 0.008** 0.011 0.010 0.010 (SARDINIAN) 0.000 0.005 0.000 0.009 (SERVICES) 2.158*** 0.699 2.799*** 0.735 2.687*** 0.685 (SECURITY) 0.001 0.157 0.001 0.185 Derived standard deviations of parameter distributions Log-likelihood -1563.05 -1558.04 -1514.70 -1514.90
LR test X2(4)A = 10.02*** X2(5)B = 86.68*** Χ2(5)B = 86.28*** McFadden pseudo ρ2 0.058 0.054 0.081 0.081 Inf.Cr.AIC 3138.1 3136.1 3059.4 3053.8
Significance levels: ***p<0.01. ** p<0.05. *p<0.1; The null model is CL and MXL for A and B, respectively.
Table 5 Implicit prices estimates Attribute Implicit price
CL XL MXLII M
XLIII
MUNICIPAL 0.126*** [0.028] 0.140*** [0.050] 0.023** [0.009] 0.026*** [0.007]
SARDINIAN 0.059*** [0.016] 0.099*** [0.035] 0.022*** [0.004] 0.022*** [0.004]
SERVICES 3.135*** [0.850] 4.027** [1.597] 2.277*** [0.599] 2.322*** [0.606]
SECURITY 1.823*** [0.499] 2.79*** [1.012] 1.238*** [0.256] 1.291*** [0.250]
Wald Statistic 26.61 10.82 33.95 39.32
Prob. From Chi-squared[4] 0.000*** 0.028*** 0.000*** 0.000
Standard error in parentheses. Significance levels: ***p<0.01.** p<0.05. *p<0.1

Ultimi Contributi di Ricerca CRENoS I Paper sono disponibili in: Uhttp://www.crenos.itU
17/01 Adriana Di Liberto, Laura Casula, “Teacher assessments versus standardized tests: is acting “girly” an advantage?”
16/16 Massimo Del Gatto, Carlo S. Mastinu, “Sequentiality and Distance(s) in Cross-Border Mergers and Acquisitions: Evidence from Micro Data”
16/15 Angelo Antoci, Simone Borghesi, Gianluca Iannucci, “Green licenses and environmental corruption: a random matching model”
16/14 Vit t o r i o P e l l i g r a , Tommaso Re g g i an i , Dan i e l J ohn Z izzo , “Respond ing to (un)reasonab le reques ts”
16/13 Pasqua l i na Ar ca G ian f ran c o Atz en i , Lu ca De idda , “Asse t exempt ion in ent repreneurs ’ bankruptcy and the in format ive ro le o f co l l a te ra l”
16/12 Migu e l Ca sa r e s , Lu ca De idda , J o s e E . Ga ldon -San ch ez , “Loan product ion and monetary po l i cy”
16/11 Manue la Pu l i na , Va l en t i na San t on i , “An ana lys i s on the I ta l i an agr icu l tura l f i rms : e f fec ts o f pub l ic subs id ies”
16/10 Tiz iana Medda , Vi t t o r i o P e l l i g r a , Tommaso Re g g i an i , “Does Exper ience Affec t Fa i rness , Rec iproc i ty and Coopera t ion in Lab Exper iments?”
16/09 Bian ca B ia g i , Mar ia G io vanna Brandano , Manue l a Pu l i na , “The e f fec t o f tour i sm taxa t ion : a syn thet ic contro l approach”
16/08 Edoardo O t ran t o , Mass imo Muc c i a rd i� , “A F lex ib le Spec i f i ca t ion of Space–Time AutoRegress ive Mode ls”
16/07 Leona rdo B e c ch e t t i , V i t t o r i o P e l l i g r a , F ran c e s c o Sa lu s t r i , “Tes t ing for Heterogene i ty o f Preferences in Randomized Exper iments : A Sa t i s fac t ion-Based Approach Appl ied to Mul t ip layer Pr i soners ’ D i l emmas”
16/06 Anna Bo t t a s s o , Maur iz i o Con t i , G io vann i Su l i s , “F i rm Dynamics and Employment Protec t ion : Ev idence f rom Sectora l Data ”
16/05 Ol i v i e r o A . Carbon i , G iu s epp e Medda , “R&D, Expor t , and Inves tment Dec is ion”
16/04 Leona rdo B e c ch e t t i , Ge rmana Cor rado , V i t t o r i o P e l l i g r a , F iamme t t a Ro s s e t t i , “Happiness and Preferences in a Lega l i t y Soc ia l D i lemma Compar ing the Direc t and Ind i rec t Approach”
16/03 Leona rdo B e c ch e t t i , V i t t o r i o P e l l i g r a , F ran c e s c o Sa lu s t r i , Ale jand ra Vásqu ez “Gender d i f fe rences in Soc ia l l y Respons ib le Consumpt ion . An Exper imenta l Inves t iga t ion”
16/02 Leona rdo B e c ch e t t i , V i t t o r i o P e l l i g r a , A l e j and ra Vásqu ez , “Are Women Natura l i t e r More Coopera t ive?� An Exper imenta l Inves t iga t ion of the Vote -w i th - the-Wal le t Game”
16/01 Leona rdo B e c ch e t t i , V i t t o r i o P e l l i g r a , F iamme t t a Ro s s e t t i , “The Corpora te Lega l i t y Game� A Lab Exper iment on The Impact o f Po l ic ies , Frames and Informat ion”
15/22 Fab i o Ce r ina , Lu i sanna Co c c o , Ka t iu s c i a Mannaro , Mi ch e l e Mar ch e s i , F ran c e s c o P i g l i a ru , “Insu la r i ty and the deve lopment of a loca l ne twork : a s imula t ion mode l app l ied to the I ta l i an ra i lway sys tem”
15/21 Fab i o Ce r ina , “Is insu la r i ty a loca t iona l d i sadvantage? Ins ights f rom the New Economic Geography”
15/20 Gio r g i o Garau , G io vann i Mandra s , “Economy-wide rebound ef fec ts f rom an increase in e f f i c iency in the use of energy : the I ta l i an case”

Finito di stampare nel mese di Giugno 2017 Presso Centro Stampa dell’Università degli Studi di Cagliari Via Università 40
09125 Cagliari

www.crenos.it