Cultural Dimension as an Explanatory Variable in Use and … · · 2015-08-18Cultural Dimension...
36
Cultural Dimension as an Explanatory Variable in Use and Compliance with Internal Auditing Standards in Nineteen Countries By Mohammad J. Abdolmohammadi Bentley University Waltham, MA, 02154-4705 Phone: (781) 891-2976 Fax: (781) 891-2896 E-mail: [email protected] Gerrit Sarens Université Catholique de Louvain Louvain School of Management Place des Doyens, 1 1348 Louvain-la-Neuve (Belgium) Phone : +32 10 47 84 41 Fax : +32 10 47 83 24 E-mail : [email protected] January 2009 We thank the Institute of Internal Auditors for the grant to develop and the permission to use its Common Body of Knowledge in Internal Auditing (CBOK 2006) data base for this study. The paper has benefitted from comments by Sri Ramamoorti (Grant Thornton). Mohammad J. Abdolmohammadi is the John Rhodes Professor of Accounting at Bentley University in Waltham, Massachusetts. His work on external and internal auditing has appeared in many journals, including The Accounting Review, Auditing; a Journal of Practice and Theory, Internal Auditing, International Journal of Auditing, and Managerial Auditing Journal. His research interests include behavioral auditing, acquisition of expertise and ethics. Gerrit Sarens is an assistant professor at the Université Catholique de Louvain and the University of Antwerp (Belgium). He has published articles in journals such as Accounting, Auditing and Accountability Journal; International Journal of Auditing and Managerial Auditing Journal. His research interests include internal auditing, audit committees and auditing education.
Transcript of Cultural Dimension as an Explanatory Variable in Use and … · · 2015-08-18Cultural Dimension...
Cultural Dimension as an Explanatory Variable in Use and Compliance with
Internal Auditing Standards in Nineteen Countries
By
Mohammad J. Abdolmohammadi
Bentley University
Waltham, MA, 02154-4705
Phone: (781) 891-2976
Fax: (781) 891-2896
E-mail: [email protected]
Gerrit Sarens
Université Catholique de Louvain
Louvain School of Management
Place des Doyens, 1
1348 Louvain-la-Neuve (Belgium)
Phone : +32 10 47 84 41
Fax : +32 10 47 83 24
E-mail : [email protected]
January 2009
We thank the Institute of Internal Auditors for the grant to develop and the permission to use its
Common Body of Knowledge in Internal Auditing (CBOK 2006) data base for this study. The
paper has benefitted from comments by Sri Ramamoorti (Grant Thornton).
Mohammad J. Abdolmohammadi is the John Rhodes Professor of Accounting at Bentley
University in Waltham, Massachusetts. His work on external and internal auditing has appeared
in many journals, including The Accounting Review, Auditing; a Journal of Practice and Theory,
Internal Auditing, International Journal of Auditing, and Managerial Auditing Journal. His
research interests include behavioral auditing, acquisition of expertise and ethics.
Gerrit Sarens is an assistant professor at the Université Catholique de Louvain and the University
of Antwerp (Belgium). He has published articles in journals such as Accounting, Auditing and
Accountability Journal; International Journal of Auditing and Managerial Auditing Journal. His
research interests include internal auditing, audit committees and auditing education.
1
Cultural Dimension as an Explanatory Variable in Use and Compliance with
Internal Auditing Standards in Nineteen Countries
Abstract
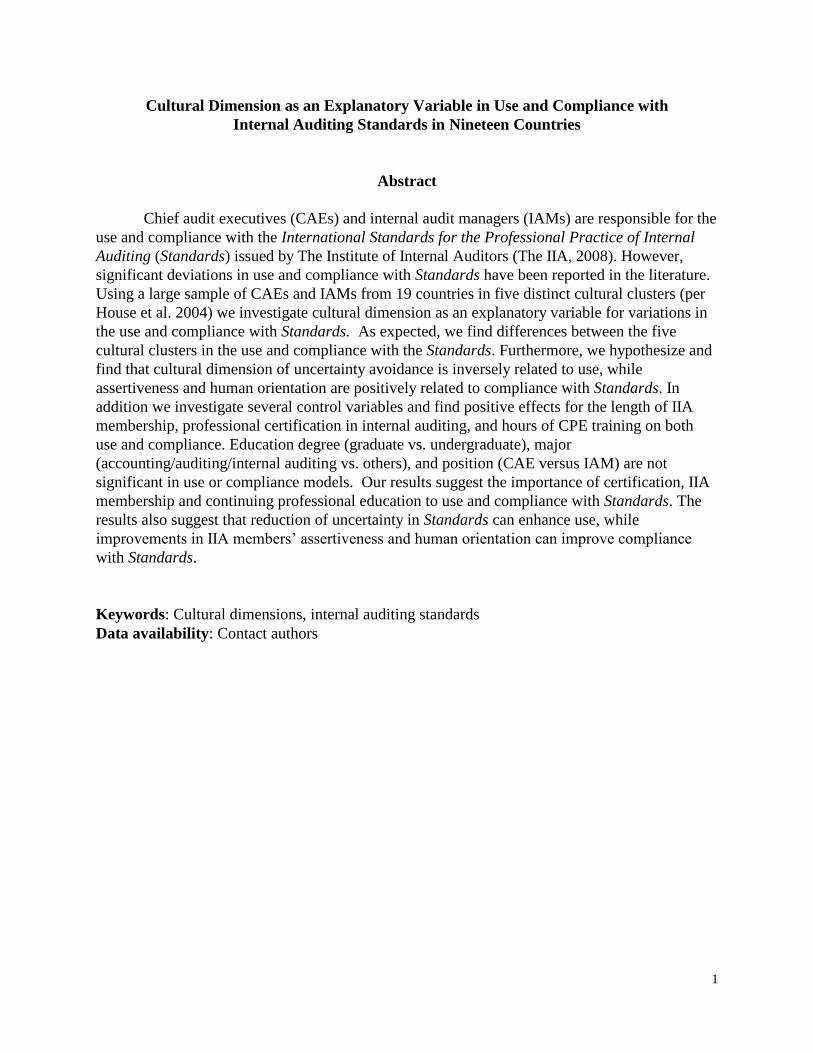
Chief audit executives (CAEs) and internal audit managers (IAMs) are responsible for the
use and compliance with the International Standards for the Professional Practice of Internal
Auditing (Standards) issued by The Institute of Internal Auditors (The IIA, 2008). However,
significant deviations in use and compliance with Standards have been reported in the literature.
Using a large sample of CAEs and IAMs from 19 countries in five distinct cultural clusters (per
House et al. 2004) we investigate cultural dimension as an explanatory variable for variations in
the use and compliance with Standards. As expected, we find differences between the five
cultural clusters in the use and compliance with the Standards. Furthermore, we hypothesize and
find that cultural dimension of uncertainty avoidance is inversely related to use, while
assertiveness and human orientation are positively related to compliance with Standards. In
addition we investigate several control variables and find positive effects for the length of IIA
membership, professional certification in internal auditing, and hours of CPE training on both
use and compliance. Education degree (graduate vs. undergraduate), major
(accounting/auditing/internal auditing vs. others), and position (CAE versus IAM) are not
significant in use or compliance models. Our results suggest the importance of certification, IIA
membership and continuing professional education to use and compliance with Standards. The
results also suggest that reduction of uncertainty in Standards can enhance use, while
improvements in IIA members’ assertiveness and human orientation can improve compliance
with Standards.
Keywords: Cultural dimensions, internal auditing standards
Data availability: Contact authors
2
Cultural Dimension as an Explanatory Variable in Use and Compliance with
Internal Auditing Standards in Nineteen Countries
Introduction
At the core of the practice of internal auditing is the use of, and compliance with The
International Standards for the Professional Practice of Internal Auditing (Standards) issued by
The Institute of Internal Auditors (The IIA 2008). According to The IIA’s Code of Ethics, these
Standards are authoritative and must be used and complied with by all members who perform
internal audits world-wide. Therefore, The IIA’s (2008) quality assessment review guidance
strongly focuses on compliance with Standards as a part of the effectiveness of the internal audit
activities (IAA). However, IAAs are performed in diverse legal and cultural environments, where
internal auditors are influenced by their respective cultures. Hofstede (2001) posits that the more
judgment an activity requires, (e.g., judgment to use and comply with Standards), the more it is
influenced by values and cultural dimensions. The recent Common Body of Knowledge study by
the IIA (CBOK 2006) was conducted in part to investigate differences in internal auditing
practice and compliance with Standards around the globe. This data base, complemented by
cultural dimension data from House et al. (2004), provides a unique opportunity to investigate
the effects of cultural dimensions on the degree of use and compliance with Standards.
Prior research has documented evidence of significant deviations in use and compliance
with Standards in Anglo-Saxon countries (Abdolmohammadi 2009) and some other countries
(Burnaby et al. 2008). However, these studies did not investigate cultural dimensions as
explanatory variables for the differences. We use data collected from a large sample of Chief
Audit Executives (CAE) and Internal Audit Managers (IAM) (n = 2,782) from 19 countries in
various continents to investigate the effects of cultural dimensions on the use and compliance
3
with Standards. We use five clear cultural clusters (Anglo-Saxon, East-European, Germanic-
Europe, Latin-American, and Latin-European) from House et al. (2004) to classify the 19
countries in our sample. We also use descriptive cultural dimension data from House et al.
(2004) as independent variables to investigate their relation with use and compliance with
Standards.
Our study complements existing research on internal auditing that has mainly described
the role of the IAA in corporate governance (see Allegrini, et al. 2006; Cooper, et al. 2006; Hass,
et al. 2006 for reviews). Use of Standards is an important and objectively measurable factor that
determines the quality of the work performed by the IAA. The level of use as a proxy for IAA
quality is useful for internal stakeholders (e.g., management) and external stakeholders (e.g.,
external auditors) in their judgment on whether or not they can rely on the work of internal
auditors (cf. International Standards on Audits 610). Thus, it is important to investigate the
reasons why CAEs and IAMs deviate from the use of Standards. This knowledge can help The
IIA in its efforts to improve its Standards for global use.
A related issue of investigation is whether CAEs and IAMs who use the Standards also
fully comply with them. Use and compliance are two different issues, but very little research is
available in the accounting and auditing literature to address these issues. In accounting, using a
sample of non-U.S. firms that adopted U.S. Generally Accepted Accounting Principles (GAAP),
Bradshaw and Miller (2008) find that most firms that adopt U.S. GAAP adjust their accounting
methods to those required by U.S. GAAP but they do not fully converge. In the context of this
study, use of Standards refers to the intention of CAEs and IAMs to apply Standards, whereas
compliance refers to real application of Standards.
4
Our investigation of the large sample of CAEs and IAMs indicates significant differences
between the five cultural clusters in the use and compliance with Standards. We then use
summary data from House et al. (2004) to investigate the effects of various cultural dimensions
on the use and compliance with Standards. We also include a number of control variables such
as length of IIA membership, internal auditing certification, and continuing professional
education. We find that the cultural dimension of uncertainty avoidance is inversely related to
use, while assertiveness and human orientation are positively related to compliance with
Standards. In addition, we find positive effects for the length of IIA membership, internal
auditing certification, and hours of CPE training on both use and compliance. Education degree
(graduate vs. undergraduate), major (accounting/auditing/internal auditing vs. others), and
position (CAE versus IAM) are not significant in use or compliance models.
The remainder of the paper is organized as follows. A review of the literature is provided
in the next section as a means of setting up the study’s research hypotheses. The research method
and results are presented in the next two sections, followed by the final section on a summary and
implications from the study.
Literature Review and Hypotheses
The IIA (2008) uses “careful study, consultation, and deliberation about the basic
principles for providing internal audit services” to develop its Standards. These Standards (1)
delineate basic principles that represent the practice of internal auditing as it should be; (2)
provide a framework for performing and promoting a broad range of value-added IAA; (3)
establish the basis for the evaluation of internal audit performance, and (4) foster improved
organizational processes and operations (The IIA 2008). According to The IIA’s Code of Ethics,
5
these Standards are authoritative and must be used and complied with by all members who
perform internal audits.
The theory of cultural differences advanced by Hofstede (1980) and refined by House et
al. (2004) posits that cultural differences have significant effects on the development and
operations of various professional practices, including internal auditing. Thus, while use and
compliance with Standards are essential to the practice of internal auditing (The IIA, 2008),
cultural differences may significantly influence the degree of use and compliance with Standards.
An issue of research is to investigate the effects of cultural variables that may explain variations
between various cultural clusters with respect to use and compliance with Standards. Thus, we
first review the literature on cultural clusters, and identify various variables (cultural dimensions)
that explain differences in use and compliance. We also present a number of control variables
that may affect the degree of use and compliance with the Standards. We discuss these variables
below as a means of establishing our research hypotheses.
Cultural Differences
Hofstede (1980) advanced the theory of cultural differences that he later used to classify
50 countries into various cultural clusters (Hofstede 1983). He used four cultural dimensions as
criteria for this classification. The dimensions used were the degree of uncertainty avoidance, the
level of power distance, the degree of individualism versus collectivism, and the level of
masculinity / femininity. House et al. (2004) extended Hofstede’s dimensions to nine dimensions
and collected data from 62 societies on these dimensions to classify the societies into various
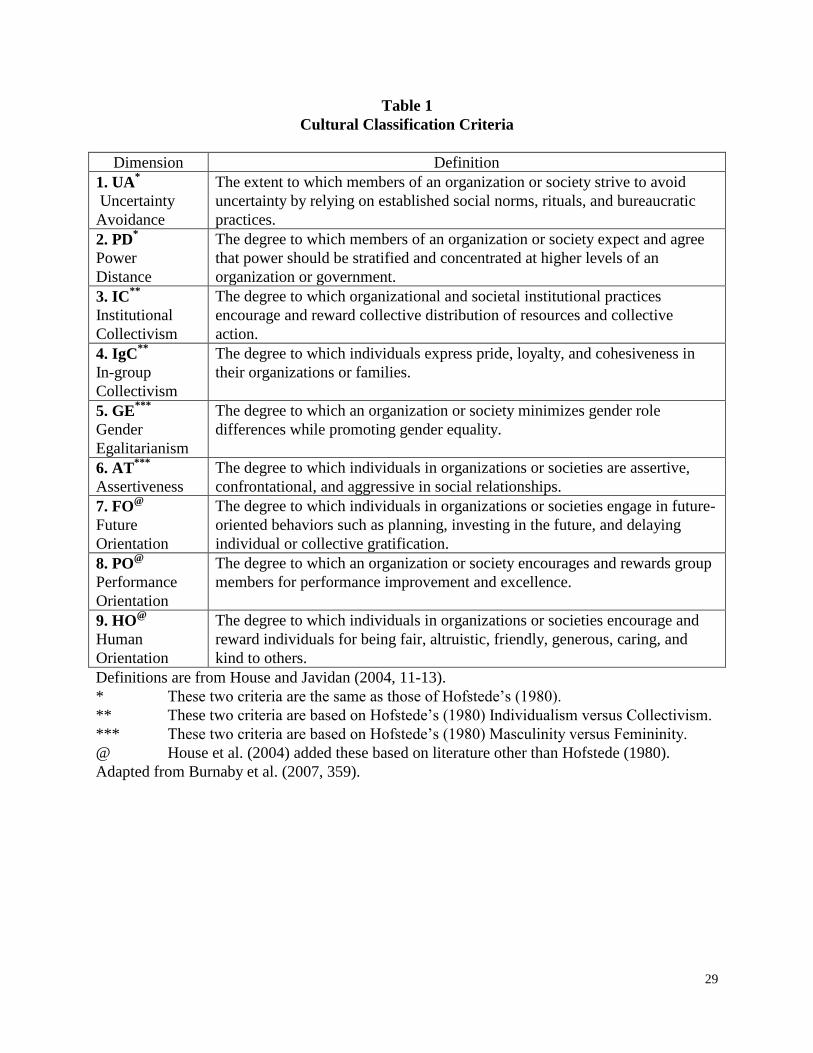
cultural clusters. Hofstede’s (1983) and House et al.’s (2004) dimensions and their definitions are
presented in Table 1. This table is adapted from Burnaby et al. (2007, 359). As detailed in the
Method section, we consulted House et al.’s (2004) study to determine the cultural clusters of the
6
19 countries in our sample. For each of these countries we codified the summary statistics
provided by House et al. (2004) on the nine dimensions in Table 1. While we have theoretical
arguments to establish hypotheses for some dimensions, we do not have strong arguments for
setting hypotheses for other dimensions. We investigate the hypothesized effects on the use and
compliance with Standards. Specifically, we first develop a broad hypothesis on the effects of
cultural clusters on the use (H1a) and compliance (H1b) with Standards. We then present
summary discussions of the nine dimensions as a means of identifying three dimension-specific
hypotheses.
[Insert Table 1 Here]
An implication of the cultural classification is that culture has a significant effect on the
way that professions develop and practice in various countries. While Standards are developed to
unify practice of internal auditing world-wide, the cultural differences theory implies that use and
compliance with Standards may differ between cultural clusters. We are not aware of this issue
having been investigated in the internal auditing context, but a handful of studies in the
accounting and independent auditing context provide support for this expectation. Gray (1988)
proposed a framework with four hypotheses on the relationship between the four cultural
dimensions developed by Hofstede (1980) and the development of accounting systems, the
regulation of accounting and attitudes towards financial management and disclosure. Gray’s
(1988) work has become widely used by other authors who have tested these hypotheses. For
example, Doupnik and Salter (1995) tested the effects of culture on the development of
international accounting and found culture to have an effect. Based on data from twenty-nine
countries, Salter and Niswander (1995) found that Gray’s (1988) framework is best at explaining
actual financial reporting practices and is relatively weak in explaining extant professional and
7
regulatory structures. Cohen et al. (1995) found that culture was related to differences in ethical
decision-making of auditors in Latin America, Japan and the United States. Specifically, Cohen
et al. (1995) found that societies characterized by high power distance and collectivism are more
conducive to high ethical standards.
Abdolmohammadi and Tucker (2002) used empirical data from the United Nations to
show that accounting, auditing and internal auditing development in various countries is
associated with a number of variables, including culture. Chan et al. (2003) found that power
distance and individualism have significant explanatory power in differentiating the tainting and
the materiality of accounting errors detected in different cultural enterprises. Patel (2003) found
that, compared to Indian and Chinese cultures, whistle-blowing as an internal control mechanism
is likely to be more effective in the Australian culture. Similarly, Tsakumis (2007) found that
national culture plays a role on accountants’ disclosure judgments, which could hinder the
usefulness of financial statements prepared under a common set of accounting standards across
countries. Doupnick (2008) demonstrated that there are cross-national differences in earnings
management due to cultural differences, and Tsakumis (2008) found that Greek accountants are
less likely to disclose information than U.S. accountants.
In conclusion, significant cultural differences have been found to have significant effects
on the accounting and auditing profession. We extend this line of research by investigating the
effects of various cultural dimensions on the use and compliance with Standards in internal
auditing. The IIA has affiliates in over 100 countries (The IIA, 2008) that are located in various
continents and cultural clusters. While some countries can easily be identified with a certain
culture (e.g., U.K. and U.S. as Anglo-Saxon), other countries have a mix of cultures (e.g., both
Germanic and French cultures in the case of Switzerland). To mitigate this concern, we select
8
countries for investigation that are classified into a specific cultural cluster by House et al. (2004)
to test the following two general hypotheses. Dimension-specific hypotheses follow this general
hypothesis.
H1a: Use of Standards varies by Cultural Clusters.
H1b: Compliance with Standards varies by Cultural Clusters.
Investigation of the effects of the nine cultural dimensions presented in Table 1 provides
more specific explanation for differences in use and compliance with Standards. We briefly
discuss all nine dimensions in Table 1 to identify those dimensions that have theoretical support
for establishing hypotheses on their effects on use and compliance with Standards. As presented
in the results section, there are many significant correlations between various pairs of
dimensions. However, these correlations do not reach the 0.50 level that would cause concern for
multicolinearity for the three dimensions (uncertainty avoidance, assertiveness, and human
orientation) for which we identify directional hypotheses. We organize the discussion in the order
in which the dimensions appear in Table 1.
1. Uncertainty Avoidance (UA). Uncertainty avoidance addresses the extent to which
ambiguous situations are threatening to individuals, to which formalized rules and order are
preferred, and to which uncertainty is tolerated in a society (House et al., 2004). On the one hand
adoption of new standards may introduce significant uncertainty to the point that internal auditors
may shy away from use of Standards. An example could be the recent introduction of Attribute
Standard 1300 on the establishment of a quality assurance and improvement program. On the
other hand, one can argue that by providing formalized rules and procedures to follow, Standards
reduce uncertainty and ambiguity in practice because Standards create predictability, consistency
and uniformity. This argument suggests that once adopted, Standards should be complied with
9
because they reduce uncertainty. Thus, we expect that uncertainty avoidance has a negative
effect on use, being the intention to adopt Standards, but may have a positive effect on
compliance with Standards (referring to real application).
H2a: Use of Standards is inversely related to uncertainty avoidance.
H2a: Compliance with Standards is positively related to uncertainty avoidance
2. Power Distance (PD). This dimension reflects the extent to which a community
accepts and endorses authority, power differences, and status privileges (House at al. 2004).
Thus, power distance is the extent that unequal distribution of power between a superior and a
subordinate is perceived by the subordinate as acceptable (Cohen et al. 1995), However, due to
the role of expertise, skills and knowledge that are transient and sharable (cf. House et al. 2004),
there may not be a clear power distance between CAE/IAMs and their subordinates. Their
relationship may even be based on consultation instead of autocracy (Hofstede 1980). In fact,
Standards encourage open discussion and joint decision making between CAEs/IAMs and their
subordinates. These aspects indicate reduced power distance (Wayne and Green 1993), which
can enhance competence building and learning (House et al. 2004), two important goals of
Standards. Thus, we do not anticipate an effect for power distance on use or compliance with
Standards and do not establish hypotheses here.
3 & 4. Individualism versus Collectivism (IC & IgC). Individualism and collectivism are
the too extreme ends of the state in which one is extremely individualistic as compared to one
behaving in the best interest of the group by being a collectivist. Chatman et al. (1998) define
collectivist cultures as those that emphasize shared objectives, interchangeable interests, and
commonalities among members. Subjects from collectivist cultures exhibit the behavioral
10
characteristics typically associated with collectivism with members of the in-group (IgC). By
contrast, with out-group (IC) members, their behavior may resemble that of subjects from
individualistic cultures (Kagitcibasi and Berry, 1989).
The above distinction is applicable to the context of the current study because within the
internal audit profession (the in-group), collectivism may be the behavior promoted by The IIA
through its slogan “progress through sharing” and in following high ethical standards (cf.,
Cohen et al. 1995). This will, in turn, promote long-term personal commitment and loyalty
between The IIA members, so to satisfy their duties and obligations to the profession (cf.
Triandis 1995), The IIA provides its members with support in areas such as training, personal
development, and career development.
The arguments above indicate that in-group collectivism may be strong among internal
auditors, and this may have a positive effect on use and compliance with Standards. However,
this may not always be the case because turnover in IAAs is generally high, where people use
their knowledge, skills and experience developed in internal auditing practice to move into
higher level jobs. Thus they may exhibit individualism with the rest of the organization (the out-
group) to advance their own career. Chan et al. (2003) argue that members of an individualist
culture act according to their own interest (e.g., moving to a higher level job) and they champion
individual achievements, even if this conflicts with the intentions of their professional
organization (e.g., The IIA). Further support for this argument is the finding by Marshall (1997)
and Triandis (1994) that high socioeconomic classes, such as internal auditors, tend to be more
individualistic. The opposing arguments above provide no clear direction for us to establish
hypotheses here.
11
5. Gender Egalitarianism. The IIA Standards are gender egalitarian in the sense that they
do not discriminate between genders and promote performance by internal auditors regardless of
their gender. While gender role differences are observed in various parts of the world, we do not
have a theory to predict their influence on gender egalitarianism being associated with the use
and compliance with Standards. Thus, we do not present any hypothesis here.
6. Assertiveness (AT). Assertiveness reflects the belief that people are or should be
encouraged to be assertive, aggressive (in the positive sense of the word: being positive or
confident in a persistent way; enterprising or taking initiative), and tough in social relationships
in order to achieve results (House et al. 2004). Assertiveness is accomplished by being explicit
and to the point in communications, by using direct and unambiguous language (so-called low-
context language) (Holtgraves 1997). Non-assertiveness (in terms of being tender and non-
dominant) can be linked to what Goldberg (1990) call agreeableness. Agreeable people are
cooperative (trusting, caring) and likable (good natured, gentle); they are softhearted and tolerant.
Non-assertiveness is related to the use of high-context language, which is less direct, often more
ambiguous, and more subtle (Schneider and Barsoux 1997).
Standards indicate that internal auditors should be generally assertive, even
confrontational at times. This is not only important in order to remain objective vis-à-vis
auditees, but also to collect sufficient, reliable, relevant and useful evidence to support
unambiguous conclusions. Use and compliance with Standards could be a way to convince
senior managers and board members of the value added by internal auditing. To do so, internal
auditors need to be assertive, direct and unambiguous when presenting their findings. These
arguments suggest that assertiveness could be positively related to use and compliance with
Standards. Consequently, we present the following hypotheses.
12
H3a: Use of Standards is positively related to assertiveness.
H3b: Compliance with Standards is positively related to assertiveness.
7. Future Orientation (FO). According to House et al. (2004), future orientation is the
extent to which members of a society or an organization believe that their current actions will
influence their future, focus on investment in their future, believe that they will have a future that
matters, believe in planning for developing their future, and look far into the future for assessing
the effects of their current actions.
By focusing on long-term development and improvement of the IAA (via for e.g., quality
assessment and improvement programs and continuous professional development), Standards
encourage internal auditors to be future-oriented. Tendam (1987) states that future orientation is
also related to flexibility, the ability to adapt to changing environments and to pursue new goals.
This is consistent with Brommer and De La Porte (1992), who argue that future orientation
involves preparing the organization to meet future environmental changes. However, consistent
with the arguments presented under the individualism versus collectivism caption), internal audit
practitioners may take a long-term career view, but not in internal auditing. They may use and
comply with Standards only to gain the knowledge and experience needed to secure better jobs
in the future.
Thus, on the one hand Standards promote long-term orientation via use and compliance
with Standards. On the other hand, internal auditors may have more of a long term orientation
toward non-internal auditing jobs in the future. Because these interests may indicate opposite
directions, we do not establish a formal hypothesis for future orientation.
13
8. PO (Performance Orientation). Performance orientation refers to the extent to which a
community encourages and rewards innovation, high standards, and performance improvement
(House et al. 2004). One of the major goals of Standards is to stimulate continuous improvement
of the performance and the quality of the IAA. Therefore, Standards stimulate training and
development (e.g. via Continuous Professional Education) and view feedback (e.g. via external
quality assessment) as necessary for continuous improvement. These arguments suggest that
performance oriented societies would be associated with higher levels of use and compliance
with Standards than societies characterized as less performance orientated.
However, an opposite argument can also be made that performance oriented societies,
may not need The IIA Standards for their internal audit activities. They may already have high
quality performance orientation regardless of where the guidance comes from (i.e., Standards or
local guidance). This argument suggests that the relationship between performance orientation
and use/compliance with Standards is theoretically unclear. Thus, we do not present a hypothesis
here.
9. HO (Human Orientation). Human orientation is defined by House et al. (2004) as the
degree to which an organization or society encourages and rewards individuals for being fair,
altruistic, friendly, generous, caring and kind to others. As reported by Burnaby et al. (2007),
internal auditors favor increasing importance for interpersonal skills, relationship building, and
being team players. These attributes should allow internal audit practitioners not only to operate
within their own audit team but also to build relationships within their organization. In 2008, a
global task force of The IIA introduced the “Internal Auditor Competency Framework” (The IIA,
2009). This framework uses a scale from 1 to 4 to identify the minimum level of performance for
various attributes (e.g., can communicate clearly with senior executives and board-level
14
individuals) for each professional level of internal auditing (e.g., CAE, IAM, Senior/supervisor).
The first “bucket” of attributes classified as interpersonal skills contains over 120 attributes
covering communication, management, leadership, conflict management, team capabilities,
collaboration, and cooperation skills, Collectively these attributes show The IIA’s focus on
human orientation.1
These attributes are crucial in fulfilling the support role that the IAA provides, and
suggest a positive effect on the use and compliance with Standards. Consequently, we
hypothesize that human orientation will have a significant positive effect on use and compliance
with Standards. Thus,
H4a: Use of Standards is positively related to human orientation.
H4b: Compliance with Standards is positively related to human orientation.
Control Variables
The IIA is a world-wide professional association, whose membership is voluntary, but
when an internal audit practitioner is accepted to be a member, he/she is required to adhere to the
Standards and also stay as an IIA member in good standing. This means that a member should
become professionally certified and keep up-to-date through Continuing Professional Education
(CPE). The IIA prepares and administers the Certified Internal Auditor (CIA) exam at more than
500 locations world-wide. The IIA considers the CIA designation as the only globally accepted
certification for internal auditors (The IIA 2009). Coupled with CPE requirements, the CIA
certification provides an indication of a baseline for qualification to practice internal auditing.
Since Standards are expected to be used and complied with by The IIA members, we expect the
length of membership in The IIA to be a factor related to the use and compliance with Standards.
1 The other buckets of attributes are “Tools and Techniques,” “Internal Audit Standard: Theory and
15
Also, certification as a CIA (or equivalent) requires the internal audit practitioner to be familiar
with Standards and also commit to use them in practice. As such, we expect certification to be
positively associated with use and compliance with Standards. Similarly, CPE is expected to
improve an internal audit practitioner’s knowledge of the Standards, and thus it should stimulate
use and compliance with Standards. Therefore, we expect a positive association between the
number of training hours followed and use and compliance with Standards.
Other variables may have effects on use and compliance with Standards. For example,
internal auditors’ academic degrees (graduate vs. undergraduate), academic major
(accounting/auditing/internal auditing vs. other majors), and years of experience in the profession
may have effects on use and compliance with Standards, and thus should be added as control
variables. However, as reported later, internal auditing experience is highly correlated with length
of membership in The IIA. For this reason, we do not include internal audit experience in the
model. Another control variable may be the position in the IAA (CAE vs. IAM). While CAEs
and IAMs are knowledgeable in the IAA, they may be different in the way they perform their
tasks. Specifically, in large organizations, CAEs may be mostly in the administrative end of the
internal audit activity, while IAMs may take a more operational role. As such, IAMs may actually
know more about whether or not the Standards are being used and complied with than do CAEs.
However, in smaller audit shops, the CAE and IAM positions may be performed by the same
person. In this study, we use this distinction as a control variable to see if there is any difference
between the responses of the two groups.
Methodology,” and “Knowledge Areas.”
16
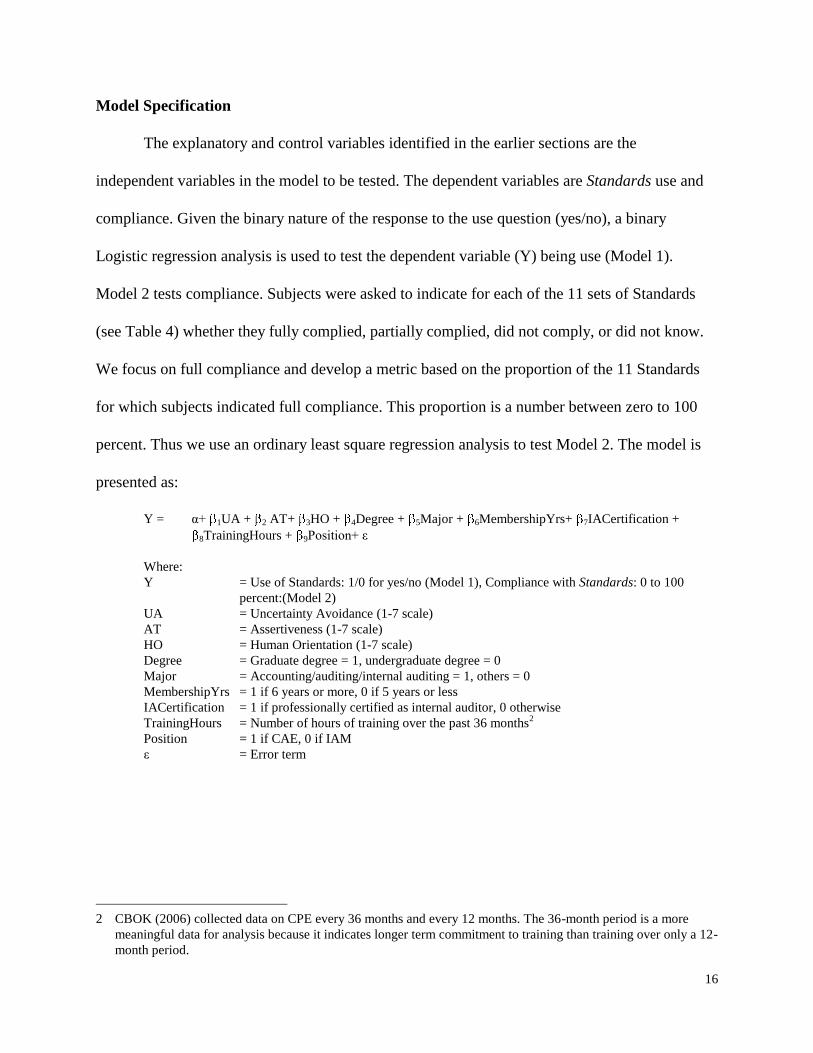
Model Specification
The explanatory and control variables identified in the earlier sections are the
independent variables in the model to be tested. The dependent variables are Standards use and
compliance. Given the binary nature of the response to the use question (yes/no), a binary
Logistic regression analysis is used to test the dependent variable (Y) being use (Model 1).
Model 2 tests compliance. Subjects were asked to indicate for each of the 11 sets of Standards
(see Table 4) whether they fully complied, partially complied, did not comply, or did not know.
We focus on full compliance and develop a metric based on the proportion of the 11 Standards
for which subjects indicated full compliance. This proportion is a number between zero to 100
percent. Thus we use an ordinary least square regression analysis to test Model 2. The model is
presented as:
Y = α+ 1UA + 2 AT+ 3HO + 4Degree + 5Major + 6MembershipYrs+ 7IACertification +
8TrainingHours + 9Position+ ε
Where:
Y = Use of Standards: 1/0 for yes/no (Model 1), Compliance with Standards: 0 to 100
percent:(Model 2)
UA = Uncertainty Avoidance (1-7 scale)
AT = Assertiveness (1-7 scale)
HO = Human Orientation (1-7 scale)
Degree = Graduate degree = 1, undergraduate degree = 0
Major = Accounting/auditing/internal auditing = 1, others = 0
MembershipYrs = 1 if 6 years or more, 0 if 5 years or less
IACertification = 1 if professionally certified as internal auditor, 0 otherwise
TrainingHours = Number of hours of training over the past 36 months2
Position = 1 if CAE, 0 if IAM
ε = Error term
2 CBOK (2006) collected data on CPE every 36 months and every 12 months. The 36-month period is a more
meaningful data for analysis because it indicates longer term commitment to training than training over only a 12-
month period.
17
Research Method
Source of Data
CBOK (2006) is the most comprehensive data base on the current state of the internal
auditing profession world-wide (Burnaby et al. 2007). It has data from over 100 countries. We
used two screening criteria to select countries for our investigation. The first criterion was to
select those countries from which a sufficient sample from CAEs and IAMs was available for
statistical analysis. Specifically, to be included, a country had to be represented with at least
double digit responses from CAEs and IAMs. The second screening criterion was that the
country had to be clearly identified by House et al. (2004) as belonging to a specific cultural
cluster. As mentioned earlier, while CBOK (2006) has data from over 100 countries, House et al.
(2004) has cultural classification for only 62 societies. In some cases, a country is included as
comprising more than one society. For example, Switzerland consists of two societies; Germanic
and French. These societies have significantly different ratings. For example, the Germanic rating
for Assertiveness in Switzerland is 4.51 while it is 3.47 for the French Switzerland. Since CBOK
(2006) does not separate Switzerland by its Germanic or French cultures, we do not include this
country in the sample. Using the criteria just discussed, the final sample for this study consists of
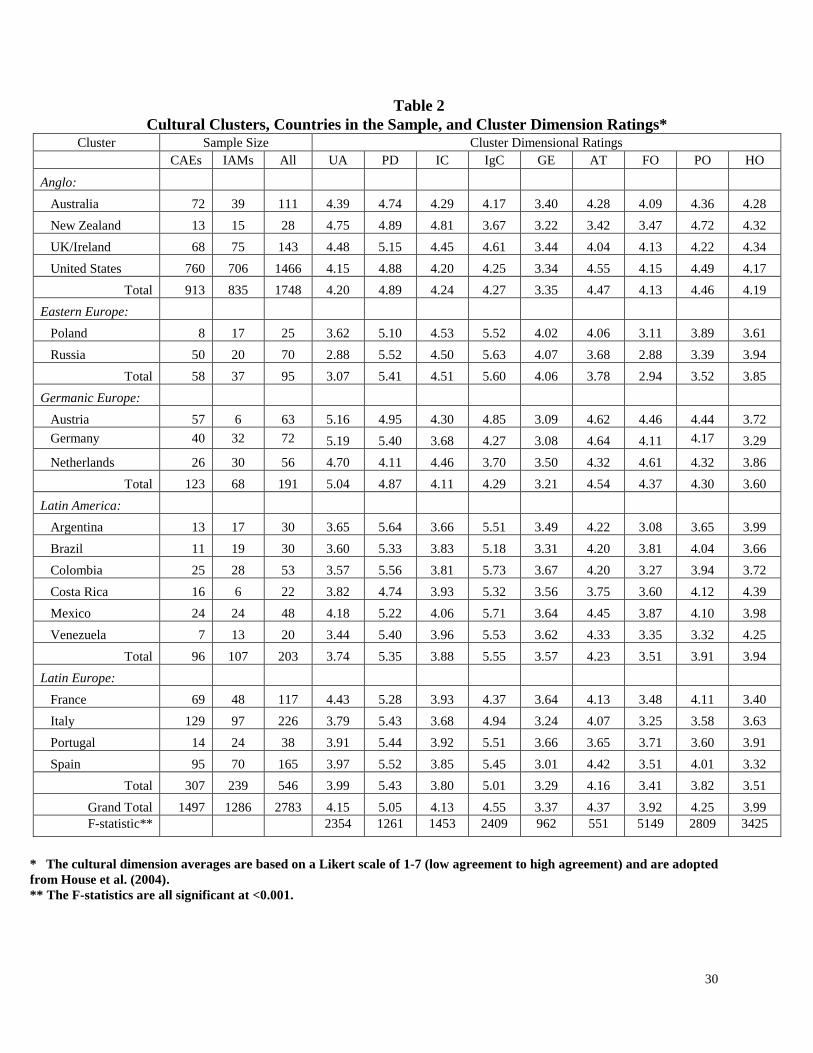
19 countries that are classified into five cultural clusters. Table 2 presents responses from CAEs
and IAMs for each of these countries. As reported in the table, Venezuela with 20 responses has
the smallest sample size and the United States with 1,748 responses has the largest sample.
Overall, our sample consists of 2,783 responses from CAEs (n = 1,497) and IAMs (n = 1,286).
[Insert Table 2 Here]
Table 2 also provides the average ratings for every country for each of the nine cultural
18
dimensions that are described in Table 13. The scale for these averages is 1-7 (strongly disagree
to strongly agree with the dimension). As is evident in Table 2, there is variation by country in
these averages. However, since these ratings are summary statistics we cannot run statistical
analysis to investigate the significance of their differences between countries. These summary
statistics were entered into the data base for each of the sample members in every country to
investigate our stated hypotheses. However, the analysis of variance (ANOVA) is performed to
compare the cultural clusters for each of the cultural dimensions. The results are reported in the
bottom of Table 2. As expected, the results confirm highly significant differences by cultural
clusters at the <0.001 level. With a few exceptions, the vast majority of Bonferoni paired
comparison tests for the cultural dimensions indicate significant differences between all pairs of
clusters. An exception is that for power distance there is no difference between Latin Europe and
Eastern Europe.
Data Analysis
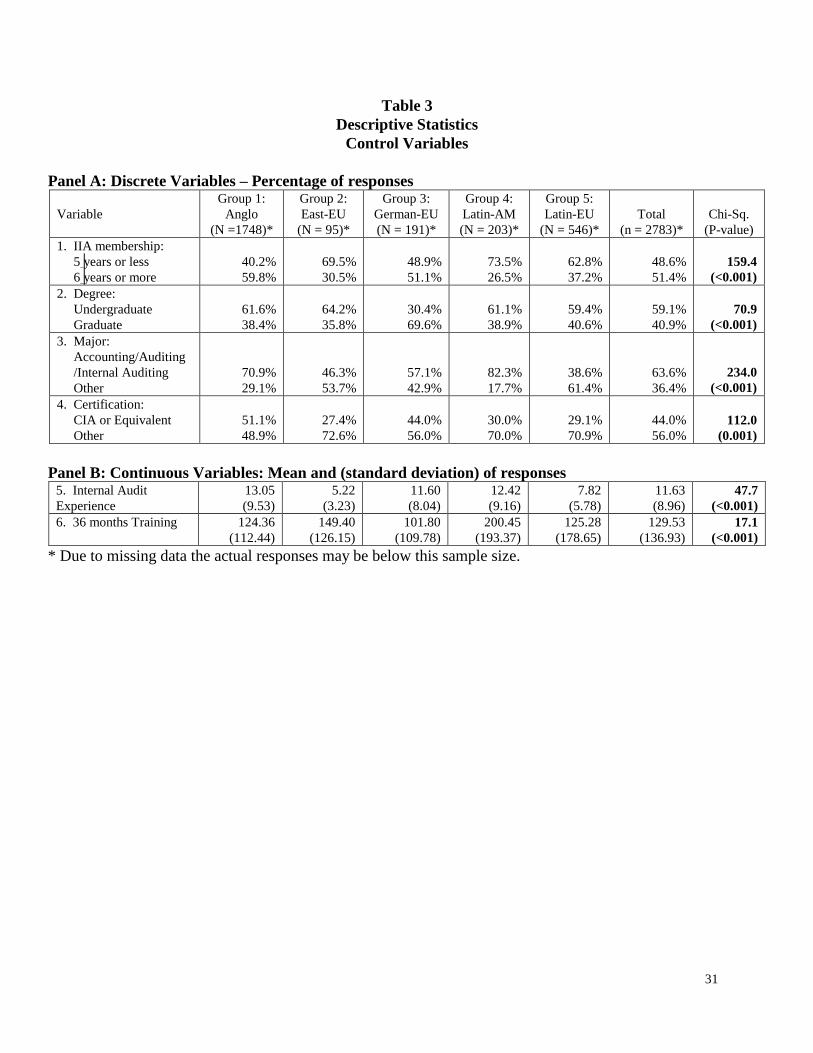
Table 3 presents descriptive statistics on control variables (other than the cultural
dimension variables presented in Table 2). Panel A presents variables with binary responses for
which the results of χ2 tests are reported. Panel B presents variables with continuous response
mode as well as the results of ANOVA tests are reported to test differences by cultural clusters.
The first variable in Table 3 presents the length of IIA membership of CAEs and IAMs.4 Overall,
48.6 percent of all CAEs and IAMs were members of The IIA for five years or less, leaving 51.4
3 House et al. (2004) report separate averages for the UK/Ireland and for the former east/west Germany. However,
CBOK (2006) has data for UK/Ireland as one unit and for Germany as a unit. Consequently, we used the
averages for these units for analysis. While there were some minor variations, the ratings were quite close to each
other. For example, UK and Ireland had exactly the same mean rating (5.15) for power distance. For Germany
the rating for gender egalitarianism was 3.06 for the former East Germany and 3.10 for the former West
Germany.
4 Since data were collected by The IIA from its membership, there is no reason to believe that any of the CAEs in
the sample were not members of The IIA.
19
percent as members for six years or more. However, the χ2 of 159.4 indicates highly significant
differences between the five cultural clusters (P <.001). While the Eastern European (69.5
percent) and Latin American (73.5 percent) countries had the highest percentage of membership
in the category of less than five years, Anglo-Saxon countries had the lowest with 40.2 percent.
[Insert Table 3 Here]
Investigation of academic degrees and majors indicates that while 59.1 percent of the
respondents possess only an undergraduate degree, 40.9 percent have earned graduate degrees.
However, there is significant variation between cultural clusters, where the χ2 of 70.9 is highly
significant (p < 0.001). Table 3 also shows that there is a statistical significance (χ2 = 234.0, p
<0.001) for the academic major, where Group 4 has the highest percentage (82.3 percent) of the
respondents majoring in accounting/auditing/or internal auditing as compared with Group 5 (38.6
percent) and Group 2 (46.3 percent). Finally, the proportion of respondents certified as CIA or
equivalent indicates that, overall only 44.0 percent are certified. Of these, Group 1 has the
highest proportion of CIA (51.1 percent) while groups 2 (27.4 percent) and 5 (29.1 percent) have
the lowest level of certification. The differences are statistically significant (χ2 = 112.0, p <
0.001).
Panel B in Table 3 presents descriptive statistics for years of internal audit experience and
hours of CPE training over a 36-month period. The ANOVA results in Table 3 show highly
significant differences by cultural clusters. Specifically, with an average of 13.05 years, the
Anglo-Saxon group has the highest internal audit experience while the Eastern European group
has the lowest level at 5.22 years of experience. The other three groups are somewhere in
between these two end-points and the differences are highly significant (F-statistic = 47.7, p <
0.001). Hours of training over 36 month period also indicates high variation between the five
20
groups (F-statistic = 17.1, p < 0.001), where the Latin American Group with 200.45 hours has the
highest level of training and the Germanic Europe Group has the lowest at 101.8 hours.
Dependant variables and the effects of cultural clusters (H1a & H1b)
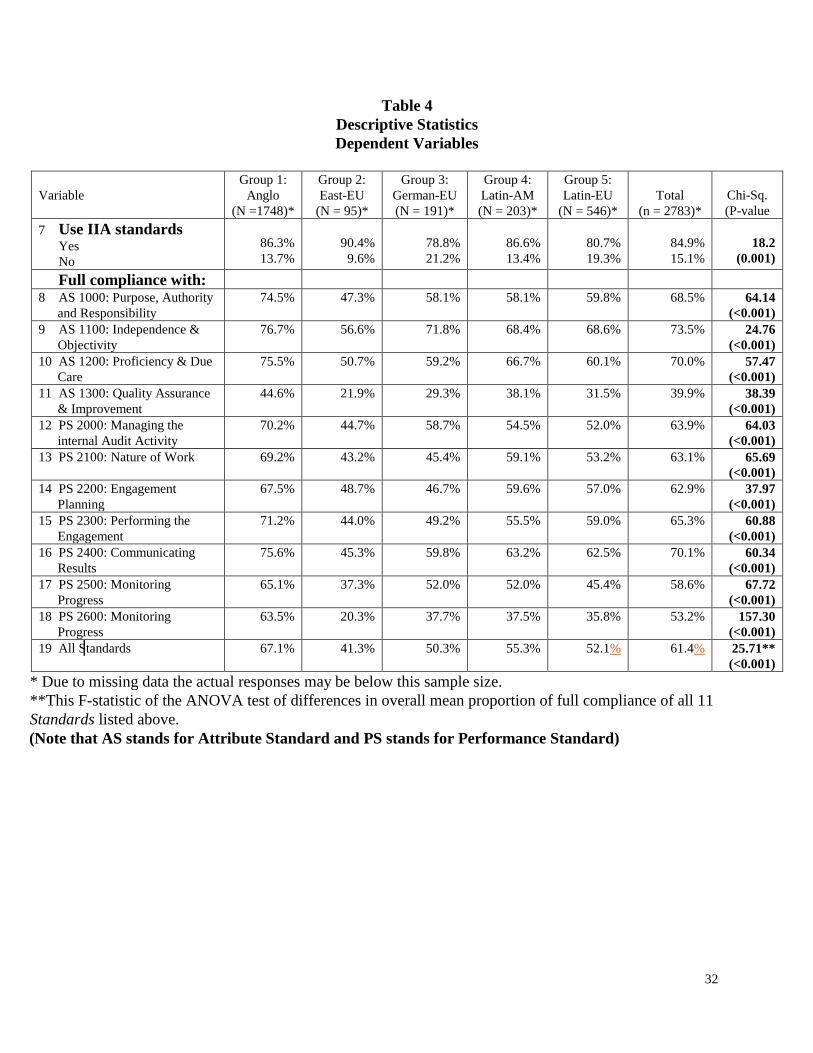
Descriptive statistics on dependent variables (use and compliance) are presented in Table
4. The data reveal that overall while a significant majority (84.9 percent) of CAEs and IAMs
indicates use of Standards, a significant minority (15.1 percent) does not. The χ2 of 18.2 is highly
significant (p=0.001), indicating differences between cultural clusters, where the lowest
compliance is in Germanic Europe (78.8 percent) and Latin Europe (80.7 percent) and the
maximum (90.4 percent) belongs to Eastern Europe, leaving Anglo-Saxon and Latin America in
the middle.
[Insert Table 4 Here]
The CAEs and IAMs who indicated the use of Standards were also asked to indicate the
degree of full compliance with all 11 specific Standards. As summarized in the bottom of Table
4, the overall percentage of full compliance is only 61.4 percent, where the F-statistic of 25.71
indicates high variation between the five cultural clusters (P <0.001). The lowest compliance
belongs to Eastern Europe at 41.3 percent, while the highest compliance of 67.1 percent for the
Anglo-culture group. Analysis by Standard also indicate high variation at <0.001 for each of the
11 Standards by cultural cluster. The lowest compliance statistics belong to AS 1300: Quality
Assurance & Improvement, where overall, only 39.9 percent of all respondents indicate that they
fully comply with this Standard. This standard requires the performance of internal (on regular
basis) and external (every five years) quality assessments of the IAA. The group with the lowest
compliance is Eastern Europe at 21.9 percent, while the highest, 44.6 percent belongs to the
Anglo-Saxon group.
21
In summary, the data in Table 4 provides evidence that a significant proportion of CAEs
and IAMs do not use Standards. The data also indicate that non-compliance with each of the 11
specific standards is even worse. In support of H1a (use) and H1b (compliance), the data in Table
4 shows highly significant differences by cultural cluster overall and for each of the 11 specific
Standards. Consequently, the regression models in the next section are performed first for the use
variable (Model 1) and then also for the compliance variable (Model 2) as related to the overall
compliance with all 11 Standards (i.e., the last line in Table 4).
Multivariate Analysis of the Effects of Cultural Dimensions (H2a – H4b)
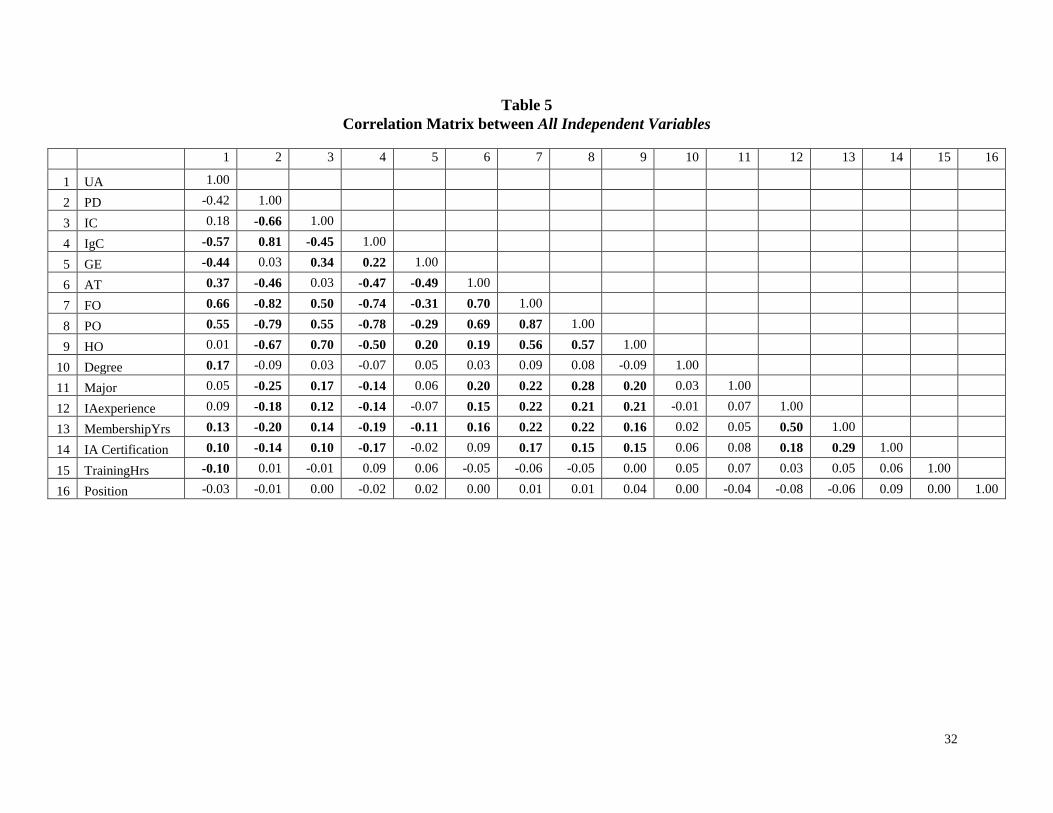
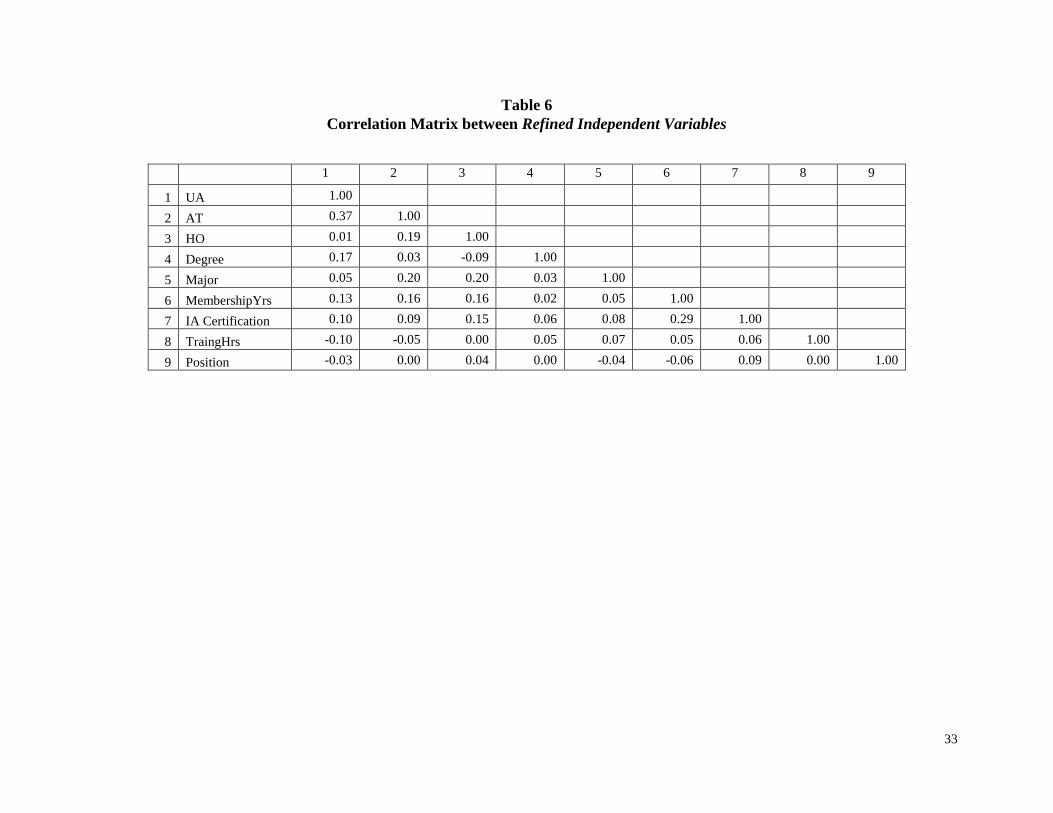
Tables 5 and 6 present correlation matrices between independent variables, where
significant double digit correlation coefficients are highlighted. As shown in Table 5 many of the
correlation coefficients between cultural dimensions reach or surpass the 0.50 level that cause
concern for the possibility of multicolinearity. A careful examination of individual variables in
Table 5 indicates that IC, IgC, FO, PO, PD, GE, and IAexperience are highly correlated with
other variables. For this reason, they are dropped from the regression models. The refined set of
independent variables is presented in Table 6. This table shows that none of the correlation
coefficients reaches the critical level of 0.50 to cause concern for the possibility of
multicolinearity.
[Insert Tables 5 and 6 Here]
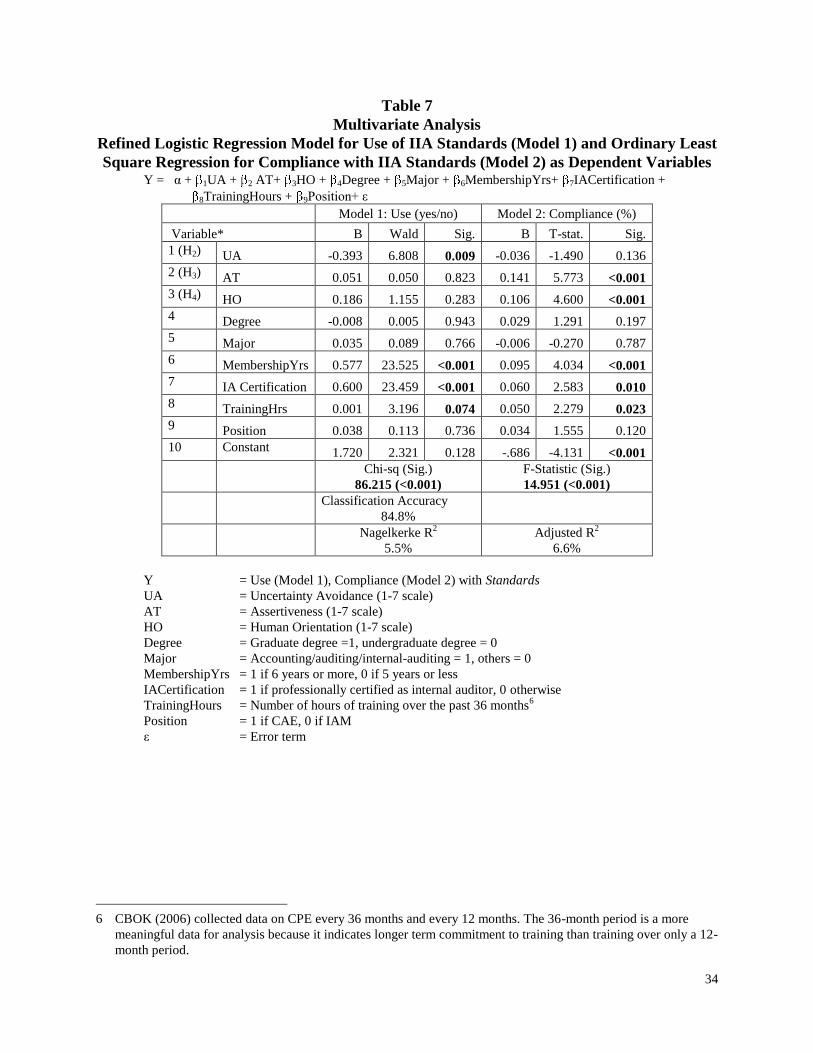
Binary Logistic regression is used to test for the effects of explanatory and control
variables on the binary dependant variable, use of Standards. The three columns under Model 1
in Table 7 present the results. For each variable, its coefficient (B) is provided as well as the
Wald statistic and its significance, where the statistically significant results are highlighted. Also
presented in Table 7 are the study’s research hypotheses around cultural dimensions in Column
22
1. The model χ2 statistics are presented in the bottom of Table 7. These statistics indicate
significance for Model 1 at a very high level (p < 0.001). The model also returns relatively high
classification accuracy rates (84.8 percent). Finally, the model returns a Nagelkerke pseudo R2 of
5.5 percent.
[Insert Table 7 Here]
Model 2 in Table 7 show the results of an ordinary least square regression testing for the
overall proportion of full compliance for all 11 Standards. The standardized B indicates the
coefficient of each of the variables presented along with its T-statistic and it significance level.
The model F-statistic of 14.951 is highly significant at the 0.001 level, and the adjusted R2 of 6.6
percent indicates the proportion of variation in the dependant variable, compliance, that is
explained by this model.
Turning to tests of the specific hypotheses, the data related to Model 1 in Table 7 indicate
an interesting pattern. Specifically, the data provide support for H2a, namely an inverse effect of
uncertainty avoidance on use. However, inconsistent with H2b, the results do not provide support
for an uncertainty avoidance effect on compliance. Specifically, as predicted by H2a higher
uncertainty avoidance is associated with low use of Standards (B = -0.393, Wald = 6.808, p =
0.009) but it is not associated with lower compliance. The opposite is found for both
assertiveness (AT) and human orientation (HO). Neither is significantly associated with use, thus
we do not find support for H3a and H4a. However, these two cultural dimensions are positively
and highly significantly associated with compliance. Specifically, AT with B = 0.141 and T-stat
= 5.773 is highly significantly associated with compliance (p < 0.001). Similarly, HO with B =
0.106 and T-stat = 4.600 is highly significantly associated with compliance (p < 0.001).
23
As to the control variables, degree, major, and position (CAE vs. IAM) are not significant
in both models. However, length of IIA membership, IA certification and CPE training hours are
significant for both models with positive effects on both use and compliance with Standards.
Additional Analysis
As stated earlier, the OLS regression model on compliance (Model 2) was tested on the
average proportion of full compliance based on the data for each of the 11 specific Standards.
Logit regressions were also performed on full compliance with each of the 11 Standards and the
results were similar to those reported in Table 7 with some exceptions that were more in support
of our hypotheses. For example, similar to the results in Table 7, most models show uncertainty
avoidance to be insignificant. An exception is PS 2100: Nature of Work for which uncertainty
avoidance is highly significant at the 0.003 level.
Summary and Implications
Summary
In this study, we first present evidence that use and compliance with internal auditing
Standards are significantly different between various cultural clusters. As hypothesized, we find a
highly significant effect for culture on use of Standards, where lack of use ranges between the
low of 9.6 percent for the East-European cluster to the high of 21.2 percent for the Germanic
Europe cluster. Also, we find full compliance with Standards to be quite low in all countries, but
particularly in Eastern Europe at 41.3 percent. The cultural cluster with the highest full
compliance is the Anglo-Saxon group with 67.1 percent and as hypothesized the differences
between the five cultural clusters are highly significant.
We then test the effects of three cultural dimensions; uncertainty avoidance,
assertiveness, and human orientation on use and compliance with Standards. As hypothesized,
24
we find uncertainty avoidance to be inversely related to use of Standards, but we find no
significance for the effect of this variable on compliance. Conversely, we find significant effects
for assertiveness and human orientation on compliance but not on use of Standards. Regarding
control variables, we find significance for membership in The IIA, internal audit certification and
continuing professional education on both use and compliance with Standards. However, college
degree (graduate/undergraduate), major (accounting/auditing/internal-auditing vs. others) and
position (CAE vs. IAM) are not significantly associated with use or compliance.
Implications
A general implication of the effects of cultural dimensions on use and compliance with
Standards is that there may be a need for a better understanding of cultural dimensions to assess
their effects on standard setting as well as internal audit practices in general. It should be clear
that this opens a whole new area of research opportunity. The IIA clearly argues that
conformance with a unified set of Standards is essential, despite the fact that internal auditing is
conducted in diverse cultural environments. Besides, The IIA clearly recognizes in its recently
renewed International Professional Practices Framework (The IIA 2009c) that Standards are
principles-based. Nevertheless, the results of this study suggest that taking into account the
cultural differences that influence the internal auditing profession remains a challenge for The
IIA. Our results suggest that overcoming these cultural differences may have a positive impact on
use and compliance with Standards. However, while there is recognition that local institutes of
The IIA can play a crucial role in reducing these cultural influences, further research is necessary
to determine the exact nature of local institutes’ effects on this important factor. In other words,
The IIA has to understand where their members come from in order to understand their cultural
background as this study has proven that cultural dimensions have a significant impact on
25
internal auditing practices. It should be clear that the local chapters of The IIA play a crucial role
in this.
More specifically, we found the finding in our paper that use of Standards is inversely
related to uncertainty avoidance which indicates opportunities for future investigation. This
means that especially new Standards, introduce significant ambiguity in terms of interpretation
and application which can be considered as a barrier to the implementation of it. For example,
the low level of compliance (overall, 39.9 percent with a low of 21.9 percent and high of 44.6
percent) with the new AS 1300: Quality Assurance & Improvement suggests that the uncertainty
in this standard may be the culprit in its dismal use and compliance in various countries. It
suggests that introduction of new standards should be accompanied with clear and
straightforward guidance as well as training on how to implement it in practice. Both guidance
and training are crucial to overcome the resistance to implementation, especially in clusters
characterized by high uncertainty avoidance (e.g. Germanic Europe). Thus, research in
developing effective guidance and training programs may be a fruitful avenue for the future.
Secondly, our results confirm that the nature of internal audit practice is generally
assertive, even confrontational at times, thus we find assertiveness to be a cultural dimension
positively related to compliance with Standards. Given that the Standards stress the importance
of objectivity and unambiguous communication with senior management and the board, it is
reasonable to see that internal auditors working in a culture characterized by a high level of
assertiveness will be more keen on complying with the Standards. In particular, Performance
Standard 2600 recommends a persistent attitude for internal auditors when management has
accepted a level of residual risk that may be unacceptable to the organization. Moreover, it
remains a continuous challenge for internal auditors to defend their position in the organization,
26
especially in times when companies cut back on the budget of support functions like internal
auditing. The IIA clearly advices to use compliance with The Standards as the ultimate way to
show the added value of internal auditing to for e.g. senior managers. The results of this study
suggest that this strategy will be more used by internal auditors working in assertive cultures.
Finally, the results in support of the positive effects of human orientation on compliance
with Standards supports the growing importance of interpersonal skills for internal audit practice
as reported by Burnaby et al. (2007). This result supports The IIA’s identification of effective
interpersonal skills in “Internal Auditor Competency Framework”5. Well-developed interpersonal
skills should allow internal auditors not only to operate within their own audit team but also to
build relationships within their organization. These attributes are crucial in fulfilling the support
role they provide and should be traded-off with a sufficient dose of assertiveness.
Of particular importance is the finding that internal audit certification (e.g., CIA) is
positively and significantly associated with the degree of use and compliance with Standards. It
indicates that concentrated effort should be placed to improve the proportion of IIA membership
that is certified as internal auditor. As Table 3 shows, only 44 percent of IIA membership who
are CAEs or IAMs are currently certified as internal auditors (as low as 27.4 percent in Eastern
Europe and as high as 51.1 percent in Anglo-Saxon countries). The CIA exam strongly focuses
on the use and compliance with Standards as a foundation of internal audit practice. Thus,
certification should be given a priority as it could overcome the barrier to implement Standards.
5 The first edition of the Competency Framework for Internal Auditing was published in 1999 by Birkett, W.P.,
Barberra, M.R., Leithhead, B.S., Lower, M. and Roebuck, P.J.
27
References
Abdolmohammadi, M. 2009. Factors associated with the lack of use or compliance with the IIA
Standards: a study of Anglo-culture CAEs. International Journal of Auditing 13 (1):
Forthcoming.
Abdolmohammadi, M. and R. Tucker. 2002. The Influence of Accounting and Auditing on a
Country’s Economic Development. Review of Accounting and Finance 1 (3): 42-53.
Allegrini, M., D’Onza, G., Melville, R., Paape, L. and G. Sarens. 2006. The internal audit
profession in Europe: a literature review. Managerial Auditing Journal 21 (8): 845-853.
Bradshaw, M.T. and G.S. Miller. 2008. Will harmonizing accounting standards really harmonize
accounting? Evidence from Non-U.S. firms adopting U.S. GAAP. Journal of Accounting,
Auditing & Finance 23 (2): 233-263.
Brommer, M. and R. De La Porte. 1992. A context for envisioning the future. National
Productivity Review 11: 549-552.
Burnaby, P.A., Abdolmohammadi M., and Hass, S. 2007. A global summary of the common body
of knowledge 2006 – preview edition (Altamonte Springs, Fl: The Institute of Internal
Auditors Research Foundation).
Burnaby, P.A., Hass, S. and Abdolmohammadi M. 2008. A global summary of the common body
of knowledge: US respondents compared to non-US respondents. Internal Auditing
(forthcoming).
CBOK. 2006. Common Body of Knowledge in Internal Auditing Data Base (Altamonte Springs,
FL: The Institute of Internal Auditors Research Foundation).
Chan, K.H., Lin, K.Z. and P.L. Lan Mo. 2003. An empirical study on the impact of culture on
audit-detected accounting errors. Auditing: A Journal of Practice & Theory 22 (2): 281-
295.
Chatman, J.A., Polzer, J.T., Barsade, S.G. and M.A. Neale. 1998. Being different yet feeling
similar: The influence of demographic composition and organizational culture on work
processes and outcomes. Administrative Science Quarterly 43: 749-780.
Cohen, J.R., Pant, L.W. and D.J. Sharp. 1995. An exploratory examination of international
differences in auditors’ ethical perceptions. Behavioral Research in Accounting 7: 37-64.
Cooper, B.J., Leung, P. and G. Wong. 2006. The Asia Pacific literature review on internal
auditing. Managerial Auditing Journal 21 (8): 822-834.
Gray, S. J., 1988. Towards a Theory of Cultural Influence on the Development of Accounting
Systems Internationally, Abacus 24 (1): 1-15.
Doupnik, T.S. 2008. Influence of culture on earnings management; A note. Abacus 44 (3):
Doupnik, T.S. and S.B. Salter. 1995. External environment, culture, and accounting practice: A
preliminary test of a general model of international accounting development.
International Journal of Accounting 30: 189-207.
Goldberg, L.R. 1990. An alternative “description of personality”: The Big Five factor structure.
Journal of Personality and Social Psychology 59: 1216-1229.
Hass, S., Abdolmohammadi, M.J. and P. Burnaby. 2006. The Americas literature review on
internal auditing. Managerial Auditing Journal 21 (8): 835-844.
Hofstede, G. 1980. Culture’s consequences: International differences in work-related values
(London, UK: Sage).
Hofstede, G. 1983. Dimensions of National Culture in Fifty Countries and Three Regions, in J.B.
28
Deregowski, S. Dziurawiec and R.C. Annis (Eds.), Explications in Cross-Cultural
Psychology (Swets and Zeitling).
Hofstede, G. 2001. Culture’s Consequences: Comparing Values, Behaviors, Institutions, and
Organizations across Nations, (Sage Publications).
Holtgraves, T. 1997. Styles of language use: Individual and cultural variability in conversational
indirectness. Journal of Personality and Social Psychology 73: 624-637. House, R.J. and M. Javidan. 2004. Overview of GLOBE. Ch. 2 in House, R.J.; P.J. Hanges; M.
Javidan; P.W. Dorfman; and V. Gupta (Eds). 2004. Culture, Leadership, and Organizations: The GLOBE Study of 62 Societies (Thousand Oaks, CA: Sage Publications): 9-48.
House, R.J.; P.J. Hanges; M. Javidan; P.W. Dorfman; and V. Gupta (Eds). 2004. Culture, Leadership, and Organizations: The GLOBE Study of 62 Societies (Thousand Oaks, CA: Sage Publications).
Kagitçibasi, C. 1997. Individualism and collectivism. In Berry, J.W., Segall, M.H. and C.
Kagitçibasi, Handbook of cross-cultural psychology. 2nd
Ed. (Boston: Allyn & Bacon):
1-50.
Marshall, R. 1997. Variances in levels of individualism across two cultures and three social
classes. Journal of Cross-Cultural Psychology 28: 490-495.
Patel, C. 2003. Some cross-cultural evidence on whistle-blowing as an internal control
mechanism. Journal of International Accounting Research 2: 69-96.
Salter, S.B. and F. Niswander. 1995. Cultural influence on the development of accounting
systems internationally: a test of Gray’s (1988) theory. Journal of International Business
Studies 26 (2): 379-397.
Schneider, S.C and J.L. Barsoux. 1997. Managing across cultures. London: Prentice Hall
Europe.
Tendam, H.W. 1987. Managerial flexibility: A strategic asset. Leadership & Organization
Development Journal 8 (2): 11-16.
The Institute of Internal Auditors. 2008. The International Standards for the Professional
Practice of Internal Auditing, available at: http://www.theiia.org/guidance/standards-and-
practices/professional-practices-framework/standards/?search=standards
The Institute of Internal Auditors. 2009a. Internal Auditor Competency Framework, available at:
http://www.theiia.org/guidance/additional-resources/competency-framework-for-internal-
auditors/?search=competency%20framework
The Institute of Internal Auditors. 2009b. Certified Internal Auditor, available at:
http://www.theiia.org/certification/certified-internal-auditor/
The Institute of Internal Auditors. 2009c. International Professional Practices Framework,
available at: http://www.theiia.org/guidance/standards-and-guidance/ippf/
The International Auditing and Assurance Standards Board. 2003. International Standards on
Auditing, available at: http://www.ifac.com
Triandis, H.C. 1994. Culture and social behavior. New York: McGraw-Hill.
Triandis, H.C. 1995. Individualism & collectivism. Boulder, CO: Westview.
Tsakumis, G.T. 2007. The influence of culture on accountants’ application of financial reporting
rules. Abacus 43 (1): 27-48.
Wayne, S.J. and S.A. Green. 1993. The effects of leader-member exchange on employee
citizenship and impression management. Human Relations 46 (12): 1431-1441.
29
Table 1
Cultural Classification Criteria
Dimension Definition
1. UA*
Uncertainty
Avoidance
The extent to which members of an organization or society strive to avoid
uncertainty by relying on established social norms, rituals, and bureaucratic
practices.
2. PD*
Power
Distance
The degree to which members of an organization or society expect and agree
that power should be stratified and concentrated at higher levels of an
organization or government.
3. IC**
Institutional
Collectivism
The degree to which organizational and societal institutional practices
encourage and reward collective distribution of resources and collective
action.
4. IgC**
In-group
Collectivism
The degree to which individuals express pride, loyalty, and cohesiveness in
their organizations or families.
5. GE***
Gender
Egalitarianism
The degree to which an organization or society minimizes gender role
differences while promoting gender equality.
6. AT***
Assertiveness
The degree to which individuals in organizations or societies are assertive,
confrontational, and aggressive in social relationships.
7. FO@
Future
Orientation
The degree to which individuals in organizations or societies engage in future-
oriented behaviors such as planning, investing in the future, and delaying
individual or collective gratification.
8. PO@
Performance
Orientation
The degree to which an organization or society encourages and rewards group
members for performance improvement and excellence.
9. HO@
Human
Orientation
The degree to which individuals in organizations or societies encourage and
reward individuals for being fair, altruistic, friendly, generous, caring, and
kind to others.
Definitions are from House and Javidan (2004, 11-13).
* These two criteria are the same as those of Hofstede’s (1980).
** These two criteria are based on Hofstede’s (1980) Individualism versus Collectivism.
*** These two criteria are based on Hofstede’s (1980) Masculinity versus Femininity.
@ House et al. (2004) added these based on literature other than Hofstede (1980).
Adapted from Burnaby et al. (2007, 359).
30
Table 2
Cultural Clusters, Countries in the Sample, and Cluster Dimension Ratings* Cluster Sample Size Cluster Dimensional Ratings
CAEs IAMs All UA PD IC IgC GE AT FO PO HO
Anglo:
Australia 72 39 111 4.39 4.74 4.29 4.17 3.40 4.28 4.09 4.36 4.28
New Zealand 13 15 28 4.75 4.89 4.81 3.67 3.22 3.42 3.47 4.72 4.32
UK/Ireland 68 75 143 4.48 5.15 4.45 4.61 3.44 4.04 4.13 4.22 4.34
United States 760 706 1466 4.15 4.88 4.20 4.25 3.34 4.55 4.15 4.49 4.17
Total 913 835 1748 4.20 4.89 4.24 4.27 3.35 4.47 4.13 4.46 4.19
Eastern Europe:
Poland 8 17 25 3.62 5.10 4.53 5.52 4.02 4.06 3.11 3.89 3.61
Russia 50 20 70 2.88 5.52 4.50 5.63 4.07 3.68 2.88 3.39 3.94
Total 58 37 95 3.07 5.41 4.51 5.60 4.06 3.78 2.94 3.52 3.85
Germanic Europe:
Austria 57 6 63 5.16 4.95 4.30 4.85 3.09 4.62 4.46 4.44 3.72
Germany 40 32 72 5.19 5.40 3.68 4.27 3.08 4.64 4.11 4.17 3.29
Netherlands 26 30 56 4.70 4.11 4.46 3.70 3.50 4.32 4.61 4.32 3.86
Total 123 68 191 5.04 4.87 4.11 4.29 3.21 4.54 4.37 4.30 3.60
Latin America:
Argentina 13 17 30 3.65 5.64 3.66 5.51 3.49 4.22 3.08 3.65 3.99
Brazil 11 19 30 3.60 5.33 3.83 5.18 3.31 4.20 3.81 4.04 3.66
Colombia 25 28 53 3.57 5.56 3.81 5.73 3.67 4.20 3.27 3.94 3.72
Costa Rica 16 6 22 3.82 4.74 3.93 5.32 3.56 3.75 3.60 4.12 4.39
Mexico 24 24 48 4.18 5.22 4.06 5.71 3.64 4.45 3.87 4.10 3.98
Venezuela 7 13 20 3.44 5.40 3.96 5.53 3.62 4.33 3.35 3.32 4.25
Total 96 107 203 3.74 5.35 3.88 5.55 3.57 4.23 3.51 3.91 3.94
Latin Europe:
France 69 48 117 4.43 5.28 3.93 4.37 3.64 4.13 3.48 4.11 3.40
Italy 129 97 226 3.79 5.43 3.68 4.94 3.24 4.07 3.25 3.58 3.63
Portugal 14 24 38 3.91 5.44 3.92 5.51 3.66 3.65 3.71 3.60 3.91
Spain 95 70 165 3.97 5.52 3.85 5.45 3.01 4.42 3.51 4.01 3.32
Total 307 239 546 3.99 5.43 3.80 5.01 3.29 4.16 3.41 3.82 3.51
Grand Total 1497 1286 2783 4.15 5.05 4.13 4.55 3.37 4.37 3.92 4.25 3.99
F-statistic** 2354 1261 1453 2409 962 551 5149 2809 3425
* The cultural dimension averages are based on a Likert scale of 1-7 (low agreement to high agreement) and are adopted
from House et al. (2004).
** The F-statistics are all significant at <0.001.
31
Table 3
Descriptive Statistics
Control Variables
Panel A: Discrete Variables – Percentage of responses
Variable
Group 1:
Anglo
(N =1748)*
Group 2:
East-EU
(N = 95)*
Group 3:
German-EU
(N = 191)*
Group 4:
Latin-AM
(N = 203)*
Group 5:
Latin-EU
(N = 546)*
Total
(n = 2783)*
Chi-Sq.
(P-value)
1. IIA membership:
5 years or less
6 years or more
40.2%
59.8%
69.5%
30.5%
48.9%
51.1%
73.5%
26.5%
62.8%
37.2%
48.6%
51.4%
159.4
(<0.001)
2. Degree:
Undergraduate
Graduate
61.6%
38.4%
64.2%
35.8%
30.4%
69.6%
61.1%
38.9%
59.4%
40.6%
59.1%
40.9%
70.9
(<0.001)
3. Major:
Accounting/Auditing
/Internal Auditing
Other
70.9%
29.1%
46.3%
53.7%
57.1%
42.9%
82.3%
17.7%
38.6%
61.4%
63.6%
36.4%
234.0
(<0.001)
4. Certification:
CIA or Equivalent
Other
51.1%
48.9%
27.4%
72.6%
44.0%
56.0%
30.0%
70.0%
29.1%
70.9%
44.0%
56.0%
112.0
(0.001)
Panel B: Continuous Variables: Mean and (standard deviation) of responses 5. Internal Audit
Experience
13.05
(9.53)
5.22
(3.23)
11.60
(8.04)
12.42
(9.16)
7.82
(5.78)
11.63
(8.96)
47.7
(<0.001)
6. 36 months Training
124.36
(112.44)
149.40
(126.15)
101.80
(109.78)
200.45
(193.37)
125.28
(178.65)
129.53
(136.93)
17.1
(<0.001)
* Due to missing data the actual responses may be below this sample size.
32
Table 4
Descriptive Statistics
Dependent Variables
Variable
Group 1:
Anglo
(N =1748)*
Group 2:
East-EU
(N = 95)*
Group 3:
German-EU
(N = 191)*
Group 4:
Latin-AM
(N = 203)*
Group 5:
Latin-EU
(N = 546)*
Total
(n = 2783)*
Chi-Sq.
(P-value
7 Use IIA standards Yes
No
86.3%
13.7%
90.4%
9.6%
78.8%
21.2%
86.6%
13.4%
80.7%
19.3%
84.9%
15.1%
18.2
(0.001)
Full compliance with:
8 AS 1000: Purpose, Authority
and Responsibility
74.5% 47.3% 58.1%
58.1%
59.8%
68.5%
64.14
(<0.001)
9 AS 1100: Independence &
Objectivity
76.7% 56.6% 71.8% 68.4% 68.6% 73.5% 24.76
(<0.001)
10 AS 1200: Proficiency & Due
Care
75.5% 50.7% 59.2% 66.7% 60.1% 70.0% 57.47
(<0.001)
11 AS 1300: Quality Assurance
& Improvement
44.6% 21.9% 29.3% 38.1% 31.5% 39.9% 38.39
(<0.001)
12 PS 2000: Managing the
internal Audit Activity
70.2% 44.7% 58.7% 54.5% 52.0% 63.9% 64.03
(<0.001)
13 PS 2100: Nature of Work 69.2% 43.2% 45.4% 59.1% 53.2% 63.1% 65.69
(<0.001)
14 PS 2200: Engagement
Planning
67.5% 48.7% 46.7% 59.6% 57.0% 62.9% 37.97
(<0.001)
15 PS 2300: Performing the
Engagement
71.2% 44.0% 49.2% 55.5% 59.0% 65.3% 60.88
(<0.001)
16 PS 2400: Communicating
Results
75.6% 45.3% 59.8% 63.2% 62.5% 70.1% 60.34
(<0.001)
17 PS 2500: Monitoring
Progress
65.1% 37.3% 52.0% 52.0% 45.4% 58.6% 67.72
(<0.001)
18 PS 2600: Monitoring
Progress
63.5% 20.3% 37.7% 37.5% 35.8% 53.2% 157.30
(<0.001)
19 All Standards 67.1% 41.3% 50.3% 55.3% 52.1% 61.4% 25.71**
(<0.001)
* Due to missing data the actual responses may be below this sample size.
**This F-statistic of the ANOVA test of differences in overall mean proportion of full compliance of all 11
Standards listed above.
(Note that AS stands for Attribute Standard and PS stands for Performance Standard)
32
Table 5
Correlation Matrix between All Independent Variables
1 2 3 4 5 6 7 8 9 10 11 12 13 14 15 16
1 UA 1.00
2 PD -0.42 1.00
3 IC 0.18 -0.66 1.00
4 IgC -0.57 0.81 -0.45 1.00
5 GE -0.44 0.03 0.34 0.22 1.00
6 AT 0.37 -0.46 0.03 -0.47 -0.49 1.00
7 FO 0.66 -0.82 0.50 -0.74 -0.31 0.70 1.00
8 PO 0.55 -0.79 0.55 -0.78 -0.29 0.69 0.87 1.00
9 HO 0.01 -0.67 0.70 -0.50 0.20 0.19 0.56 0.57 1.00
10 Degree 0.17 -0.09 0.03 -0.07 0.05 0.03 0.09 0.08 -0.09 1.00
11 Major 0.05 -0.25 0.17 -0.14 0.06 0.20 0.22 0.28 0.20 0.03 1.00
12 IAexperience 0.09 -0.18 0.12 -0.14 -0.07 0.15 0.22 0.21 0.21 -0.01 0.07 1.00
13 MembershipYrs 0.13 -0.20 0.14 -0.19 -0.11 0.16 0.22 0.22 0.16 0.02 0.05 0.50 1.00
14 IA Certification 0.10 -0.14 0.10 -0.17 -0.02 0.09 0.17 0.15 0.15 0.06 0.08 0.18 0.29 1.00
15 TrainingHrs -0.10 0.01 -0.01 0.09 0.06 -0.05 -0.06 -0.05 0.00 0.05 0.07 0.03 0.05 0.06 1.00
16 Position -0.03 -0.01 0.00 -0.02 0.02 0.00 0.01 0.01 0.04 0.00 -0.04 -0.08 -0.06 0.09 0.00 1.00
33
Table 6
Correlation Matrix between Refined Independent Variables
1 2 3 4 5 6 7 8 9
1 UA 1.00
2 AT 0.37 1.00
3 HO 0.01 0.19 1.00
4 Degree 0.17 0.03 -0.09 1.00
5 Major 0.05 0.20 0.20 0.03 1.00
6 MembershipYrs 0.13 0.16 0.16 0.02 0.05 1.00
7 IA Certification 0.10 0.09 0.15 0.06 0.08 0.29 1.00
8 TraingHrs -0.10 -0.05 0.00 0.05 0.07 0.05 0.06 1.00
9 Position -0.03 0.00 0.04 0.00 -0.04 -0.06 0.09 0.00 1.00
34
Table 7
Multivariate Analysis
Refined Logistic Regression Model for Use of IIA Standards (Model 1) and Ordinary Least
Square Regression for Compliance with IIA Standards (Model 2) as Dependent Variables
Y = α + 1UA + 2 AT+ 3HO + 4Degree + 5Major + 6MembershipYrs+ 7IACertification +
8TrainingHours + 9Position+ ε
Model 1: Use (yes/no) Model 2: Compliance (%)
Variable* B Wald Sig. B T-stat. Sig.
1 (H2) UA -0.393 6.808 0.009 -0.036 -1.490 0.136
2 (H3) AT 0.051 0.050 0.823 0.141 5.773 <0.001
3 (H4) HO 0.186 1.155 0.283 0.106 4.600 <0.001
4 Degree -0.008 0.005 0.943 0.029 1.291 0.197
5 Major 0.035 0.089 0.766 -0.006 -0.270 0.787
6 MembershipYrs 0.577 23.525 <0.001 0.095 4.034 <0.001
7 IA Certification 0.600 23.459 <0.001 0.060 2.583 0.010
8 TrainingHrs 0.001 3.196 0.074 0.050 2.279 0.023
9 Position 0.038 0.113 0.736 0.034 1.555 0.120
10 Constant 1.720 2.321 0.128 -.686 -4.131 <0.001
Chi-sq (Sig.)
86.215 (<0.001)
F-Statistic (Sig.)
14.951 (<0.001)
Classification Accuracy
84.8%
Nagelkerke R2
5.5%
Adjusted R2
6.6%
Y = Use (Model 1), Compliance (Model 2) with Standards
UA = Uncertainty Avoidance (1-7 scale)
AT = Assertiveness (1-7 scale)
HO = Human Orientation (1-7 scale)
Degree = Graduate degree =1, undergraduate degree = 0
Major = Accounting/auditing/internal-auditing = 1, others = 0
MembershipYrs = 1 if 6 years or more, 0 if 5 years or less
IACertification = 1 if professionally certified as internal auditor, 0 otherwise
TrainingHours = Number of hours of training over the past 36 months6
Position = 1 if CAE, 0 if IAM
ε = Error term
6 CBOK (2006) collected data on CPE every 36 months and every 12 months. The 36-month period is a more
meaningful data for analysis because it indicates longer term commitment to training than training over only a 12-
month period.