Cultivator Presentations
54
Cultivator Presentations Remember: Round Table is off the record.
Transcript of Cultivator Presentations
Cultivator Presentations
Remember: Round Table is off the record.

Becky Doyle
MODERATOR | THE CONTEXT NETWORK
June 2021 Farm Foundation Cultivators
▪ Shweta Adhikari
University of Georgia
Mentor: Gregg Doud
▪ Vivian Vuong
University of California, Davis
Mentor: A.G. Kawamura
▪ Janeva Williams
North Carolina Agricultural &
Technical State University
Mentor: Jimmy Kinder
Thank you to BNSF and the Round Table Fellows for
your support of the Cultivators Program!
▪ Laura van der Pol
Colorado State University
Mentor: Bill Northey
▪ Lacey Lingelbach
University of Florida
Mentor: Jack Payne
▪ Octavio Guimaraes
Colorado State University
Mentor: John Foltz

Shweta Adhikari
UNIVERSITY OF GEORGIA
Impact of recent policy changes on global palm oil trade: A Gravity model approach
-Shweta AdhikariMS studentUniversity of Georgia
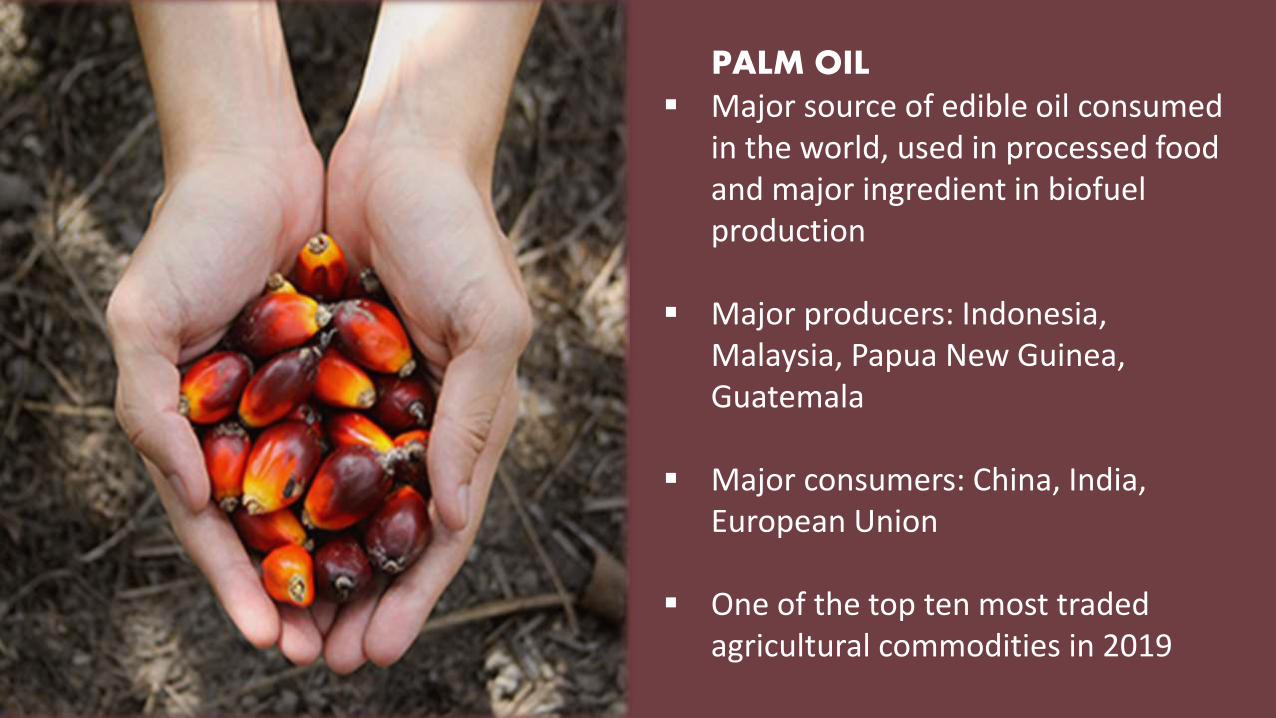
PALM OIL▪ Major source of edible oil consumed
in the world, used in processed food and major ingredient in biofuel production
▪ Major producers: Indonesia, Malaysia, Papua New Guinea, Guatemala
▪ Major consumers: China, India, European Union
▪ One of the top ten most traded agricultural commodities in 2019
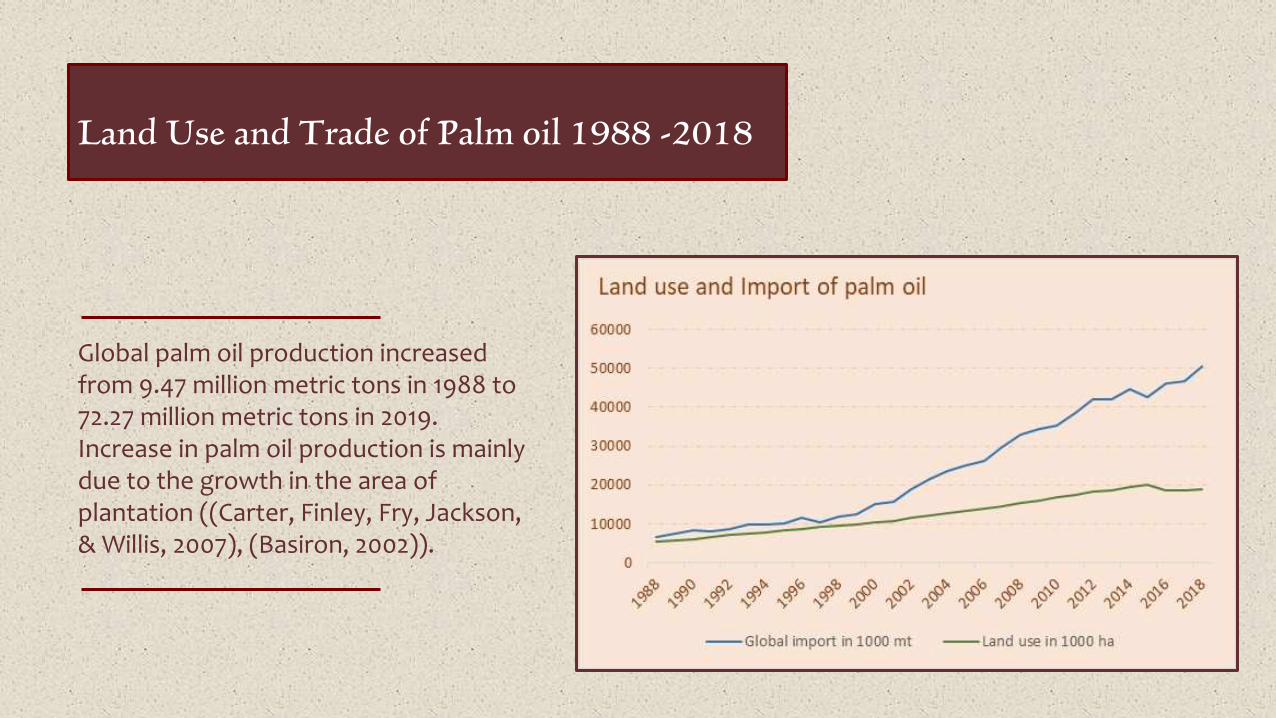
Land Use and Trade of Palm oil 1988 -2018
Global palm oil production increased from 9.47 million metric tons in 1988 to 72.27 million metric tons in 2019. Increase in palm oil production is mainly due to the growth in the area of plantation ((Carter, Finley, Fry, Jackson, & Willis, 2007), (Basiron, 2002)).
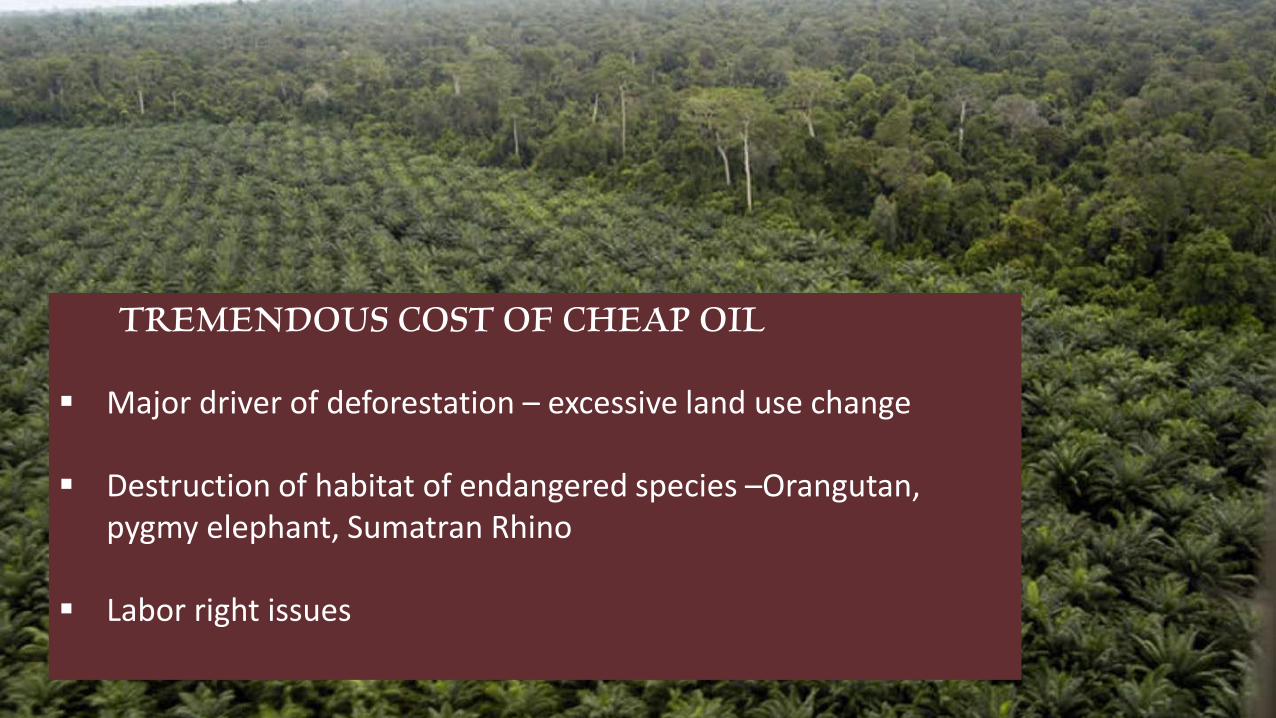
TREMENDOUS COST OF CHEAP OIL
▪ Major driver of deforestation – excessive land use change
▪ Destruction of habitat of endangered species –Orangutan, pygmy elephant, Sumatran Rhino
▪ Labor right issues
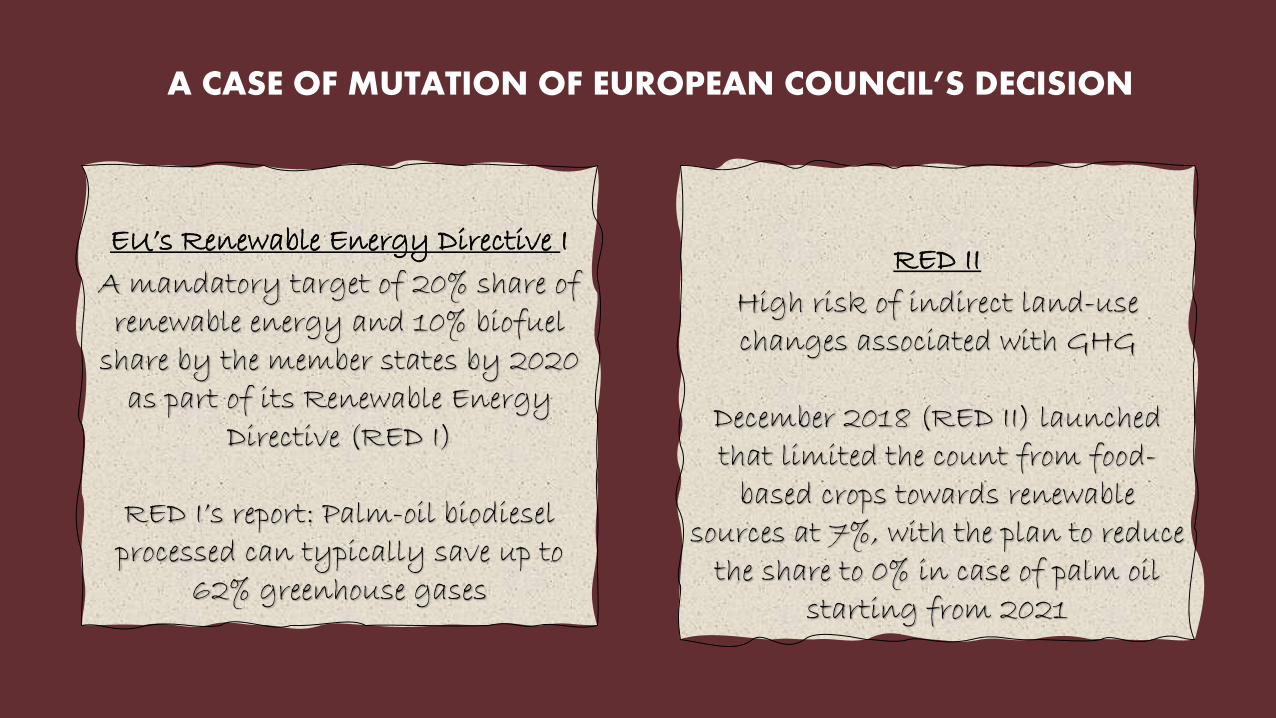
EU’s Renewable Energy Directive I
A mandatory target of 20% share of renewable energy and 10% biofuel
share by the member states by 2020 as part of its Renewable Energy
Directive (RED I)
RED I’s report: Palm-oil biodiesel processed can typically save up to
62% greenhouse gases
RED II
High risk of indirect land-use changes associated with GHG
December 2018 (RED II) launched that limited the count from food-
based crops towards renewable sources at 7%, with the plan to reduce
the share to 0% in case of palm oil starting from 2021
A CASE OF MUTATION OF EUROPEAN COUNCIL’S DECISION
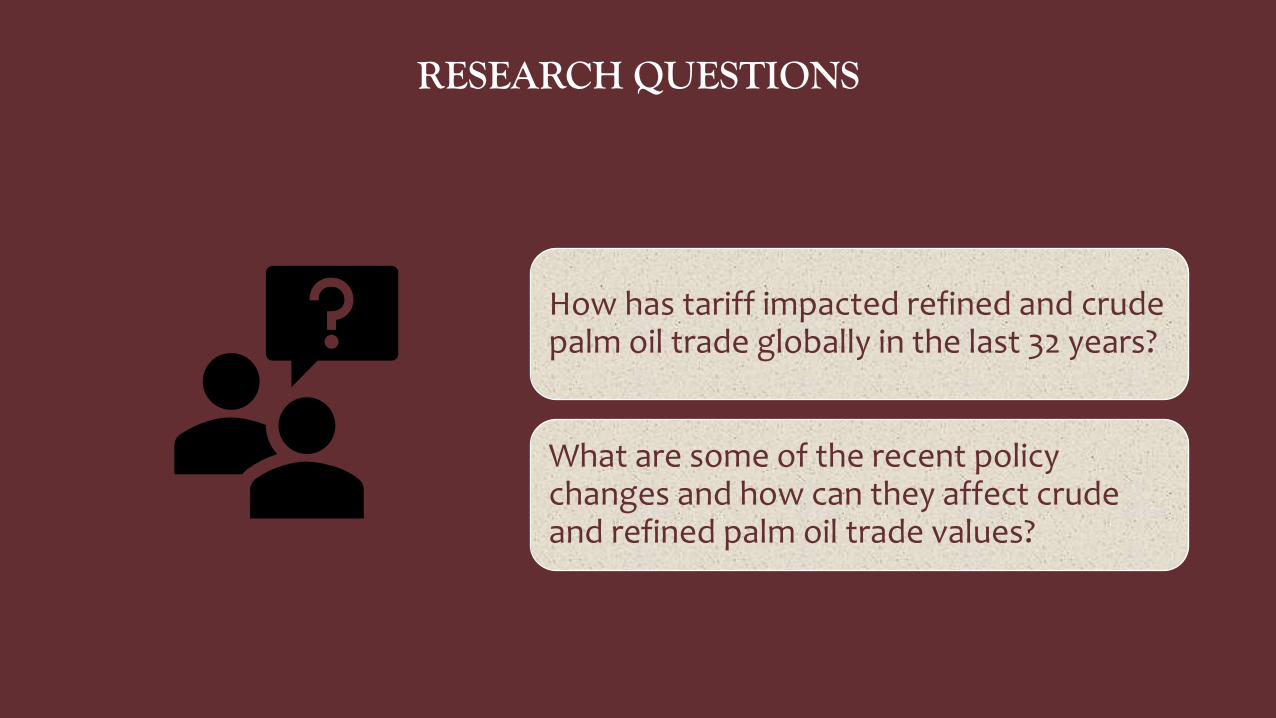
RESEARCH QUESTIONS
How has tariff impacted refined and crude palm oil trade globally in the last 32 years?
What are some of the recent policy changes and how can they affect crude and refined palm oil trade values?
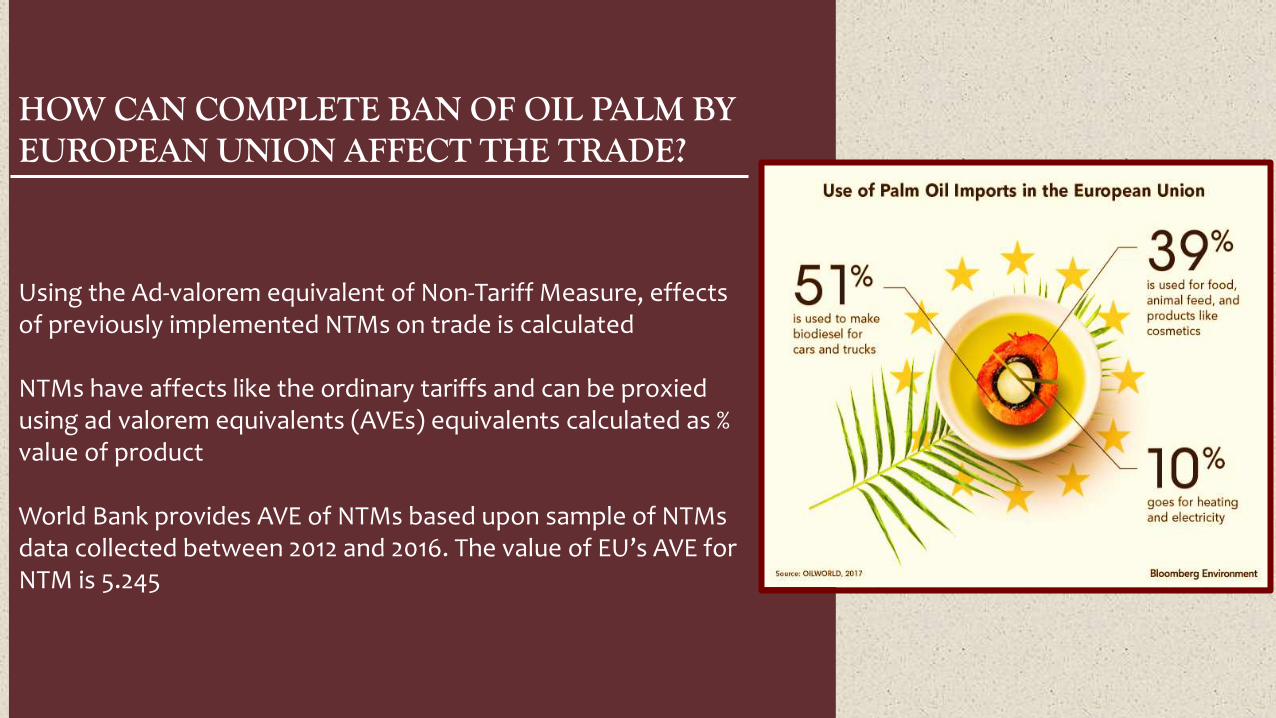
HOW CAN COMPLETE BAN OF OIL PALM BY EUROPEAN UNION AFFECT THE TRADE?
Using the Ad-valorem equivalent of Non-Tariff Measure, effects of previously implemented NTMs on trade is calculated
NTMs have affects like the ordinary tariffs and can be proxiedusing ad valorem equivalents (AVEs) equivalents calculated as % value of product
World Bank provides AVE of NTMs based upon sample of NTMs data collected between 2012 and 2016. The value of EU’s AVE for NTM is 5.245
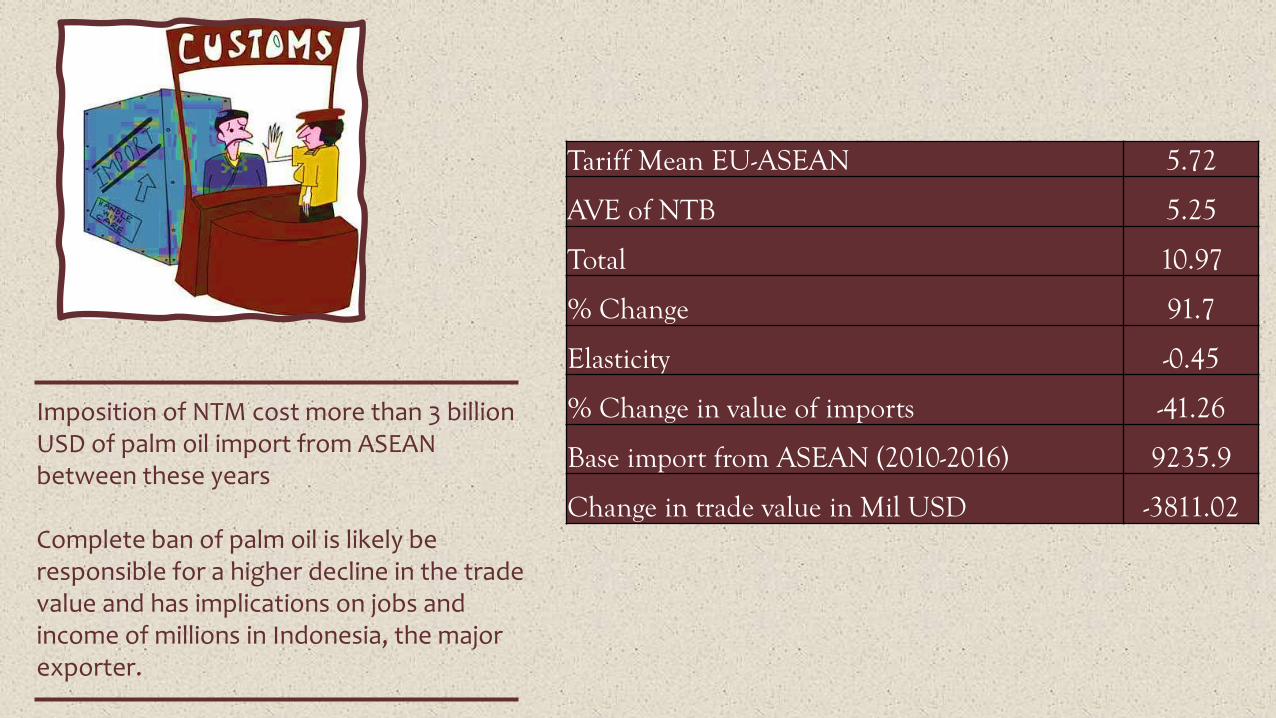
Tariff Mean EU-ASEAN 5.72
AVE of NTB 5.25
Total 10.97
% Change 91.7
Elasticity -0.45
% Change in value of imports -41.26
Base import from ASEAN (2010-2016) 9235.9
Change in trade value in Mil USD -3811.02
Imposition of NTM cost more than 3 billion USD of palm oil import from ASEAN between these years
Complete ban of palm oil is likely be responsible for a higher decline in the trade value and has implications on jobs and income of millions in Indonesia, the major exporter.
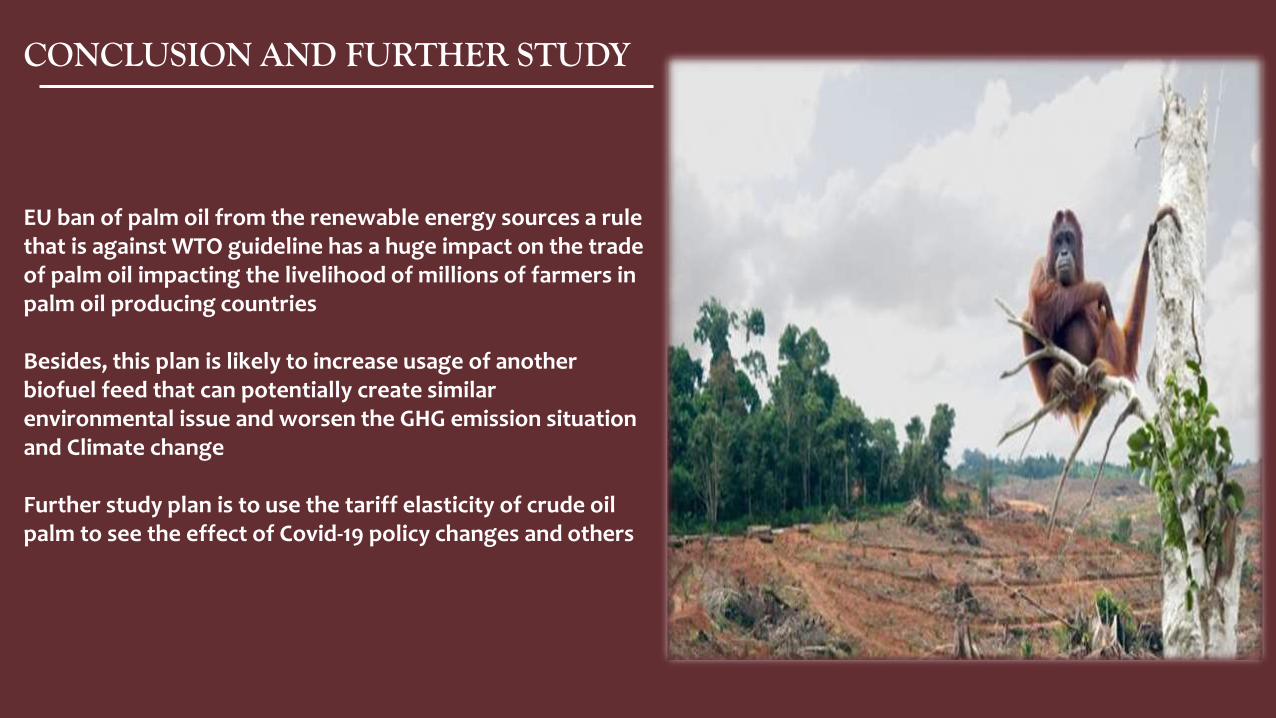
CONCLUSION AND FURTHER STUDY
EU ban of palm oil from the renewable energy sources a rule that is against WTO guideline has a huge impact on the trade of palm oil impacting the livelihood of millions of farmers in palm oil producing countries
Besides, this plan is likely to increase usage of another biofuel feed that can potentially create similar environmental issue and worsen the GHG emission situation and Climate change
Further study plan is to use the tariff elasticity of crude oil palm to see the effect of Covid-19 policy changes and others

THANK YOU!
https://www.linkedin.com/in/shwetaadhikari1997/

Vivian Vuong
UNIVERSITY OF CALIFORNIA, DAVIS

IN-FIELD AUTOMATED HIGH-
THROUGHPUT PHENOTYPING
IN SOLANACEAE CROPS
PRESENTED BY VIVIAN L. VUONGADVISED BY PROF. DAVID SLAUGHTER
UNIVERSITY OF CALIFORNIA, DAVIS, DEPARTMENT OF BIOLOGICAL AND AG. ENGINEERING
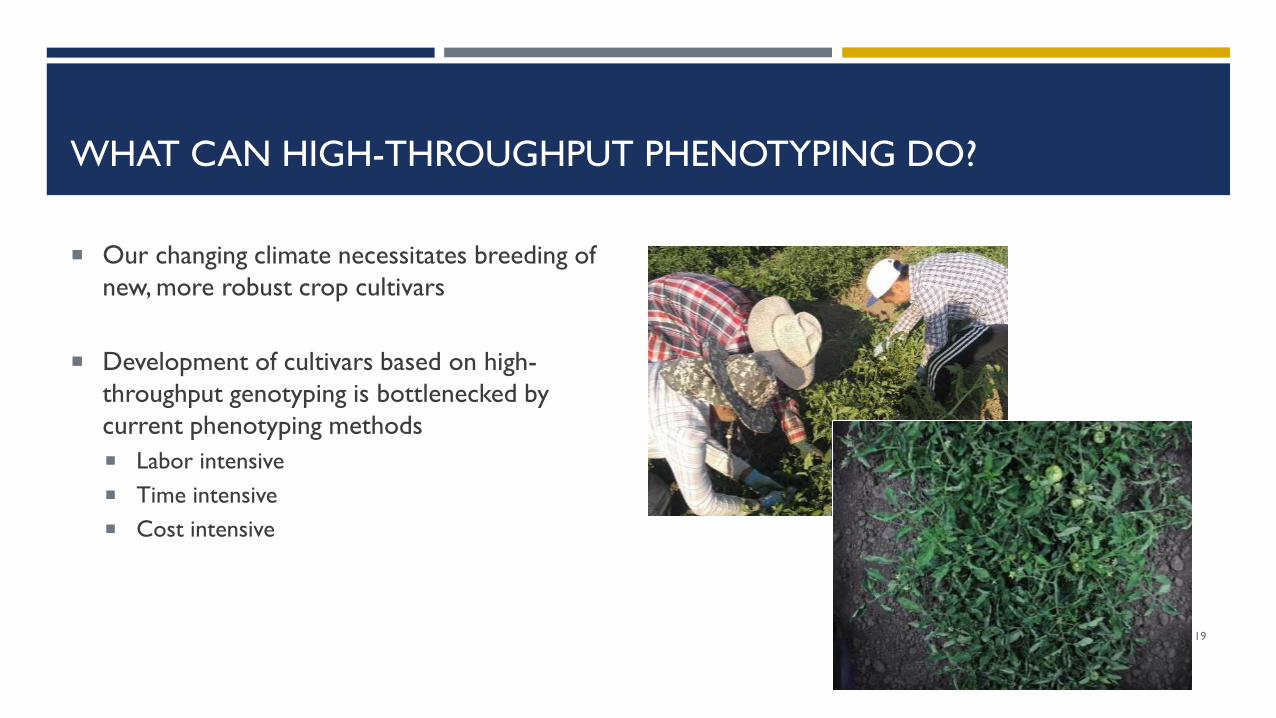
WHAT CAN HIGH-THROUGHPUT PHENOTYPING DO?
Our changing climate necessitates breeding of
new, more robust crop cultivars
Development of cultivars based on high-
throughput genotyping is bottlenecked by
current phenotyping methods
Labor intensive
Time intensive
Cost intensive
19

HIGH-THROUGHPUT PHENOTYPING SYSTEM
20
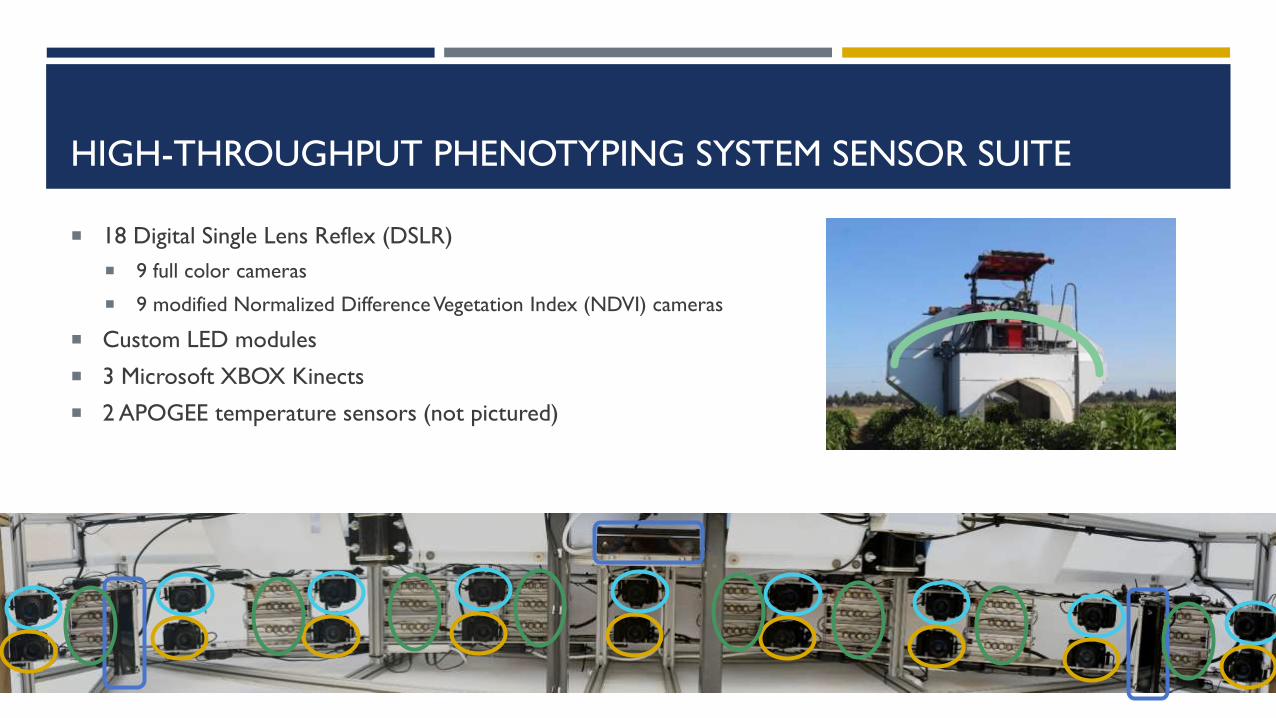
HIGH-THROUGHPUT PHENOTYPING SYSTEM SENSOR SUITE
18 Digital Single Lens Reflex (DSLR)
9 full color cameras
9 modified Normalized Difference Vegetation Index (NDVI) cameras
Custom LED modules
3 Microsoft XBOX Kinects
2 APOGEE temperature sensors (not pictured)
22
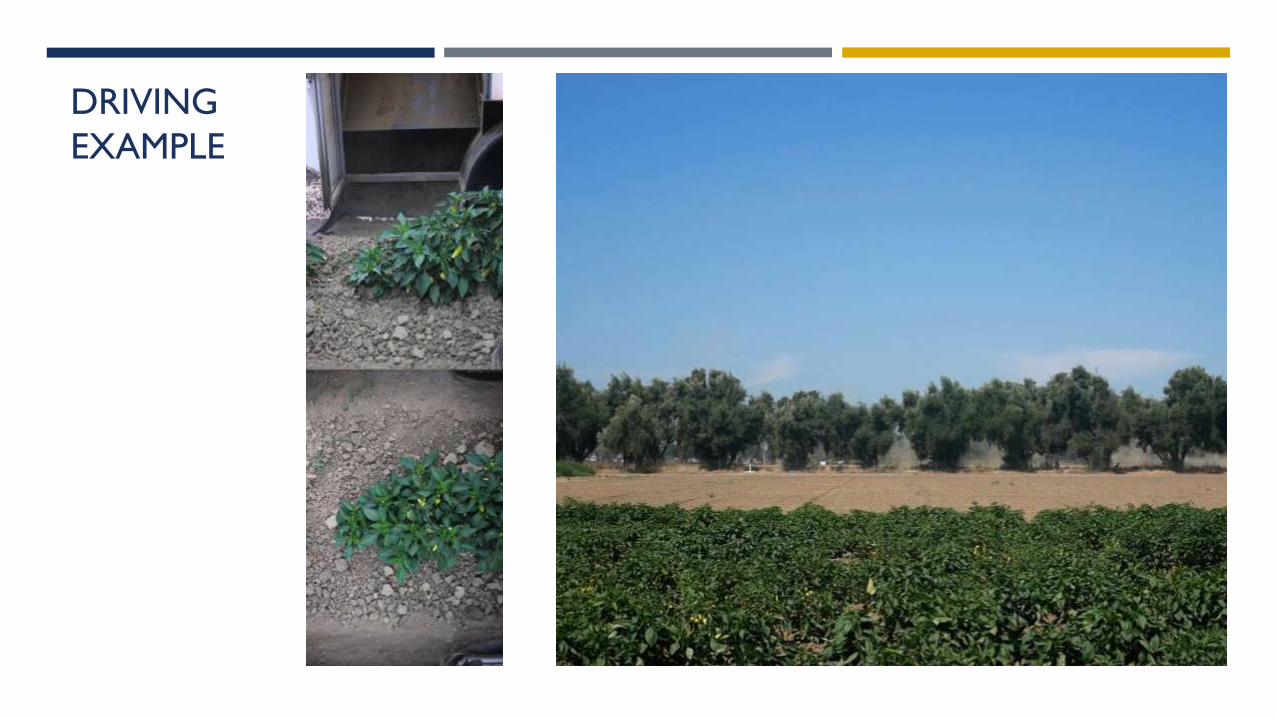
DRIVING
EXAMPLE

WHAT DO WE DO WITH THE DATA?
We collected ~1 TB of data each day
2 years of data collection
15 days/year of total data collection
Neural networks were trained to find different objects in a tomato plant
23
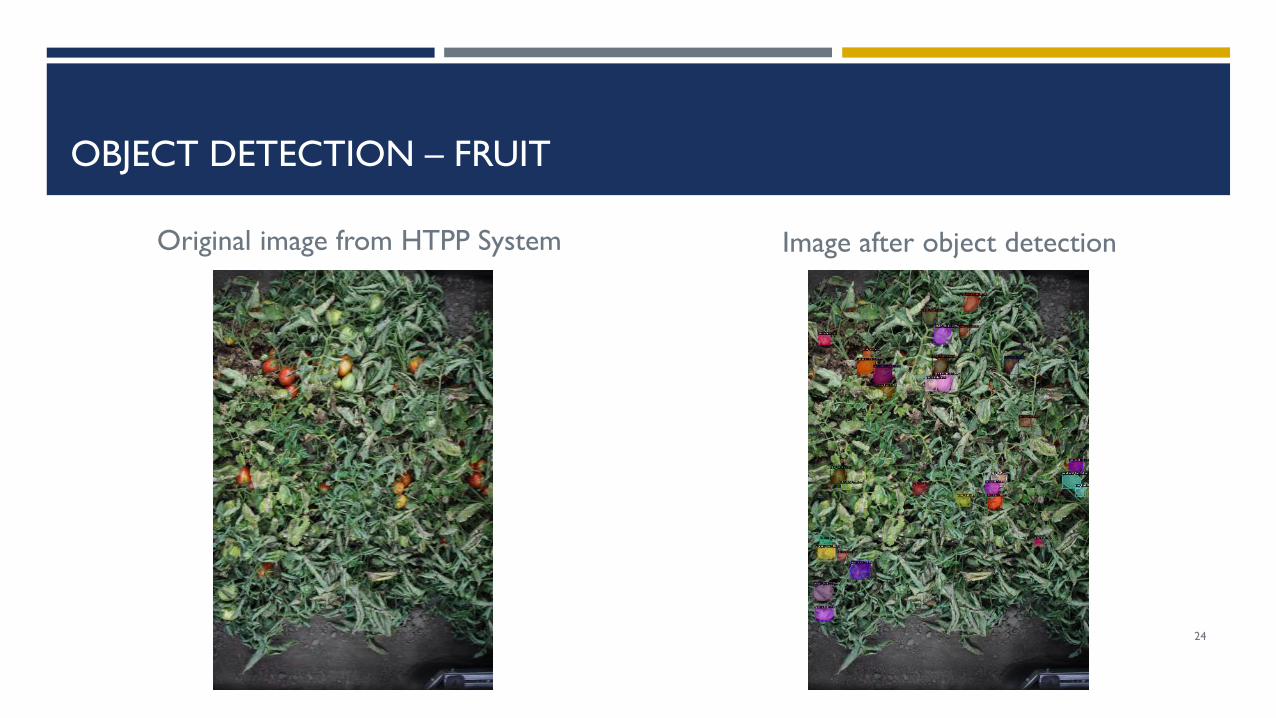
OBJECT DETECTION – FRUIT
Original image from HTPP System Image after object detection
24
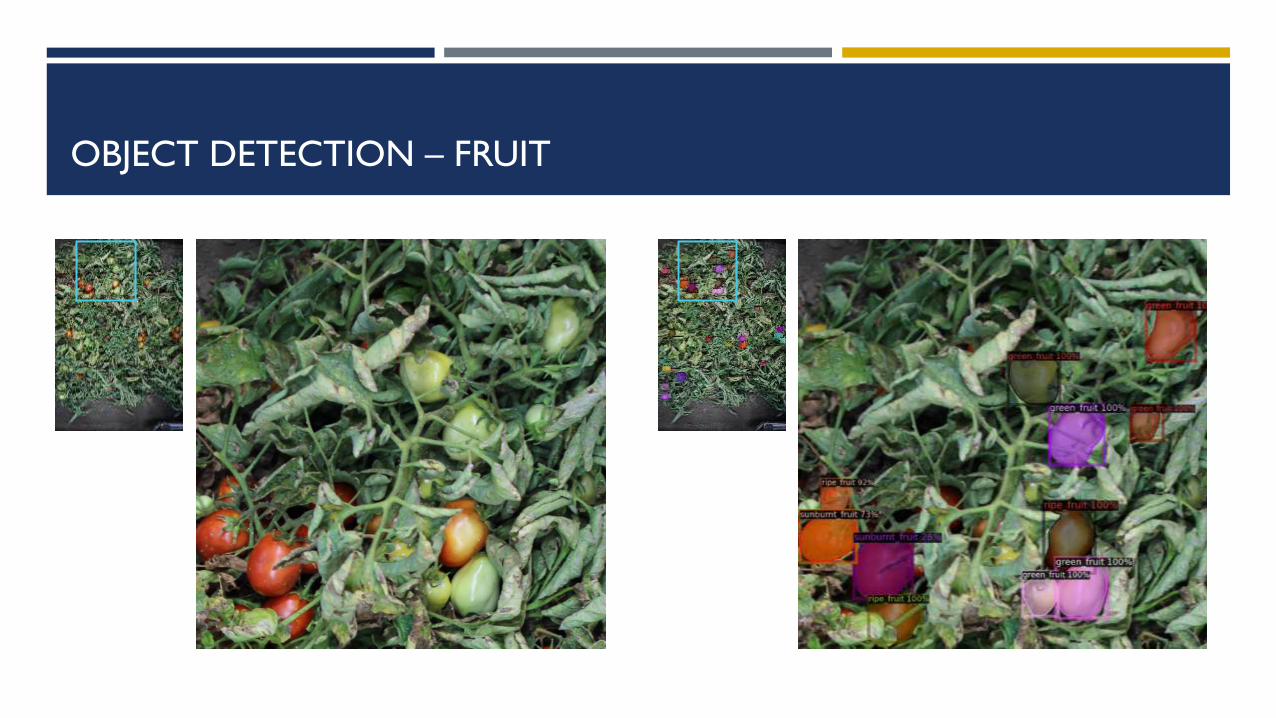
OBJECT DETECTION – FRUIT
25

OBJECT DETECTION – FLOWERS
26
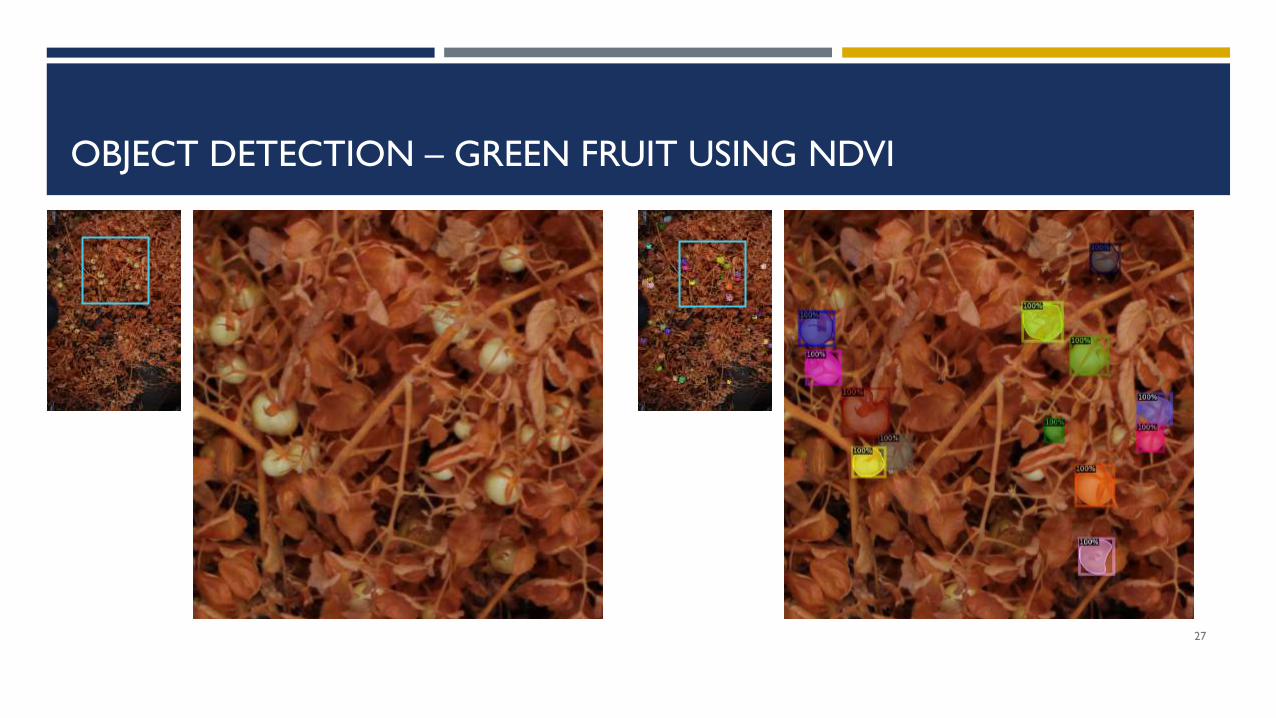
OBJECT DETECTION – GREEN FRUIT USING NDVI
27
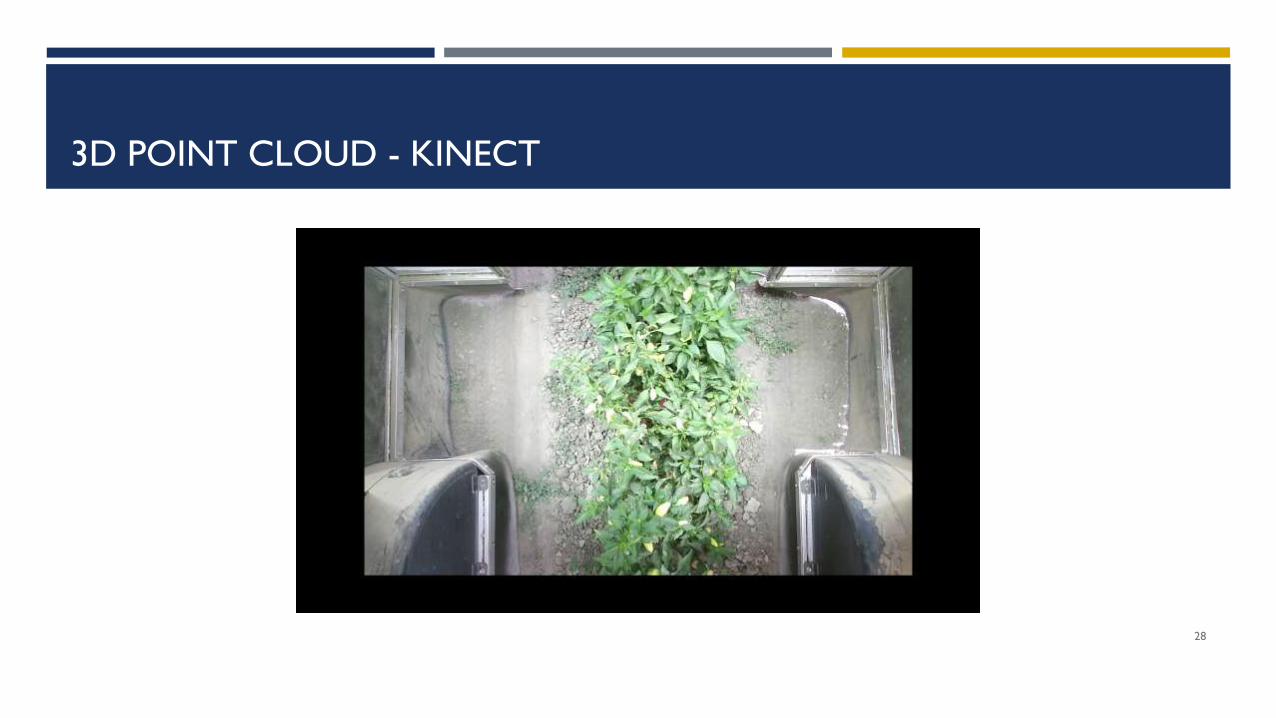
3D POINT CLOUD - KINECT
28

JanevaWilliams
NORTH CAROLINA AGRICULTURAL AND
TECHNICAL STATE UNIVERSITY
Impact of Cover Cropping and Manure Application on Nitrous Oxide Emissions
Ms. Janeva Williams
NCAT Department of Natural Resources and Environmental Design
06/2021

ncat.edu
Advantages and Challenges Of Using Cover Crop and Manure
• Improved carbon accrual
• Increased soil biodiversity
• Increased soil microbial activity
Advantages
• Synchronizing nutrient release with plant up take
• Increased nitrous oxide emissions (N2O)
Challenges
Soil Health Practices
Reduced Tillage
Crop Rotation
Compost Manure
Cover Crop
ncat.edu
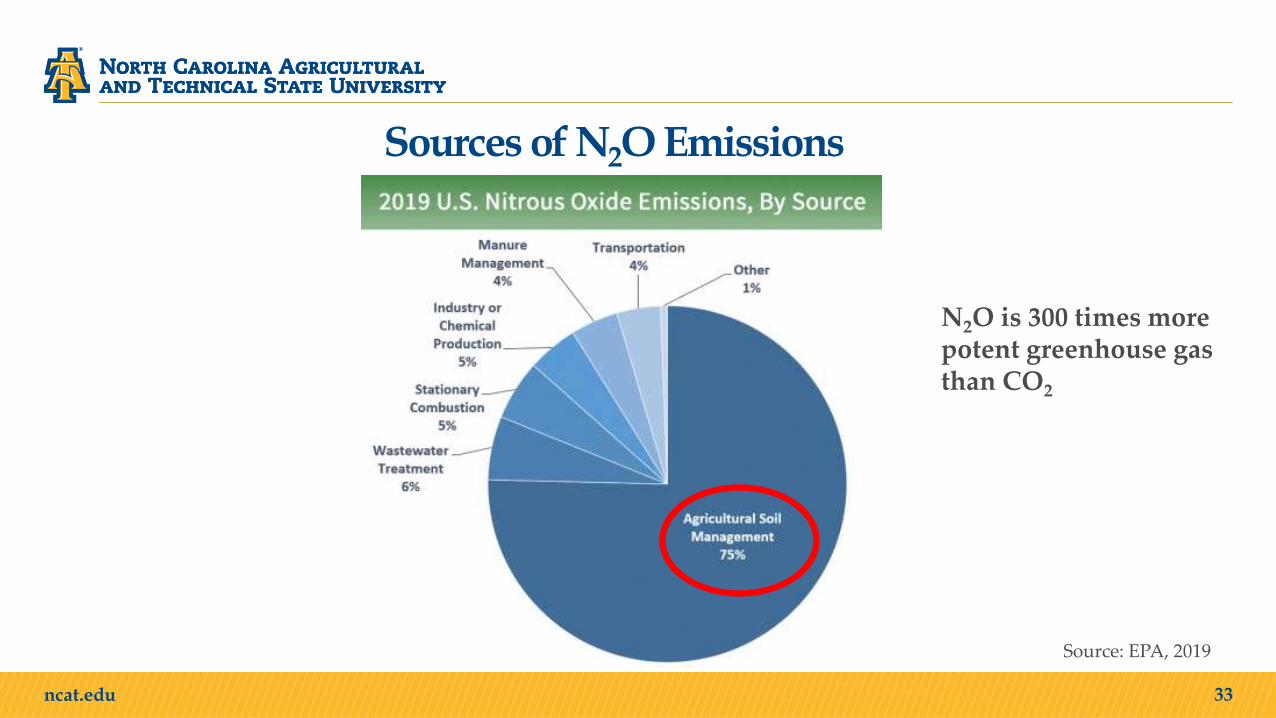
Sources of N2O Emissions
33
Source: EPA, 2019
N2O is 300 times more potent greenhouse gas than CO2
ncat.edu
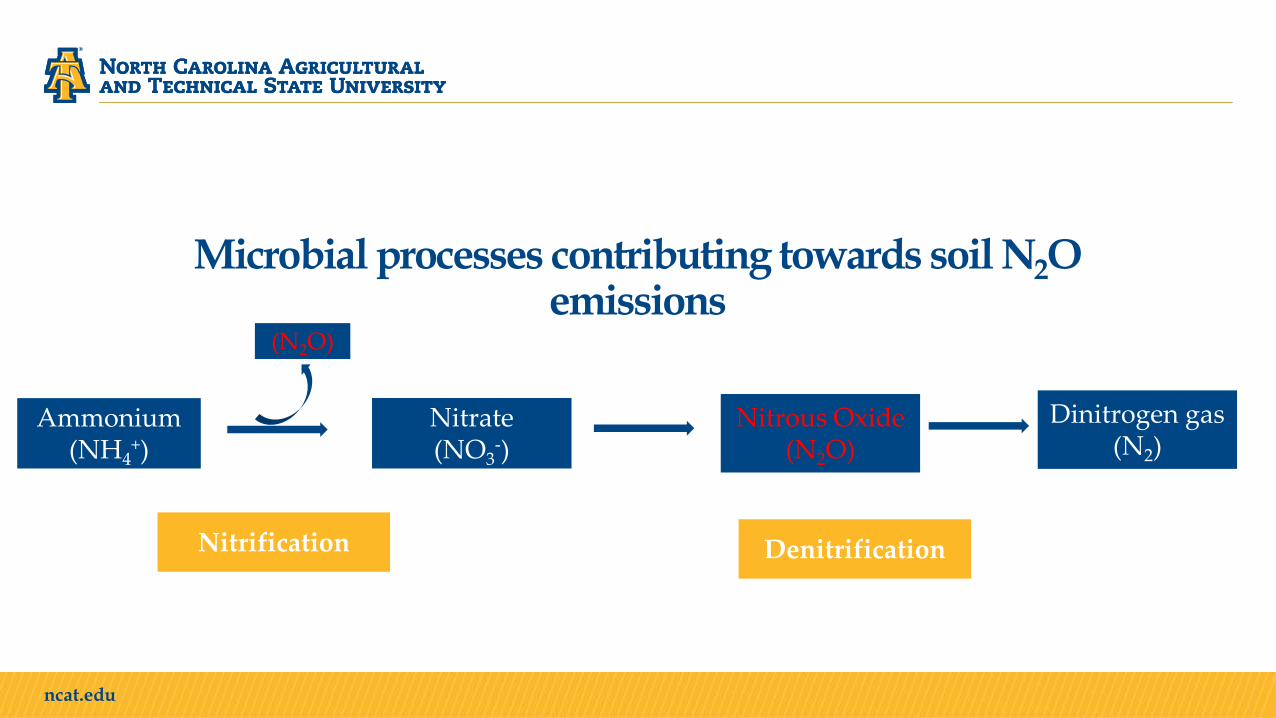
Microbial processes contributing towards soil N2O emissions
DenitrificationNitrification
Ammonium (NH4
+)Nitrate(NO3
-)Nitrous Oxide
(N2O)
Dinitrogen gas (N2)
(N2O)
ncat.edu
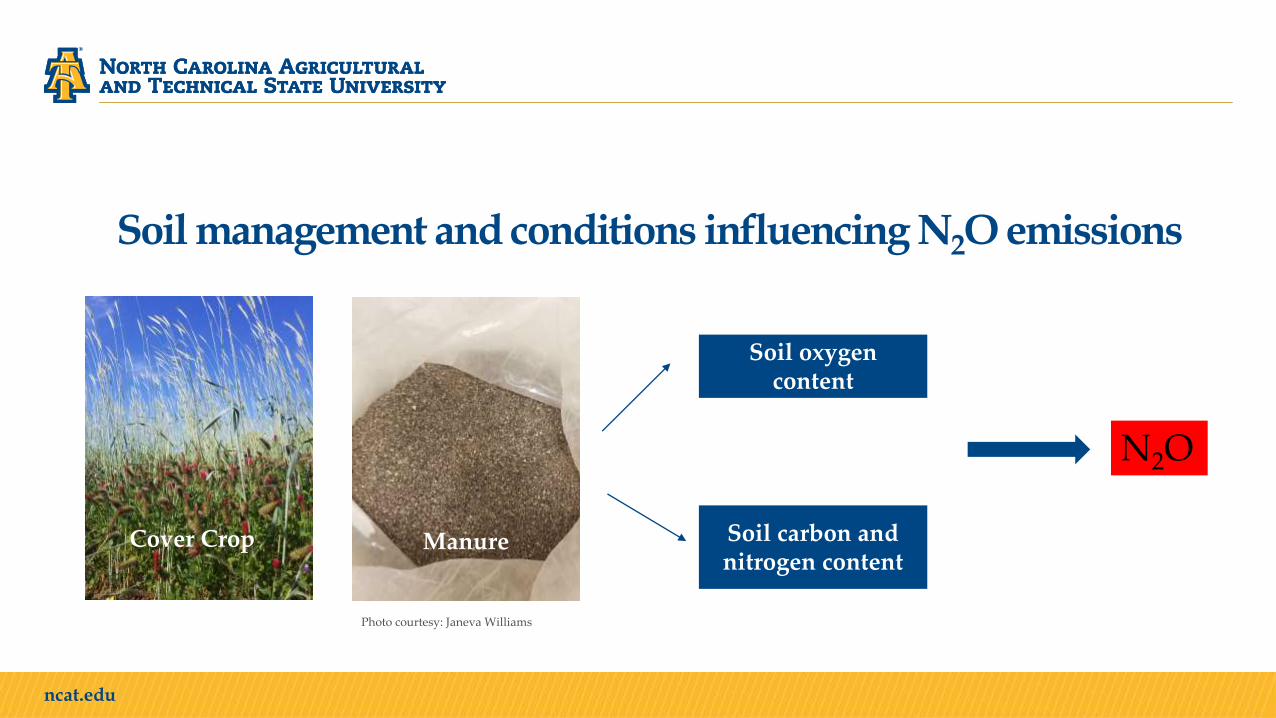
Soil management and conditions influencing N2O emissions
Soil oxygen content
Soil carbon and nitrogen content
ManureCover Crop
Photo courtesy: Janeva Williams
N2O
ncat.edu
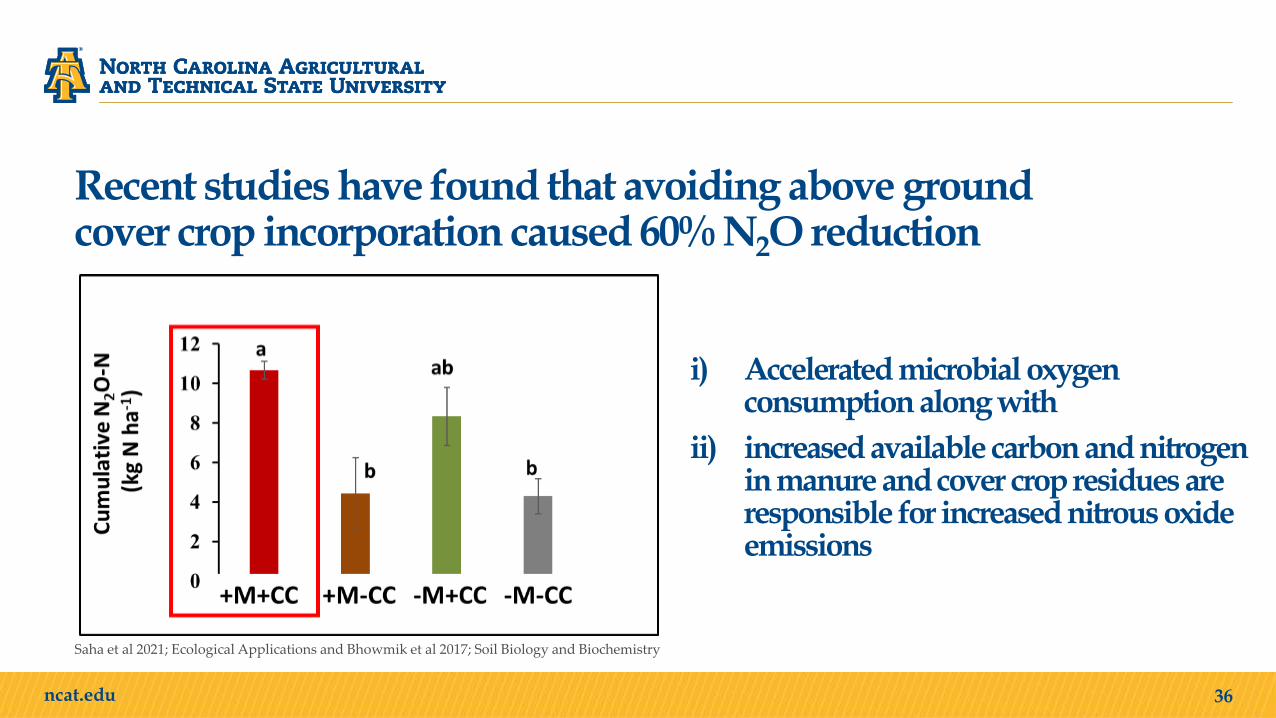
Recent studies have found that avoiding above ground cover crop incorporation caused 60% N2O reduction
i) Accelerated microbial oxygen consumption along with
ii) increased available carbon and nitrogen in manure and cover crop residues are responsible for increased nitrous oxide emissions
36
Saha et al 2021; Ecological Applications and Bhowmik et al 2017; Soil Biology and Biochemistry
ncat.edu
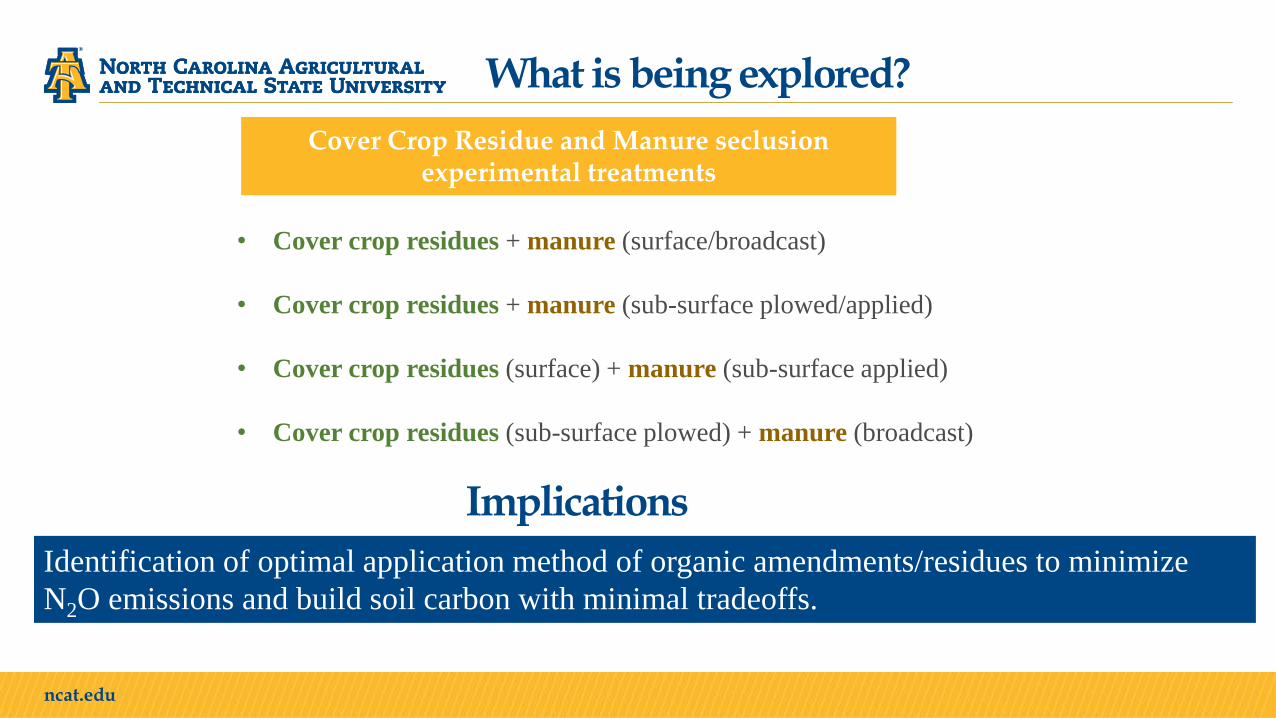
What is being explored?
Cover Crop Residue and Manure seclusion experimental treatments
• Cover crop residues + manure (surface/broadcast)
• Cover crop residues + manure (sub-surface plowed/applied)
• Cover crop residues (surface) + manure (sub-surface applied)
• Cover crop residues (sub-surface plowed) + manure (broadcast)
Identification of optimal application method of organic amendments/residues to minimize
N2O emissions and build soil carbon with minimal tradeoffs.
Implications

ncat.edu
Acknowledgements
38
Soil Sustainability Lab, NC A&T
Funding Agency
Dr. Arnab Bhowmik, Lab PI and major advisorDr. Dipti Rai, PostdocDr. Idowu Atoloye, PostdocMs. Amira Slocum, undergrad researcher USDA Organic Transitions (ORG) program
Collaborating Institutions

Laura van der Pol
COLORADO STATE UNIVERSITY
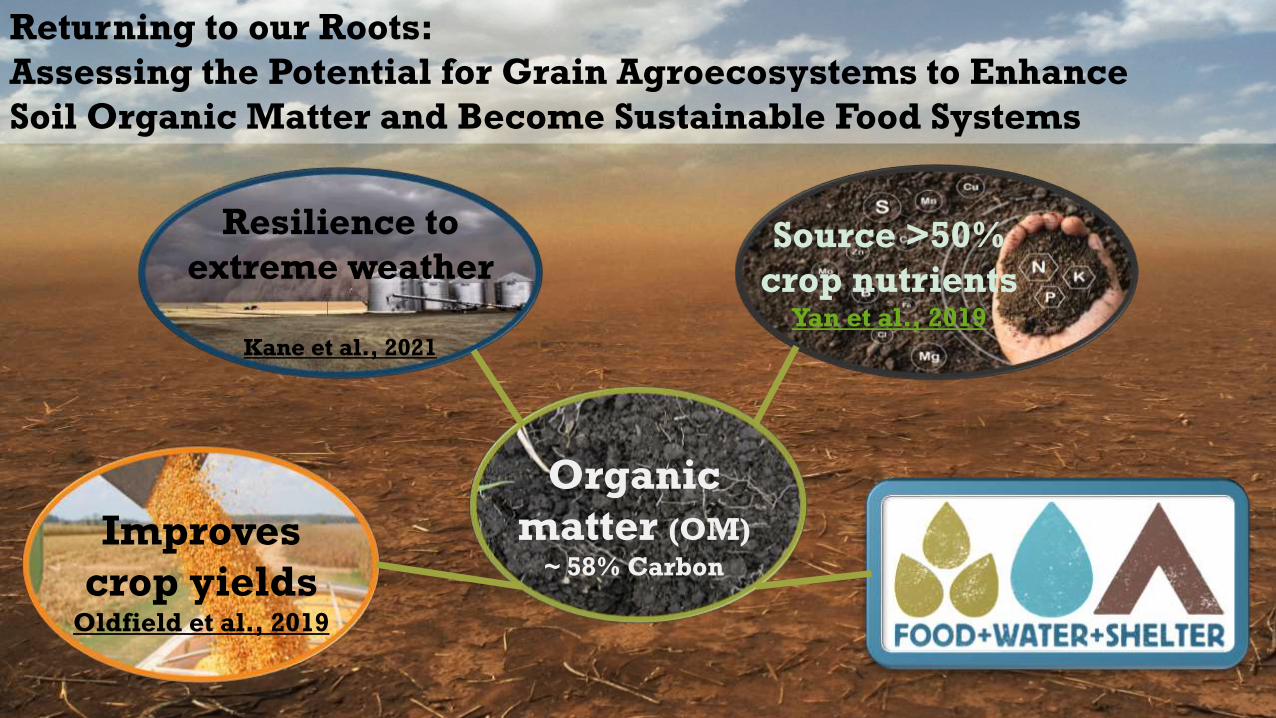
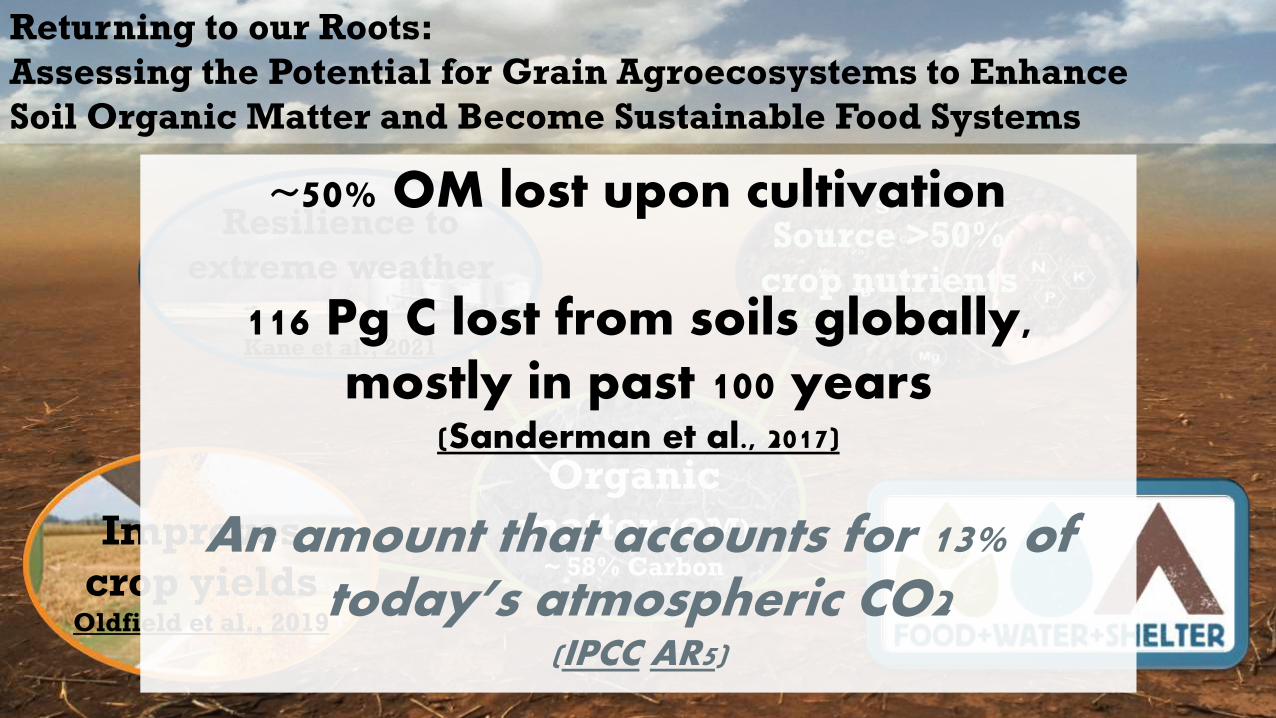
Returning to our Roots:
Assessing the Potential for Grain Agroecosystems to Enhance
Soil Organic Matter and Become Sustainable Food Systems
Organic
matter (OM)~ 58% Carbon
Improves
crop yieldsOldfield et al., 2019
Resilience to
extreme weather
Kane et al., 2021
Source >50%
crop nutrientsYan et al., 2019
~50% OM lost upon cultivation
116 Pg C lost from soils globally, mostly in past 100 years
(Sanderman et al., 2017)
An amount that accounts for 13% of today’s atmospheric CO2
(IPCC AR5)
CN
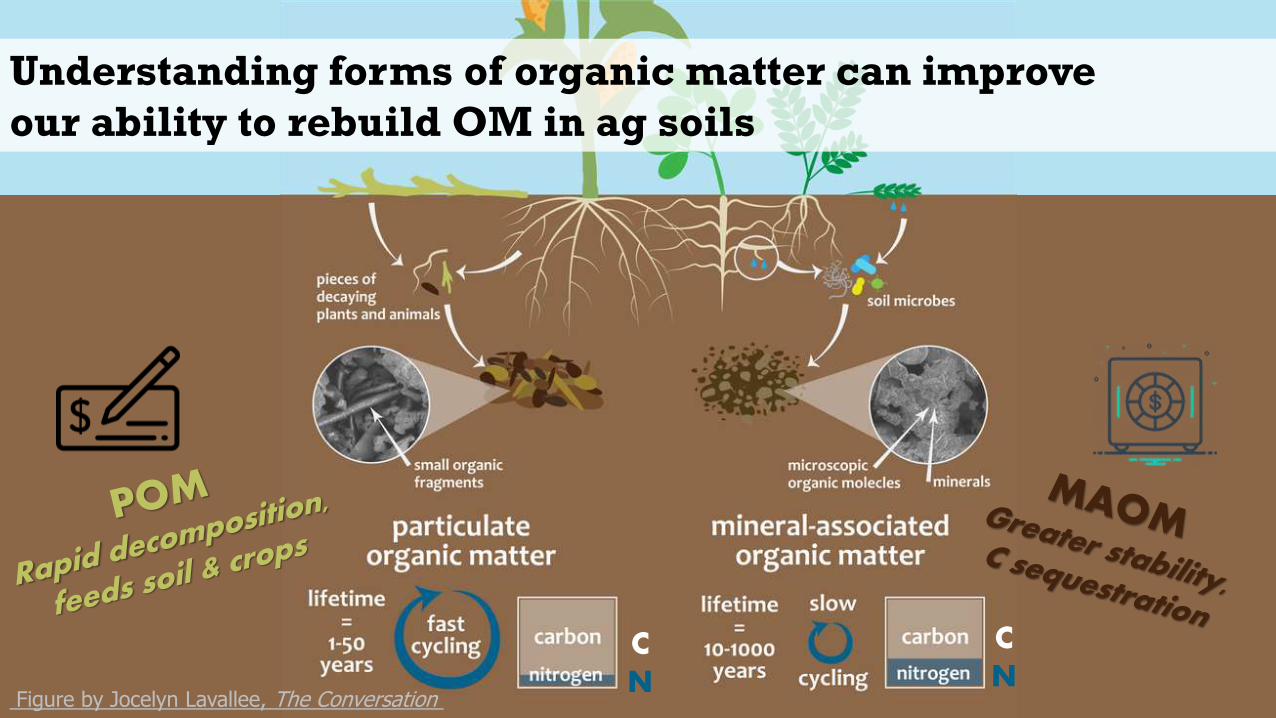
Figure by Jocelyn Lavallee, The Conversation
CN
Understanding forms of organic matter can improve
our ability to rebuild OM in ag soils

More MOAM & POM in rotation with legumes
van der Pol et al., 2021 In review
PO
M
MAOM
Fallow Continuous with legume
Fallow Continuous with legume
Fra
ctio
n N
Fra
ctio
n C
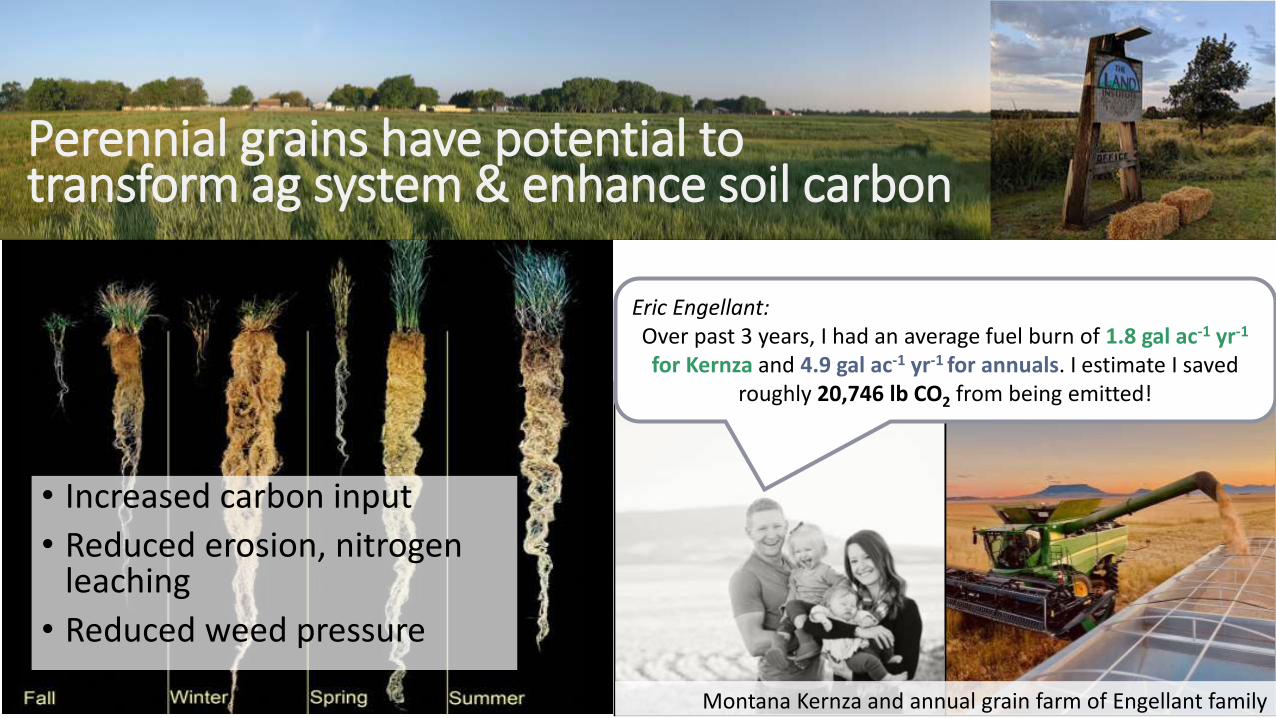
Montana Kernza and annual grain farm of Engellant family
Eric Engellant: Over past 3 years, I had an average fuel burn of 1.8 gal ac-1 yr-1
for Kernza and 4.9 gal ac-1 yr-1 for annuals. I estimate I saved roughly 20,746 lb CO2 from being emitted!
• Increased carbon input
• Reduced erosion, nitrogen leaching
• Reduced weed pressure
Perennial grains have potential to transform ag system & enhance soil carbon
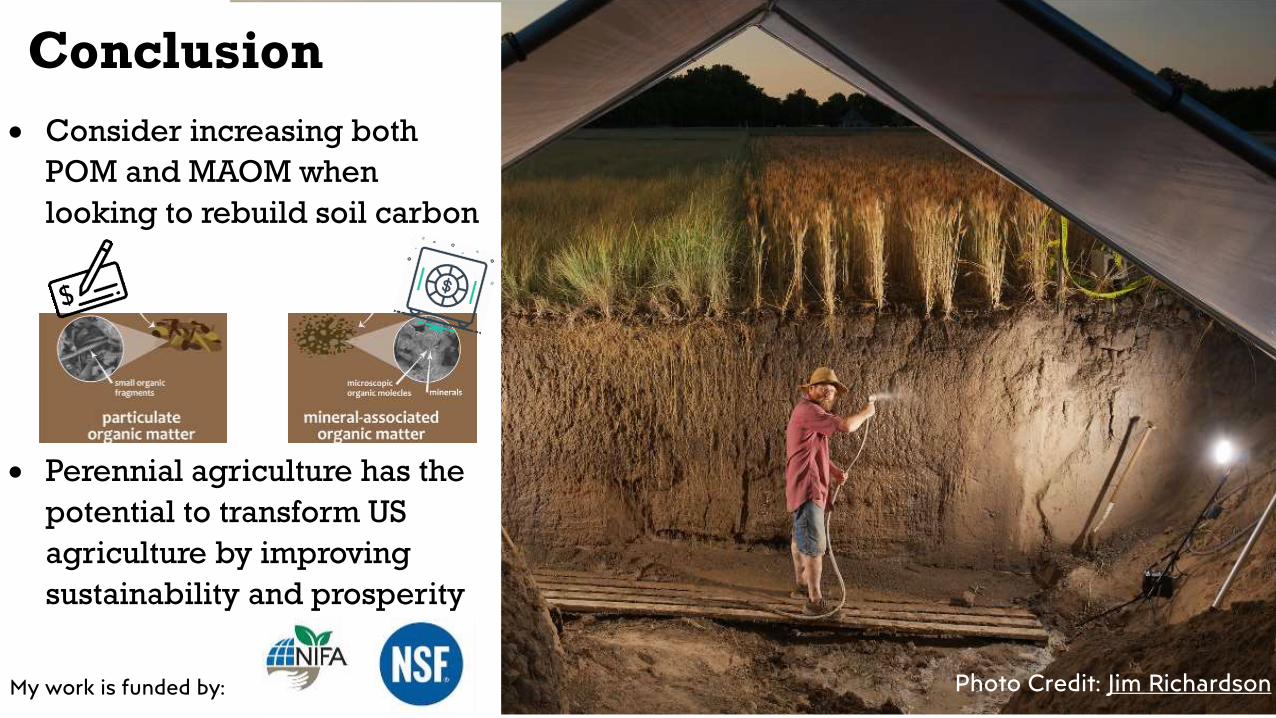
Photo Credit: Jim Richardson
• Consider increasing both
POM and MAOM when
looking to rebuild soil carbon
• Perennial agriculture has the
potential to transform US
agriculture by improving
sustainability and prosperity
My work is funded by:
Conclusion

Lacey Lingelbach
UNIVERSITY OF FLORIDA
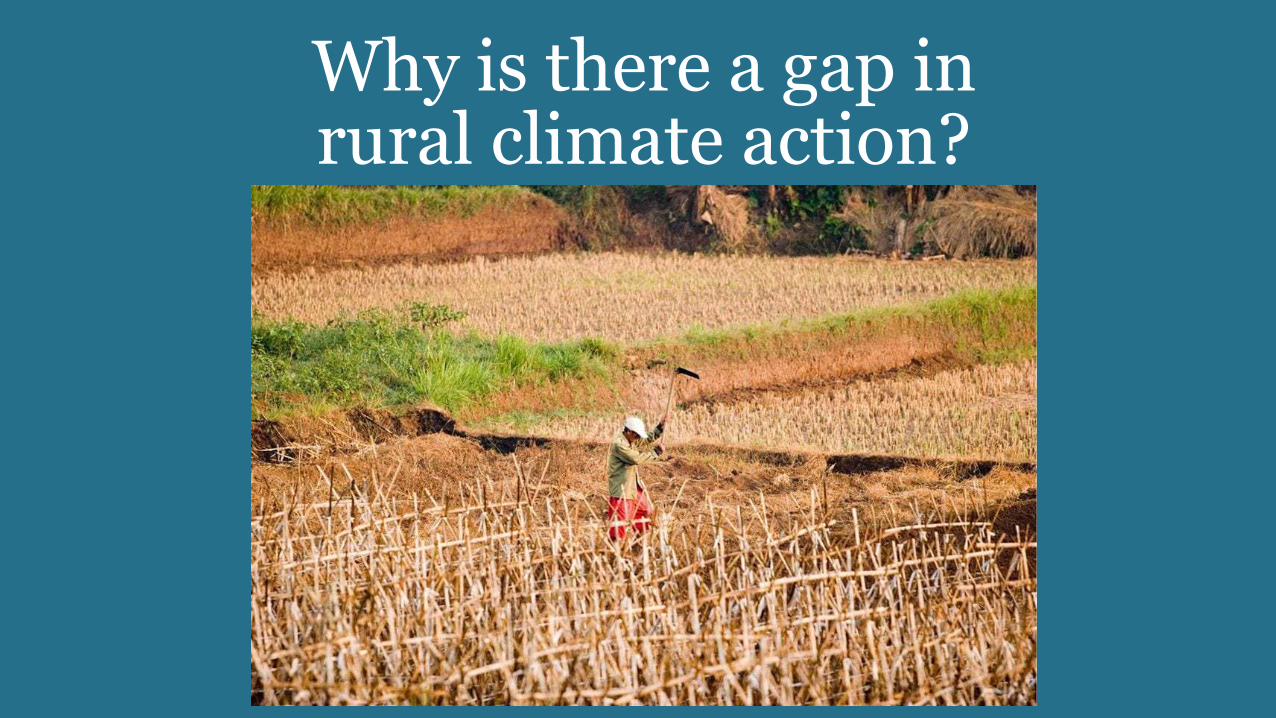
Why is there a gap in rural climate action?

Challenge One: Community Sentiment
Rural areas are concerned, but climate is not a high priority issue.
Why? • Distance from the coast • Disconnect from science
Challenge Two: Investment Capacity
With strained rural human and financial resources, there is little capacity to invest.
Why? • Socioeconomic issues • External Aid • Available Climate Solutions
Challenge Three: Gaps in Climate Literacy
Rural climate knowledge is lower concerning anthropogenic influences, climate models and
tools, and starting solutions.
Why? • Inaccessible resources • Uncertain local projections
Challenge Four: External Connections
and Coordination
Rural areas feel omitted from climate conversations.
Why? • Physical and Digital
Isolation• Mistrust of outsiders • Misperceptions of attitudes

What can you and your group do?
Thank You!
For more information or questions, you can contact me at [email protected].
Special thanks to Cynthia
Barnett, Bob Graham
Center for Public Service,
Florida Climate Institute,
and UF/IFAS Extension.


Octavio Guimaraes
COLORADO STATE UNIVERSITY
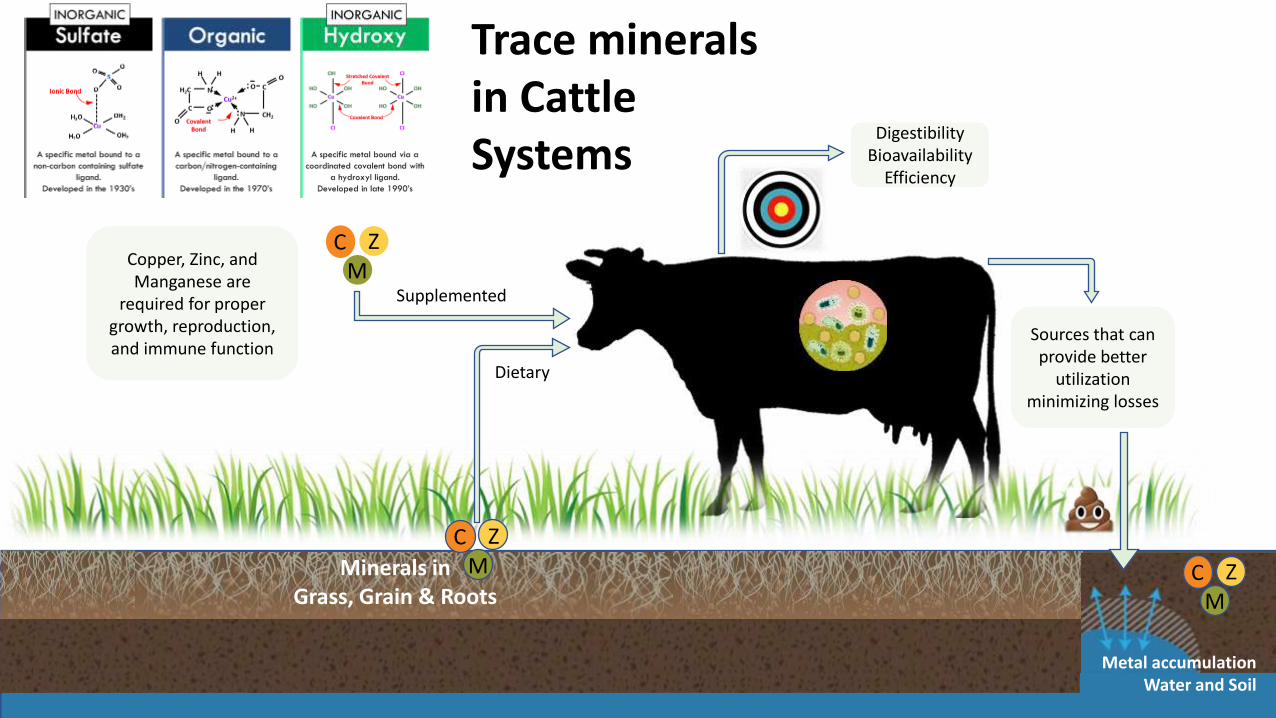
MZC
MZC
Minerals in Grass, Grain & Roots
Trace minerals in Cattle Systems
Dietary
Supplemented
MZC
Metal accumulation Water and Soil
Copper, Zinc, and Manganese are
required for proper growth, reproduction, and immune function
DigestibilityBioavailability
Efficiency
Sources that can provide better
utilization minimizing losses