CULINARY TOURISM AS A DESTINATION ATTRACTION: AN EMPIRICAL
188
CULINARY TOURISM AS A DESTINATION ATTRACTION: AN EMPIRICAL EXAMINATION OF THE DESTINATION’S FOOD IMAGE AND INFORMATION SOURCES By SHAHRIM AB KARIM Bachelor of Science in Hotel & Restaurant Management New York University New York City, New York 1994 Master of Business Administration Mara University of Technology Shah Alam, Malaysia 1999 Submitted to the Faculty of the Graduate College of the Oklahoma State University in partial fulfillment of the requirements for the Degree of DOCTOR OF PHILOSOPHY July, 2006
Transcript of CULINARY TOURISM AS A DESTINATION ATTRACTION: AN EMPIRICAL
CULINARY TOURISM AS A DESTINATION
ATTRACTION: AN EMPIRICAL EXAMINATION OF
THE DESTINATION’S FOOD IMAGE AND
INFORMATION SOURCES
By
SHAHRIM AB KARIM
Bachelor of Science in Hotel & Restaurant Management New York University
New York City, New York 1994
Master of Business Administration
Mara University of Technology Shah Alam, Malaysia
1999
Submitted to the Faculty of the Graduate College of the
Oklahoma State University in partial fulfillment of the
requirements for the Degree of
DOCTOR OF PHILOSOPHY July, 2006
CULINARY TOURISM AS A DESTINATION
ATTRACTION: AN EMPIRICAL EXAMINATION OF
THE ROLE OF THE DESTINATION’S FOOD IMAGE
AND INFORMATION SOURCES
Dissertation Approved:
Jerrold Leong Dissertation Advisor
Patrick Moreo
William Warde
Bill Ryan
A. Gordon Emslie Dean of the Graduate College
ii

ACKNOWLEDGEMENTS
First and foremost, I would like to thank god for giving me the opportunity to
complete this study successfully. I am totally blessed with HIS mercy and reward that
HE has bestowed throughout my life. Next, I would like to thanks my parents, Abdul
Karim Salim and Sharipah Yusop who have given me their endless support and
encouragement in achieving my goals. Also, to all my brothers and sister in Malaysia
who have provided their love and confidence in me and particularly to Hafiz Abdul
Karim.
This dissertation would have not been completed without the support of many
people who have been very kind to me. Their advise, guidance and patience have
enriched my experience in writing this dissertation. I would like to take this opportunity
to thank my dissertation chair and advisor, Dr. Jerrold Leong, who has been very
supportive and provided exemplary guidance and supervision to ensure that I complete
everything in a timely manner. I admired his persistence and patience in dealing with
students.
My sincere appreciation is extended to other members of my advisory committee:
Dr. Pat Moreo, Dr. Bill Warde and Dr. Bill Ryan, whose supervision, comments, ideas,
constructive criticism, and encouragement will always be remembered. Everyone in the
committee was very helpful and accommodating throughout my doctoral pursuit at
Oklahoma State University. I would also like to thank Dr. Qu Hailin, Dr. David Najite,
Dr. Christine Johnson, Dr. Beth Caniglia, Dr. Janice Miller, Dr. Michael Criss, Kelly
Way, Sharon Gallon, and Cheryl Lafave for being there when I needed their assistance.
There are also other friends and families that I would like to recognize in this
iii

endeavor. Their friendship and kindness were always granted to me: Allan and Muhrizah
Brunken, Bret and Nani Johnson, Vincent and Sherry Johns, Mahmet and Crystal
Baynay, Annmarie Nicely, Belinda Butler, Colette Johns, Victoria McLaurin, Marie
Basler, Shahrul Ahmad, Md. Nizam Mahat, Gina Cousin, Kimberly Williams, Dr.
Hamdin Salleh, Majed Nassar, Salleh Ashaghathra, Dr. Fahd Eissa, Dr.Mohammad Al-
Ahmadi, Lyn Putnam, Dr. Abdul Aziz Bagabas, Muhammad Elyyan, Abdullah Al-
Nassar, Abdul Aziz Al-Nassar, Fahd Al-Nassar and those who have provided me with
unforgettable memories. Also, I would like to acknowledge my sponsoring agency,
Public Service Department, Malaysia and Oklahoma State University, who partly
provided me with the tuition waiver and for giving me a lifetime opportunity.
Finally, I would like to dedicate this dissertation to my beloved brother, Ira
Irawan Abdul Karim who passed away in October, 2002. Surely, I have missed him a lot.
Hopefully, his soul is in paradise. Amen.
iv
TABLE OF CONTENTS
Chapter Page I. INTRODUCTION.....................................................................................................1
Overview..................................................................................................................1 The Relationship between Food and Tourism .........................................................2 Information Search and Information Sources ..........................................................5 Statement of the Problem.........................................................................................6 Objective of the Study .............................................................................................7 Research Question ...................................................................................................7 Research Hypotheses ...............................................................................................9 Significance of the Study .......................................................................................11 Definition of Terms................................................................................................12 Organization of the Study ......................................................................................13 II. REVIEW OF LITERATURE……………………………………………………..14 Introduction............................................................................................................14 The Historical Development of Gastronomy.........................................................14 The History of Eating Out......................................................................................16 Foodways (Food Habits)........................................................................................17 Food Identities .......................................................................................................19 Food as a Motivating Factor ..................................................................................23 Food and Tourism..................................................................................................25 Previous Research on Food and Tourism ..............................................................29 Destination Image ..................................................................................................34 Previous Research on Destination Image .............................................................40 Information Search and Information Sources ........................................................42 Theoretical Development of Information Search Behavior ..................................43 Previous Research on Information Search and Travelers .....................................48 Demographic Characteristics .................................................................................52 Summary ................................................................................................................54
v
III. METHODLOGY…………………………………………………………………56 Research Design.....................................................................................................56 The Conceptual Framework and Hypotheses ........................................................60 Target Population...................................................................................................61 Sampling Technique ..............................................................................................61 Survey Procedure ...................................................................................................62 Research Instrument...............................................................................................63 Validity and Reliability..........................................................................................65 Data Analysis .........................................................................................................66 IV. ANALYSIS AND RESULTS................................................................................68 Introduction............................................................................................................68 Response Rate........................................................................................................68 Focus Group Results ..............................................................................................71 Analysis of the Research Questions and Hypotheses ............................................76 Research Question One..........................................................................................77 Factor Analysis ............................................................................................77 Regression Analysis.....................................................................................79 Additional Comparison across Countries .............................................................81 Descriptive Statistics .............................................................................................81 France...........................................................................................................81 Italy ..............................................................................................................83 Thailand .......................................................................................................85 The Potential of Visit to France, Italy and Thailand....................................86 Overall Destination Profiles.........................................................................87 Factor Analysis ......................................................................................................89 France...........................................................................................................89 Italy ..............................................................................................................90 Thailand .......................................................................................................92 Overall Comparison across the Countries....................................................94 Regression Analysis................................................................................................95 France...........................................................................................................95 Italy ..............................................................................................................97 Thailand .....................................................................................................100 Overall Comparison across the Countries..................................................101 Research Question Two .........................................................................................102 Factor Analysis ..........................................................................................102 Regression Analysis...................................................................................103 Additional Comparison Across Countries .............................................................106 Descriptive Statistics..............................................................................................106
vi
France.........................................................................................................106 Italy ............................................................................................................107 Thailand .....................................................................................................108 The Importance of Information Sources across Countries ........................110 Overall Comparison across the Countries..................................................111 Factor Analysis .....................................................................................................112 France.........................................................................................................112 Italy ............................................................................................................113 Thailand .....................................................................................................114 Overall Comparison across the Countries..................................................115 Regression Analysis.............................................................................................116 France.........................................................................................................116 Italy ............................................................................................................119 Thailand .....................................................................................................120 Overall Comparison across the Countries..................................................123 Research Question Three ......................................................................................124 Research Question Four........................................................................................126 Summary of the Hypotheses Analysis ..................................................................129 V. DISCUSSION AND CONCLUSION..................................................................134 Introduction..........................................................................................................134 Summary of the Study .........................................................................................134 Discussion of the Hypotheses ..............................................................................136 Implications of the Research................................................................................142 Limitations of the Research .................................................................................144 Implications for Future Research.........................................................................146 Conclusion ...........................................................................................................147 REFERENCES ..........................................................................................................148 APPENDIX A: Focus Group Questions ....................................................................167 APPENDIX B: Survey Questionnaire .......................................................................169 APPENDIX C: IRB for Survey Research..................................................................172 APPENDIX D: IRB for Focus Group........................................................................174 APPENDIX D: Sample Groups .................................................................................176
vii
LIST OF TABLES
Table 1. Previous Research on Food and Wine Tourism............................................32 Table 2. Selected Definition of Destination Image.....................................................36 Table 3. Overall Response Rate..................................................................................69 Table 4. Demographic Portfolio of Respondents........................................................70 Table 5. Factors of Destinations’ Food Image............................................................78 Table 6. Model 1 - Summary of Destinations’ Food Image ......................................80 Table 7. Means Rating of France................................................................................83 Table 8. Means Rating of Italy ...................................................................................84 Table 9. Means Rating of Thailand.............................................................................86 Table 10. Descriptive Statistics of Potential Visits.....................................................87 Table 11. Descriptive Analysis across the Countries...................................................88 Table 12. Factors of France’s Food Image .................................................................89 Table 13. Factors of Italy’s Food Image.....................................................................91 Table 14. Factors of Thailand’s Food Image ..............................................................92 Table 15. Overall Factors Comparison across the Countries......................................94 Table 16. Model 1 – Summary for France..................................................................95 Table 17. Model 2 – Summary for France..................................................................96 Table 18. Model 1 – Summary for Italy .....................................................................98 Table 19. Model 2 – Summary for Italy .....................................................................99
viii
Table 20. Model 1 – Summary for Thailand.............................................................100 Table 21. Factors of Information Sources.................................................................102 Table 22. Model 1 – Summary for Information Sources ..........................................104 Table 23. Model 2 – Summary for Information Sources ..........................................105 Table 24. Mean Ratings for France Information Sources.........................................107 Table 25. Mean Ratings for Italy Information Sources ............................................108 Table 26. Mean Ratings for Thailand Information Sources .....................................109 Table 27. Mean Rating for the Importance of Information Sources across the Countries
..............................................................................................................................110 Table 28. Overall Comparison of Means Rating across the Countries.....................111 Table 29. Factors of France Information Sources....................................................112 Table 30. Factors of Italy Information Sources .......................................................113 Table 31. Factors of Thailand Information Sources ................................................114 Table 32. Factors of Information Sources Comparison across the Countries..........115 Table 33. Model 1- Summary for France.................................................................117 Table 34. Model 2 - Summary for France................................................................118 Table 35. Model 1 – Summary for Italy ..................................................................119 Table 36. Model 1 – Summary for Thailand............................................................121 Table 37. Model 2 – Summary for Thailand............................................................122 Table 38. Regression Analysis of Gender, the Importance of Information Sources
(Factor 1) on Intention to Visit ............................................................................127 Table 39. Regression Analysis of Education, the Importance of Information Sources
ix
( Factor 1) on Intention to Visit .................................................................................127 Table 40. Regression Analysis of Education, the Importance of Information Source ( Factor 2) on the Intention to Visit ...........................................................................128 Table 41. Regression Analysis of Gender, the Importance of Information Sources ( Factor 2) on the Intention to Visit ...........................................................................128
x
LIST OF FIGURES
Figure 1. Conceptual Model of the Study.....................................................................8 Figure 2. Hypothetical Model of the Study ..................................................................9 Figure 3. Three waves of Food Change in the Industrial Society...............................22 Figure 4. Supply Components of Wine and Culinary Tourism System .....................26 Figure 5. Relating Consumption and Production in Gastronomy Tourism Experience ................................................................................................................................28 Figure 6. The Most Common Attributes Used in Image Studies................................37 Figure 7. Model of Information Processing................................................................45 Figure 8. Research Framework ...................................................................................59 Figure 9. Conceptual Framework ...............................................................................60
xi
CHAPTER I
INTRODUCTION
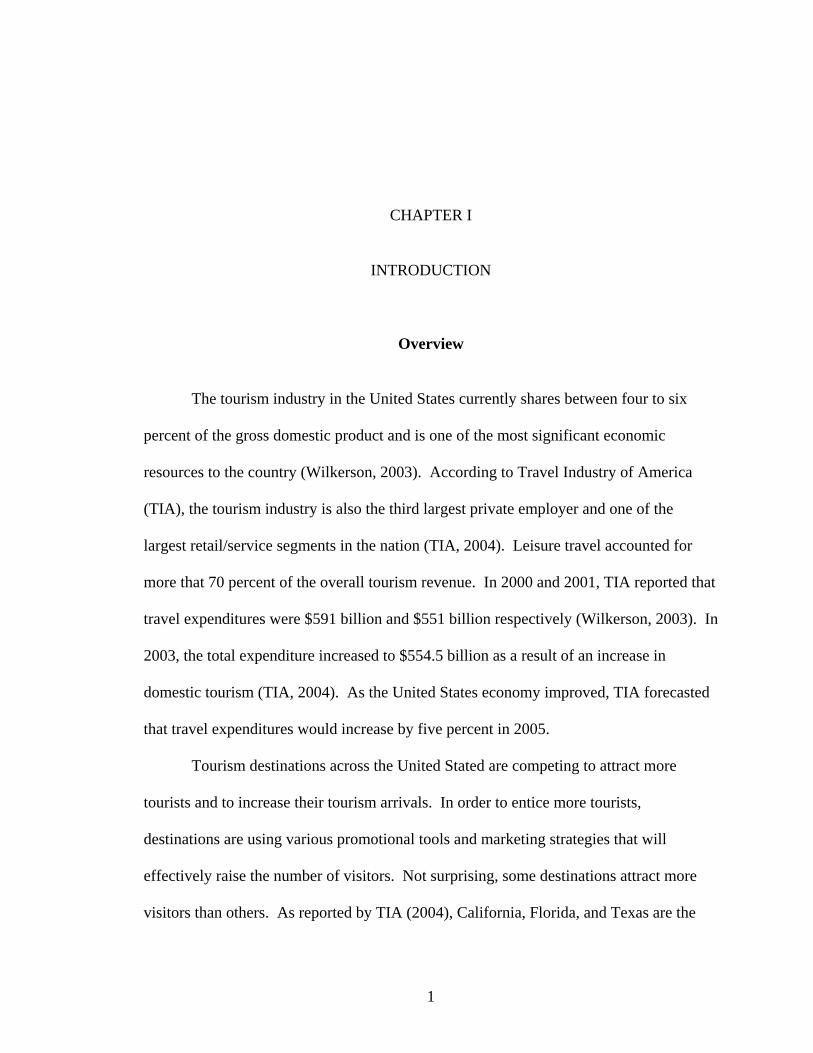
Overview
The tourism industry in the United States currently shares between four to six
percent of the gross domestic product and is one of the most significant economic
resources to the country (Wilkerson, 2003). According to Travel Industry of America
(TIA), the tourism industry is also the third largest private employer and one of the
largest retail/service segments in the nation (TIA, 2004). Leisure travel accounted for
more that 70 percent of the overall tourism revenue. In 2000 and 2001, TIA reported that
travel expenditures were $591 billion and $551 billion respectively (Wilkerson, 2003). In
2003, the total expenditure increased to $554.5 billion as a result of an increase in
domestic tourism (TIA, 2004). As the United States economy improved, TIA forecasted
that travel expenditures would increase by five percent in 2005.
Tourism destinations across the United Stated are competing to attract more
tourists and to increase their tourism arrivals. In order to entice more tourists,
destinations are using various promotional tools and marketing strategies that will
effectively raise the number of visitors. Not surprising, some destinations attract more
visitors than others. As reported by TIA (2004), California, Florida, and Texas are the
1
top three destinations in the United States. Destinations that can offer attractive and
highly desirable products draw more tourists.
The Relationship between Food and Tourism
Recent research has shown that tourists spend almost 40% of their budget on food
when traveling (Boyne, Williams, & Hall, 2002). The 2004 Restaurant & Foodservice
Market Research Handbook states that 50% of restaurants’ revenue was generated by
travelers (Graziani, 2003). It shows that there is a symbiotic relationship between food
and the tourism industry. More importantly, food has been recognized as an effective
promotional and positioning tool of a destination (Hjalager & Richards, 2002). Similarly,
with increasing interest in local cuisine, more destinations are focusing on food as their
core tourism product. For example, France, Italy, and Thailand have been known for
their cuisine.
Even though it is becoming a crucial segment of the tourism industry, culinary
tourism is an area that has not been studied by many researchers (Hjalager & Corigliano,
2000). The term “culinary tourism” was developed by Lucy Long in 1998 (Wolf, 2002).
Long (2004) defined culinary tourism as experiencing and participating in the foodways
of other people which include but are not limited to consumption, preparation, and
presentation of food items. Long (2004) emphasized that savoring the food of others is
the way which one can really experience and accept different culture without reluctance.
The importance of the connection between food and tourism cannot be ignored.
Each destination has different levels of attractiveness that can draw tourists from different
2
countries (Au & Law, 2002). Authentic and interesting food can attract visitors to a
destination. Using Getz and Brown’s (2006) application and definition of wine tourism,
we can say that culinary tourism can be associated with travelers’ interest in the food of a
destination. On the other hand, the destination will use food as the main attraction and
will develop marketing strategies that will focus on the food. It is important for
marketers of a culinary destination to know the image currently held by its targeted
customers and how to affect their intention to visit through effective marketing strategies.
Frochot (2003) recommended food images can be utilized to exhibit the cultural aspects
of a country. As such, destinations can use food to represent its “cultural experience,
status, cultural identity, and communicating” (p.82).
Further, Hobsbawn & Ranger (1983) argued that cuisines that are highly known
for their taste and quality can be developed into tourist products. For example, Italian
cuisine and wine has boosted the Italian tourism industry (Hjalager & Corigliano, 2000).
According to Riley (2000), the association of national cuisine and tourism depends on the
role of the cuisine in the social culture that creates the national identity. Thus, a
destination can use its cuisine as a marketing strategy.
Jones and Jenkins (2002) recommended that food is not only a basic need for
tourists, but also a cultural element that can positively present a destination. Given that
food can be used to project the identity and culture of a destination, food consumption
can be used in the development of a destination image (Quan & Wang, 2004). In
addition, food consumption also contributes to the economy of a destination, and
provides tourists with a local experience. Hong Kong tourist arrivals were increasing
because of the growing number of restaurants that offer many varieties of cuisines (Au &
3
Law, 2002). A major reason people travel to Hong Kong is to experience and taste the
food.
Culinary or gastronomical activities of a destination also are categorized as part of
cultural tourism. Richards (1996) claimed that cultural tourism may include experiencing
the cultural attractions as well as sampling the local food. Kim (1998) stated that cultural
determinants are important aspects of demand for tourism worldwide. Cultural tourists
are generally interested in the products and culture of a particular destination as well as
experiencing and learning about the culture (Richards, 1996).
It is well known that food plays a key role in attracting tourists to a certain
destination because of its reflection of a region’s culture and lifestyle. Food and wine
tourism is steadily growing and highly demanded in today’s marketplace (Corigliano,
2002). Many researchers have shown that cuisine has a great impact on travelers’
decisions when choosing their vacation destination. Moreover, it has been reported that
the cuisine of a country can showcase its cultural or national identity (Rand, Heath, &
Alberts, 2003). For example, the image of France has always been associated with its
food and wine (Frochot, 2003). Likewise, the strength of people’s desire to visit Italy is
largely due to its cuisine (Boyne, Williams, & Hall, 2002). Corigliano (2002) argued the
success of Italian gastronomy is predominantly attributed to the assimilation of its
gastronomy into its national identity. Food is blended in the Italian culture and connected
to the lifestyle of its people, and these have confirmed the importance of linking food and
tourism.
Quan and Wang (2004) noted that food can convey unique experience and
enjoyment to travelers. Specifically, food may totally enhance tourists’ experience and
4
can be the most memorable part of the trip. Thus, the food of a destination can be used to
represent the image and distinctiveness of the destination. Therefore, identifying and
positioning a specific product for the market is highly desirable in developing a potential
image. Culinary tourism is not only appealing to tourists, but also contributes to the
social, economic and environmental development of a destination (Corigliano, 2002).
Furthermore, the author stated those regions that can offer and take advantage of
their food and wine and position them as a premier tourism product will benefit highly as
the value of their destinations increase. Although food continues to be a highly
significant aspect of the tourism industry, the industry has not been able to attract many
researchers in this field (Tefler & Wall, 1996).
Information Search and Information Sources
The next intention of this study seeks to explore the effects of information sources
on travelers’ intentions to visit culinary destinations. In today’s competitive global
environment, knowing customers’ behavior on the importance of different types of
information sources might be significant for marketers and policy makers (Srinivas,
1990; Wilkie & Dickson, 1985). In addition, if marketers want to market their product
effectively, they should know how, what and where to communicate the message they
want to convey. In this regard, the types of information sources chosen by customers will
be an important strategy that should be used by marketers. Wilkie and Dickson (1985)
stated that “Information search represents the primary stage at which marketing can
provide information and influence customers’ decisions” (p.85). In summary,
5
understanding how customers search and use the information may significantly impact
marketers in today’s information age.
Statement of Problem
In general, the tourism industry has many facets such as, ecotourism, ethnic,
cultural, tourism, sports, sex, health, and others. All these types of tourism produce
different kinds of experiences (Long, 2004).
One of the central functions of the tourism industry is to provide food
experiences. Culinary tourism, food tourism or gastronomy tourism are related to food
and eating experiences that occur when people travel. Additionally, during a trip or
vacation, some travelers might look for types of food similar to those that they eat at
home. In contrast, there will be travelers who might be passionate to try foods of other
cultures or those who are curious about different foods. What are the underlying factors
that can draw travelers who are interested to taste different foods?
The relationship between food and tourism seems paradoxical. There are many
different perceptions on food. For example, food can act in many different roles, from
satisfying basic needs (Maslow, 1954), social and cultural needs (Long, 2004), social
status needs (Richards, 2002), aesthetic experience (Long, 2004), and other roles. In
general, there are numerous experiences that can be associated with eating.
Long (2004) argued that very few studies have been written in relation to food
and the activities associated with food, that might affect travelers’ experience and the
ways in which tourism might influence the foodways of a particular culture, community,
6
or individuals. In addition, there is no research that has examined the role of food in
tourism in regard to destinations’ image and information sources.
The purpose of this study is to examine the role of destinations’ food image,
information sources, and demographic profiles on the travelers’ intention to visit a
culinary destination.
Objectives of the Study
There were three objectives of the study:
1. Explain the relationship between a destination’s food image and the travelers’
intention to visit.
2. Examine the influence that sources of information have on travelers’ intention to visit
a culinary destination.
3. Identify the moderating effect of demographic characteristics on: a) the relationship
between a destination’s food image and the travelers’ intention to visit, b) the relationship
between information sources and the travelers’ intention to visit.
Research Questions
In this study, four research questions were investigated.
1. What is the relationship between a destination’s food image and the travelers’
intention to visit?
7
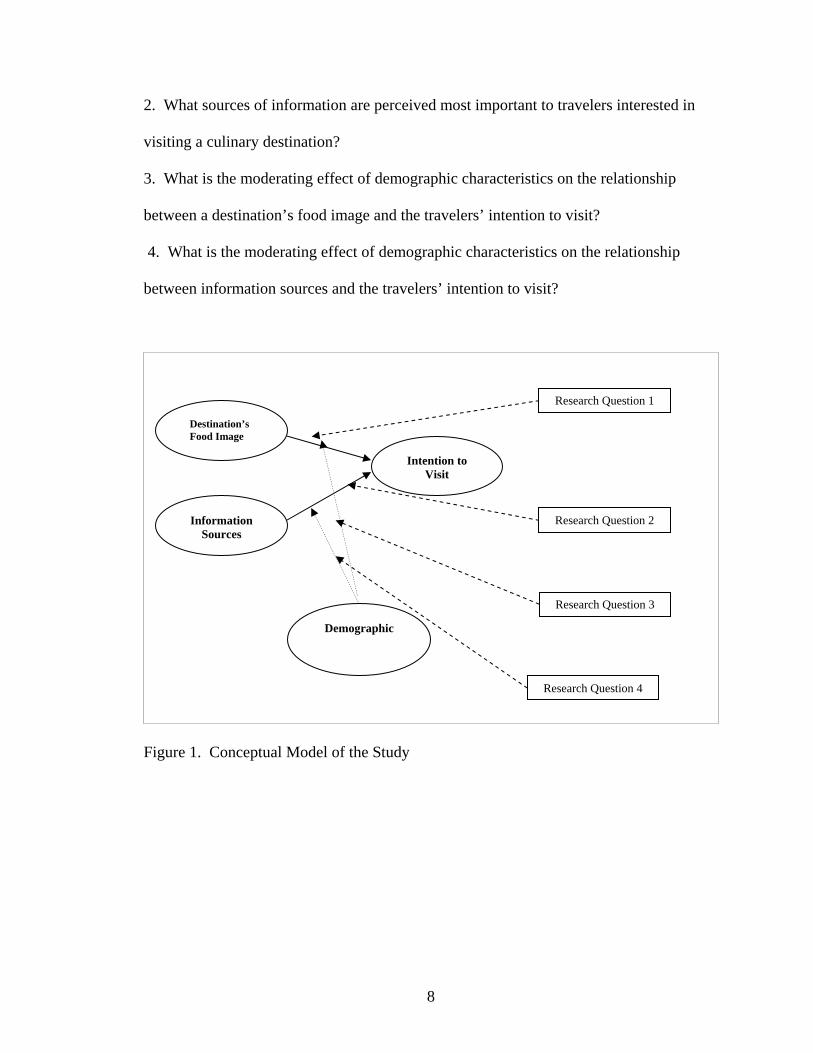
2. What sources of information are perceived most important to travelers interested in
visiting a culinary destination?
3. What is the moderating effect of demographic characteristics on the relationship
between a destination’s food image and the travelers’ intention to visit?
4. What is the moderating effect of demographic characteristics on the relationship between information sources and the travelers’ intention to visit?
Information Sources
Intention to Visit
Destination’s Food Image
Demographic
Research Question 4
Research Question 3
Information Sources
Intention to Visit
Destination’s Food Image
Research Question 1
Research Question 2
Demographic
Figure 1. Conceptual Model of the Study
8
Research Hypothesis
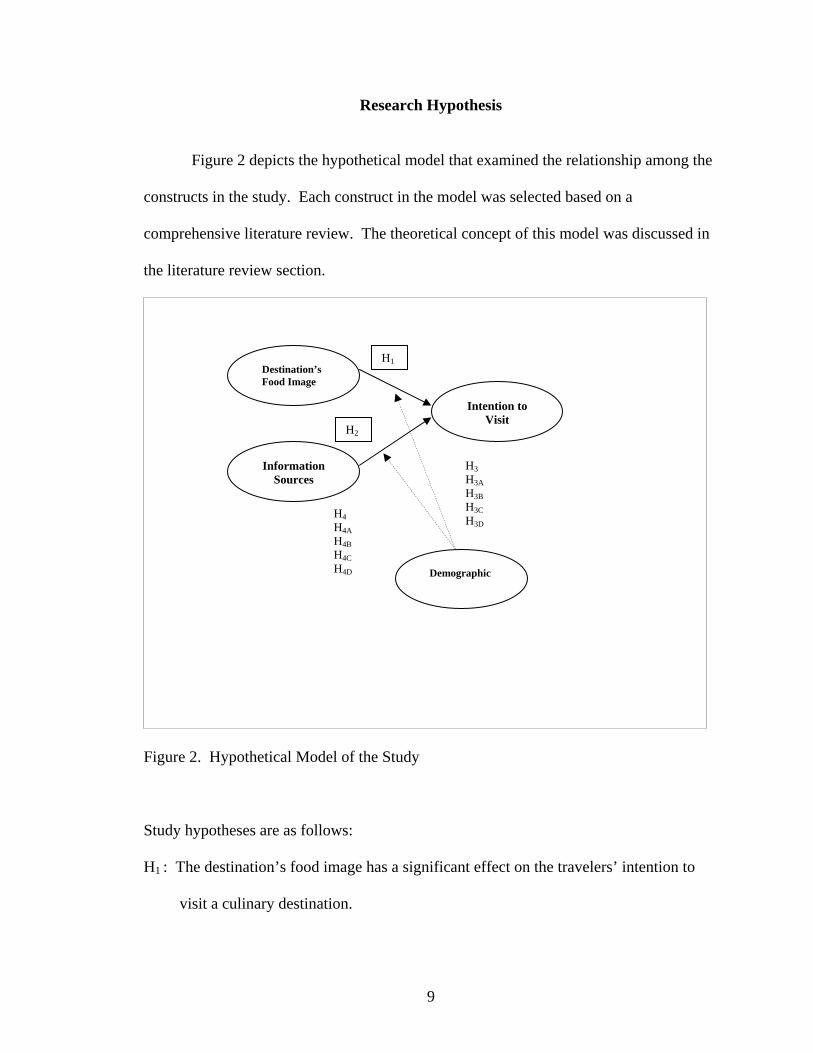
Figure 2 depicts the hypothetical model that examined the relationship among the
constructs in the study. Each construct in the model was selected based on a
comprehensive literature review. The theoretical concept of this model was discussed in
the literature review section.
Demographic
Information Sources
Intention to Visit
Destination’s Food Image
H2
H1
H4 H4A H4B H4C H4D
H3 H3A H3B H3C H3D
Figure 2. Hypothetical Model of the Study
Study hypotheses are as follows:
H1 : The destination’s food image has a significant effect on the travelers’ intention to
visit a culinary destination.
9
H2 : The type of information source has a significant effect toward the travelers’
intention to visit a culinary destination.
The literature revealed that demographic characteristics have a moderating effect on
travelers’ perception on the destination’s food image and information sources. Therefore
we would like to test the moderating effect in this study:
H3 : Travelers’ demographic characteristics will significantly moderate the relationship
between a destination’s food image and intention to visit.
H3A : Gender has a significant effect on the relationship between a destination’s
food image and the travelers’ intention to visit.
H3B : Age has a significant effect on the relationship between a destination’s
food image and the travelers’ intention to visit.
H3C : Educational background has a significant effect on the relationship
between a destination’s food image and the travelers’ intention to visit.
H3D : Income has a significant effect on the relationship between a destination’s
food image and the travelers’ intention to visit.
H4 : Travelers’ demographic characteristics will significantly moderate the relationship
between information sources and intention to visit.
H4A : Gender has a significant effect on the relationship between information
sources and the travelers’ intention to visit.
H4B : Age has a significant effect on the relationship between information
sources and the travelers’ intention to visit.
10
H4C : Educational background has a significant effect on the relationship between
information sources and the travelers’ intention to visit.
H4D : Income has a significant effect on the relationship between information
sources and the travelers’ intention to visit.
Significance of the Study
The study focused on analyzing travelers’ interest in culinary tourism and those
factors which influenced their choice of a food/culinary destination. Since very few
studies have been reported in this particular area, this research made two major
contributions to the hospitality and tourism literature. First, the theoretical contribution
of this study enriched the body of knowledge in culinary tourism. As such, this study
sought to characterize the profile of travelers interested in culinary tourism and add to the
existing knowledge by improving the understanding of travelers’ behavior which includes
sources of information, destination image, and demographic profiles associated with
culinary tourism. Second, the managerial contribution of the study supports and assists
the hospitality and tourism managers in planning a comprehensive strategic marketing
plan focused on targeting the culinary tourism market. In addition, this study provides
invaluable information that assists managers in planning and utilizing tourism resources
more efficiently.
11
Definition of Terms
Culinary Tourism: The intentional, exploratory participation in the foodways of an
other – participation including the consumption, preparation, and presentation of a food
item, cuisine, meal system, or eating style considered to a culinary system not one’s own
(Long, 2004).
Foodways: The network of behaviors, traditions, and beliefs concerning food, and
involves all the activities surrounding a food item and its consumption, including the
procurement, preservation, preparation, presentation, and performance of the food
(Yoder, 1972).
Destination Image: Is the sum of one’s beliefs, ideas, and impressions of a destination
(Crompton, 1979).
Tourist: A temporarily leisured person who voluntarily visits a place away from home
for the purpose of experiencing a change (MacCannell, 1976).
Information search: The motivation activation of knowledge stored in memory or
acquisition of information from the environment (Engel, Blackwell, & Miniard, 1995).
12
Organization of the Study
Chapter 1 presented a general introduction of the study and included background
information of the study. The statement of problem, objectives of the study, research
questions, conceptual model, and hypothesis were discussed in this section. In Chapter 2,
an evaluation of the literature review was conducted based on the conceptual model of
the study. Chapter 3 summarized the research designed, methodology, and analysis that
were used in this paper. In addition, the population, sampling technique, survey
procedure, research instrument, and validity and reliability were presented. Chapter 4
discussed the results of the data analysis and hypotheses testing. Demographic profiles
of the participants and descriptive statistics were illustrated. Chapter 5 presented a
summary and discussion of the findings. The theoretical and managerial contributions of
the findings were discussed. In addition, the limitations of the study were illustrated in
this section. The chapter concluded with comments and recommendations for future
research.
13
CHAPTER II
REVIEW OF LITERATURE
Introduction
This chapter focused on the review of related literature in food and tourism with a
particular emphasis on the development related to foodservice, food, culinary and
tourists’ behavior in the travel and tourism industry. In addition, each of the theoretical
constructs used in the model of the study was reviewed for further clarification and
understanding. Those constructs were destination image, information sources, and
demographics.
The Historical Development of Gastronomy (Culinary)
The review of literature might not be adequate without covering the evolution and
history of gastronomy. Scarpato (2002) stated that the word “gastronomy” first emerged
in a poem published by Jacques Berchoux, a Frenchman in 1804. In the poem, Berchoux
described gastronomy as enjoying food and drink at the very best. Before then, the word
“gastronomy” had been ubiquitous and had been extremely difficult to define, because it
encompassed an extensive association with everything related to food, eat, and drink.
Finally, in 1835, the word gastronomy was included and defined in a French dictionary as
14
“the art of good eating.” However, Santich (1996), defined gastronomy as, “reflective
eating, which, however, it expands to reflective cooking and food preparation as well,
maintaining the association with excellence and/or fancy food and drink” (p. 115).
According to Scarparto (2002), after two centuries discovering of the word
gastronomy, Athenee, a Greek writer, began writing extensively about food and drink and
the lifestyles of past historians, poets and philosophers. Athenee wrote at length about
how food and drink were celebrated in those days. Also, many other authors from the
Greek and Roman Empire were writing just about cookery in general, but not focusing on
gastronomy itself.
Similarly, the Italians in the Middle-Ages explored and incorporated gastronomy
in all facets of life, from medicine to agriculture. Food was incorporated in the study of
medicine which relates to healthy living and good eating behaviors. Additionally,
Scarparto( 2002) stressed that those people who were involved in food and drinks in
ancient days, did not have any particular skills or professions that were directly related to
food and drinks, it was more about their involvement and enjoyment of food and drinks.
Basically, food was part of their lifestyle rather than a profession. Later, a French man,
Alexander Balthasar Laurent (1758-1837), who was a barrister and writer, associated
gastronomy with the bourgeois lifestyles. By 1920, the first gourmet literature was
published in France as a guideline to local foods for travelers, which function to promote
regional gastronomy tourism. In 1930, more information about gastronomy was included
in the “Guide Bleu Bords de Loire et Sud” (Csergo, 1996).
Today, food carries on its multiple functions in social settings and has made its
way into the lifestyles and the cultures of people from every corner of the world.
15
Mennell, Murcott, and Van Otterloo, (1992), p.115 quoted that, “sharing food is held to
signify “togetherness,” an equivalence among a group that defines and reaffirms insiders
as socially similar.” Food related events comprise a wide array of eating and drinking
activities that bring people together for the enjoyment and sharing of food.
The History of Eating Out
Eating out is a social activity which involves the preparation of food by someone
else in a social establishment and it involves a social environment (Warde & Martens,
2000). The development of eating out began when people started traveling, engaged in
economic activities and military purposes. Most importantly, especially when people
were away from home, eating out was a crucial part of the journey and this contributed to
the development of commercial eating establishments.
In the fifteenth century, commercial establishments that offered food and lodging
began to flourish in England. According to Heal (1972), England became known for
hospitality businesses that catered to travelers. However, these commercial services were
made available only to people who were in transit. But by the end of eighteenth century,
an increase in the number of business activities had a major impact, furthering the
development of commercial food establishments. More cafes, hotels, and boarding
houses were developed in response to increase economic activities.
Warde and Martens (2000) stated that in the nineteenth century, hotels started
serving meals; however, these meals were served in people’s rooms and not in public
spaces. By the end of nineteenth century, eating out became more public, where anyone
16
who could afford to dine in public places was allowed to do so. In the twentieth century,
eating out had established itself as entertainment and pleasure, and became part of the
social lifestyle (Burnett, 1989).
Foodways (Food Habits)
Yoder (1972) defined foodways as “the network of behaviors, traditions, and
beliefs concerning food, and involves all the activities surrounding a food item and its
consumption, including the procurement, preservation, preparation, and performance of
that food” (p.8).
In other words, we also can associate foodways with food habits of a particular
society or individuals. Parsha & Khan (1992) suggested that socio-economic and cultural
factors might influence individuals toward liking a particular type of food. However,
Wenkman (1969) argued that food habits can be linked to individuals’ nutritional intake.
Individuals tend to seek food based on their needs and wants. Kittler & Sucher (1989)
commented that today’s food habits are not just selecting nutrient intake, but are more
complex. According to him, it comprised of the following: (1) culture, (2) religion, (3)
ethnicity, and (4) geographical area. McIntosh (1995) recommended that food habits,
originating from one’s culture, is normally governed by environmental factors and
influenced by their social, cultural and religious background.
The relationship between food habits and religion has been documented by many
researchers (Kilara & Iya, 1992; Kittler & Sucher, 1989; Tannahill, 1988). Most
religious beliefs have their own interpretation or guidelines when it comes to food. For
17
example, persons of Muslim and Jewish faiths do not eat pork. This might affect their
food habits when they travel. These groups of travelers will choose restaurants that are
free from pork or other food items that are prohibited in their religion. Similarly, the
cultural values of certain groups of people influence the tourism activities of a
destination. For example, the food of a destination could be a major reason for travelers
to visit that area.
As such, the application of tourism could be the best way to further enhance the
role of food to market a destination. Reynolds (1993) hypothesized that the food and
drink of a group of people might be used to understand the social and economic lifestyle
of a destination or a country. He further stressed that food is the most inexpensive source
of “authentic” products that can be consumed by travelers in comparison to other forms
of “authentic” products such as artifacts or paintings which could be more expensive to
consume. In particular, travelers have always been in search for something that is
authentic. For example, lobster in Maine has been well known for its popularity and has
become a regional icon. Other destinations, like Louisiana and Michigan have their
unique food that can be used as a marketing tool to attract people to visit. As more and
more people in the United States and around the world are involved in traveling, people
become more familiar with others’ culture and disregard their differences (Lowenburg,
Todhunter, Wilson, Savage & Lubawski, 1979). Furthermore, the authors mentioned that
people’s cultural background not only influenced their food habits, but also the number of
meals per day, and the table manners of a society.
18
Food Identities
Beardsworth and Keil (1997) argued that nutrient intake was not the only function
of eating, but it also included the experience of tasting food and the significance of
interacting with other people during a meal, especially when the foods represent a
symbolic meaning in an event. For example, the usage of food in special occasions and
festivals might represent a cultural and spiritual identity of a particular culture. The role
of food also could be associated with status and social class of individuals. Food like
“caviar beluga” is typically associated with high taste and high society. In contrast,
foods like beans and nuts are considered as the poor man’s diet.
Lowenberg (1970) applied Maslow’s theory into food consumption behavior which
can be classified as satisfying one’s basic needs to self actualization needs. The
application is explained as follows:
1. Physical needs for survival: the basic elements of food intake related to bodily
needs.
2. Social needs for security: when basic needs are fulfilled, future requirements
will be determined which are directly related to storage of food for security
purposes.
3. Belongingness: the relationship of eating and social settings, using food as a
medium for interaction and signifying cultural identity. For example,
different cultures have different types of cuisine that represent the uniqueness
of the culture.
19
4. Status: where, what and with whom you eat also can determine the status of
an individual. For example, eating caviar has always been associated as a
luxury food that is fit for the upper class or the rich and famous.
5. Self- realization: it occurs when other levels have been achieved and an
individual might be motivated to experience other food from other culture.
Basically, food serves multiple functions in satisfying human needs. These
functions motivate our eating behavior. In the United States, people are not just eating to
satisfy their basic psychological needs, but are also eating foods that appeal to them
( Lowenberg, Todhunter, Wilson, Savage, & Lubawski, 1979). Similarly, Hall and
Mitchell (2000) found that food is not only for the purpose of eating, but has other
complex meaning such as personal identity, traditions, production, consumption, and
sustainability. Not only that, food has been recognized as an important tool in the
tourism industry and has been used in commercials to showcase products of restaurant,
hotels and destinations.
Ryan (1997) and Smith (1991) proved that food had an impact on the travelers’
level of satisfaction with the trip. A study by Rimmington and Yuskel (1998) found that
the major reason travelers revisited Turkey was for its cuisine. In addition, the authors
found that food was the fourth factor that would contribute to travelers overall
satisfaction. Hu and Ritchie (1993) stressed that food was the fourth factor or the reason
to visit after weather, accommodation, and scenery. In general, it seemed that food
significantly contributed to the travelers’ overall impression of and satisfaction with a
destination.
20
Further, Hall & Mitchell (2000) stated three major waves in the development of
food and cuisines (see Figure 3). The first wave started in the 1400’s and made its way to
the 1800’s. The food in that period was brought from Asia and the new world
(Americas) to be traded in Europe. In contrast, in the second wave which took place
from the 17the century to the 20th century, there was a lot of movement of people from
Europe to the Americas. As part of the relocation process, people brought food and their
culture to the new world. Finally, the third wave, as we progressed along the information
superhighway and as the world has become a global village, has changed how
information about food is shared with people from around the world which somehow
alters peoples’ behavior toward food. In short, the globalization of food has affected
people’s eating behavior, for example “McDonalds” has been a common phenomenon in
every country and city worldwide (Hall & Mitchell, 2000).
21
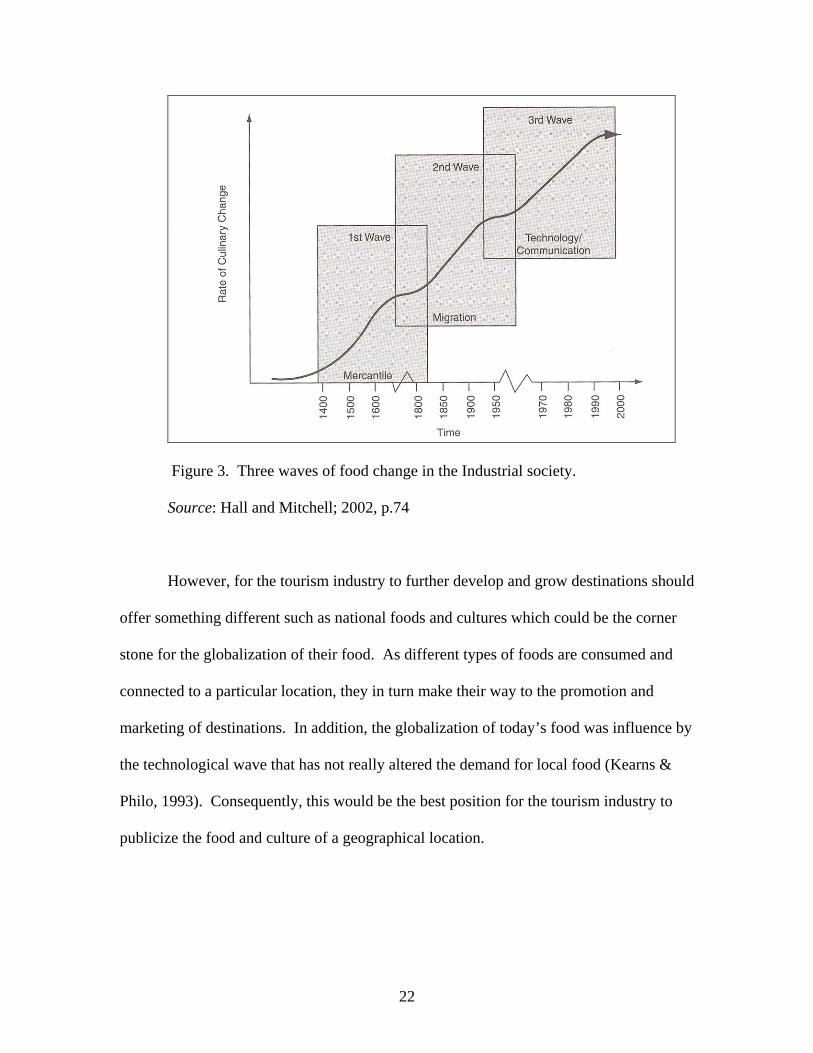
Figure 3. Three waves of food change in the Industrial society.
Source: Hall and Mitchell; 2002, p.74
However, for the tourism industry to further develop and grow destinations should
offer something different such as national foods and cultures which could be the corner
stone for the globalization of their food. As different types of foods are consumed and
connected to a particular location, they in turn make their way to the promotion and
marketing of destinations. In addition, the globalization of today’s food was influence by
the technological wave that has not really altered the demand for local food (Kearns &
Philo, 1993). Consequently, this would be the best position for the tourism industry to
publicize the food and culture of a geographical location.
22
Food as a Motivating Factor
Fields (2002) argued that people travel for many reasons. For the purpose of
explaining traveling for food motivations, the author adopted a motivation typology
developed by McIntosh (1995). There were four main categories in this typology: (1)
physical motivators, (2) cultural motivators, (3) interpersonal motivators, and (4) status
and prestige motivators.
Physical motivators were related to tourists’ real experiences during the trip. For
example, tourists experienced the cuisine through sampling of the food, looking at
attractive food presentation and smelling the aroma of the food. These phenomenons
would provide a new experience to the tourist that cannot be encountered in a typical
day-to-day life. In general, the tourists were able to experience a unique and novel type
of opportunity. Similarly, tourists might also be motivated by health reasons, such as
visiting countries that offer healthy diet; for example the food of Greece and Italy or “the
Mediterranean Diet.” This cuisine emphasizes healthy eating that might attract those
who want to lose weight.
In terms of cultural motivators, there seemed to be a strong relationship between
food and culture (Reynolds, 1993). Tourists may be interested in learning about new
cultures and lifestyles of the people at the destination. The easiest way to experience
another culture is through its food. Some tourists travel to a destination just to savor the
traditional or authentic cuisine that might not be available in other places. Another
example might be tourists looking for special food ingredients. All these could be
important satisfaction factors when traveling.
23
Food and tourism can also be interpersonal motivators. As such, eating a meal
during a vacation might be an important factor for a tourist. For example, this would be
the best time for them to socialize with other members of the family if they were on a
family vacation. It can help to increase one’s relations with someone who had been away
from the family. Hjalager (2002) stressed that the surrounding atmosphere and
socializing with group members were an important part of the overall dining experience.
During the vacation, one would have more leisure time and could possibly spend more
time together with family and friends and could help build good relationships. Some
hotels used food as a way for their guests to meet other people in the hotels (Fields,
2002).
Finally, status and prestige had always been the main motivations for people to
travel to a destination. For example, destinations such as Tuscany and Provencal offer
impeccable cuisines which might be reasons for people to visit. Having dinner in an up-
scale restaurant would be an important factor that could be associated with one’s status
and lifestyle (Fields, 2002).
24
Food and Tourism
Definition and Conceptualization
At present there is a growing demand in food and wine tourism and it is
becoming a crucial sector of the travel and tourism industry (Santich, 2004).
Nevertheless, the popularity of food and wine tourism has been recognized for a few
decades. According to Pomero (2005), in Australia and Canada, culinary tourism
generated $1 billion annually and may generate $7.2 billion by 2010. In addition, more
and more countries are starting to recognize the potential of culinary tourism. For
example, Scarpato (2002) stated that in Singapore, the government developed a “New
Asia-Singapore Cuisine” marketing effort in order to attract visitors to savor its cuisine
which attempted to combine the flavor of east and west cuisines. In addition, Singapore
started to organize its first Singapore Food Festival and the World Gourmet Summit in
1997, and it is being organized bi-annually. Singapore is working hard to develop its
food and wine image and is becoming a premier food destination in Asia.
Food and wine tourism can be called gastronomic tourism or culinary tourism
interchangeably. Hall and Mitchell (2001) defined food tourism as, “visitation to primary
and secondary food producers, food festivals, restaurants and specific locations for
which food and tasting and/ or experiencing the attributes of a specialist food production
region are the primary motivating factors for travel” (p. 308). Henderson (2004)
emphasized that marketers have been using food by itself or food and drink as a
promotional tool and argued that food and destination have been the prominent products
for travelers in shaping their overall experience.
25
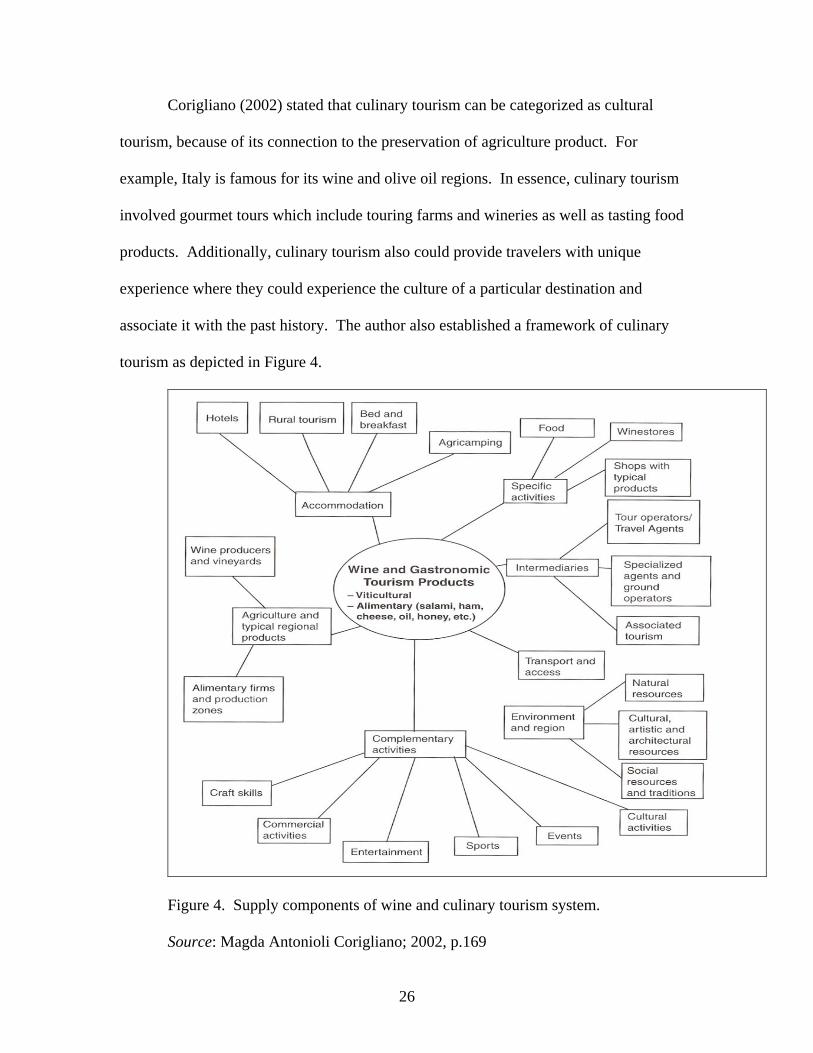
Corigliano (2002) stated that culinary tourism can be categorized as cultural
tourism, because of its connection to the preservation of agriculture product. For
example, Italy is famous for its wine and olive oil regions. In essence, culinary tourism
involved gourmet tours which include touring farms and wineries as well as tasting food
products. Additionally, culinary tourism also could provide travelers with unique
experience where they could experience the culture of a particular destination and
associate it with the past history. The author also established a framework of culinary
tourism as depicted in Figure 4.
Figure 4. Supply components of wine and culinary tourism system.
Source: Magda Antonioli Corigliano; 2002, p.169
26
Moreover, according to Hall and Mitchell (2001) in general, food can be divided
into four major categories: (1) a component of the local culture that can be offered for
tourism, (2) a tourism promotional tool, (3) development of local produce as income
generator or economic impact, and (4) food affected by the local consumption patterns
and ways its preferred by travelers.
Henderson (2004) discussed that food functions were not limited to the fulfillment
of one’s biological and hedonic needs, but also to other psychological and social
interactions. Moreover, travelers away from home might be in search of local delicacies
upon their return which could boost their esteem and prestige. On the other hand,
Hegarty and O’Mahony (1999) described food as a form of cultural expression.
Gastronomy or culinary tourism refers to a visit or travel that is motivated by an
interest in food and drinks. Thus, the main motivations for people to travel are to
experience and taste the food and drinks that can provide a lasting memory in their
lifetime (Wolf, 2002). According to Wolf, in general, travelers would spend more money
when they are away from home. However, for culinary travelers, they would look for a
unique and different experience during their trip (Richards, 2002). Likewise, as the
culinary tourism grows, more food related products such as food and wine routes,
literature on food and travel, and travel packages related to food will emerge as it
becomes an essential experience for travelers (Wolf, 2002). Additionally, culinary
tourism is not only associated with eating and drinking, but also events ranging from food
festivals to farm visits (Canadian Tourism Commission, 2002).
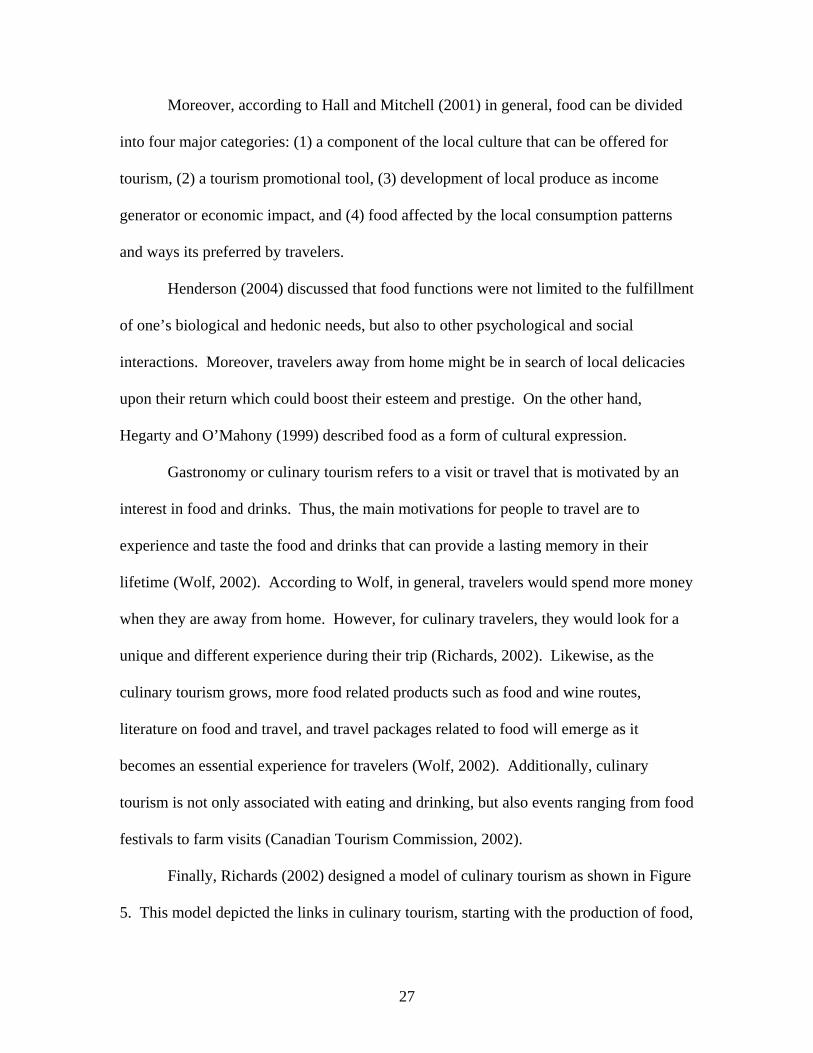
Finally, Richards (2002) designed a model of culinary tourism as shown in Figure
5. This model depicted the links in culinary tourism, starting with the production of food,
27
consumption, and experiences. In summary, the figure represents a network of culinary
tourism which begins at the farm or vineyard and ends at the restaurants that might
determine the “quality of experience.”
Figure 5. Relating consumption and production in gastronomy tourism experience.
Source: Greg Richards; 2002, p19.
28
Previous Research on Food and Tourism
Nield, Kozak, and LeGrays (2000) examined the role of foodservice and tourist
satisfaction in Romania. Travelers from eastern and western Europe and Romania were
selected as the sample of the research. The study revealed that there were differences in
tourists’ perceptions on the attributes of foods such as: price, quality of food and service,
variety of dishes, food presentation, and the speed of service. However, the most
important attributes that were found to affect tourists’ satisfaction were food quality,
value for money, varieties of dishes, atmosphere, and food presentation. The findings
also indicated that different tourist groups had different perceptions of satisfaction. The
needs and wants of international travelers were totally different and restaurant marketers
have to consider this implication when offering foodservice products.
Quan and Wang (2004) examined tourist food experience by analyzing their food
consumption. Specifically, the focus was to develop a conceptual model by integrating
the experience into the food consumption patterns of travelers. Hence, the main objective
was to determine the relationship between food consumption and tourist experience.
According to the authors, food consumption could generate tourists’ peak experience,
which might be used to promote a destination. Four recommendations were provided in
order to develop food as a destination attraction. First, rural areas could be promoted by
projecting the gastronomy of the areas. Second, destinations with plenty of food products
could be turned into major tourist attractions. Third, the food of a destination can be part
of a larger tourism event. Fourth, food or culinary tourism can be used to enhance
destination attractiveness.
29
Cohen and Avieli (2004) examined the perception of food as a key destination
attraction. The main focus of the study was to analyze the difference between attraction
and impediment. In particular, the authors were looking at two perspectives: first how
food could be an attractive product for a destination and second analyzing the barriers to
producing acceptable food products for tourists. This purpose was to evaluate how to
resolve these problems and the ways in which they affect the travelers’ food choice. For
example, some destinations faced problems in producing hygienic and nutritious food for
visitors.
Bessiere (1998) conducted a study on the relationships between rural tourism and
cultural heritage in France. According to the author, gastronomy had currently moved
eating to a different level that can influence peoples’ lifestyle. Furthermore, the eating
process can bring people to the yesteryear, enabling them to experience the lifestyles of
the past. In particular, gastronomy is the most important aspect of travel and tourism.
On the other hand, food can also be characterized as follows Bessiere (1998): “a symbol,
a sign of communion, a class marker, and as an emblem.” In general, food can be
associated with one’s culture and can also alter one’s normal habits. As an example,
people in the city tend to find new ways to satisfy their normal dietary need and tend to
look for “traditional food” or “back to nature” type of food. Similarly, traditional cuisine
is becoming the trend these days. In France, regional cuisines and country food are found
in up-scale restaurants. Bessiere (1998) re-emphasized that food is an essential factor in
developing tourism products, assimilation of the culture, and social activities of the
France’s rural tourist market.
30
Josiam, Mattson, and Sullivan (2004) investigated restaurants as historic
attractions and made a comparison with a traditional restaurant. Mickey’s dining car was
chosen as the main subject of the study. In today’s marketplace, a restaurant’s main
function is not only serving food, but also providing tourists with a unique experience.
These modifications seemed to be very important for the success of restaurants due to the
competitiveness of the restaurant industry. Without offering a unique atmosphere,
customers might choose restaurants that can provide a new eating experience. Similarly,
because of its uniqueness, Mickey’s Dining Car has successfully attracted a larger
consumer market, from day trippers to first time visitors. Additionally, Mickey’s not
only depends on its historical value, but also emphasizes on the quality of food, which
may affect the overall success of the restaurant, especially in the tourist market. It is also
recommended that tourism marketers draw attention to the ways in which restaurants can
contribute to the tourists’ experience when they travel.
Henderson (2000) discussed hawkers food and tourism in Singapore and its
reputation. Food prepared by food hawkers was popular in most South East Asian and
Middle Eastern countries, not only to locals but also to visitors. In Singapore, hawkers’
food was chosen as the most popular types of cuisine besides upscale restaurants.
Moreover, hawkers’ food was found to boost the experience of travelers who visited
Singapore. In general, hawkers’ food has been essential to the economic and cultural
lifestyle of most Singaporeans.
Henderson (2004) observed that Singapore and food were synonymous. In a
survey by the Singapore Tourism Board (STB, 2004) most Singaporean believed that
food was the number one attraction that enticed visitors to Singapore. Further, the STB
31
had been projecting Singapore’s food as the main promotional strategy of their marketing
plan. Singapore also has been hosting many annual food events as a main tool to lure
travelers to visit Singapore. The Singapore Food Festival and The World Gourmet
Summit were among the top festivals that showcased Singapore’s food and cultural
lifestyle which had gained international recognition (STB, 2002). The government also is
working very hard to increase the level of food hygiene and food preparation to ensure
that the food served is safe and fit for consumption by locals and international travelers
(STB, 2003). Not only that, Singapore also prepared a guide for Muslim dining that
would be important for Muslim’s travelers. In particular, Singapore is seriously making
food tourism one of their major products and a key reason for travelers to visit.
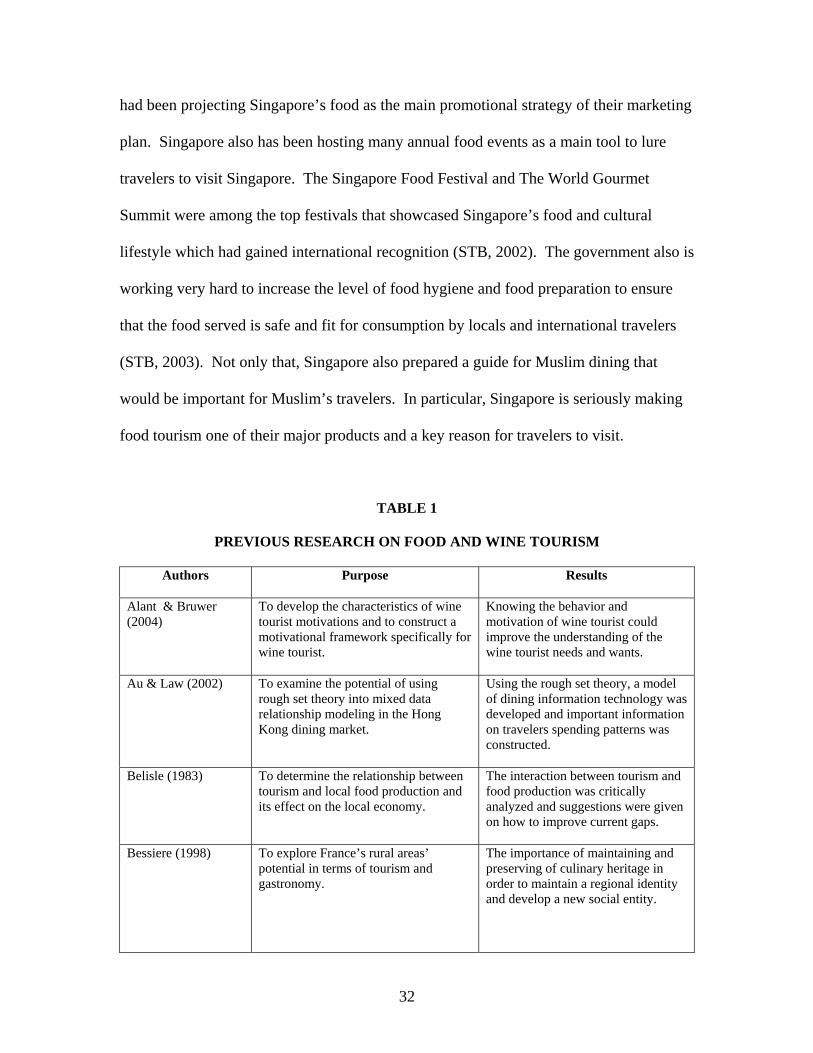
TABLE 1
PREVIOUS RESEARCH ON FOOD AND WINE TOURISM
Authors
Purpose Results
Alant & Bruwer (2004)
To develop the characteristics of wine tourist motivations and to construct a motivational framework specifically for wine tourist.
Knowing the behavior and motivation of wine tourist could improve the understanding of the wine tourist needs and wants.
Au & Law (2002)
To examine the potential of using rough set theory into mixed data relationship modeling in the Hong Kong dining market.
Using the rough set theory, a model of dining information technology was developed and important information on travelers spending patterns was constructed.
Belisle (1983)
To determine the relationship between tourism and local food production and its effect on the local economy.
The interaction between tourism and food production was critically analyzed and suggestions were given on how to improve current gaps.
Bessiere (1998)
To explore France’s rural areas’ potential in terms of tourism and gastronomy.
The importance of maintaining and preserving of culinary heritage in order to maintain a regional identity and develop a new social entity.
32
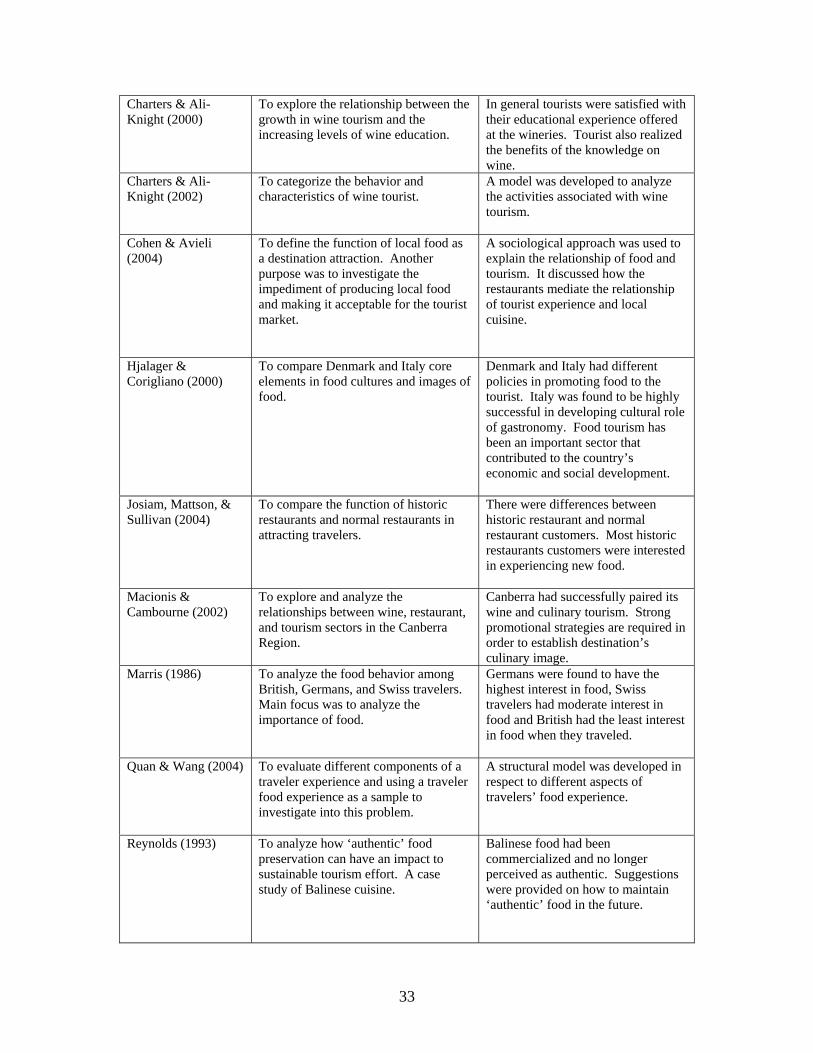
Charters & Ali-Knight (2000)
To explore the relationship between the growth in wine tourism and the increasing levels of wine education.
In general tourists were satisfied with their educational experience offered at the wineries. Tourist also realized the benefits of the knowledge on wine.
Charters & Ali-Knight (2002)
To categorize the behavior and characteristics of wine tourist.
A model was developed to analyze the activities associated with wine tourism.
Cohen & Avieli (2004)
To define the function of local food as a destination attraction. Another purpose was to investigate the impediment of producing local food and making it acceptable for the tourist market.
A sociological approach was used to explain the relationship of food and tourism. It discussed how the restaurants mediate the relationship of tourist experience and local cuisine.
Hjalager & Corigliano (2000)
To compare Denmark and Italy core elements in food cultures and images of food.
Denmark and Italy had different policies in promoting food to the tourist. Italy was found to be highly successful in developing cultural role of gastronomy. Food tourism has been an important sector that contributed to the country’s economic and social development.
Josiam, Mattson, & Sullivan (2004)
To compare the function of historic restaurants and normal restaurants in attracting travelers.
There were differences between historic restaurant and normal restaurant customers. Most historic restaurants customers were interested in experiencing new food.
Macionis & Cambourne (2002)
To explore and analyze the relationships between wine, restaurant, and tourism sectors in the Canberra Region.
Canberra had successfully paired its wine and culinary tourism. Strong promotional strategies are required in order to establish destination’s culinary image.
Marris (1986)
To analyze the food behavior among British, Germans, and Swiss travelers. Main focus was to analyze the importance of food.
Germans were found to have the highest interest in food, Swiss travelers had moderate interest in food and British had the least interest in food when they traveled.
Quan & Wang (2004) To evaluate different components of a traveler experience and using a traveler food experience as a sample to investigate into this problem.
A structural model was developed in respect to different aspects of travelers’ food experience.
Reynolds (1993) To analyze how ‘authentic’ food preservation can have an impact to sustainable tourism effort. A case study of Balinese cuisine.
Balinese food had been commercialized and no longer perceived as authentic. Suggestions were provided on how to maintain ‘authentic’ food in the future.
33
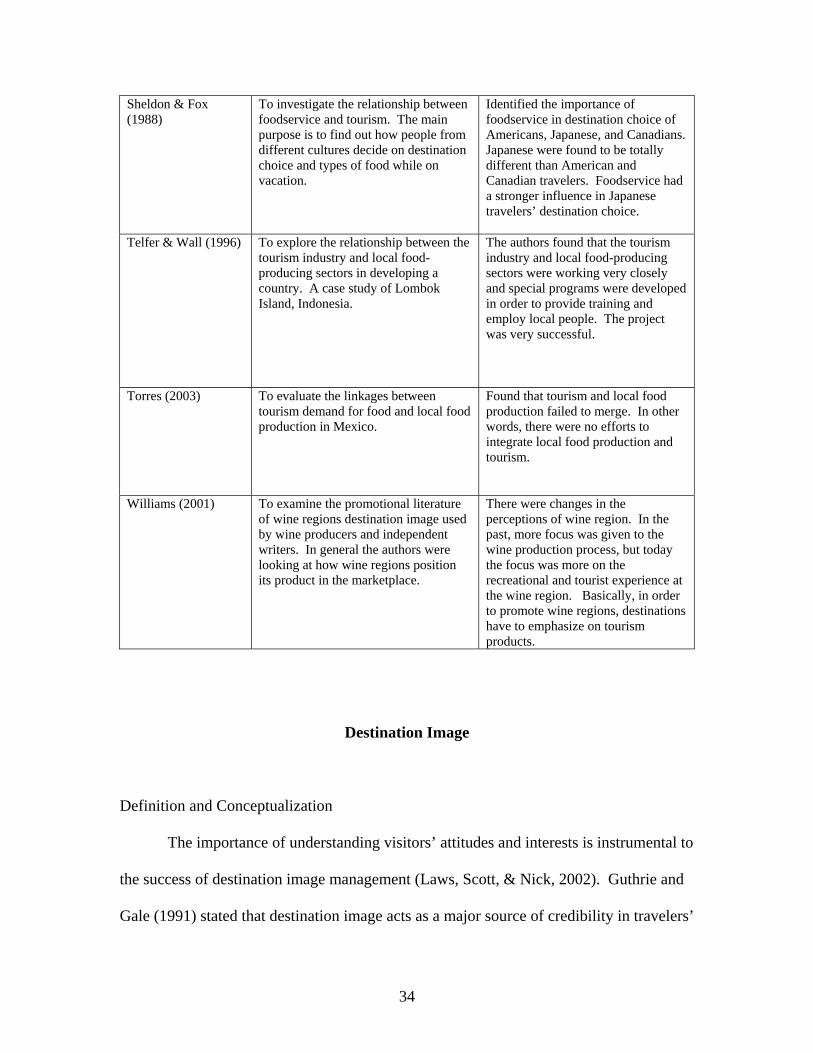
Sheldon & Fox (1988)
To investigate the relationship between foodservice and tourism. The main purpose is to find out how people from different cultures decide on destination choice and types of food while on vacation.
Identified the importance of foodservice in destination choice of Americans, Japanese, and Canadians. Japanese were found to be totally different than American and Canadian travelers. Foodservice had a stronger influence in Japanese travelers’ destination choice.
Telfer & Wall (1996) To explore the relationship between the tourism industry and local food-producing sectors in developing a country. A case study of Lombok Island, Indonesia.
The authors found that the tourism industry and local food-producing sectors were working very closely and special programs were developed in order to provide training and employ local people. The project was very successful.
Torres (2003) To evaluate the linkages between tourism demand for food and local food production in Mexico.
Found that tourism and local food production failed to merge. In other words, there were no efforts to integrate local food production and tourism.
Williams (2001) To examine the promotional literature of wine regions destination image used by wine producers and independent writers. In general the authors were looking at how wine regions position its product in the marketplace.
There were changes in the perceptions of wine region. In the past, more focus was given to the wine production process, but today the focus was more on the recreational and tourist experience at the wine region. Basically, in order to promote wine regions, destinations have to emphasize on tourism products.
Destination Image
Definition and Conceptualization
The importance of understanding visitors’ attitudes and interests is instrumental to
the success of destination image management (Laws, Scott, & Nick, 2002). Guthrie and
Gale (1991) stated that destination image acts as a major source of credibility in travelers’
34
perceptions in comparison to other products offered at a particular destination. In
essence, destination image is the most reliable source influencing travelers’ decision
making process (Beerli & Martin, 2004). Destination image, as defined by Crompton
(1979, p.18) is “the sum of beliefs, ideas and impressions that a person has of a
destination.” On the other hand, Lawson and Bond-Bovy (1977) defined destination
image as “the expression of all objective knowledge, impressions, prejudice,
imaginations, and emotional thoughts an individual or group might have of a particular
destination.” This definition confirmed that we can develop a unique characteristic for a
market segment of a specific destination that may attract individuals or a group of
tourists. As such, the strategy of using destination image is important in promoting a
destination (Ryan, 1991; Tapachai & Waryszak, 2000). Baloglu (1996) further stated
that identifying which destination image to focus on is critical because it will help to
market and promote the destination to a specific segment of the market.
Knowing tourists’ perceptions toward a destination image is crucial because it
influences customers’ decision making processes (Crompton, 1979; Gartner & Hunt,
1987; Mayo, 1973). In addition, marketers have long been aware of the association
between destination image and consumer behavior (Jenkins, 1999). According to Laws
et al.(2002), the type of image will depend on the following two factors: a) the
destination’s uniqueness or specialty and b) how to `attract visitors to the destination.
Table 2 presents some selected definitions of destination image to demonstrate its various
dimensions.
35
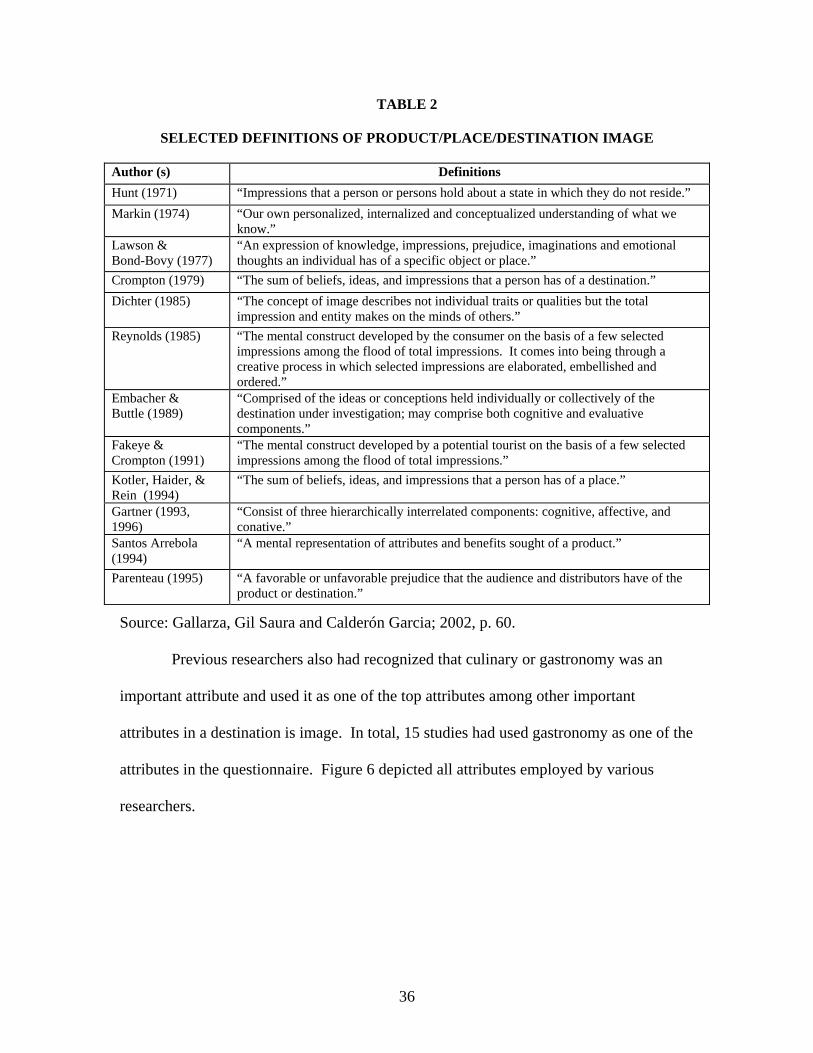
TABLE 2
SELECTED DEFINITIONS OF PRODUCT/PLACE/DESTINATION IMAGE
Author (s) Definitions Hunt (1971) “Impressions that a person or persons hold about a state in which they do not reside.” Markin (1974) “Our own personalized, internalized and conceptualized understanding of what we
know.” Lawson & Bond-Bovy (1977)
“An expression of knowledge, impressions, prejudice, imaginations and emotional thoughts an individual has of a specific object or place.”
Crompton (1979) “The sum of beliefs, ideas, and impressions that a person has of a destination.” Dichter (1985) “The concept of image describes not individual traits or qualities but the total
impression and entity makes on the minds of others.” Reynolds (1985) “The mental construct developed by the consumer on the basis of a few selected
impressions among the flood of total impressions. It comes into being through a creative process in which selected impressions are elaborated, embellished and ordered.”
Embacher & Buttle (1989)
“Comprised of the ideas or conceptions held individually or collectively of the destination under investigation; may comprise both cognitive and evaluative components.”
Fakeye & Crompton (1991)
“The mental construct developed by a potential tourist on the basis of a few selected impressions among the flood of total impressions.”
Kotler, Haider, & Rein (1994)
“The sum of beliefs, ideas, and impressions that a person has of a place.”
Gartner (1993, 1996)
“Consist of three hierarchically interrelated components: cognitive, affective, and conative.”
Santos Arrebola (1994)
“A mental representation of attributes and benefits sought of a product.”
Parenteau (1995) “A favorable or unfavorable prejudice that the audience and distributors have of the product or destination.”
Source: Gallarza, Gil Saura and Calderón Garcia; 2002, p. 60.
Previous researchers also had recognized that culinary or gastronomy was an
important attribute and used it as one of the top attributes among other important
attributes in a destination is image. In total, 15 studies had used gastronomy as one of the
attributes in the questionnaire. Figure 6 depicted all attributes employed by various
researchers.
36
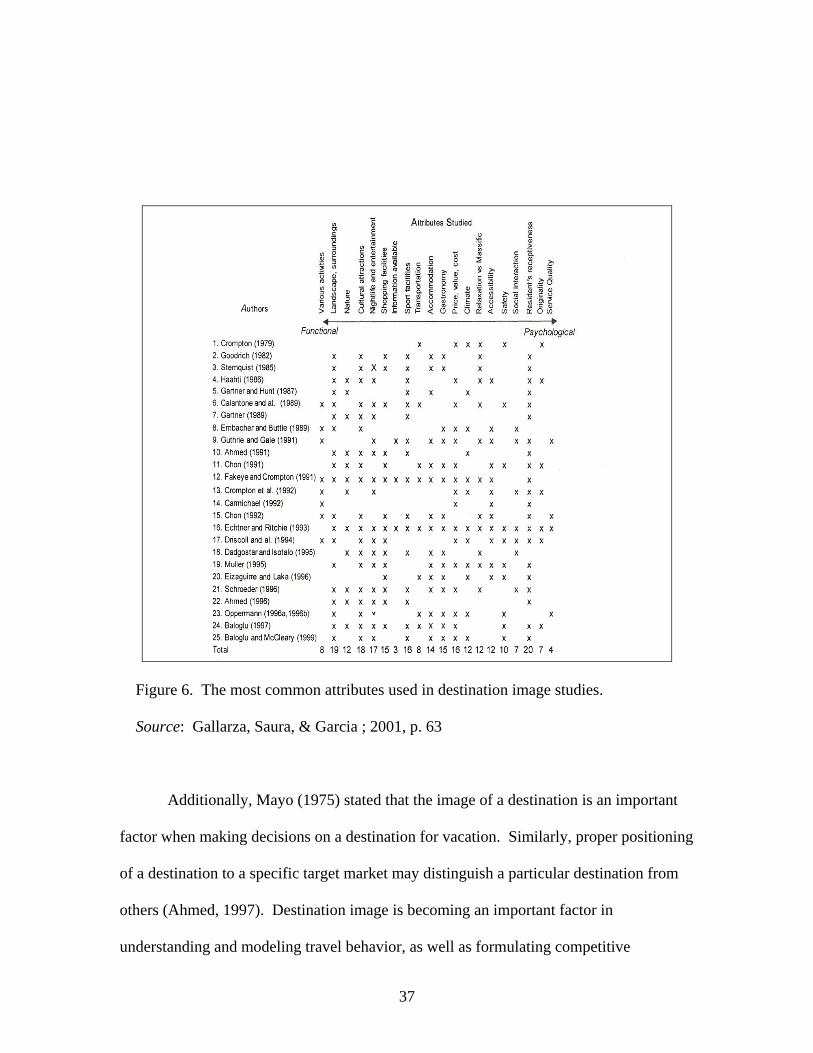
Figure 6. The most common attributes used in destination image studies.
Source: Gallarza, Saura, & Garcia ; 2001, p. 63
Additionally, Mayo (1975) stated that the image of a destination is an important
factor when making decisions on a destination for vacation. Similarly, proper positioning
of a destination to a specific target market may distinguish a particular destination from
others (Ahmed, 1997). Destination image is becoming an important factor in
understanding and modeling travel behavior, as well as formulating competitive
37
marketing strategies that will support destinations in competing in a marketplace (Echtner
& Ritchie, 1991).
Baloglu (1997) reported that many researchers from different fields of study
agreed that destination image could be shaped from two major causes: stimulus factors
and personal factors. Stimulus was found to be linked to the external environment and
previous experience. In contrast, personal factors were associated with an individual
personality in terms of social and psychological behavior.
Guthrie and Gale (1991) stated that the importance of images is higher than a
product’s tangibility and perceptions because they motivate customers to make decisions.
People make decisions based on the image of a destination. If a destination has a positive
image, it is more likely that people will visit. According to Kotler, Bowens, & Makens
(2002), developing a more favorable image is important for competitive advantage.
Therefore, the more highly positive a destination’s image is, the more likely it is to attract
travelers and successfully compete with its competitors. Baloglu and Mangaloglu (2001)
identified that travelers’ perceptions and image of a destination would be affected by the
types of information sources availability. In particular, information provided by travel
agents or travel related companies were considered the most important sources for
international travels.
Jenkins (1999) commented that marketers are fascinated by the concept of tourist
destination images because of their association with customers’ decision-making
processes. However, in order to differentiate a destination image, a destination or a
particular market has to go through a process of segmentation (Kotler, Bowens, &
Makens, 2002). This process includes developing and positioning strategies for a product
38
or services. Positioning can be defined as “creating the appropriate image of a product in
the minds of customers in the target markets” (Echtner & Ritchie, 1993, p.3). In this
sense, position is very important because of the way it affects self-congruity on travel
behavior. Self-congruity is related to a tourist’s self concept, which is matched to the
destination visitor image (Sirgy and Su, 2000). The destination visitor image is different
from a destination’s image. Visitor image refers to the person’s perception of the
destination’s image and the expectation to visit a particular destination. This helps
promoters of a destination to personalize the destination’s image and eventually support
the strategy it expects to achieve. For example, New Orleans or Louisiana (pre-hurricane
Katrina) was positioned to be a food or culinary destination. The food image would form
in the tourists’ mind and would influence their decisions to visit the destination.
Since destination image is very complex, it is reasonable to create images for
different segments of the market and develop various positioning strategies. Diverse
positioning efforts of a destination help to attract different types of visitors. Sirgy and Su
(2000) stated when a visitor’s self concept and their destination image matched; it is more
likely that they will visit. Goodall (1988) claimed that knowing the factors that influence
image would help identify target markets and decide which image should be positioned to
which segment of the market. According to Kotler, Haider, and Rein (1993),
destinations have to be managed strategically using a brand image as the major role in the
positioning process.
39
Previous Research on Destination Image
A study by Schnider and Sonmez (1999) on tourist images of Jordan, analyzed the
perceptions of tourists visiting Jordan. Specifically, the study was conducted at the
Jerash Festival in Jordan, which was an annual Festival of Culture and Arts. The 18-day
festival includes various forms of cultural attractions from music to native arts and crafts.
It was found that, most visitors developed a negative image of Jordan because of its
location, which is close to the West Bank where there is much violent and political
instability. The mass media published unfavorable images of Jordan and influenced
visitors in developing undesirable images about the country. The study recommended
that Jordan should capitalize on other sources, for example its culture and history, that
can help to distinguish itself from other countries in the Middle East.
A study on India by Chaudhary (2000) investigated tourists’ expectation and
satisfaction levels in association with India’s destination image. The main theme of the
study was to analyze the gaps between expectation and satisfaction levels. It was found
that India’s rich cultural heritage helped in the formation of more positive images.
However, it is tourists’ lack of safety and lack of infrastructure, which completely
damaged India’s reputation as an attractive destination. India has to effectively solve
these problems and focus its marketing strategy on tourists’ safety and infrastructure.
Rittichainuwat, Qu and Brown’s (2001) study on Thailand’s current image sought
to identify its strengths and weaknesses as one of the major travel destinations in the
world. The purpose of the study was to change Thailand’s negative image and emphasize
its positive ones. In the past, the Thai Authority of Tourism had been successful in its
40
marketing efforts to promote Thailand as a safe and friendly destination that offers
multiple tourist products from cultural, natural, and historical to shopping attractions.
However today, Thailand is also widely known for its pollutions, traffic jams, prostitution
and an AIDS epidemic. Hence, in order to maintain its position as an international tourist
destination, Thailand has to strengthen its positive images in order to increase its tourists’
arrival. Rittichainuwat, Qu and Brown (2001) analyzed the importance of the number of
visits and how travelers’ demographic profiles influenced their perceptions of a
destination.
Lee, O’Leary, and Hong (2002) investigated German travelers’ perceptions of the
image of the United States. The main purpose of the study was to analyze the overall
impression and image, socio-demographic characteristics, and past visits to the United
States. The study divided travelers into groups of high and low propensity. The high
propensity group was found to have more favorable image and positive perceptions of the
United States than the low propensity group. In contrast, past experience was not found
to significantly affect both groups of German travelers.
Williams (2001) investigated the image of wine tourism destinations. Using a
qualitative method, he conducted a content analysis of literature on wine tourism regions.
Specifically, he analyzed the promotional literature and suggested several attributes
related to wine tourism images. The attributes were divided into 2 categories, first the
images of promotional materials reviewed between 1990 and 1994 and second, the
images of promotional material reviewed between 1995 and 1999. In the early 1990’s,
the images that were important are listed as follows: (1) climatic and environmental, (2)
landscape emphasis, (3) facility development, (4) production focus, (5) sense of place,
41
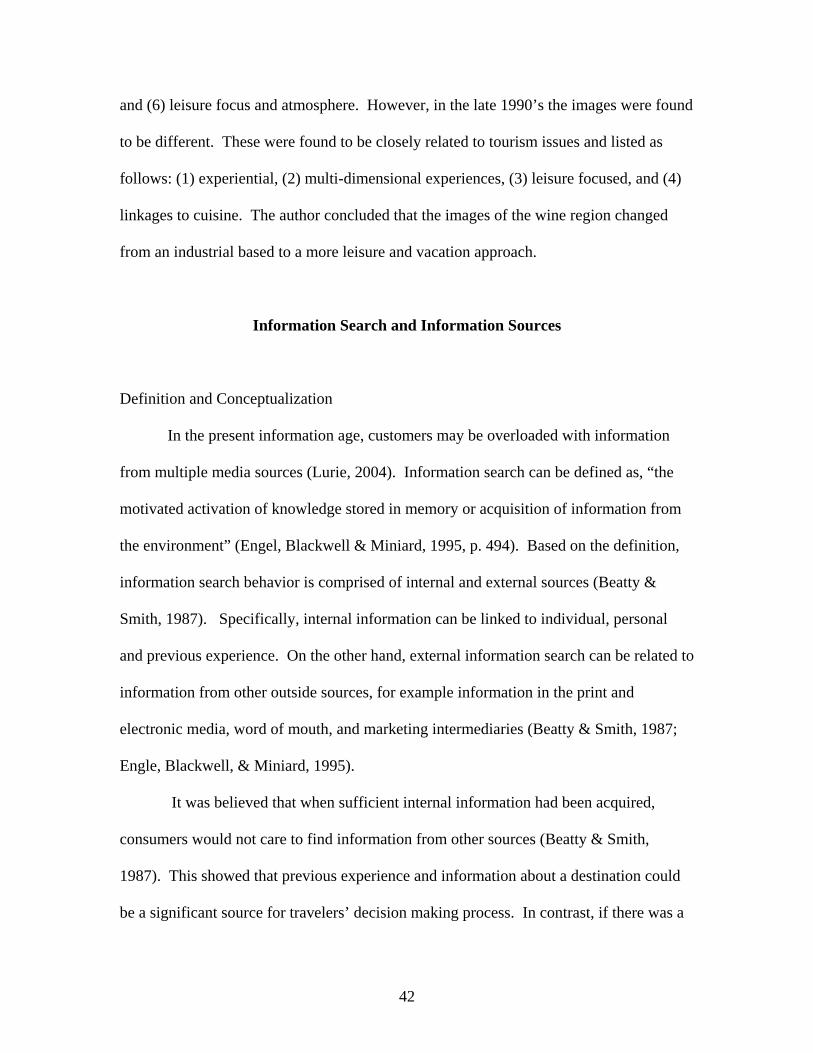
and (6) leisure focus and atmosphere. However, in the late 1990’s the images were found
to be different. These were found to be closely related to tourism issues and listed as
follows: (1) experiential, (2) multi-dimensional experiences, (3) leisure focused, and (4)
linkages to cuisine. The author concluded that the images of the wine region changed
from an industrial based to a more leisure and vacation approach.
Information Search and Information Sources
Definition and Conceptualization
In the present information age, customers may be overloaded with information
from multiple media sources (Lurie, 2004). Information search can be defined as, “the
motivated activation of knowledge stored in memory or acquisition of information from
the environment” (Engel, Blackwell & Miniard, 1995, p. 494). Based on the definition,
information search behavior is comprised of internal and external sources (Beatty &
Smith, 1987). Specifically, internal information can be linked to individual, personal
and previous experience. On the other hand, external information search can be related to
information from other outside sources, for example information in the print and
electronic media, word of mouth, and marketing intermediaries (Beatty & Smith, 1987;
Engle, Blackwell, & Miniard, 1995).
It was believed that when sufficient internal information had been acquired,
consumers would not care to find information from other sources (Beatty & Smith,
1987). This showed that previous experience and information about a destination could
be a significant source for travelers’ decision making process. In contrast, if there was a
42
lack of internal information, individuals would seek for more external sources that might
help them to supplement their knowledge.
Theoretical Development of Information Search Behavior
Past researchers have discovered three major theories that were associated with
information search literature (Schmidt & Spreng, 1996; Srinivas, 1990). The first theory
was related to individual motivation and product type (Dunchan & Olshavsky, 1982).
The second theory utilized an economic approach by combining a cost-benefit function
with the ways in which information search were significant to customers (Avery, 1996).
Finally, the third theory was linked to information processing, which focuses on
individual memory and cognition (Coupey, Irwin, & Payne, 1998).
The individual motivation approach could be linked to the push and pull concept
(Cha, McCleary, & Uysal, 1995). Specifically, individuals were pushed by internal and
pulled by external forces. Through these forces, individuals were attracted to visit
destinations (Gitelson, & Kerstetter, 1990). Additionally, there were two individual
characteristics that could influence the type of information search. First, demographic
characteristics could influence the information search behavior. For example, an
individual’s age or income would determine the type of information sources used (Bonn,
Furr, & Hausman, 2001). The second factor was related to the individual’s travel
characteristics, such as the time spent on vacation, previous experience, and travel group
characteristics. All these will determine the level of information search effort and the
type of information sources that would be employed.
43
Maser (1996) stated that travelers’ information search and the level of information
utilization depended on the potential cost and benefits of the information sources.
Similarly, Murray (1991) and Lutz and Reilly (1973), proposed that perceived risk and
information sources are positively correlated. For example, when purchasing an
intangible product, individuals would increase the information search strategy, which in
turn would reduce the perceived risk of buying the product. On the other hand, if
individuals perceived that the information search is associated with perceived costs, it
would likely decrease the level of an individuals’ information search (Lee &
Cunningham, 2001; Porter 1985). In summary, we can say that customers’ level of
information search activities would be highly dependent on the perceived risk and cost
associated with particular products.
In respect to the process approach, it emphasized more on the process of
information search, but not on the act of information seeking. In general, it refers to how
the information is processed and later be used in decision making. Asseal (1984)
developed a model of information processing (see Figure 7) which comprised of five
levels. At the first level, three main factors were important such as customers’
background, environment, and the product marketing strategies. The second level
emphasized the information search behavior. The third level focused on information
processing whereby customers will analyze the information acquired. The fourth level,
customers’ might evaluate the brand that can be associated with a particular product.
Finally, at the fifth level customers make their final decision. In general, after going
through these activities customers’ make their product choices.
44
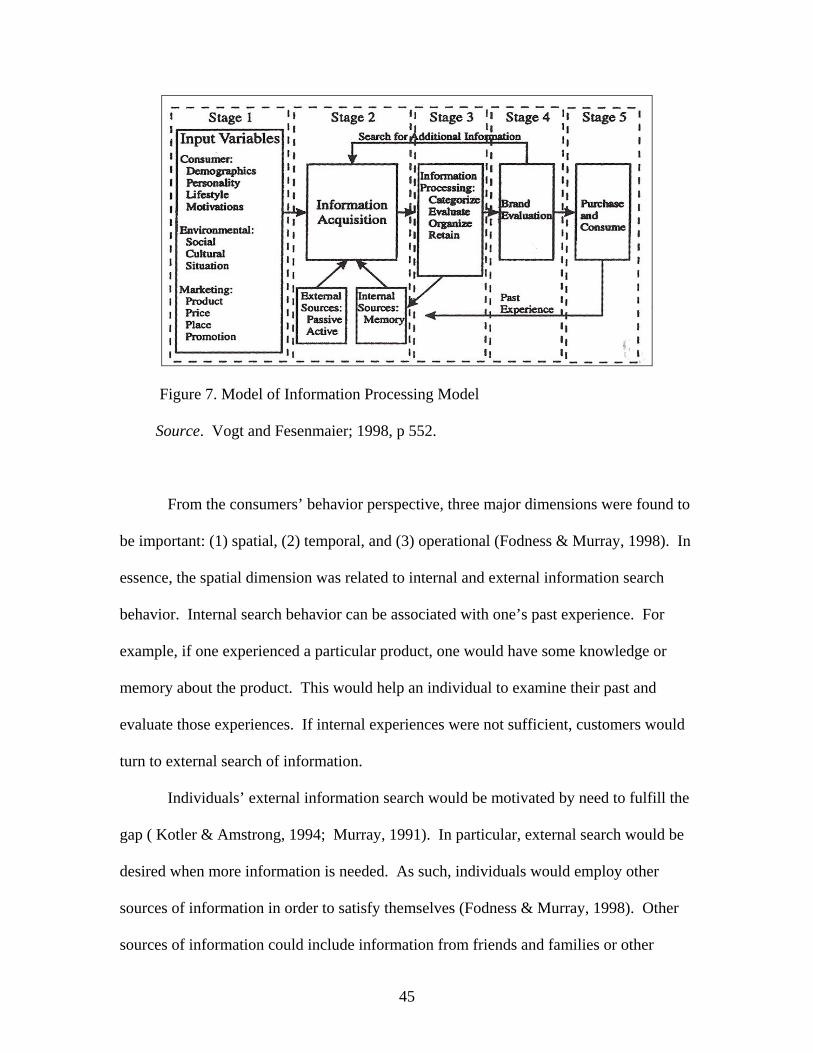
Figure 7. Model of Information Processing Model
Source. Vogt and Fesenmaier; 1998, p 552.
From the consumers’ behavior perspective, three major dimensions were found to
be important: (1) spatial, (2) temporal, and (3) operational (Fodness & Murray, 1998). In
essence, the spatial dimension was related to internal and external information search
behavior. Internal search behavior can be associated with one’s past experience. For
example, if one experienced a particular product, one would have some knowledge or
memory about the product. This would help an individual to examine their past and
evaluate those experiences. If internal experiences were not sufficient, customers would
turn to external search of information.
Individuals’ external information search would be motivated by need to fulfill the
gap ( Kotler & Amstrong, 1994; Murray, 1991). In particular, external search would be
desired when more information is needed. As such, individuals would employ other
sources of information in order to satisfy themselves (Fodness & Murray, 1998). Other
sources of information could include information from friends and families or other
45
formal information sources. Newman (1977) suggested six factors that might influence
customers’ information search behavior as follows: (1) cost; (2) potential payoff : price,
style, perceived difference, perceived risk, knowledge, experience, education, and
income; (3) buying strategies; brand and store preference, satisfying versus optimizing,
strategy of information acquisition; (4) situational variables: urgency, financial pressure,
special buying opportunities, location of residence; (5) personality variables; and (6)
other variables: household role, party of major influence, social class, occupation, age,
stage of life cycle (p.79-94).
The temporal dimension search strategy takes place during the time of the initial
information search behavior, whether it was an ongoing information search or a search to
increase one’s knowledge base. In other words, the information search at this level
depends on the need recognition (Bloch, Sherrell, & Ridgway, 1986). If customers were
planning to buy products not familiar to them, they would be searching for more
information. However, if they had previous experience with the product, they might also
look for more information that might help them to make better decisions in terms of the
cost and quality of the product (Punj & Staelin, 1983). Furthermore, the information
search might be used for buying product in the future. On the other hand, if customers
were familiar with the product, they might not search for any additional information
(Moorthy, Rachford, & Talukdar, 1997).
Finally, the operational dimension information search is used when a particular
source of information has been chosen. The type of information used might affect
customers’ decision making process (Fodness & Murray, 1998). These sources of
information can be categorized as: (1) personal sources of information from families and
46
friends, (2) commercial sources of information which are related to any type of marketing
efforts, such as salespeople and marketing communications, (3) public sources, print
media such as magazines and newspapers, and (4) personal information sources from
observation and product testing (Kotler & Armstrong, 1994). It was found that the
effectiveness of each source of information depended on the demographic characteristics
of customers (Fodness & Murray, 1998).
Additional types of information process models or theories were also
developed by other researchers. For example, Correia (2002) developed a model of
information process which was divided into three main levels: (1) information search
before making decisions, (2) making decisions based on the information search
(dependent on the information found), and (3) information search after making decision.
However, in another study by Van Raaij and Francken (1984) the researchers found that
travelers have to go through five processes in acquiring information: (1) generic decision,
(2) information acquisition, (3) decision making, (4) vacation activities, and
(5) satisfaction and complaints. Moutinho (1987) came up with three main categories
when people travel. The recommended levels were: urge or need for a vacation,
information search, and choosing the best destinations.
47
Previous Research on Information Search and Travelers
Before making any decisions, travelers had to search for information about the
potential destination of their vacation. The amount of information search would heavily
depend on the type of products intended to be purchased. A product of a higher value
would require more intense or in-depth information search behavior, such as when
traveling to international destinations (Beatty & Smith, 1987). Likewise, customers who
are responsible in decision-making will generally search for more information in order to
rationalize their decision (Money & Crotts, 2003)
Searching for information has been one of the most important aspects for travelers
when making decision for vacation or any tourism activities (Fondness & Murray, 1998;
Gursoy & Chen, 2000; Snepenger, Meged, Snelling & Worrall, 1990). Moreover, with
the current information-rich environment, knowing customers’ information search
behavior is ultimately crucial for effective marketing campaigns and promotions
(Srinivas, 1990; Wilkie & Dickson; 1985). Nevertheless, meaningful information may
lead and help customers in decision making (Schmidt & Spreng, 1996). The success of
tourism products can be highly dependent on the type of information available for the
customers (McIntosh & Goeldner, 1990).
Today’s customers have to engage themselves with a plethora of information
sources that can be examined before making purchase decisions (Pingol & Miyazaki,
2005). Mathieson and Wall (1982) argued that, most potential travelers would require
some type of information and extensively seek the information they need. How they
responded to the information depends on the type and credibility of information sources.
48
In general, travelers used varieties of information sources in order to develop a certain
image of a destination (Walmsley & Lewis, 1984). Additionally, customers search
widely if they are buying expensive products or expecting higher risks on certain
products (Beatty & Smith, 1987; Capon & Burke, 1980; Cunningham, 1967)
Information about a destination or place can be presented to us by various
sources. The sources of information can be divided into two types: formal and informal
(Mathieson & Wall, 1982). Informal information sources are related to word of mouth,
especially from families and friends or other travelers who had past experiences. This
type of information is not really well organized; however, its credibility depends on the
informant’s communication skills in delivering the message. Nevertheless, Katz and
Lazarfeld (1955) argued that word of mouth information was as effective as any other
media such as electronic or print. Price and Feick (1984) confirmed that almost 91% of
the respondents in their study used an informal source of information before making final
decisions.
On the other hand, formal information sources included commercials from print to
electronic media. Each of these formal sources of information would have a particular
objective in order to convey their message to groups of individuals (Mathieson & Wall,
1982).
Past researchers also stated that the type of information sources used depends on
various factors. Brucks (1985) recommended that highly knowledgeable individuals
would search for more information than others. Schmidt and Spreng (1996) found that
customers would do an extensive search when buying expensive food products. In terms
of educational background, individuals who were highly educated were found to search
49
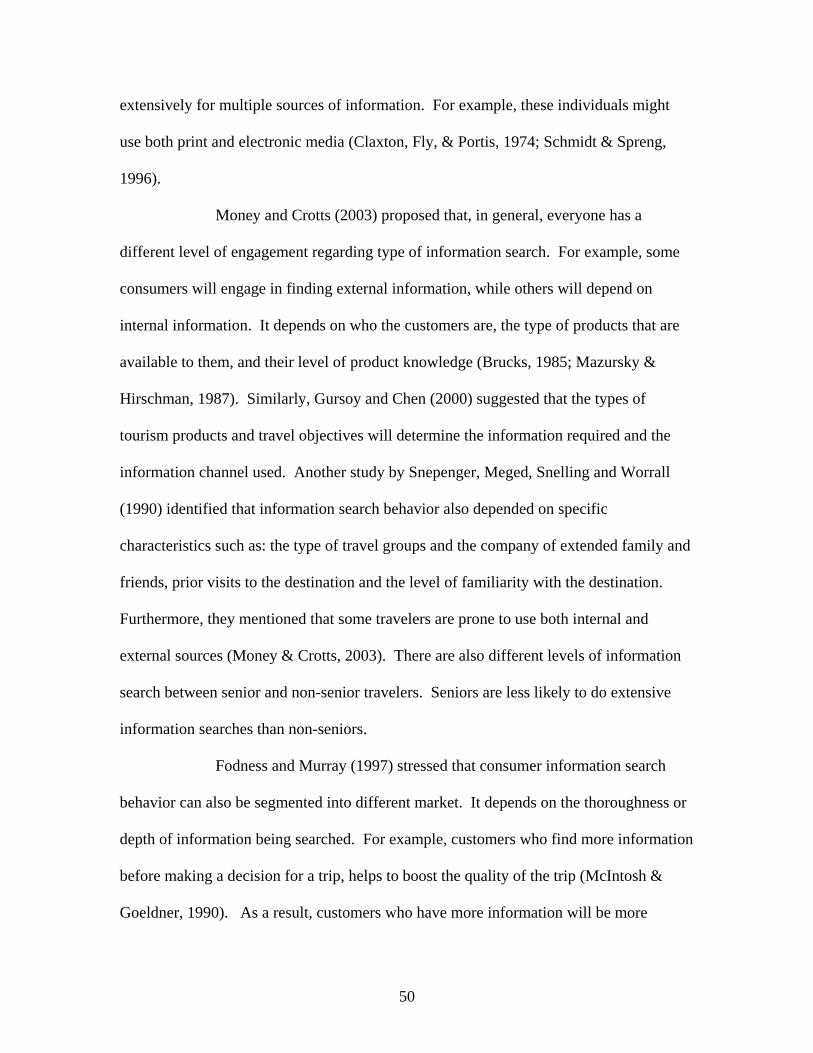
extensively for multiple sources of information. For example, these individuals might
use both print and electronic media (Claxton, Fly, & Portis, 1974; Schmidt & Spreng,
1996).
Money and Crotts (2003) proposed that, in general, everyone has a
different level of engagement regarding type of information search. For example, some
consumers will engage in finding external information, while others will depend on
internal information. It depends on who the customers are, the type of products that are
available to them, and their level of product knowledge (Brucks, 1985; Mazursky &
Hirschman, 1987). Similarly, Gursoy and Chen (2000) suggested that the types of
tourism products and travel objectives will determine the information required and the
information channel used. Another study by Snepenger, Meged, Snelling and Worrall
(1990) identified that information search behavior also depended on specific
characteristics such as: the type of travel groups and the company of extended family and
friends, prior visits to the destination and the level of familiarity with the destination.
Furthermore, they mentioned that some travelers are prone to use both internal and
external sources (Money & Crotts, 2003). There are also different levels of information
search between senior and non-senior travelers. Seniors are less likely to do extensive
information searches than non-seniors.
Fodness and Murray (1997) stressed that consumer information search
behavior can also be segmented into different market. It depends on the thoroughness or
depth of information being searched. For example, customers who find more information
before making a decision for a trip, helps to boost the quality of the trip (McIntosh &
Goeldner, 1990). As a result, customers who have more information will be more
50
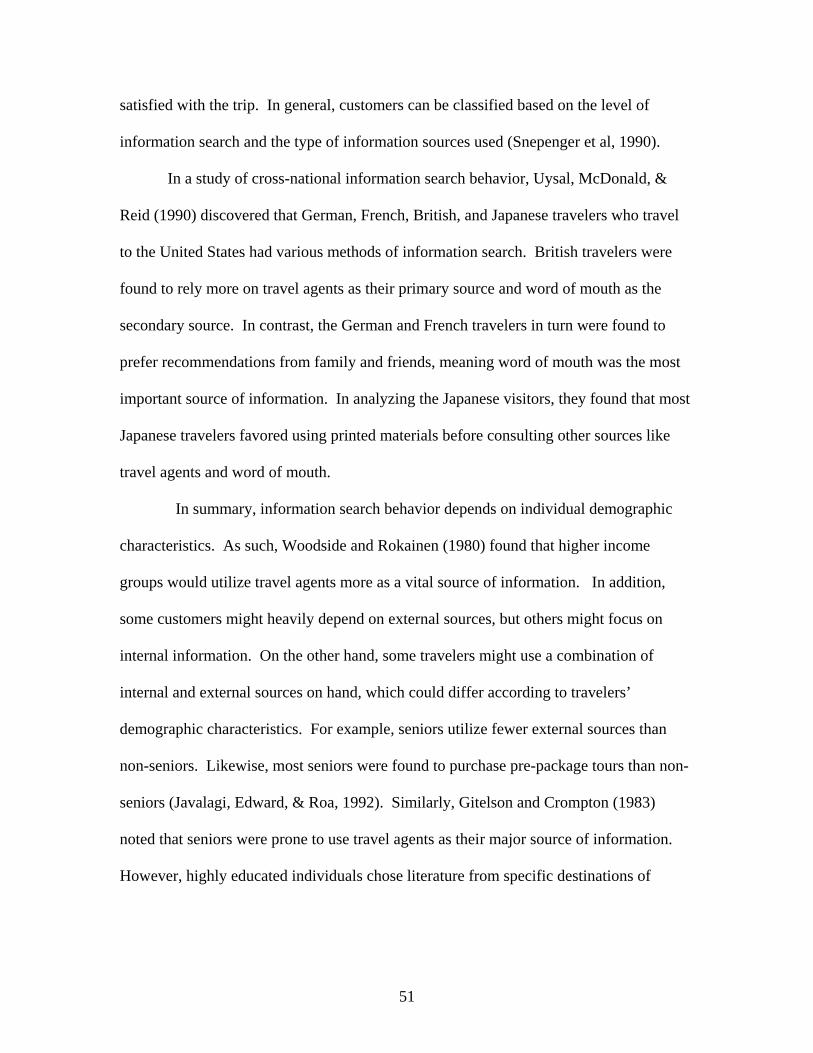
satisfied with the trip. In general, customers can be classified based on the level of
information search and the type of information sources used (Snepenger et al, 1990).
In a study of cross-national information search behavior, Uysal, McDonald, &
Reid (1990) discovered that German, French, British, and Japanese travelers who travel
to the United States had various methods of information search. British travelers were
found to rely more on travel agents as their primary source and word of mouth as the
secondary source. In contrast, the German and French travelers in turn were found to
prefer recommendations from family and friends, meaning word of mouth was the most
important source of information. In analyzing the Japanese visitors, they found that most
Japanese travelers favored using printed materials before consulting other sources like
travel agents and word of mouth.
In summary, information search behavior depends on individual demographic
characteristics. As such, Woodside and Rokainen (1980) found that higher income
groups would utilize travel agents more as a vital source of information. In addition,
some customers might heavily depend on external sources, but others might focus on
internal information. On the other hand, some travelers might use a combination of
internal and external sources on hand, which could differ according to travelers’
demographic characteristics. For example, seniors utilize fewer external sources than
non-seniors. Likewise, most seniors were found to purchase pre-package tours than non-
seniors (Javalagi, Edward, & Roa, 1992). Similarly, Gitelson and Crompton (1983)
noted that seniors were prone to use travel agents as their major source of information.
However, highly educated individuals chose literature from specific destinations of
51
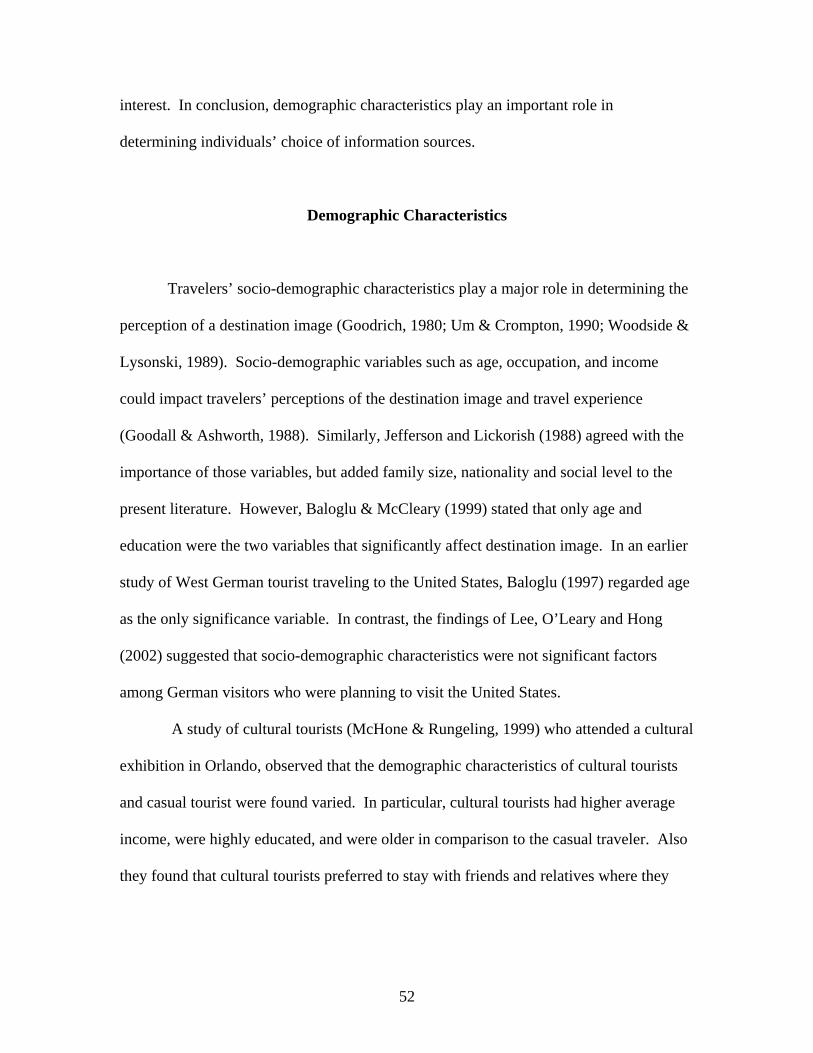
interest. In conclusion, demographic characteristics play an important role in
determining individuals’ choice of information sources.
Demographic Characteristics
Travelers’ socio-demographic characteristics play a major role in determining the
perception of a destination image (Goodrich, 1980; Um & Crompton, 1990; Woodside &
Lysonski, 1989). Socio-demographic variables such as age, occupation, and income
could impact travelers’ perceptions of the destination image and travel experience
(Goodall & Ashworth, 1988). Similarly, Jefferson and Lickorish (1988) agreed with the
importance of those variables, but added family size, nationality and social level to the
present literature. However, Baloglu & McCleary (1999) stated that only age and
education were the two variables that significantly affect destination image. In an earlier
study of West German tourist traveling to the United States, Baloglu (1997) regarded age
as the only significance variable. In contrast, the findings of Lee, O’Leary and Hong
(2002) suggested that socio-demographic characteristics were not significant factors
among German visitors who were planning to visit the United States.
A study of cultural tourists (McHone & Rungeling, 1999) who attended a cultural
exhibition in Orlando, observed that the demographic characteristics of cultural tourists
and casual tourist were found varied. In particular, cultural tourists had higher average
income, were highly educated, and were older in comparison to the casual traveler. Also
they found that cultural tourists preferred to stay with friends and relatives where they
52
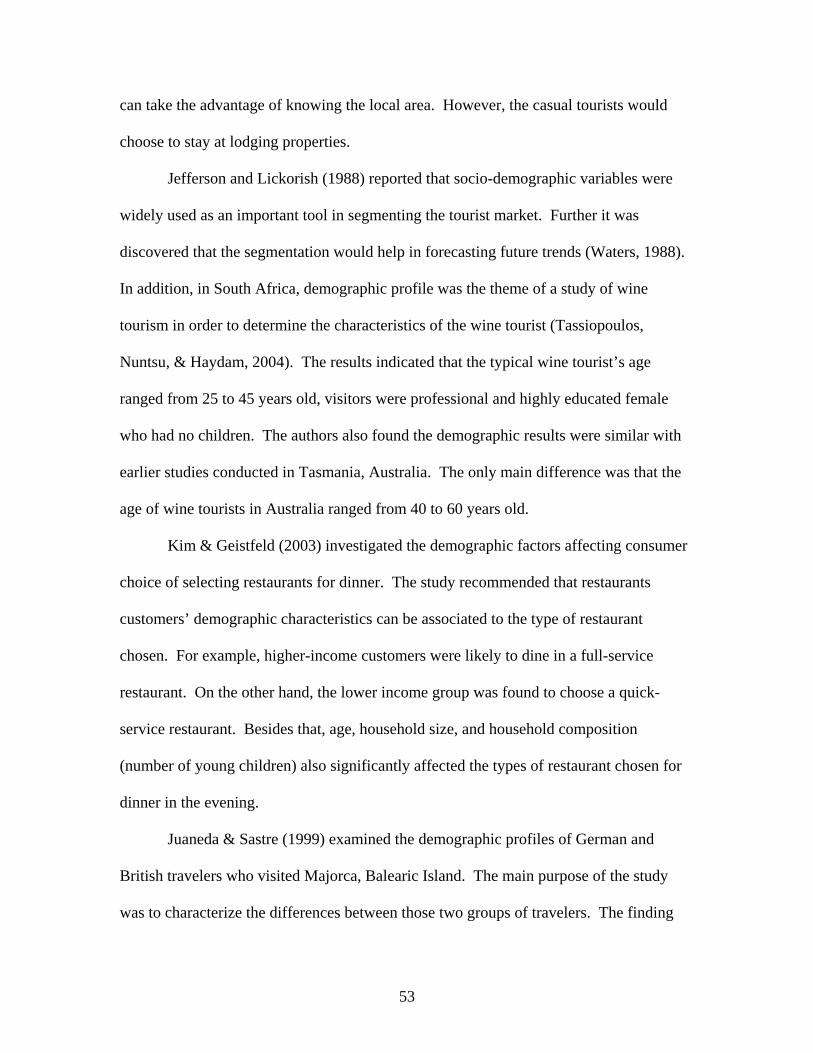
can take the advantage of knowing the local area. However, the casual tourists would
choose to stay at lodging properties.
Jefferson and Lickorish (1988) reported that socio-demographic variables were
widely used as an important tool in segmenting the tourist market. Further it was
discovered that the segmentation would help in forecasting future trends (Waters, 1988).
In addition, in South Africa, demographic profile was the theme of a study of wine
tourism in order to determine the characteristics of the wine tourist (Tassiopoulos,
Nuntsu, & Haydam, 2004). The results indicated that the typical wine tourist’s age
ranged from 25 to 45 years old, visitors were professional and highly educated female
who had no children. The authors also found the demographic results were similar with
earlier studies conducted in Tasmania, Australia. The only main difference was that the
age of wine tourists in Australia ranged from 40 to 60 years old.
Kim & Geistfeld (2003) investigated the demographic factors affecting consumer
choice of selecting restaurants for dinner. The study recommended that restaurants
customers’ demographic characteristics can be associated to the type of restaurant
chosen. For example, higher-income customers were likely to dine in a full-service
restaurant. On the other hand, the lower income group was found to choose a quick-
service restaurant. Besides that, age, household size, and household composition
(number of young children) also significantly affected the types of restaurant chosen for
dinner in the evening.
Juaneda & Sastre (1999) examined the demographic profiles of German and
British travelers who visited Majorca, Balearic Island. The main purpose of the study
was to characterize the differences between those two groups of travelers. The finding
53
indicated that German and British travelers were totally different. In essence, German
tourists were found to be older and wealthier. However, British travelers were slightly
younger and in the lower income groups. German travelers were attracted to typical
tourist attractions, whereas British travelers were interested in experiencing outdoor
activities.
Zhang, Qu, and Tang (2004) investigated the behavior of outbound visitors from
Hong Kong. One of the objectives was to identify the connection between Hong Kong
travelers’ demographic characteristics and their traveling behavior. The researchers
discovered that gender, age, marital status, education, income level and a few of the
destination dimensions were found to be highly significant. In sum, it was found that
demographic differences affected Hong Kong’s travelers’ destination choice and certain
destination attributes were also found to influence their decision to visit.
The literature review reveals that the majority of the studies confirmed that
destination images played a major role in travelers’ destination choice.
Summary
This chapter reviewed the literature on the historical development of gastronomy,
culinary tourism, destination image, previous research in destination image, sources of
information, previous research on information search behavior and demographic
characteristics. In the first section, the history and development of food and eating out
were presented and followed by an analysis of food as a motivating factor when people
travel. Also, a lengthy definition and conceptualization of the relationships between food
54
and tourism were explained in this section. Previous researches were also presented in
order to find out the current status of study in food and tourism. However, most of the
studies were not directly associated, but they provided some background information for
this research.
The second part of the chapter provided an insight to the area of destination image
study. Past researchers in destination image were discussed in this section. The
definition of destination was given by using examples provided by previous researchers
in destination image. The third part of the chapter touched on the theoretical
development of information search behavior. A number of issues was discussed which
directly related to information sources. An information processing model was illustrated
and the function of each of the elements in the information processing model was
discussed. The type of information sources were also presented in this section. In
addition, previous researchers in information sources were included in this section. Most
of the studies showed comparable results. For example, researchers found out that
everyone has a different level of using information sources, depending on the familiarity
with a product.
Finally, the last section of this chapter was devoted to demographic characteristics
and their influence on the tourism industry. Specifically, the effect of gender, age,
education, and income were discussed by using examples from previous researchers. In
the subsequent chapter, the model of study will be illustrated and discussion of research
design and methodology will be presented.
55
CHAPTER III
METHODOLOGY
Research Design
A qualitative and quantitative approach was used in this study to determine the
importance of a destination’s food image and information sources when choosing a
culinary travel destination. The research was conducted in the spring of 2006. In order
to understand and gain more insight in developing the questionnaire, a focus group was
conducted. Additionally, the focus group was conducted to provide the researcher with
in depth knowledge on the relationship between food and tourism.
An e-mail invitation was sent to 20 potential participants for the focus group.
The participants were asked to provide some information on destinations and countries
that they had visited in the past. Nine participants responded to the email and expressed
an interest in participating in the focus group discussion. The focus group consisted of
four male and five female participants who had traveled extensively in the past.
The age of the participants ranged between 23 to 65 years old. Eight of the
participants had master’s degrees, and one participant was still working on an
undergraduate degree. Specifically, the participants were one undergraduate student, two
56
master’s students, a program coordinator, a historian, a military officer, a retired
professor and two academicians. Most of the participants had traveled to destinations in
the United States and overseas. In general most of their trips were for leisure purposes;
however one participant traveled on an official business trip. Some of the destinations
mentioned by the participants were: (1) United States: Portland, Vermont, Maine,
Michigan, Iowa, California, Philadelphia, California, and Hawaii; (2) international
destinations: Central America, Europe, Canada, Caribbean, Malaysia, Japan, South
Korea, Indonesia, Thailand, India, Nepal, Iran, Jordan, Spain, and Turkey. In general, the
participants had traveled extensively in the past. Their past experiences were vital for the
purpose of the focus group.
The discussion was led by the researcher who attempted to gain a broad
understanding on the importance of food when selecting a destination and the importance
of various types of information sources used by the participants. The data gathered from
the focus group was used in formulating the questionnaire. The focus group instrument
consisted of nine open ended questions. The focus group questions were developed prior
to the study. It was developed as part of a qualitative research methodology class
assignment and three personal interviews were conducted to test the questionnaires.
Further modifications to the instruments were made based on the interview results and
recommendations from the course instructor. In addition, an extensive literature review
was also conducted in order to develop reliable questions for the focus group.
The online survey was designed specifically to find out the travelers’ opinion on
the food’s image and information sources of France, Italy and Thailand, using a 7-point
Likert scale. These destinations were selected based on the popularity of their cuisine.
57
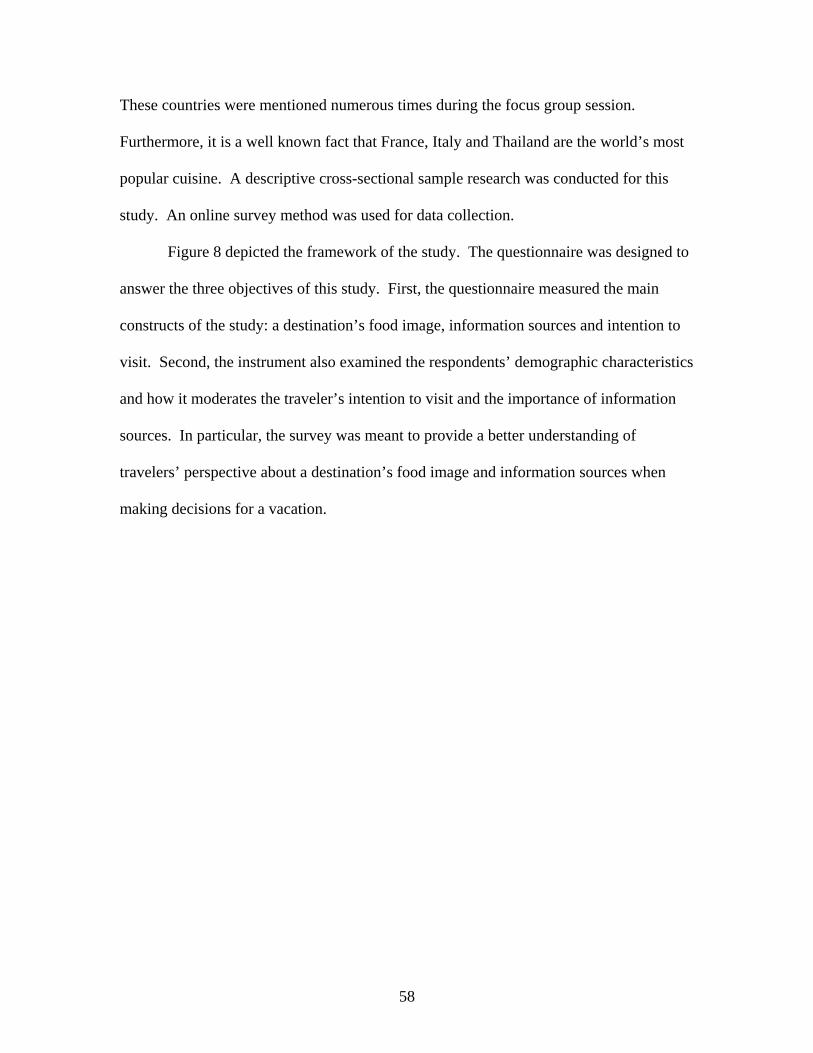
58
These countries were mentioned numerous times during the focus group session.
Furthermore, it is a well known fact that France, Italy and Thailand are the world’s most
popular cuisine. A descriptive cross-sectional sample research was conducted for this
study. An online survey method was used for data collection.
Figure 8 depicted the framework of the study. The questionnaire was designed to
answer the three objectives of this study. First, the questionnaire measured the main
constructs of the study: a destination’s food image, information sources and intention to
visit. Second, the instrument also examined the respondents’ demographic characteristics
and how it moderates the traveler’s intention to visit and the importance of information
sources. In particular, the survey was meant to provide a better understanding of
travelers’ perspective about a destination’s food image and information sources when
making decisions for a vacation.
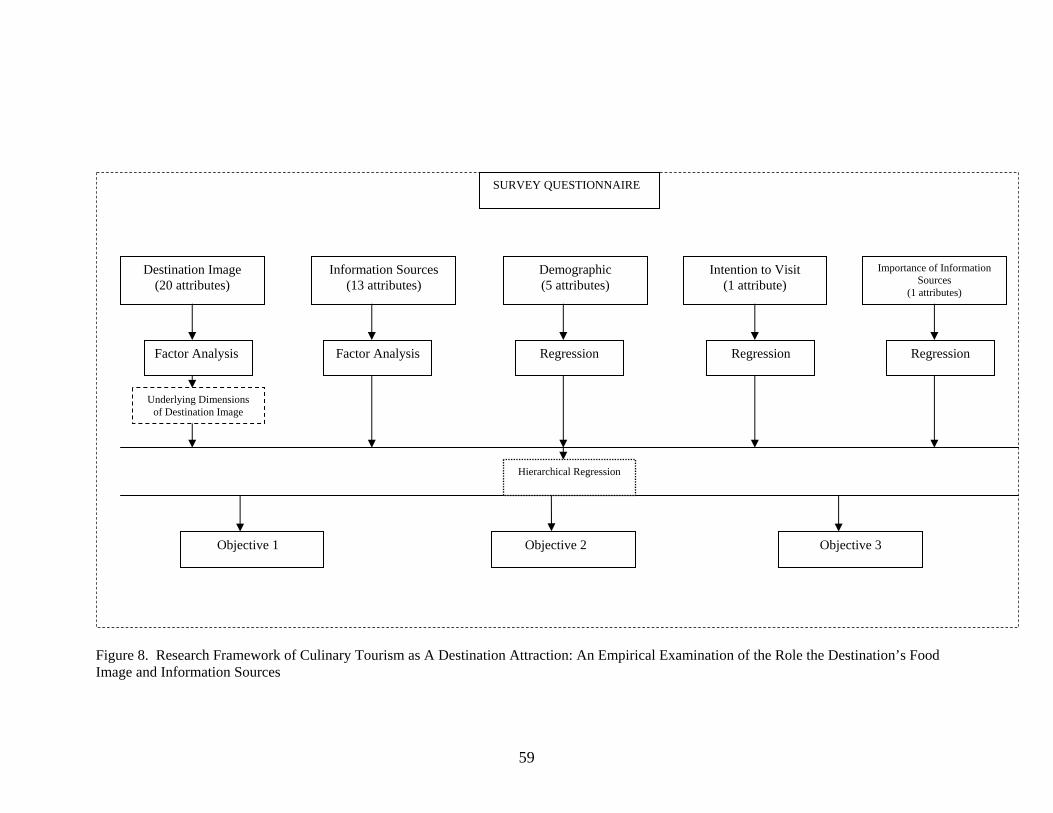
59
Figure 8. Research Framework of Culinary Tourism as A Destination Attraction: An Empirical Examination of the Role the Destination’s Food Image and Information Sources
Destination Image (20 attributes)
Importance of Information Sources
(1 attributes)
Regression
SURVEY QUESTIONNAIRE
Demographic (5 attributes)
Underlying Dimensions of Destination Image
Intention to Visit (1 attribute)
Information Sources (13 attributes)
Regression Regression Factor Analysis Factor Analysis
Hierarchical Regression
Objective 3 Objective 2 Objective 1
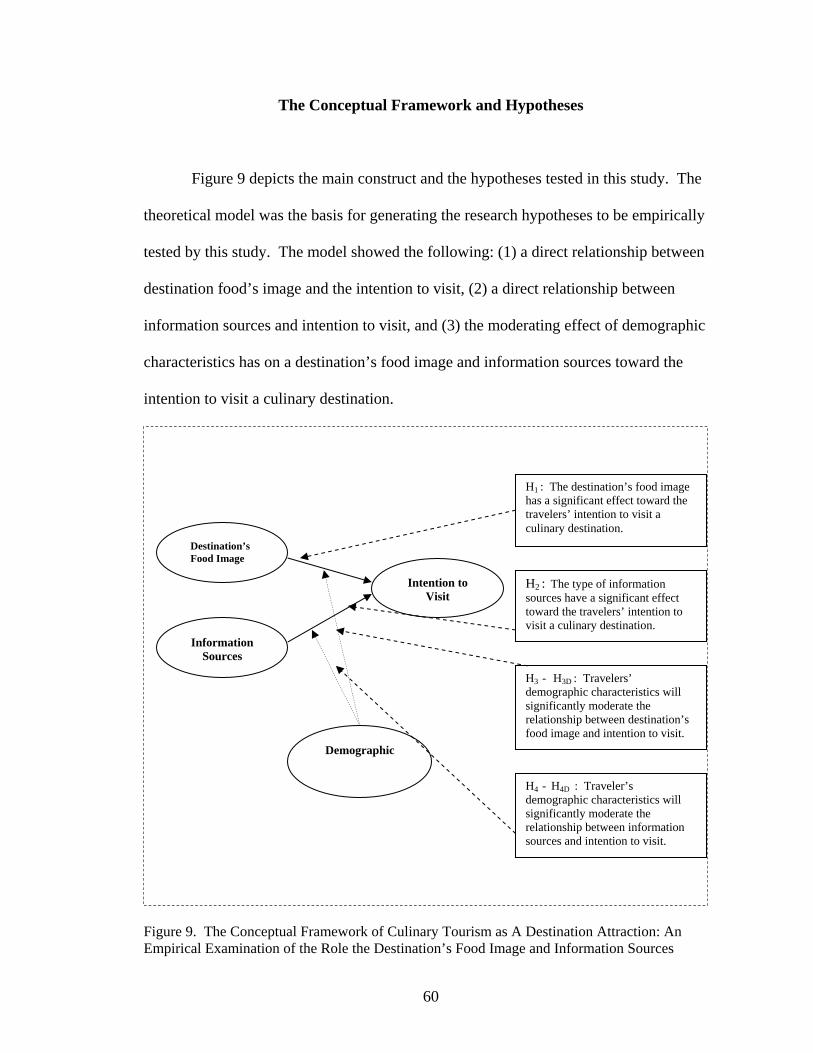
The Conceptual Framework and Hypotheses
Figure 9 depicts the main construct and the hypotheses tested in this study. The
theoretical model was the basis for generating the research hypotheses to be empirically
tested by this study. The model showed the following: (1) a direct relationship between
destination food’s image and the intention to visit, (2) a direct relationship between
information sources and intention to visit, and (3) the moderating effect of demographic
characteristics has on a destination’s food image and information sources toward the
intention to visit a culinary destination.
Figure 9. The Conceptual Framework of Culinary Tourism as A Destination Attraction: An Empirical Examination of the Role the Destination’s Food Image and Information Sources
Information Sources
Intention to Visit
Destination’s Food Image
H2 : The type of information sources have a significant effect toward the travelers’ intention to visit a culinary destination.
H1 : The destination’s food image has a significant effect toward the travelers’ intention to visit a culinary destination.
H3 - H3D : Travelers’ demographic characteristics will significantly moderate the relationship between destination’s food image and intention to visit.
Demographic
H4 - H4D : Traveler’s demographic characteristics will significantly moderate the relationship between information sources and intention to visit.
60
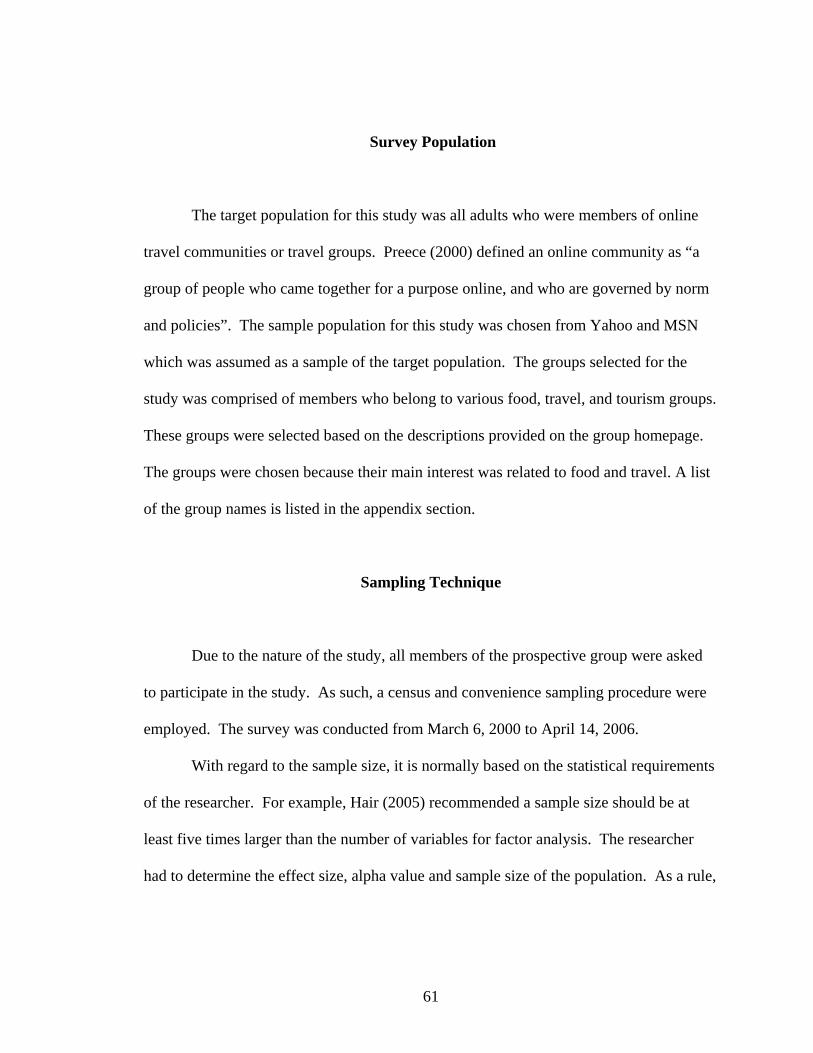
Survey Population
The target population for this study was all adults who were members of online
travel communities or travel groups. Preece (2000) defined an online community as “a
group of people who came together for a purpose online, and who are governed by norm
and policies”. The sample population for this study was chosen from Yahoo and MSN
which was assumed as a sample of the target population. The groups selected for the
study was comprised of members who belong to various food, travel, and tourism groups.
These groups were selected based on the descriptions provided on the group homepage.
The groups were chosen because their main interest was related to food and travel. A list
of the group names is listed in the appendix section.
Sampling Technique
Due to the nature of the study, all members of the prospective group were asked
to participate in the study. As such, a census and convenience sampling procedure were
employed. The survey was conducted from March 6, 2000 to April 14, 2006.
With regard to the sample size, it is normally based on the statistical requirements
of the researcher. For example, Hair (2005) recommended a sample size should be at
least five times larger than the number of variables for factor analysis. The researcher
had to determine the effect size, alpha value and sample size of the population. As a rule,
61
larger sample sizes are highly preferred. A sample size between 200 and 400 is normally
recommended and accepted as a critical sample size (Hair, 2005).
For the calculation of sample size, Burns & Bush (1995) recommended that
researchers have to consider 3 factors: (1) the variability in the population, (2) the
accuracy required, and (3) the level of confidence. The formula for calculating sample
size is: N = Z2 (pq)/e2, where,
N = the sample size
Z = standard error associated with chosen level of confidence (95%)
P = estimate variability in the population 50/50
Q = (100 – P)
E = acceptable error ±5%
Based on this formula, in order to achieve ±5% accuracy at 95% confidence interval, the
sample size will be N = Z2 (pq)/e2 = 1.962 (50 × 50)/52 = 384. Assuming a response rate
of 5%, 7680 (385/.05) participants were expected to be surveyed in order to achieve the
targeted sample size. In anticipation of a low response rate from the online survey, the
researcher surveyed 8067 samples for this study. The total sample size was obtained by
adding together all members of 35 online groups.
Survey Procedure
Prior to the collection of data, the principal investigator wrote an invitation e-mail
to all group members explaining the purpose of the study. A link to the online survey and
a consent form were attached with the e-mail. The responses were automatically stored
62
in an electronic database created for the study. The participants had the liberty to respond
to the survey questions. However, a monetary incentive was provided for the study in
order to increase the response rate. There were four USD $50 prizes (in a form of
International Money Order/ Cashiers Check) awarded in a random drawing. Participants
who wanted to be included in the drawing were asked to enclose their e-mail address at
the end of the survey. The participants were guaranteed that their e-mail address would
not be used for any other purposes. The survey took between five and ten minutes to
complete. A reminder e-mail was sent to all members of the group after one week from
the date of the invitation to participate in the survey.
Research Instrument
A self-administrated questionnaire was used for the study. The questionnaire
consisted of five sections and included categories of questions on the following:
destination’s food image, intention to visit a culinary destination, different types of
information sources, the importance of information sources, and the travelers’
demographic characteristics.
All of the questions were generated from the focus group and past
research. A comprehensive literature review was conducted to ensure the validity of the
questionnaire. Section one investigated the food images of France, Italy, and Thailand
from the travelers’ point of view. The questions were adopted from the focus group and
a study on New Orleans by Dimance and Moody (1998). Most of the attributes used in
this section have been used in many image studies in the past. A seven-point Likert scale
63
was used in this section. Respondents were asked to rate the level of agreement that
ranged from 1 = “strongly disagree” to 7 = “strongly agree”.
Section two asked the travelers how likely they would be to visit those
destinations. In particular, respondents were asked how the food and dining experiences
would influence their intention to visit the destinations. Respondents were asked to rate
the level of their intention based on a five point Likert scale, that ranged from 1 = “most
unlikely” to 5 = “most likely”.
Section three analyzed the importance of different types of information sources
used by travelers when planning their vacation. In particular, the respondents had to rate
France, Italy, and Thailand sources of information. The attributes in this section were
derived from the focus group and Fondness (1994) study on tourist motivation and
information sources used. There were 13 attributes that were developed to measure the
types of information sources used before deciding on a vacation trip. The attributes were
rated on a seven-point Likert scale, that ranged from 1 = “very unimportant” to 7 = “very
important”.
Section four measured overall importance of information sources toward
travelers’ decision making process for all three destinations. This question was
developed in order to find out travelers perspective on the importance of information
sources.
Section five analyzed the travelers’ demographic characteristics. This section
also was adapted from a previous study. Most items were measured using nominal scale
and interval scales.
64
Validity and Reliability
Validity refers to the degree to which the instruments can quantify the differences
between individuals on the construct one seeks to measure (Churchill, 2001). In this
study, content validity was determined by in-depth literature review and the usage of
validated survey instruments from previous research. Besides that, an in-depth literature
review was conducted to guarantee that the instruments covered the concepts intended for
this study. Next, the instruments were examined by a panel of experts (academician) to
ensure the content and face validity. Six professors were asked to edit and improve the
questions to enhance their clarity, readability and content validity. They were also asked
to identify any of the scale items that were not necessary and to offer suggestions for
improving the proposed scale. Based on their comments, changes were made to the
questionnaires.
Further, a pilot study was conducted to further examine the reliability of the
instrument. The pilot test was conducted with a convenience sample of professors and
students. A reliability analysis (Cronbach’s Alpha) was also performed to test the
reliability and consistency of all of the dimensions, which will be obtained from an
exploratory factor analysis. The Cronbach’s Alpha was above .80 for most of the test
conducted. It showed that the instrument used was reliable. A result of .70 and above
was accepted as a cut off point (Nunnally & Bernstein, 1994). The result of the pilot test
provided helpful information on the questionnaire design, wording, and measurement
scales. The questionnaire was modified based on the findings.
65
Data Analysis
Data analysis was divided into three sections using descriptive and inferential
statistics. The data was coded into and analyzed with The Statistical Package for Social
Science (SPSS) by Einspruch (2005). The first section of the data analysis used
descriptive statistics to explain the destinations’ food image, the importance of type of
information sources, demographics characteristics, and travelers’ intention to visit. A
frequency and percentage data analysis was conducted in this section.
In the second section, factor analysis was used to identify the underlying factors
of the destinations’ food image attributes and also the importance of information sources.
Factor analysis is an interdependent technique in which all variables are concurrently
evaluated and grouped into different categories. These categories are used to explain
each variable set, not to predict a dependent variable (Hair, Anderson, Tatham & Black,
1998).
Finally, in the third section, multiple regression analysis was applied to determine
the relationship between independent and dependent variables. Multiple regression
analysis allows the introduction of several independent variables, so that the equation
constructed reflects the values of several rather than one predictor variable (Churchill,
2001).
A hierarchical regression was conducted in order to analyze the moderating effect
of the demographic variables. This method was used to analyze the relationship among
variables. Anderson (1986) suggested that the main objective of hierarchical regression
was to reduce the independent and moderator variables and increase the significance of a
66

theory based regression model. An F test had to be conducted, in order to analyze if there
was any significant change in the model R2 with the addition of the interaction terms
(independent variable × moderator). If the interaction terms were significant, it showed
there was an effect of a moderating factor.
67
CHAPTER IV
ANALYSIS AND RESULTS
Introduction
In this section, data analysis was performed using SPSS.12. This chapter was
organized based on the research questions. There were four main research questions that
were analyzed in this study. In addition, 12 hypotheses were developed for the study.
Data analysis began with profiling the respondents’ demographic characteristics which
included gender, age group, marital status, education, and income. Frequency analysis
was used to observe the distribution of the data. The subsequent stages of data analysis
were descriptive statistics, factor analysis and multiple-regression. Specific analysis
related to the hypothesis was also performed in order to determine the significance of the
hypotheses.
Response Rate
The participants of this study were selected from online travel and food groups in
MSN and Yahoo The study was conducted from March 6, 2006 to April 14 , 2006. A
68
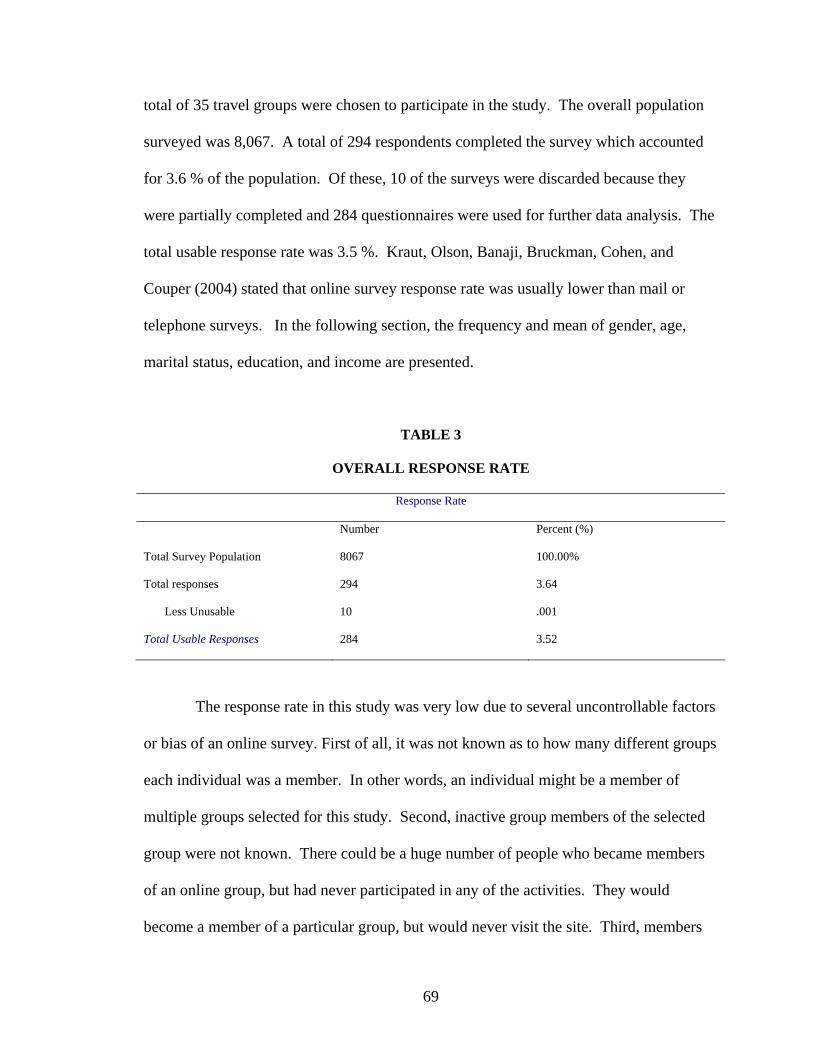
total of 35 travel groups were chosen to participate in the study. The overall population
surveyed was 8,067. A total of 294 respondents completed the survey which accounted
for 3.6 % of the population. Of these, 10 of the surveys were discarded because they
were partially completed and 284 questionnaires were used for further data analysis. The
total usable response rate was 3.5 %. Kraut, Olson, Banaji, Bruckman, Cohen, and
Couper (2004) stated that online survey response rate was usually lower than mail or
telephone surveys. In the following section, the frequency and mean of gender, age,
marital status, education, and income are presented.
TABLE 3
OVERALL RESPONSE RATE
Response Rate
Number Percent (%)
Total Survey Population 8067 100.00%
Total responses
Less Unusable
294
10
3.64
.001
Total Usable Responses 284 3.52
The response rate in this study was very low due to several uncontrollable factors
or bias of an online survey. First of all, it was not known as to how many different groups
each individual was a member. In other words, an individual might be a member of
multiple groups selected for this study. Second, inactive group members of the selected
group were not known. There could be a huge number of people who became members
of an online group, but had never participated in any of the activities. They would
become a member of a particular group, but would never visit the site. Third, members
69
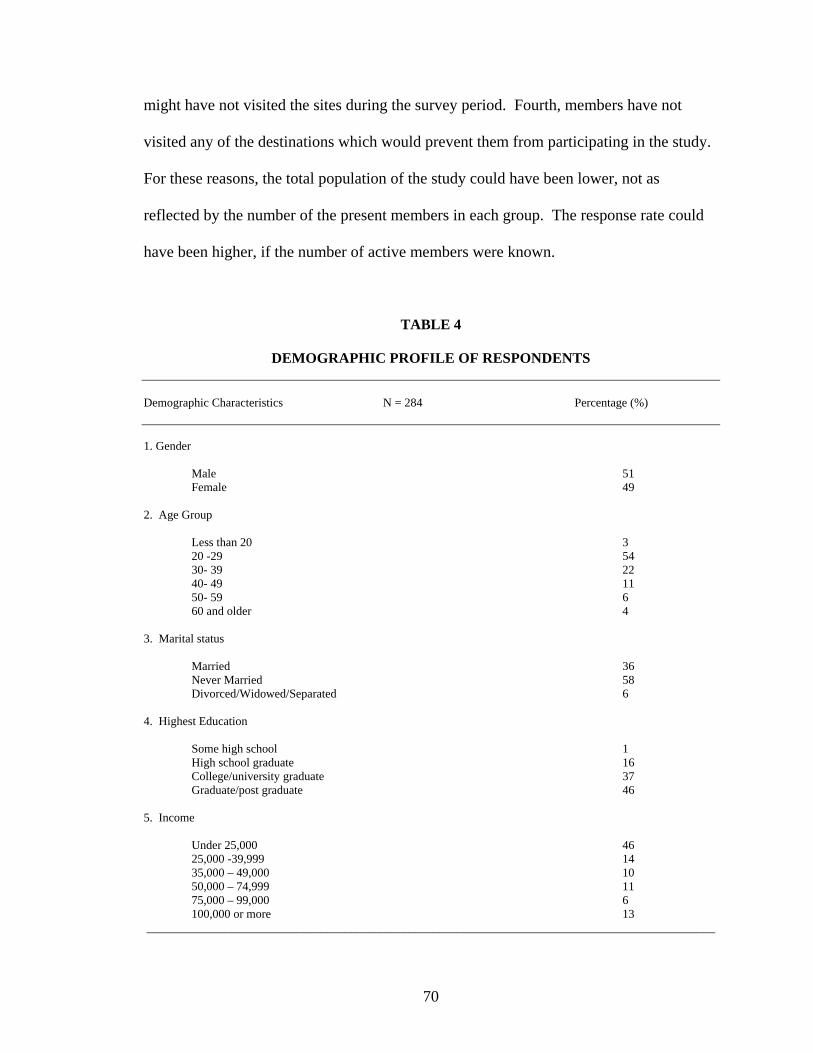
might have not visited the sites during the survey period. Fourth, members have not
visited any of the destinations which would prevent them from participating in the study.
For these reasons, the total population of the study could have been lower, not as
reflected by the number of the present members in each group. The response rate could
have been higher, if the number of active members were known.
TABLE 4
DEMOGRAPHIC PROFILE OF RESPONDENTS Demographic Characteristics N = 284 Percentage (%) 1. Gender Male 51 Female 49 2. Age Group Less than 20 3 20 -29 54 30- 39 22 40- 49 11 50- 59 6 60 and older 4 3. Marital status Married 36 Never Married 58 Divorced/Widowed/Separated 6 4. Highest Education Some high school 1 High school graduate 16 College/university graduate 37 Graduate/post graduate 46 5. Income Under 25,000 46 25,000 -39,999 14 35,000 – 49,000 10 50,000 – 74,999 11 75,000 – 99,000 6 100,000 or more 13 _______________________________________________________________________________________________
70
Demographic profiles of respondents are depicted in Table 4. Gender of the
respondents was almost equally distributed with 51% male and 49 % female. Most of the
respondents’ age was between 20 to 29 years (54%), followed by 30-39 years (22%), and
40-49 years (11%). Few respondents were 50 years and older (10 %). More than half of
the respondents were never married (58%). Most of the respondents had college degrees,
46% had a graduate/post graduate degree and another 37% had a college/university
degree. However, 46 % of the respondents reported a yearly income of under $25,000.
The next income group was $25,000 – 39,999 (14%). More than 30% of the respondents
reported a yearly income of $50,000 and above.
Focus Group Results The focus group session began with the moderator asking the main motive for
travel. One of the most important reasons for people to travel was to experience different
cultures. Participants believed that culture was the most important reason for them to
travel. Some participants mentioned entertainment as the next reason for them to travel.
Two out of nine participants said that nature and relaxation were the main reasons for
travel.
The next question asked the participants to imagine that they were planning on
taking a vacation to a particular destination and what would be the most important
decision they had to make when selecting a destination. Most participants agreed that
accommodations were the most important factor for them. They had to find out where to
71
stay before deciding on other things. Next, the participants mentioned seeking for a
different experience. They would like to visit places that they had not visited in the past.
For example, one participant mentioned “new experience.” When choosing a destination,
it is important for her to experience new things. Another participant suggested that her
reason for choosing a vacation destination was associated to her emotional feeling. For
example, if they were in a mood for camping, they would choose places that were
isolated. However, in the winter she would choose a ski resort area. Some participants
felt that they choose a destination because of it’s proximity to water, such as a beach
resort. Also, the participants stressed that the destination should be easily accessible.
This was an important factor for them to consider the destination.
In general, when they are at the destination, most participants agreed that they
started to think about the food. Participants said that they would look around and sample
some local foods. A participant finally mentioned that he knew someone who traveled
solely for food. That person went to Portugal because he loved the fish there and that
was the only reason for him to visit. Overall, the participants agreed that they would
think about the food when they reached the destination and started thinking where to find
the local food.
Next, the group was presented with a question on the type of information sources
that they would use in order to learn more about the destination. In terms of the types of
information sources being used, most participants agreed that the internet was the most
preferable source of information that was utilized. Other sources such as television,
travel magazines, recommendations from friends and relatives were also quoted as
significance sources of information. A participant also indicated that a travel agent
72
would be important for her to find out more about a destination. Some participants re-
emphasized the importance of word of mouth and mentioned places such as Mexico and
Italy. If someone recommended and told them about their experience in those countries,
they would consider planning a visit.
The session continued with the next question that asked what specific attraction
they would be interested in experiencing during their trip. While on the trip, most
participants re-emphasized ‘culture.’ Specifically, they would like to experience the
cultures of different people at the destination. One of the participants said that, when she
was in Malaysia, she tried different types of food such as Malay, Chinese, and Indian.
However, when she visited Yellowstone, she would like to experience nature. In general,
she believed that each destination had its own uniqueness.
Subsequently, in order to extract more information on the food, a probing
question was presented to find out more details about the participants’ interest in food at
the destinations. It was important to probe this question, so that the participants could
generate more in depth opinions related to food. A few participants mentioned that
countries such as France, Italy and Thailand were known for their food; these countries
were mentioned numerous times during the session. For these countries, food would be
the main motivation to visit. Conversely, food would not be the main reason to visit
other countries. However, if the food during the trip was bad, it would totally ruin the
vacation experience. In addition, the food would also be considered as a tool to develop
relationships with the local people. For example, one of the participants mentioned that
she was in Turkey to visit her in laws. Whenever she walked on the street, the local
73
people would offer her sweets and invited her into their homes. She was very pleased
with that experience and enjoyed her entire trip.
The participants agreed that trying “hawker” or “street food” would be an
important experience during the trip. All participants agreed that good food was critical
to the overall satisfaction of a trip. They also mentioned that the experience they had on
the trip would determine a future revisit to the destination. Another participant said that
when she was in Spain, she was offered free drinks and got attracted to the culture. In
general she was amazed because the people treated her very well and she believed that
the personality and the attitude of the people made her want to revisit in the future.
The focus group continued by exploring more on the relationship between food
and tourism. The main intention was to find out more about food tourism. This would be
the most important section of the focus group because it assessed the participants
understanding of the topic being discussed. The participants had some idea about
culinary tourism. One of them mentioned Napa Valley in California offers food and wine
tourism. The main reason for people to go there was for the wine tasting that is paired
with food. Also, previously someone in the group mentioned that he went to Mexico to
try its local food. Specifically, the participants agreed that food tourism could be
associated with exploring the local cuisine and making food the main reason to visit a
destination.
Another example that came up was the food and tourism in Jamaica. Some of the
hotels in Jamaica do offer cooking classes. Chefs from various hotels and resorts
demonstrate local cooking techniques on the beach and that attracted travelers who were
interested in food to participate; this is a form of culinary tourism. A participant
74
mentioned chuck wagon food in the United States. People would go on a tour on the
chuck wagon and experience the food served during their trip. Overall, most participants
agreed strongly that there is a relationship between food and tourism. However, the
motivation to visit a destination solely based on the food would depend on the level of
interest of an individual. It could be the most important reason or it could also be the
least important reason to visit a destination.
Another probing question was presented to the participants. This question was
asked to find out the importance of food when traveling. Most participants recommended
that food was an important factor that would determine their overall vacation experience.
Again, the participants mentioned for the second time, if the food was really bad, it would
ruin the vacation experience. However, if the food was good, it would satisfy them and
that would be the main reason for them to revisit the destination in the future. Another
participant said that he and his brother traveled to a destination just to get of a bowl of
green chili with beans and hamburger. A few other examples were given that associated
food and a particular destination. Another important point that was mentioned several
times was religion. A participant mentioned how her religion would effect her decision
to visit a destination. As a Muslim, she is prohibited from eating pork. When she
thought of China, she was likely to think about restaurants that served pork there. In
addition, she said that she would not visit China for its food, but would visit for the Great
Wall of China and the Forbidden City. Her view was agreed upon by other participants
in the group.
Finally, a question was asked on the features or attributes of the food and service
that would be important for them when they traveled. The participants agreed that taste
75
and presentation of the food would be the most important. When the food is nicely
presented, it might attract people to try it. In addition, the participants suggested that if
the food was fresh and of a high quality, they would be willing to pay the price.
Analysis of the Research Questions and Hypotheses
The respondents in this study were asked to response to questions on the
destinations’ food image, the importance information sources, and intention to visit. The
same questions were used to analyze their perceptions on three destinations: France, Italy
and Thailand. In other words, the respondents in this study had to answer questions on
three different countries. However, the research questions and hypotheses of the study
were more general rather than a destination specific. For this reason, the data was
combined (pooled data), in spite of the destinations. By pooling the data of three
destinations, the data increased to 852 (284 × 3), resulting in a larger sample size.
Data analysis was divided into two sections. First, data analysis was conducted to
respond specifically to the hypotheses of the study. Second, additional data analysis was
performed to make comparisons among the destinations. In this part of the analysis, data
from each of the countries (284) were separately analyzed. The purpose was to examine
if there were any similarities or differences that might characterize the destinations’ food
image and the importance of information sources of a particular destination.
76
Research Questions One Research question one stated that, “What is the relationship between a
destination’s food image and the travelers’ intention to visit.” Factor analysis and
regression analysis were conducted to test this hypothesis. In the next section the results
were illustrated and explained.
Factor Analysis
An exploratory factor analysis was carried out on the destinations food image.
Factor analysis was performed on the data. Principal components and varimax rotation
procedures were used to identify the orthogonal factor dimensions. The benefits of using
this method is that it allows minimizing the number of variables that have high loadings
on the factor, which help to improve the interpretability of the factors and maintains the
factors as uncorrelated with each other. The latent root criterion of 1.0 was used for
factor extraction and factor loadings of .40 were significant and used for interpretation of
the results (Hair et al., 2005). Total variance accounted for by a factor is expressed in
Eigen value. Factors with a variance of less than one (<1) are considered no better than a
single variable. Thus, factors with an Eigen value of less than one (<1) were excluded in
the analysis.
77
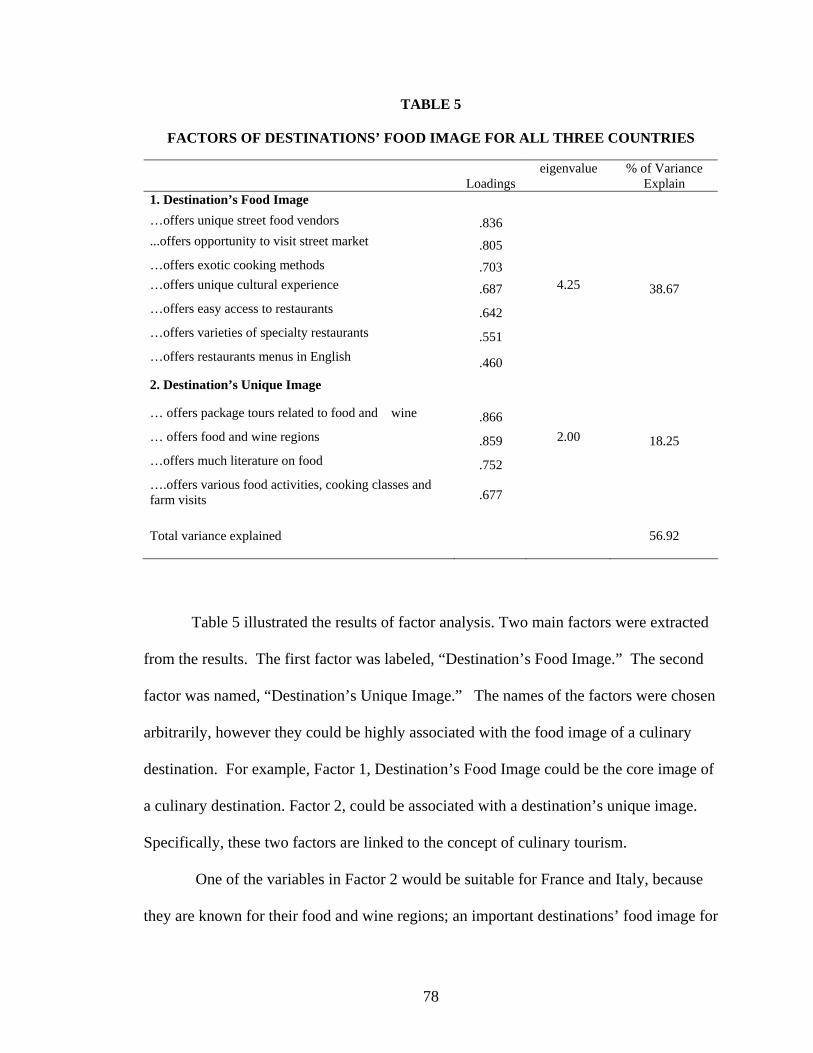
TABLE 5
FACTORS OF DESTINATIONS’ FOOD IMAGE FOR ALL THREE COUNTRIES
Loadings eigenvalue % of Variance
Explain 1. Destination’s Food Image …offers unique street food vendors .836 ...offers opportunity to visit street market .805 …offers exotic cooking methods .703 …offers unique cultural experience .687 4.25 38.67 …offers easy access to restaurants .642 …offers varieties of specialty restaurants .551 …offers restaurants menus in English .460
2. Destination’s Unique Image … offers package tours related to food and wine .866
… offers food and wine regions .859 2.00 18.25 …offers much literature on food .752
….offers various food activities, cooking classes and farm visits .677
Total variance explained
56.92
Table 5 illustrated the results of factor analysis. Two main factors were extracted
from the results. The first factor was labeled, “Destination’s Food Image.” The second
factor was named, “Destination’s Unique Image.” The names of the factors were chosen
arbitrarily, however they could be highly associated with the food image of a culinary
destination. For example, Factor 1, Destination’s Food Image could be the core image of
a culinary destination. Factor 2, could be associated with a destination’s unique image.
Specifically, these two factors are linked to the concept of culinary tourism.
One of the variables in Factor 2 would be suitable for France and Italy, because
they are known for their food and wine regions; an important destinations’ food image for
78
these two countries. However, Thailand’s could be known for its exotic cuisine rather
than for its food and wine regions. In general, these two factors explained 56.92% of the
total variance.
After conducting factor analysis, the variables in each of the factors were
computed. Two new variables were created in SPSS. These variables were regressed on
the intention to visit a culinary destination. The following table depicted the results of
regression analysis.
Regression Analysis
The multiples regression results are depicted as follows. The two factors were
regressed on the intention to visit. The R square was .091, which means 9% of the total
variance in the dependent variable could be explained by the independent variables in the
model. The F-ration was 42.089, significant at p < 0.001, indicated that the model was
reliable. No further analysis was conducted in this section.
79
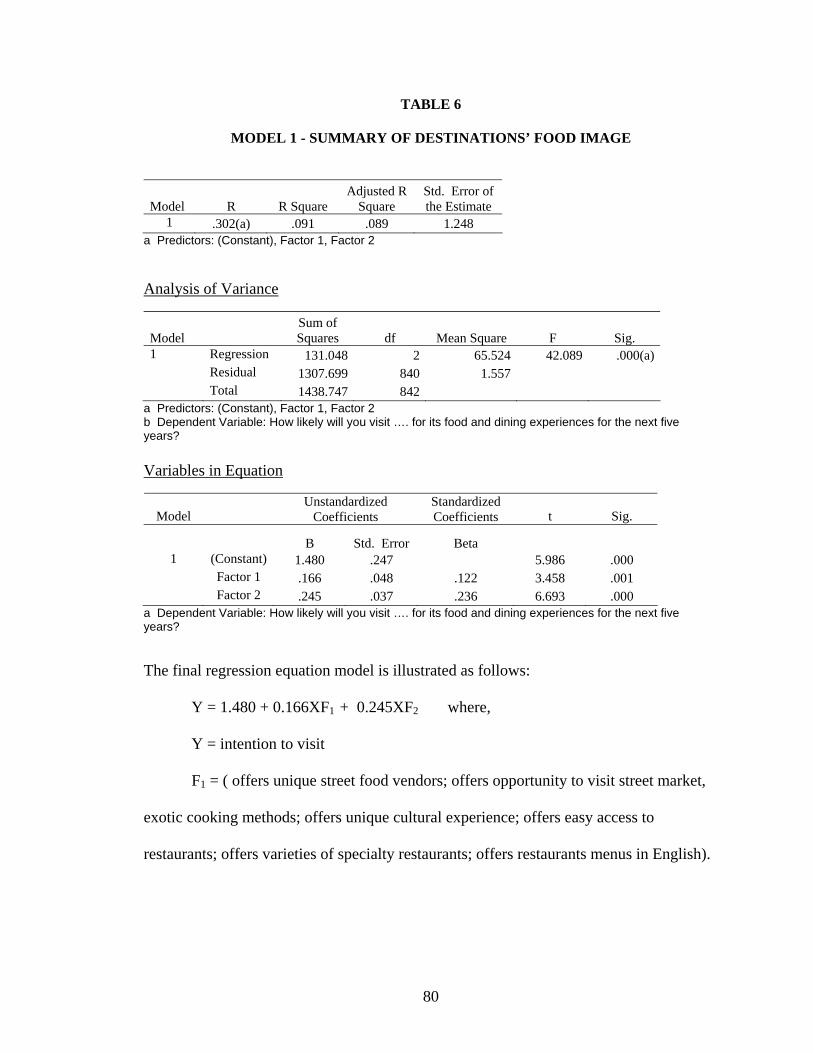
TABLE 6
MODEL 1 - SUMMARY OF DESTINATIONS’ FOOD IMAGE
Model R R Square Adjusted R
Square Std. Error of the Estimate
1 .302(a) .091 .089 1.248 a Predictors: (Constant), Factor 1, Factor 2 Analysis of Variance
Model Sum of Squares df Mean Square F Sig.
1 Regression 131.048 2 65.524 42.089 .000(a) Residual 1307.699 840 1.557 Total 1438.747 842
a Predictors: (Constant), Factor 1, Factor 2 b Dependent Variable: How likely will you visit …. for its food and dining experiences for the next five years? Variables in Equation
Model Unstandardized
Coefficients Standardized Coefficients t Sig.
B Std. Error Beta 1 (Constant) 1.480 .247 5.986 .000 Factor 1 .166 .048 .122 3.458 .001 Factor 2 .245 .037 .236 6.693 .000
a Dependent Variable: How likely will you visit …. for its food and dining experiences for the next five years? The final regression equation model is illustrated as follows:
Y = 1.480 + 0.166XF1 + 0.245XF2 where,
Y = intention to visit F1 = ( offers unique street food vendors; offers opportunity to visit street market,
exotic cooking methods; offers unique cultural experience; offers easy access to
restaurants; offers varieties of specialty restaurants; offers restaurants menus in English).
80
F2 = ( offers package tours related to food and wine; offers food and wine regions;
offers much literature on food; offers various food activities, cooking classes, and farm
visits).
By using the unstandardized coefficients, for every one unit increase in the
independent variable of Factor 2 resulted in .245 unit increase in the dependent variable
(intention to visit), while keeping other variables constant. However, when using Beta to
interpret the results, Factor 2 (Beta = .236) had the greatest influence on “intention to
visit.” In general, Factor 2 could be a core factor for a culinary destination or a
destination inspired to develop its culinary tourism products.
Additional Analysis - Comparison across Countries
Descriptive Statistics
In this study, food images attributes were divided into three countries; France,
Italy, and Thailand. These countries were selected based on the popularity of their
cuisines. As mentioned in the other section, the countries were specifically chosen
because they were mentioned several times during the focus group. The attributes were
measured using a Likert scale. The mean ratings showed the most popular attributes for
each country. In this part of the chapter, the discussion will be based on each country.
France
The mean ratings of France are displayed in Table 7. The mean scores range from
3.97 to 5.85, and therefore we can conclude that all of the attributes were perceived
positively by the respondents. There were 12 attributes that were in the high end.
81
Among the highest mean scores (<5.50) were “France offers food and wine region”
(5.85), “France offers attractive food presentation” (5.73), “France offers unique cultural
experience” (5.51). In general, more than 50 % of the means scores were higher than 5.0.
Attributes with the lower mean scores (< 4.50) were “France offers the most popular
cuisines” (4.23), “France offers friendly service personnel” (4.17), “France offers
restaurant menus in English” ( 3.97), “France offers reasonable price for dining out”
(3.76).
The attributes with the highest variation in scores was, “France offers friendly
service personnel” (1.572), closely followed by “France offers the most popular
cuisines”. The lowest standard deviation (1.288) was “France offers attractive food
presentation.”
82
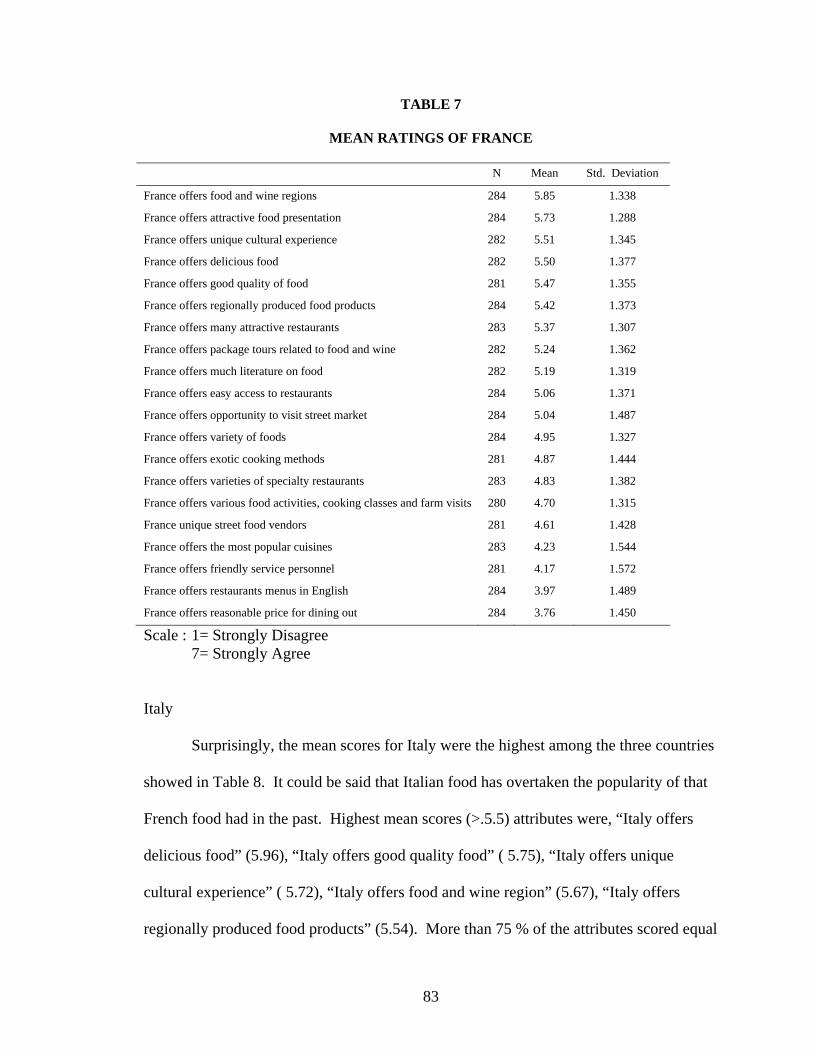
TABLE 7
MEAN RATINGS OF FRANCE N Mean Std. Deviation
France offers food and wine regions 284 5.85 1.338
France offers attractive food presentation 284 5.73 1.288
France offers unique cultural experience 282 5.51 1.345
France offers delicious food 282 5.50 1.377
France offers good quality of food 281 5.47 1.355
France offers regionally produced food products 284 5.42 1.373
France offers many attractive restaurants 283 5.37 1.307
France offers package tours related to food and wine 282 5.24 1.362
France offers much literature on food 282 5.19 1.319
France offers easy access to restaurants 284 5.06 1.371
France offers opportunity to visit street market 284 5.04 1.487
France offers variety of foods 284 4.95 1.327
France offers exotic cooking methods 281 4.87 1.444
France offers varieties of specialty restaurants 283 4.83 1.382
France offers various food activities, cooking classes and farm visits 280 4.70 1.315
France unique street food vendors 281 4.61 1.428
France offers the most popular cuisines 283 4.23 1.544
France offers friendly service personnel 281 4.17 1.572
France offers restaurants menus in English 284 3.97 1.489
France offers reasonable price for dining out 284 3.76 1.450
Scale : 1= Strongly Disagree 7= Strongly Agree
Italy
Surprisingly, the mean scores for Italy were the highest among the three countries
showed in Table 8. It could be said that Italian food has overtaken the popularity of that
French food had in the past. Highest mean scores (>.5.5) attributes were, “Italy offers
delicious food” (5.96), “Italy offers good quality food” ( 5.75), “Italy offers unique
cultural experience” ( 5.72), “Italy offers food and wine region” (5.67), “Italy offers
regionally produced food products” (5.54). More than 75 % of the attributes scored equal
83
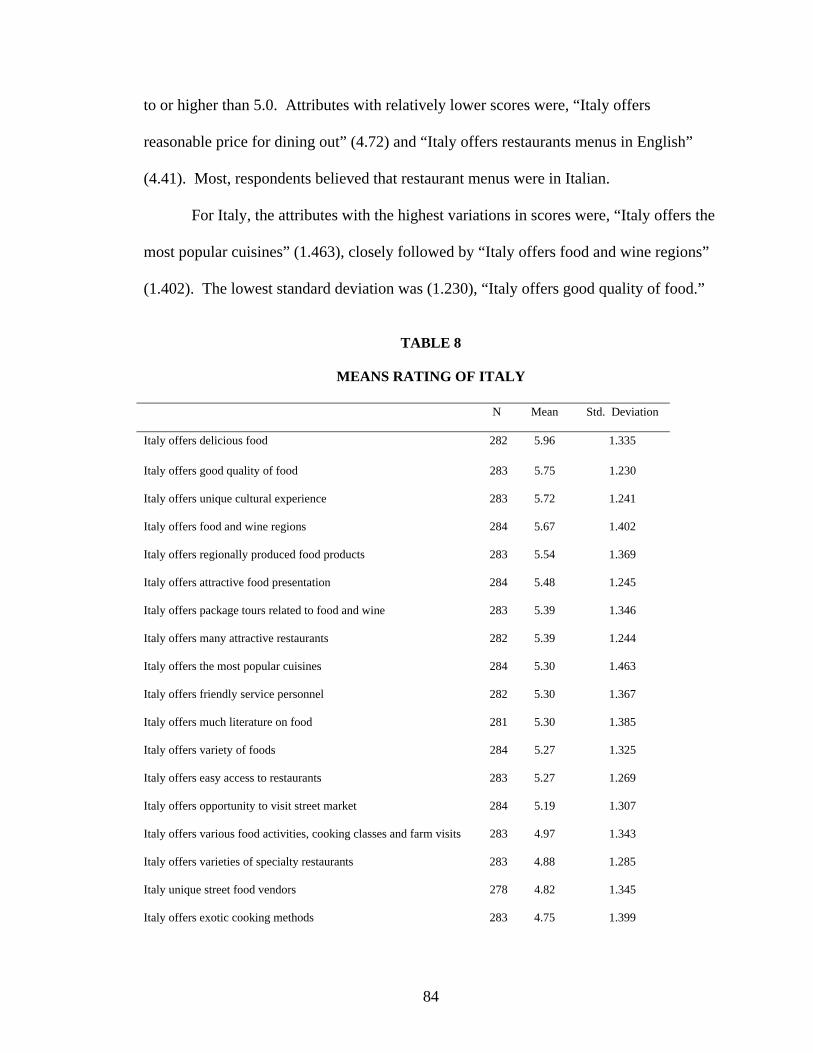
to or higher than 5.0. Attributes with relatively lower scores were, “Italy offers
reasonable price for dining out” (4.72) and “Italy offers restaurants menus in English”
(4.41). Most, respondents believed that restaurant menus were in Italian.
For Italy, the attributes with the highest variations in scores were, “Italy offers the
most popular cuisines” (1.463), closely followed by “Italy offers food and wine regions”
(1.402). The lowest standard deviation was (1.230), “Italy offers good quality of food.”
TABLE 8
MEANS RATING OF ITALY
N Mean Std. Deviation
Italy offers delicious food
282 5.96 1.335
Italy offers good quality of food 283 5.75 1.230
Italy offers unique cultural experience 283 5.72 1.241
Italy offers food and wine regions 284 5.67 1.402
Italy offers regionally produced food products 283 5.54 1.369
Italy offers attractive food presentation 284 5.48 1.245
Italy offers package tours related to food and wine 283 5.39 1.346
Italy offers many attractive restaurants 282 5.39 1.244
Italy offers the most popular cuisines 284 5.30 1.463
Italy offers friendly service personnel 282 5.30 1.367
Italy offers much literature on food 281 5.30 1.385
Italy offers variety of foods 284 5.27 1.325
Italy offers easy access to restaurants 283 5.27 1.269
Italy offers opportunity to visit street market 284 5.19 1.307
Italy offers various food activities, cooking classes and farm visits 283 4.97 1.343
Italy offers varieties of specialty restaurants 283 4.88 1.285
Italy unique street food vendors 278 4.82 1.345
Italy offers exotic cooking methods 283 4.75 1.399
84
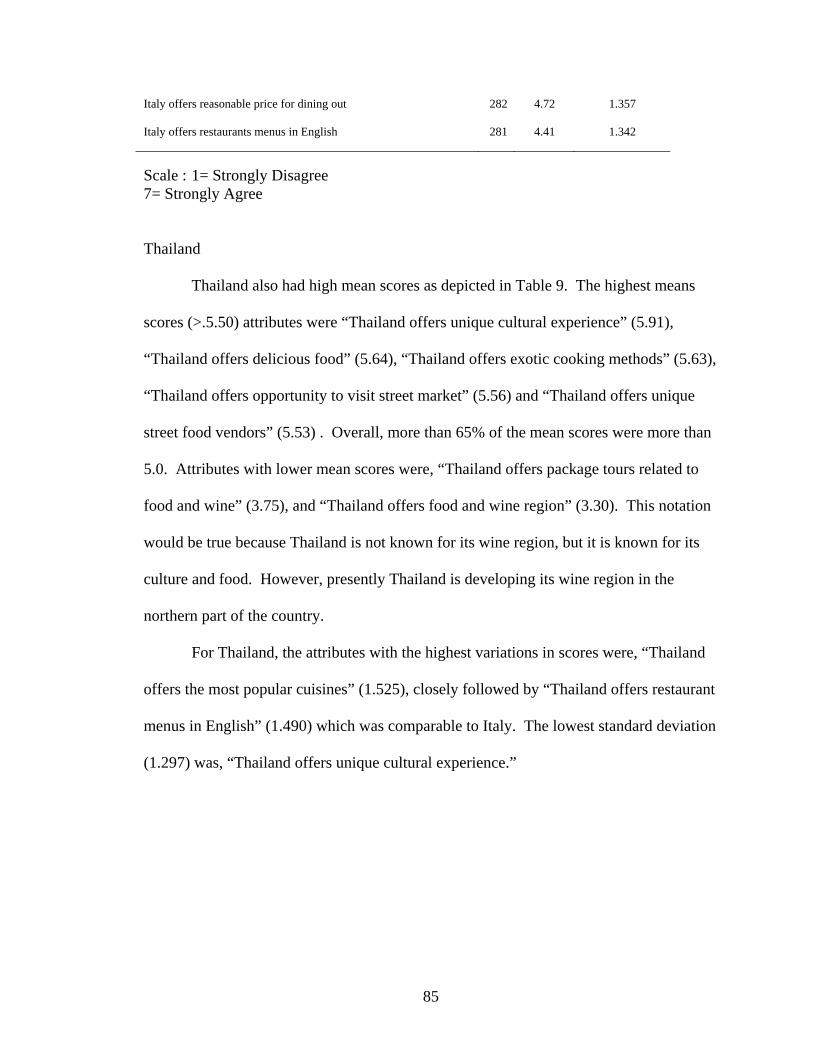
Italy offers reasonable price for dining out 282 4.72 1.357
Italy offers restaurants menus in English 281 4.41 1.342
Scale : 1= Strongly Disagree 7= Strongly Agree
Thailand
Thailand also had high mean scores as depicted in Table 9. The highest means
scores (>.5.50) attributes were “Thailand offers unique cultural experience” (5.91),
“Thailand offers delicious food” (5.64), “Thailand offers exotic cooking methods” (5.63),
“Thailand offers opportunity to visit street market” (5.56) and “Thailand offers unique
street food vendors” (5.53) . Overall, more than 65% of the mean scores were more than
5.0. Attributes with lower mean scores were, “Thailand offers package tours related to
food and wine” (3.75), and “Thailand offers food and wine region” (3.30). This notation
would be true because Thailand is not known for its wine region, but it is known for its
culture and food. However, presently Thailand is developing its wine region in the
northern part of the country.
For Thailand, the attributes with the highest variations in scores were, “Thailand
offers the most popular cuisines” (1.525), closely followed by “Thailand offers restaurant
menus in English” (1.490) which was comparable to Italy. The lowest standard deviation
(1.297) was, “Thailand offers unique cultural experience.”
85
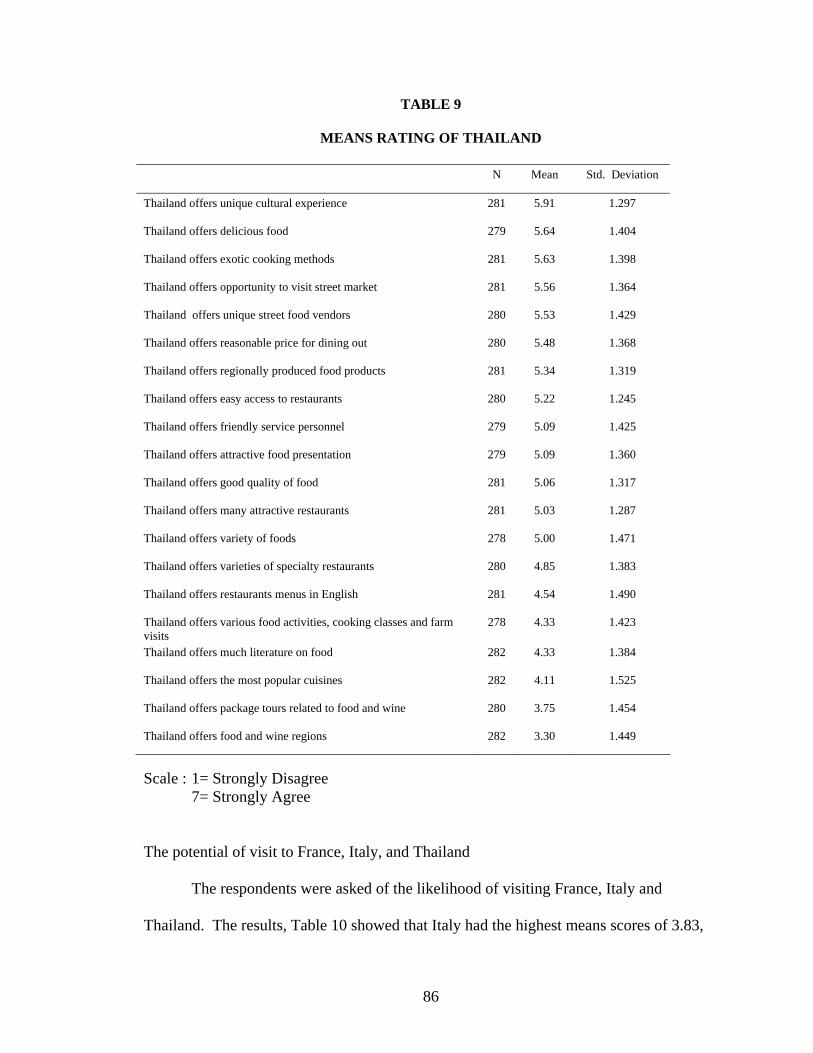
TABLE 9
MEANS RATING OF THAILAND
N Mean Std. Deviation
Thailand offers unique cultural experience 281 5.91 1.297
Thailand offers delicious food 279 5.64 1.404
Thailand offers exotic cooking methods 281 5.63 1.398
Thailand offers opportunity to visit street market 281 5.56 1.364
Thailand offers unique street food vendors 280 5.53 1.429
Thailand offers reasonable price for dining out 280 5.48 1.368
Thailand offers regionally produced food products 281 5.34 1.319
Thailand offers easy access to restaurants 280 5.22 1.245
Thailand offers friendly service personnel 279 5.09 1.425
Thailand offers attractive food presentation 279 5.09 1.360
Thailand offers good quality of food 281 5.06 1.317
Thailand offers many attractive restaurants 281 5.03 1.287
Thailand offers variety of foods 278 5.00 1.471
Thailand offers varieties of specialty restaurants 280 4.85 1.383
Thailand offers restaurants menus in English 281 4.54 1.490
Thailand offers various food activities, cooking classes and farm visits
278 4.33 1.423
Thailand offers much literature on food 282 4.33 1.384
Thailand offers the most popular cuisines 282 4.11 1.525
Thailand offers package tours related to food and wine 280 3.75 1.454
Thailand offers food and wine regions 282 3.30 1.449
Scale : 1= Strongly Disagree 7= Strongly Agree
The potential of visit to France, Italy, and Thailand
The respondents were asked of the likelihood of visiting France, Italy and
Thailand. The results, Table 10 showed that Italy had the highest means scores of 3.83,
86
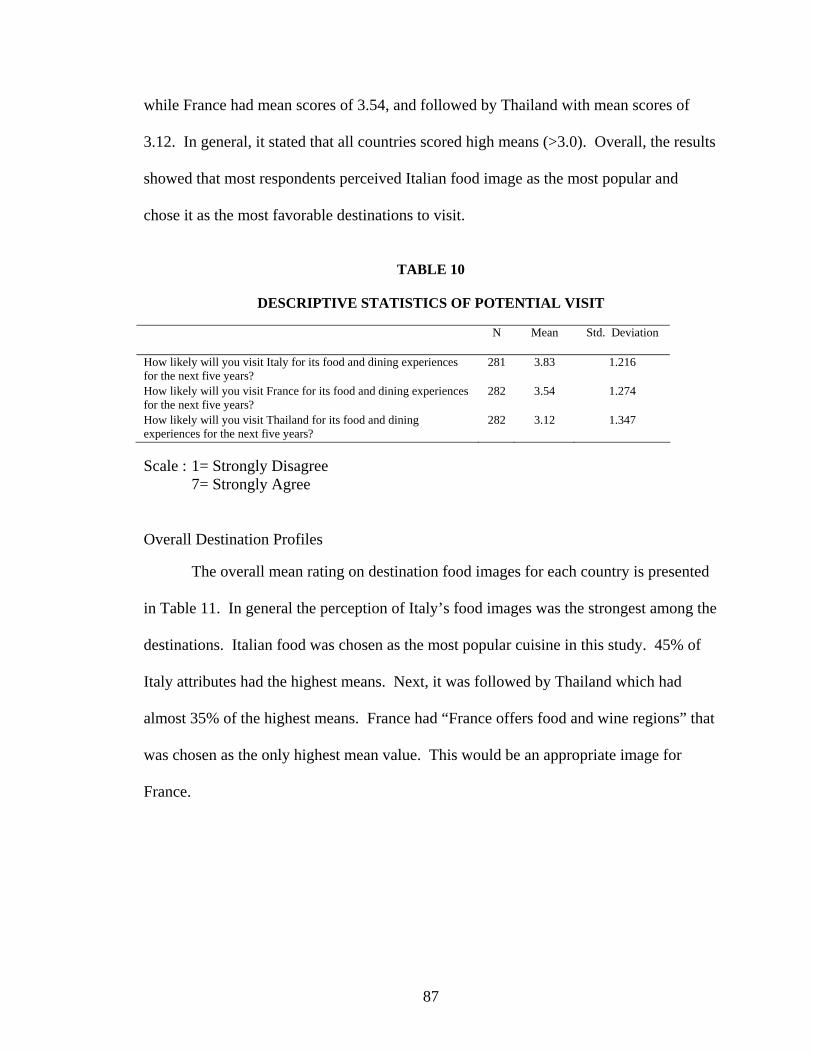
while France had mean scores of 3.54, and followed by Thailand with mean scores of
3.12. In general, it stated that all countries scored high means (>3.0). Overall, the results
showed that most respondents perceived Italian food image as the most popular and
chose it as the most favorable destinations to visit.
TABLE 10
DESCRIPTIVE STATISTICS OF POTENTIAL VISIT
N Mean Std. Deviation
How likely will you visit Italy for its food and dining experiences for the next five years?
281 3.83 1.216
How likely will you visit France for its food and dining experiences for the next five years?
282 3.54 1.274
How likely will you visit Thailand for its food and dining experiences for the next five years?
282 3.12 1.347
Scale : 1= Strongly Disagree 7= Strongly Agree Overall Destination Profiles The overall mean rating on destination food images for each country is presented
in Table 11. In general the perception of Italy’s food images was the strongest among the
destinations. Italian food was chosen as the most popular cuisine in this study. 45% of
Italy attributes had the highest means. Next, it was followed by Thailand which had
almost 35% of the highest means. France had “France offers food and wine regions” that
was chosen as the only highest mean value. This would be an appropriate image for
France.
87
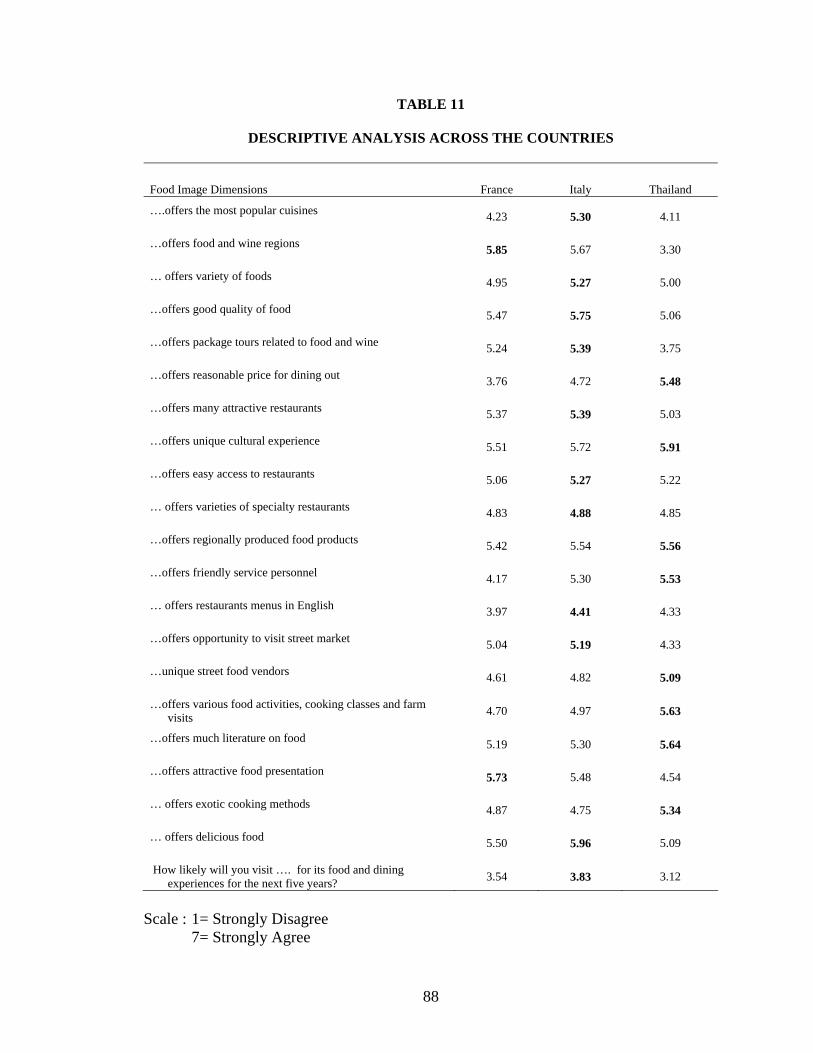
TABLE 11
DESCRIPTIVE ANALYSIS ACROSS THE COUNTRIES
Food Image Dimensions France Italy Thailand
….offers the most popular cuisines 4.23 5.30 4.11
…offers food and wine regions 5.85 5.67 3.30
… offers variety of foods 4.95 5.27 5.00
…offers good quality of food 5.47 5.75 5.06
…offers package tours related to food and wine 5.24 5.39 3.75
…offers reasonable price for dining out 3.76 4.72 5.48
…offers many attractive restaurants 5.37 5.39 5.03
…offers unique cultural experience 5.51 5.72 5.91
…offers easy access to restaurants 5.06 5.27 5.22
… offers varieties of specialty restaurants 4.83 4.88 4.85
…offers regionally produced food products 5.42 5.54 5.56
…offers friendly service personnel 4.17 5.30 5.53
… offers restaurants menus in English 3.97 4.41 4.33
…offers opportunity to visit street market 5.04 5.19 4.33
…unique street food vendors 4.61 4.82 5.09
…offers various food activities, cooking classes and farm visits 4.70 4.97 5.63
…offers much literature on food 5.19 5.30 5.64
…offers attractive food presentation 5.73 5.48 4.54
… offers exotic cooking methods 4.87 4.75 5.34
… offers delicious food 5.50 5.96 5.09
How likely will you visit …. for its food and dining experiences for the next five years? 3.54 3.83 3.12
Scale : 1= Strongly Disagree 7= Strongly Agree
88
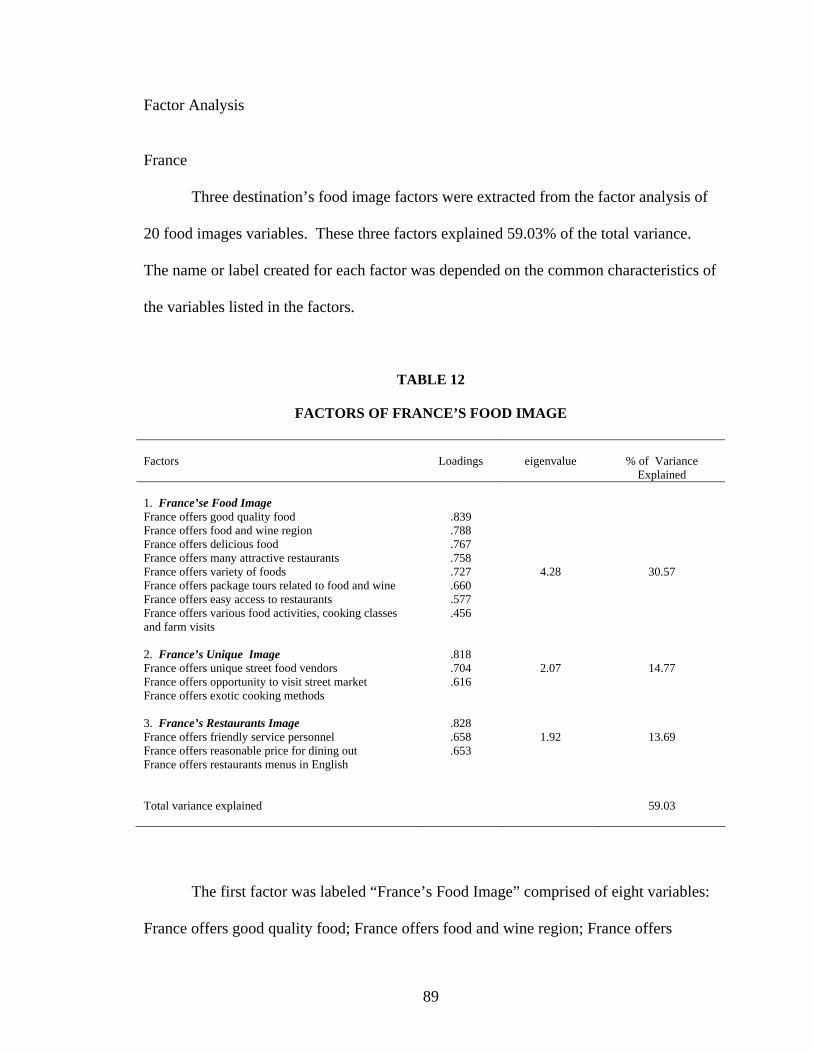
Factor Analysis France Three destination’s food image factors were extracted from the factor analysis of
20 food images variables. These three factors explained 59.03% of the total variance.
The name or label created for each factor was depended on the common characteristics of
the variables listed in the factors.
TABLE 12
FACTORS OF FRANCE’S FOOD IMAGE Factors
Loadings
eigenvalue
% of Variance
Explained 1. France’se Food Image France offers good quality food France offers food and wine region France offers delicious food France offers many attractive restaurants France offers variety of foods France offers package tours related to food and wine France offers easy access to restaurants France offers various food activities, cooking classes and farm visits 2. France’s Unique Image France offers unique street food vendors France offers opportunity to visit street market France offers exotic cooking methods 3. France’s Restaurants Image France offers friendly service personnel France offers reasonable price for dining out France offers restaurants menus in English Total variance explained
.839
.788
.767
.758
.727
.660
.577
.456
.818
.704
.616
.828
.658
.653
4.28
2.07
1.92
30.57
14.77
13.69
59.03
The first factor was labeled “France’s Food Image” comprised of eight variables:
France offers good quality food; France offers food and wine region; France offers
89
delicious food; France offers many attractive restaurants; France offers variety of foods;
France offers package tours related to food and wine; France offers easy access to
restaurants; and France offers various food activities, cooking classes and farm visits;
with Eigen value of 4.28, this factor explained 30.57% of the total variance.
The second factor was named “France Unique Culinary Image” consisted of three
variables: France offers unique street food vendors; France offers opportunity to visit
street market; and France offers exotic cooking methods. This factor had an eigenvalue
of 2.07 and total variance of 14.77%.
The third factor was labeled “France’s Restaurant Image” contained three
variables: France offers friendly service personnel, France offers reasonable price for
dining out, and France offers restaurant menus in English. This factor had an eigenvalue
of 1.92 and total variance of 13.69%.
Italy
Two destinations’ food image factors were extracted from the factor analysis of
20 food image variables. These two factors explained 57.51% of the total variance. Each
factor was labeled based on the common characteristics of the variables listed in the
factors.
90
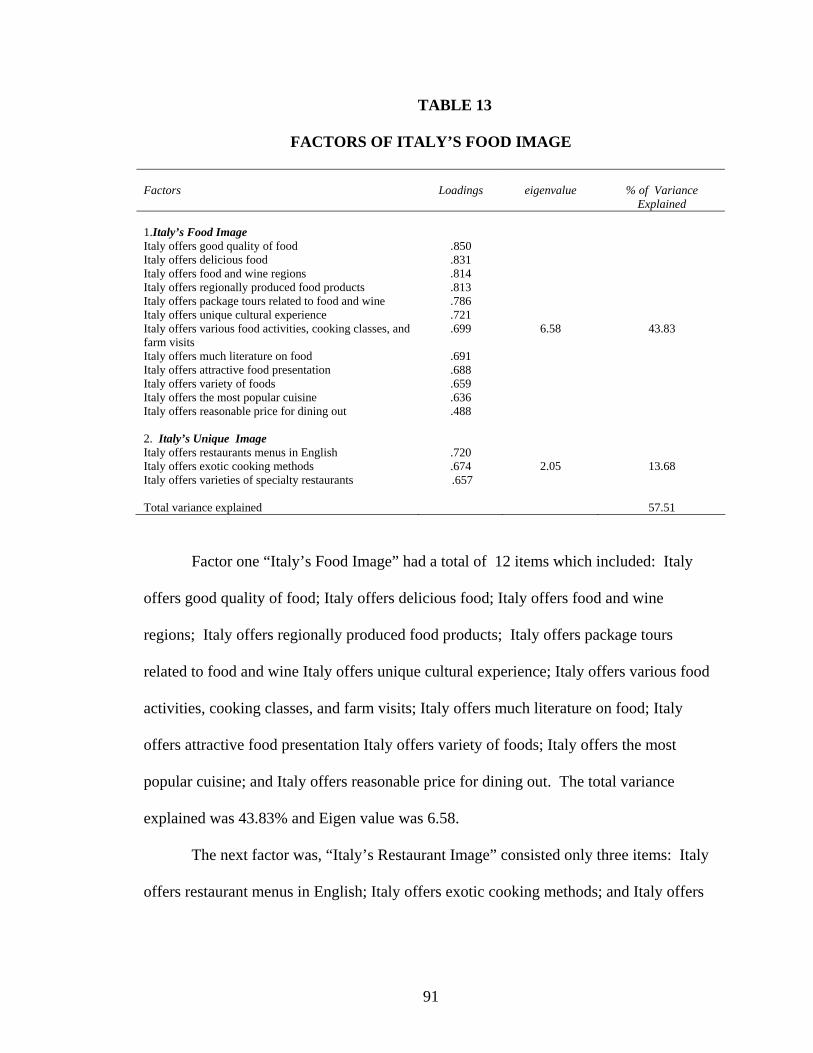
TABLE 13
FACTORS OF ITALY’S FOOD IMAGE Factors
Loadings
eigenvalue
% of Variance
Explained 1.Italy’s Food Image Italy offers good quality of food Italy offers delicious food Italy offers food and wine regions Italy offers regionally produced food products Italy offers package tours related to food and wine Italy offers unique cultural experience Italy offers various food activities, cooking classes, and farm visits Italy offers much literature on food Italy offers attractive food presentation Italy offers variety of foods Italy offers the most popular cuisine Italy offers reasonable price for dining out 2. Italy’s Unique Image Italy offers restaurants menus in English Italy offers exotic cooking methods Italy offers varieties of specialty restaurants Total variance explained
.850
.831
.814
.813
.786
.721
.699
.691
.688
.659
.636
.488
.720
.674 .657
6.58
2.05
43.83
13.68
57.51
Factor one “Italy’s Food Image” had a total of 12 items which included: Italy
offers good quality of food; Italy offers delicious food; Italy offers food and wine
regions; Italy offers regionally produced food products; Italy offers package tours
related to food and wine Italy offers unique cultural experience; Italy offers various food
activities, cooking classes, and farm visits; Italy offers much literature on food; Italy
offers attractive food presentation Italy offers variety of foods; Italy offers the most
popular cuisine; and Italy offers reasonable price for dining out. The total variance
explained was 43.83% and Eigen value was 6.58.
The next factor was, “Italy’s Restaurant Image” consisted only three items: Italy
offers restaurant menus in English; Italy offers exotic cooking methods; and Italy offers
91
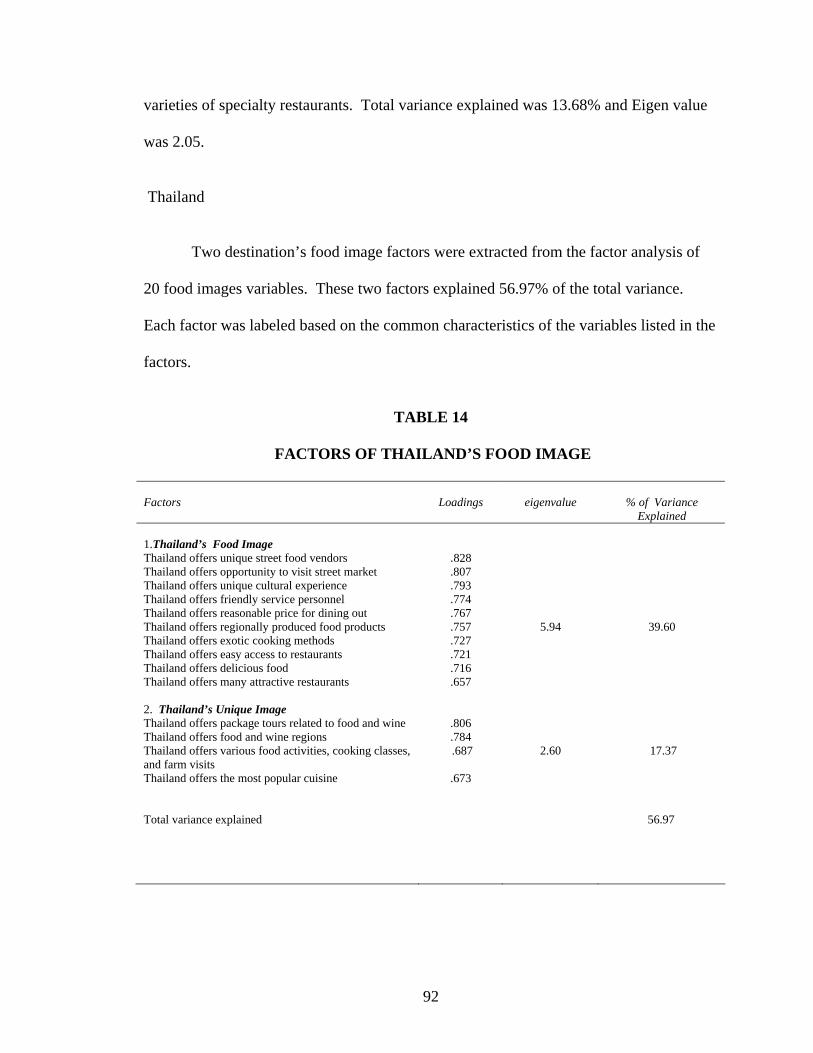
varieties of specialty restaurants. Total variance explained was 13.68% and Eigen value
was 2.05.
Thailand
Two destination’s food image factors were extracted from the factor analysis of
20 food images variables. These two factors explained 56.97% of the total variance.
Each factor was labeled based on the common characteristics of the variables listed in the
factors.
TABLE 14
FACTORS OF THAILAND’S FOOD IMAGE
Factors
Loadings
eigenvalue
% of Variance
Explained 1.Thailand’s Food Image Thailand offers unique street food vendors Thailand offers opportunity to visit street market Thailand offers unique cultural experience Thailand offers friendly service personnel Thailand offers reasonable price for dining out Thailand offers regionally produced food products Thailand offers exotic cooking methods Thailand offers easy access to restaurants Thailand offers delicious food Thailand offers many attractive restaurants 2. Thailand’s Unique Image Thailand offers package tours related to food and wine Thailand offers food and wine regions Thailand offers various food activities, cooking classes, and farm visits Thailand offers the most popular cuisine Total variance explained
.828
.807
.793
.774
.767
.757
.727
.721
.716
.657
.806
.784 .687
.673
5.94
2.60
39.60
17.37
56.97
92
The first factor was labeled “ Thailand’s Food Image” comprised of ten
variables: Thailand offers unique street food vendors; Thailand offers opportunity to
visit street market; Thailand offers unique cultural experience; Thailand offers friendly
service personnel; Thailand offers reasonable price for dining out; Thailand offers
regionally produced food products; Thailand offers exotic cooking methods; Thailand
offers easy access to restaurants; Thailand offers delicious food; and Thailand offers
many attractive restaurants. The total variance explained was 39.60% and the Eigen
value was 5.94.
The second factor for Thailand was “Thailand’s Unique Image” comprised of four
items: Thailand offers package tours related to food and wine; Thailand offers food and
wine regions; Thailand offers various food activities, cooking classes, and farm visits;
and Thailand offers the most popular cuisine. This total variance accounted for by this
factor was 17.37% and the eigenvalue was 2.60.
93
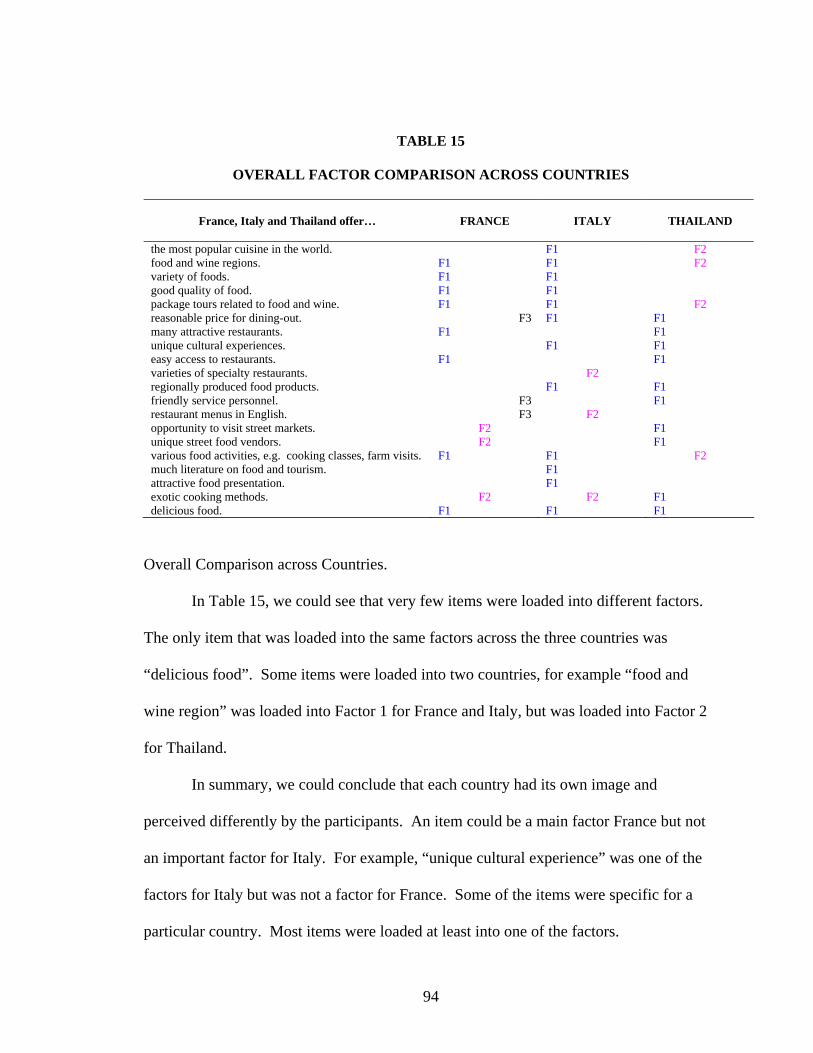
TABLE 15
OVERALL FACTOR COMPARISON ACROSS COUNTRIES
France, Italy and Thailand offer…
FRANCE
ITALY
THAILAND
the most popular cuisine in the world. F1 F2 food and wine regions. F1 F1 F2 variety of foods. F1 F1 good quality of food. F1 F1 package tours related to food and wine. F1 F1 F2 reasonable price for dining-out. F3 F1 F1 many attractive restaurants. F1 F1 unique cultural experiences. F1 F1 easy access to restaurants. F1 F1 varieties of specialty restaurants. F2 regionally produced food products. F1 F1 friendly service personnel. F3 F1 restaurant menus in English. F3 F2 opportunity to visit street markets. F2 F1 unique street food vendors. F2 F1 various food activities, e.g. cooking classes, farm visits. F1 F1 F2 much literature on food and tourism. F1 attractive food presentation. F1 exotic cooking methods. F2 F2 F1 delicious food. F1 F1 F1
Overall Comparison across Countries.
In Table 15, we could see that very few items were loaded into different factors.
The only item that was loaded into the same factors across the three countries was
“delicious food”. Some items were loaded into two countries, for example “food and
wine region” was loaded into Factor 1 for France and Italy, but was loaded into Factor 2
for Thailand.
In summary, we could conclude that each country had its own image and
perceived differently by the participants. An item could be a main factor France but not
an important factor for Italy. For example, “unique cultural experience” was one of the
factors for Italy but was not a factor for France. Some of the items were specific for a
particular country. Most items were loaded at least into one of the factors.
94
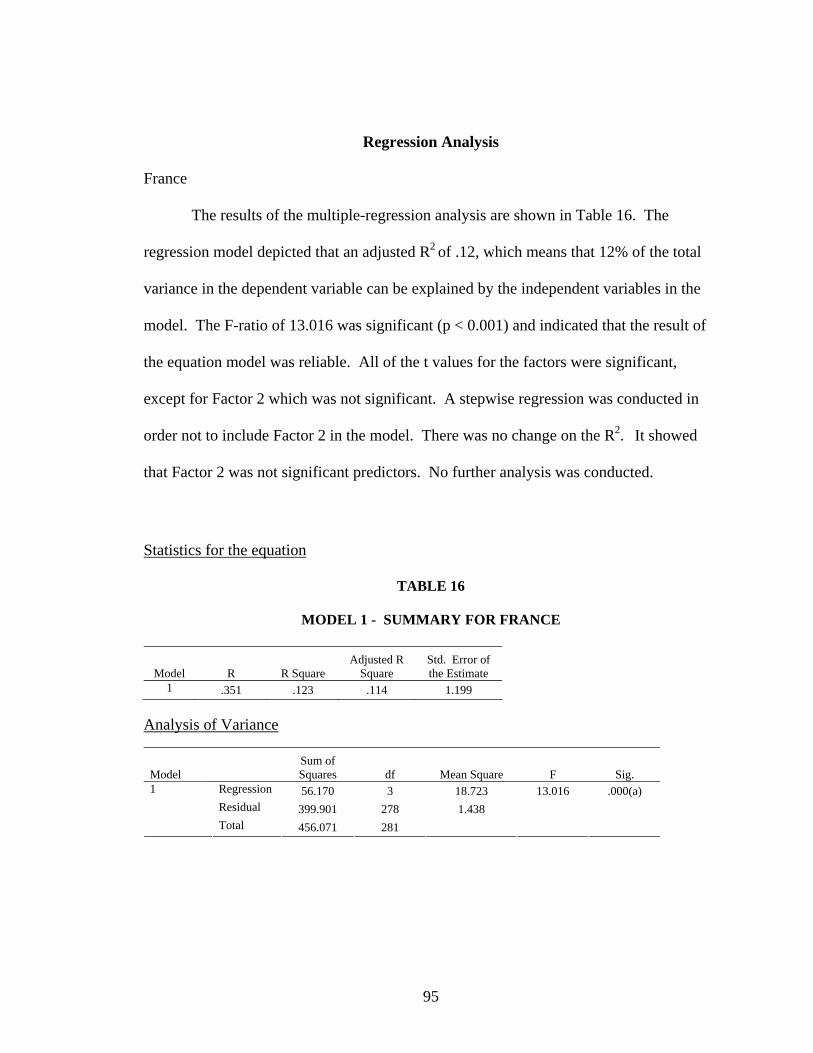
Regression Analysis
France
The results of the multiple-regression analysis are shown in Table 16. The
regression model depicted that an adjusted R2 of .12, which means that 12% of the total
variance in the dependent variable can be explained by the independent variables in the
model. The F-ratio of 13.016 was significant (p < 0.001) and indicated that the result of
the equation model was reliable. All of the t values for the factors were significant,
except for Factor 2 which was not significant. A stepwise regression was conducted in
order not to include Factor 2 in the model. There was no change on the R2. It showed
that Factor 2 was not significant predictors. No further analysis was conducted.
Statistics for the equation
TABLE 16
MODEL 1 - SUMMARY FOR FRANCE
Model R R Square Adjusted R
Square Std. Error of the Estimate
1 .351 .123 .114 1.199
Analysis of Variance
Model Sum of Squares df Mean Square F Sig.
Regression 56.170 3 18.723 13.016 .000(a) Residual 399.901 278 1.438
1
Total 456.071 281
95
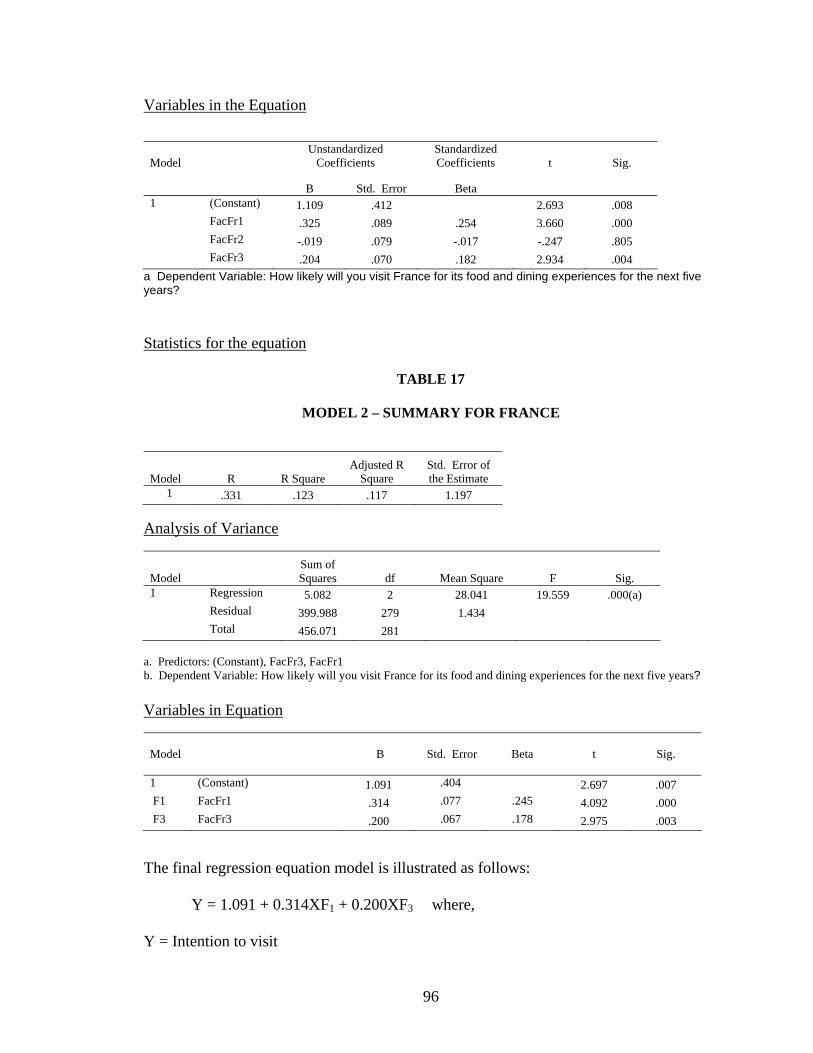
Variables in the Equation
Model Unstandardized
Coefficients Standardized Coefficients t Sig.
B Std. Error Beta 1 (Constant) 1.109 .412 2.693 .008 FacFr1 .325 .089 .254 3.660 .000 FacFr2 -.019 .079 -.017 -.247 .805 FacFr3 .204 .070 .182 2.934 .004
a Dependent Variable: How likely will you visit France for its food and dining experiences for the next five years? Statistics for the equation
TABLE 17
MODEL 2 – SUMMARY FOR FRANCE
Model R R Square Adjusted R
Square Std. Error of the Estimate
1 .331 .123 .117 1.197 Analysis of Variance
Model Sum of Squares df Mean Square F Sig.
1 Regression 5.082 2 28.041 19.559 .000(a) Residual 399.988 279 1.434 Total 456.071 281
a. Predictors: (Constant), FacFr3, FacFr1 b. Dependent Variable: How likely will you visit France for its food and dining experiences for the next five years? Variables in Equation
Model B
Std. Error
Beta t Sig. 1 (Constant) 1.091 .404 2.697 .007 F1 FacFr1 .314 .077 .245 4.092 .000 F3 FacFr3 .200 .067 .178 2.975 .003
The final regression equation model is illustrated as follows:
Y = 1.091 + 0.314XF1 + 0.200XF3 where,
Y = Intention to visit
96
FI = (France offers good quality food; France offers food and wine region; France offers
delicious food; France offers many attractive restaurants; France offers variety of foods;
France offers package tours related to food and wine; France offers easy access to
restaurants; and France offers various food activities, cooking classes and farm visits)
F3 = (France offers friendly service personnel; France offers reasonable price for dining
out; and France offers restaurants menus in English)
By using the unstandardized coefficients, for every one unit increase in the
independent variable of Factor 1 resulted in .314 unit increase in the dependent variable
(intention to visit) while keeping other variables constant. However, when using Beta to
interpret the results, Factor 1 (Beta = .245) had the greatest influence on “intention to
visit” and Factor 2 (Beta = .178) had the second strongest influence on “intention to
visit”.
Italy
The results for Italy are shown as follows. The regression model depicted R2 of
.067, which means that only 6% of the total variance in the dependent variable can be
explained by the independent variables in the model. The F-ratio of 10.028, was
significant at p < 0.001 and indicated that the results of the equation model was reliable.
The t value for Factor 2 was not significant and was dropped in the next regression. A
second regression was performed. This model was regressed using only Factor 1 on the
dependent variable. There was no change on the R2. Factor 2 was not a significant
predictor for Italy. The F- ratio was increased to 20.117 and it was significant at p <
0.001. No further analysis was conducted in this section.
97
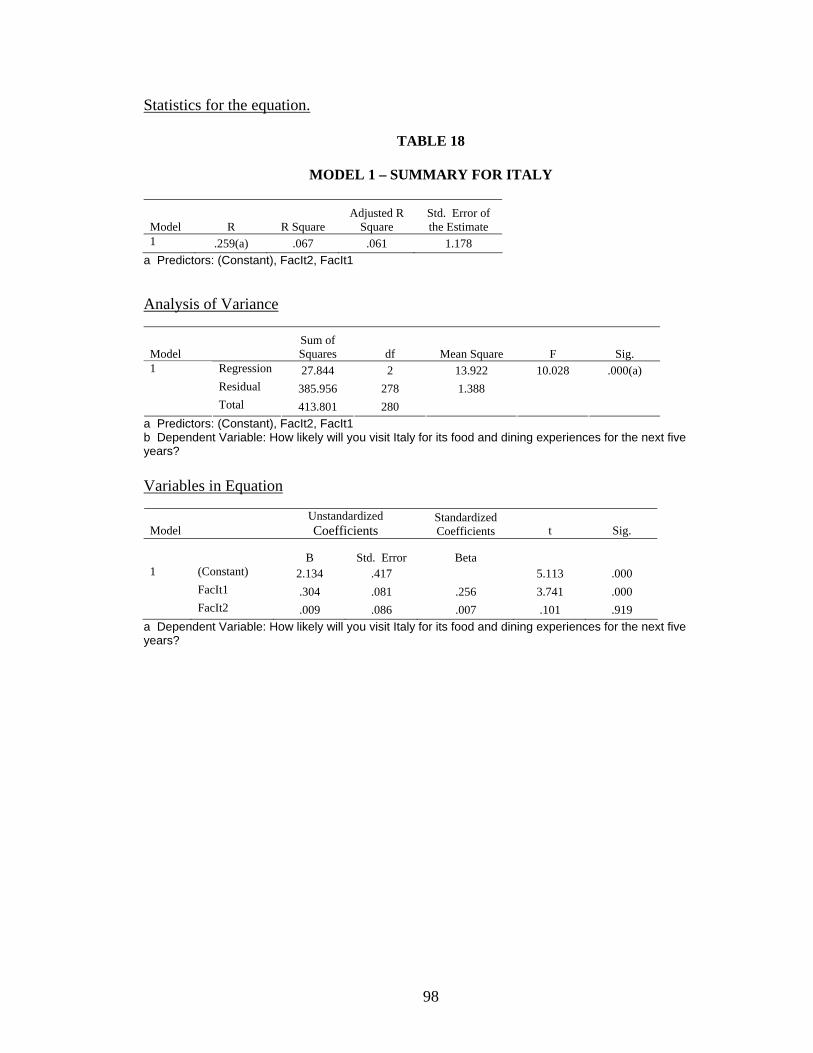
Statistics for the equation.
TABLE 18
MODEL 1 – SUMMARY FOR ITALY
Model R R Square Adjusted R
Square Std. Error of the Estimate
1 .259(a) .067 .061 1.178 a Predictors: (Constant), FacIt2, FacIt1 Analysis of Variance
Model Sum of Squares df Mean Square F Sig.
Regression 27.844 2 13.922 10.028 .000(a) Residual 385.956 278 1.388
1
Total 413.801 280 a Predictors: (Constant), FacIt2, FacIt1 b Dependent Variable: How likely will you visit Italy for its food and dining experiences for the next five years? Variables in Equation
Model Unstandardized Coefficients
Standardized Coefficients t Sig.
B Std. Error Beta 1 (Constant) 2.134 .417 5.113 .000 FacIt1 .304 .081 .256 3.741 .000 FacIt2 .009 .086 .007 .101 .919
a Dependent Variable: How likely will you visit Italy for its food and dining experiences for the next five years?
98

TABLE 19
MODEL 2 – SUMMARY FOR ITALY
Model R R Square Adjusted R
Square Std. Error of the Estimate
1 .259(a) .067 .064 1.176 a Predictors: (Constant), FacIt1 Analysis of Variance
Model Sum of Squares df Mean Square F Sig.
1 Regression 27.830 1 27.830 20.117 .000(a) Residual 385.970 279 1.383 Total 413.801 280
a Predictors: (Constant), FacIt1 b Dependent Variable: How likely will you visit Italy for its food and dining experiences for the next five years? Variables in Equation
Model Unstandardized
Coefficients Standardized Coefficients t Sig.
B Std. Error Beta 1 (Constant) 2.151 .381 5.652 .000 FacIt1 .309 .069 .259 4.485 .000
a Dependent Variable: How likely will you visit Italy for its food and dining experiences for the next five years? The final regression equation model is illustrated as follows:
Y = 2.151 + 0.309XF1 where,
Y = intention to visit F1 = (Italy offers good quality of food; Italy offers delicious food; Italy offers
food and wine regions; Italy offers regionally produced food products; Italy offers
package tours related to food and wine; Italy offers unique cultural experience; Italy
offers various food activities, cooking classes, and farm visits; Italy offers much literature
on food; Italy offers attractive food presentation; Italy offers variety of foods; Italy offers
the most popular cuisine; and Italy offers reasonable price for dining out)
99
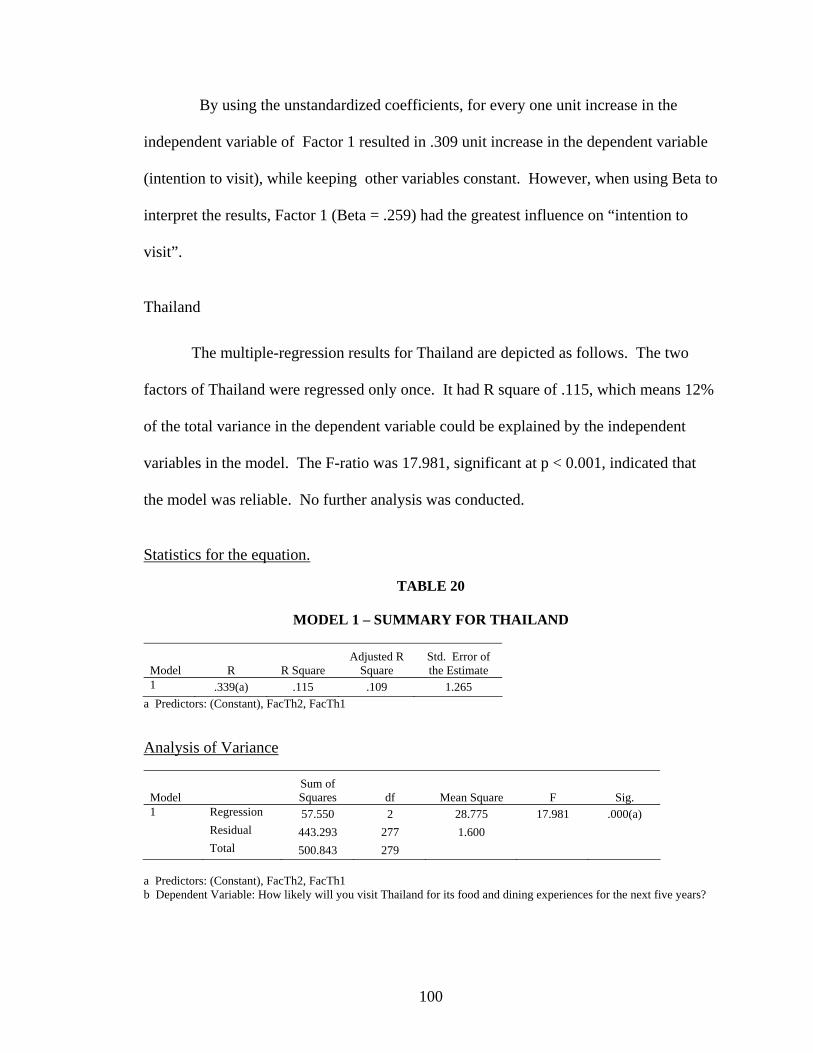
By using the unstandardized coefficients, for every one unit increase in the
independent variable of Factor 1 resulted in .309 unit increase in the dependent variable
(intention to visit), while keeping other variables constant. However, when using Beta to
interpret the results, Factor 1 (Beta = .259) had the greatest influence on “intention to
visit”.
Thailand
The multiple-regression results for Thailand are depicted as follows. The two
factors of Thailand were regressed only once. It had R square of .115, which means 12%
of the total variance in the dependent variable could be explained by the independent
variables in the model. The F-ratio was 17.981, significant at p < 0.001, indicated that
the model was reliable. No further analysis was conducted.
Statistics for the equation.
TABLE 20
MODEL 1 – SUMMARY FOR THAILAND
Model R R Square Adjusted R
Square Std. Error of the Estimate
1 .339(a) .115 .109 1.265 a Predictors: (Constant), FacTh2, FacTh1 Analysis of Variance
Model Sum of Squares df Mean Square F Sig.
1 Regression 57.550 2 28.775 17.981 .000(a) Residual 443.293 277 1.600 Total 500.843 279
a Predictors: (Constant), FacTh2, FacTh1 b Dependent Variable: How likely will you visit Thailand for its food and dining experiences for the next five years?
100
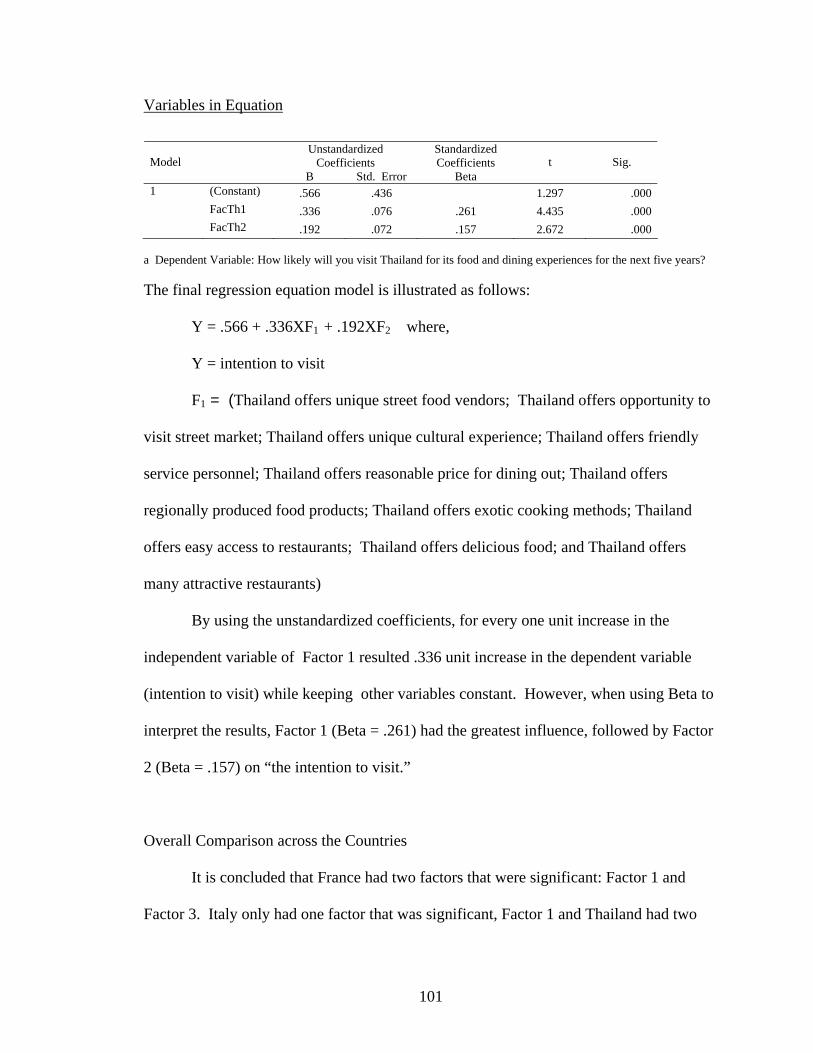
Variables in Equation
Model Unstandardized
Coefficients Standardized Coefficients t Sig.
B Std. Error Beta 1 (Constant) .566 .436 1.297 .000 FacTh1 .336 .076 .261 4.435 .000 FacTh2 .192 .072 .157 2.672 .000
a Dependent Variable: How likely will you visit Thailand for its food and dining experiences for the next five years? The final regression equation model is illustrated as follows:
Y = .566 + .336XF1 + .192XF2 where,
Y = intention to visit F1 = (Thailand offers unique street food vendors; Thailand offers opportunity to
visit street market; Thailand offers unique cultural experience; Thailand offers friendly
service personnel; Thailand offers reasonable price for dining out; Thailand offers
regionally produced food products; Thailand offers exotic cooking methods; Thailand
offers easy access to restaurants; Thailand offers delicious food; and Thailand offers
many attractive restaurants)
By using the unstandardized coefficients, for every one unit increase in the
independent variable of Factor 1 resulted .336 unit increase in the dependent variable
(intention to visit) while keeping other variables constant. However, when using Beta to
interpret the results, Factor 1 (Beta = .261) had the greatest influence, followed by Factor
2 (Beta = .157) on “the intention to visit.”
Overall Comparison across the Countries
It is concluded that France had two factors that were significant: Factor 1 and
Factor 3. Italy only had one factor that was significant, Factor 1 and Thailand had two
101
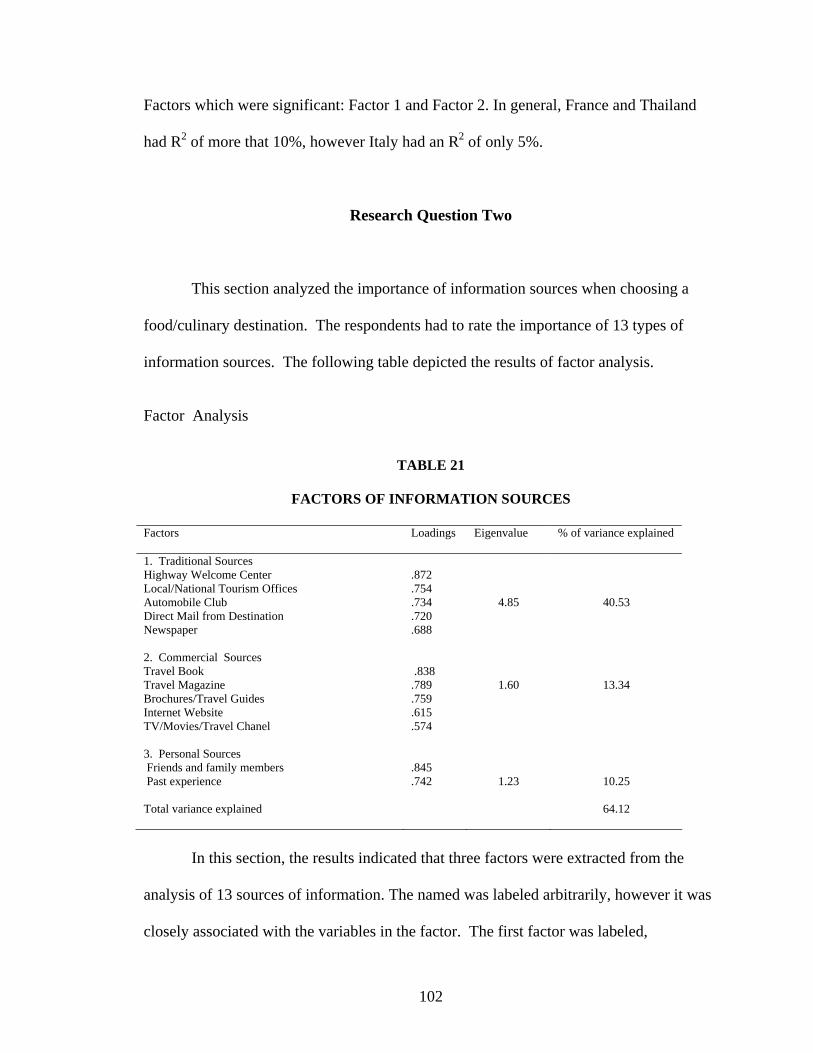
Factors which were significant: Factor 1 and Factor 2. In general, France and Thailand
had R2 of more that 10%, however Italy had an R2 of only 5%.
Research Question Two
This section analyzed the importance of information sources when choosing a
food/culinary destination. The respondents had to rate the importance of 13 types of
information sources. The following table depicted the results of factor analysis.
Factor Analysis
TABLE 21
FACTORS OF INFORMATION SOURCES Factors
Loadings Eigenvalue % of variance explained
1. Traditional Sources Highway Welcome Center Local/National Tourism Offices Automobile Club Direct Mail from Destination Newspaper
.872 .754 .734 .720 .688
4.85
40.53
2. Commercial Sources Travel Book Travel Magazine Brochures/Travel Guides Internet Website TV/Movies/Travel Chanel
.838 .789 .759 .615 .574
1.60
13.34
3. Personal Sources Friends and family members Past experience
.845 .742
1.23
10.25
Total variance explained
64.12
In this section, the results indicated that three factors were extracted from the
analysis of 13 sources of information. The named was labeled arbitrarily, however it was
closely associated with the variables in the factor. The first factor was labeled,
102
“Traditional Sources”, and was comprised of five variables: highway welcome center,
local/national tourism offices, automobile club, direct mail from destination and
newspaper. The eigenvalue was 4.85 and this factor explained 40.53% of the total
variance.
The second factor was named, “Commercial Sources” and was comprised of five
items: travel book, travel magazine, brochures/travel guides, internet website,
V/Movies/Travel Chanel. This factor had eigenvalue of 1.60 and explained 13.34% of the
total variance.
Lastly, the third factor, “Personal Sources”, had only 2 items: friends and family
members and past experience. “Travel Agency/Company” was not loaded into any of the
factors. In summary, these factors were importance to travelers before making decision to
visit a culinary destination. The exclusion of travel agents showed that current travelers
are not relaying on travel agents; which could probably due to the internet explosion in
the past decade.
Regression Analysis
This analysis was conducted in order to determine how much the factors could
predict the intention to visit. Multiple- regression is a statistical technique that can be
used to examine the relationship between a dependent variable and multiple independent
variables (Hair et al., 2005).
A regression equation model can be represented as follows:
Y = b0 + b1 V1 + b1 V2 + ……………+ bn Vn + E
103
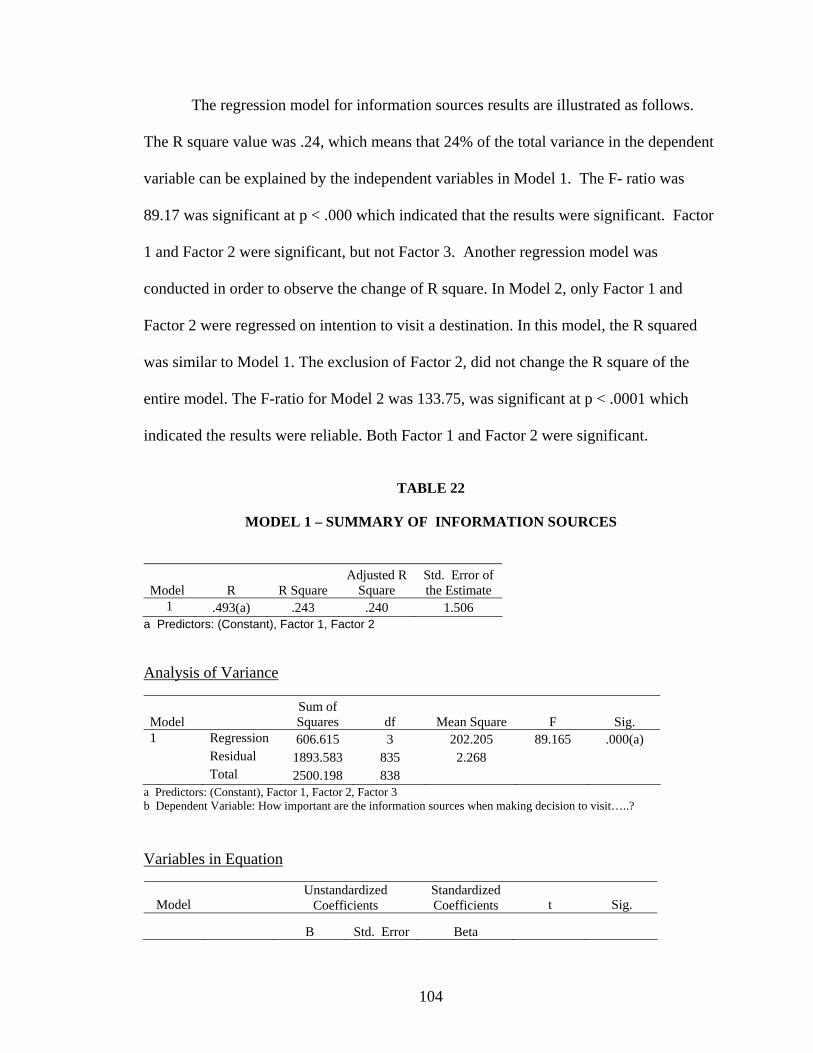
The regression model for information sources results are illustrated as follows.
The R square value was .24, which means that 24% of the total variance in the dependent
variable can be explained by the independent variables in Model 1. The F- ratio was
89.17 was significant at p < .000 which indicated that the results were significant. Factor
1 and Factor 2 were significant, but not Factor 3. Another regression model was
conducted in order to observe the change of R square. In Model 2, only Factor 1 and
Factor 2 were regressed on intention to visit a destination. In this model, the R squared
was similar to Model 1. The exclusion of Factor 2, did not change the R square of the
entire model. The F-ratio for Model 2 was 133.75, was significant at p < .0001 which
indicated the results were reliable. Both Factor 1 and Factor 2 were significant.
TABLE 22
MODEL 1 – SUMMARY OF INFORMATION SOURCES
Model R R Square Adjusted R
Square Std. Error of the Estimate
1 .493(a) .243 .240 1.506 a Predictors: (Constant), Factor 1, Factor 2 Analysis of Variance
Model Sum of Squares df Mean Square F Sig.
1 Regression 606.615 3 202.205 89.165 .000(a) Residual 1893.583 835 2.268 Total 2500.198 838
a Predictors: (Constant), Factor 1, Factor 2, Factor 3 b Dependent Variable: How important are the information sources when making decision to visit…..? Variables in Equation
Model Unstandardized
Coefficients Standardized Coefficients t Sig.
B Std. Error Beta
104
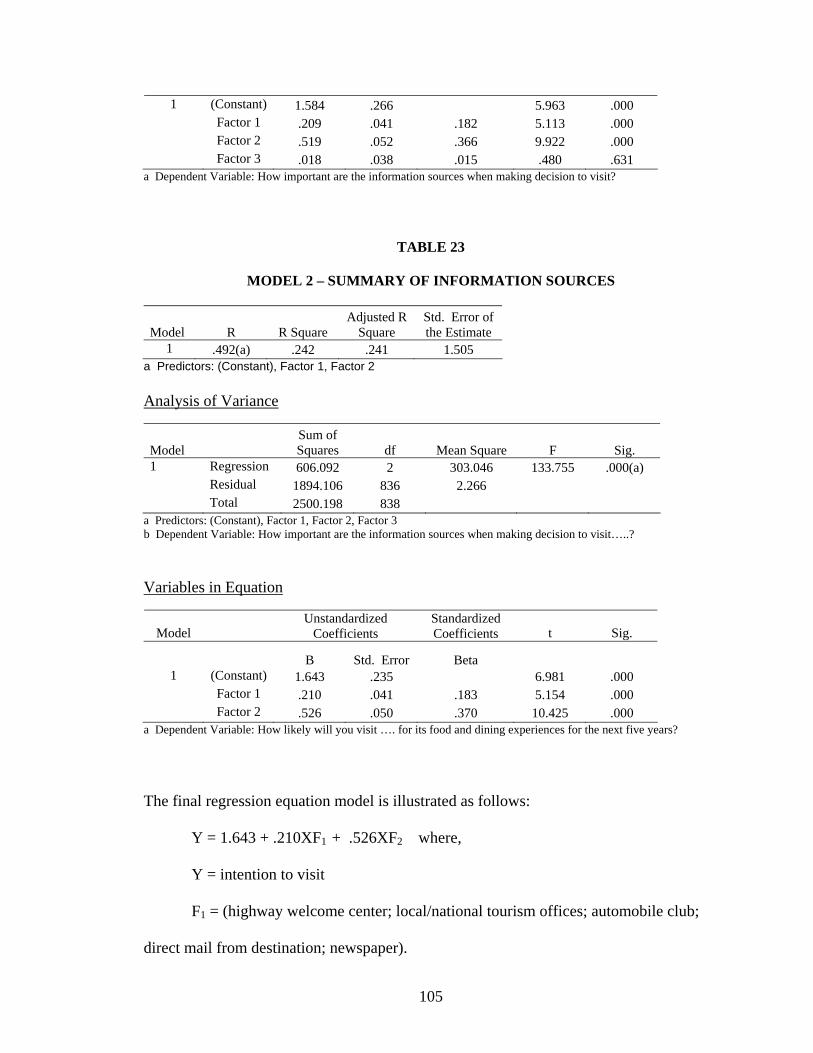
1 (Constant) 1.584 .266 5.963 .000 Factor 1 .209 .041 .182 5.113 .000 Factor 2 .519 .052 .366 9.922 .000 Factor 3 .018 .038 .015 .480 .631
a Dependent Variable: How important are the information sources when making decision to visit?
TABLE 23
MODEL 2 – SUMMARY OF INFORMATION SOURCES
Model R R Square Adjusted R
Square Std. Error of the Estimate
1 .492(a) .242 .241 1.505 a Predictors: (Constant), Factor 1, Factor 2 Analysis of Variance
Model Sum of Squares df Mean Square F Sig.
1 Regression 606.092 2 303.046 133.755 .000(a) Residual 1894.106 836 2.266 Total 2500.198 838
a Predictors: (Constant), Factor 1, Factor 2, Factor 3 b Dependent Variable: How important are the information sources when making decision to visit…..? Variables in Equation
Model Unstandardized
Coefficients Standardized Coefficients t Sig.
B Std. Error Beta 1 (Constant) 1.643 .235 6.981 .000 Factor 1 .210 .041 .183 5.154 .000 Factor 2 .526 .050 .370 10.425 .000
a Dependent Variable: How likely will you visit …. for its food and dining experiences for the next five years? The final regression equation model is illustrated as follows:
Y = 1.643 + .210XF1 + .526XF2 where,
Y = intention to visit
F1 = (highway welcome center; local/national tourism offices; automobile club;
direct mail from destination; newspaper).
105
F2 = (travel book; travel magazine; brochures/travel guides; internet website;
TV/movies/travel channel).
By using the unstandardized coefficients, for every one unit increase in the
independent variable of Factor 1 and Factor 2 resulted in .210 and .526 unit increase in
the dependent variable (intention to visit) respectively, while keeping other variables
constant. However, when using Beta to interpret the results, Factor 2 (Beta = .379) had
the greatest influence on “intention to visit”. In general, Factor 2 could be a core factor
of information sources than can be utilized to promote and market a culinary destination.
Additional Analysis - Comparison across Countries
France
The mean ratings for France are illustrated in Table 24 . In general, five mean
ratings were higher that five (> 5). The highest mean rating was “internet/website”
(5.84), second was “past experience” (5.55), and followed by “friends and family
members”. The other three mean ratings higher than five were “travel book” (5.47),
“brochures/travel guides” (5.24) and “travel magazine”. Four mean ratings were on the
medium range, (> 4). Those variables were, “tv, movies/travel channel” (4.98), “travel
agency/company” (4.73), “local and tourism offices” (4.67), and “newspaper” (4.02).
Three mean ratings were found to be lower than four (<4), “direct mail from
destinations” (3.95), “highway welcome center” (3.68), and “automobile shop” (3.38)
being the lowest scores.
The attributes with the highest deviation in scores was, “automobile club” (2.015),
followed by “highway welcome center” (1.965). The lowest standard deviation was
106
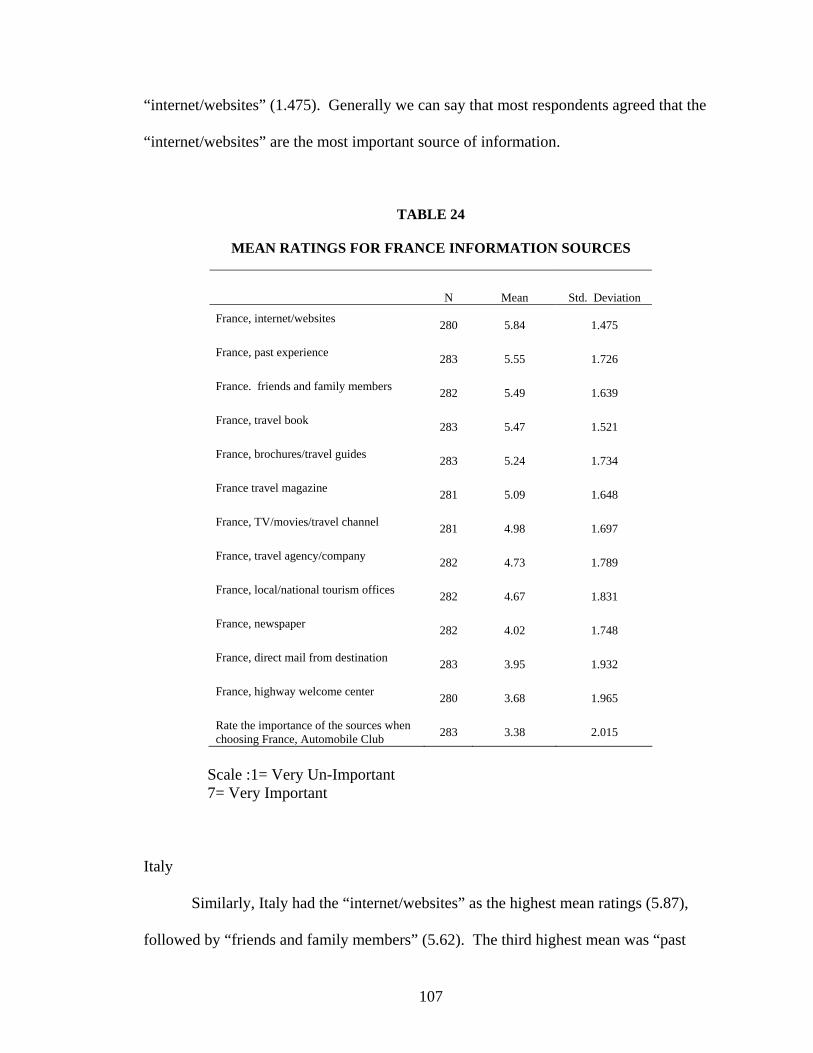
“internet/websites” (1.475). Generally we can say that most respondents agreed that the
“internet/websites” are the most important source of information.
TABLE 24
MEAN RATINGS FOR FRANCE INFORMATION SOURCES
N Mean Std. Deviation
France, internet/websites 280 5.84 1.475
France, past experience 283 5.55 1.726
France. friends and family members 282 5.49 1.639
France, travel book 283 5.47 1.521
France, brochures/travel guides 283 5.24 1.734
France travel magazine 281 5.09 1.648
France, TV/movies/travel channel 281 4.98 1.697
France, travel agency/company 282 4.73 1.789
France, local/national tourism offices 282 4.67 1.831
France, newspaper 282 4.02 1.748
France, direct mail from destination 283 3.95 1.932
France, highway welcome center 280 3.68 1.965
Rate the importance of the sources when choosing France, Automobile Club 283 3.38 2.015
Scale :1= Very Un-Important 7= Very Important Italy
Similarly, Italy had the “internet/websites” as the highest mean ratings (5.87),
followed by “friends and family members” (5.62). The third highest mean was “past
107
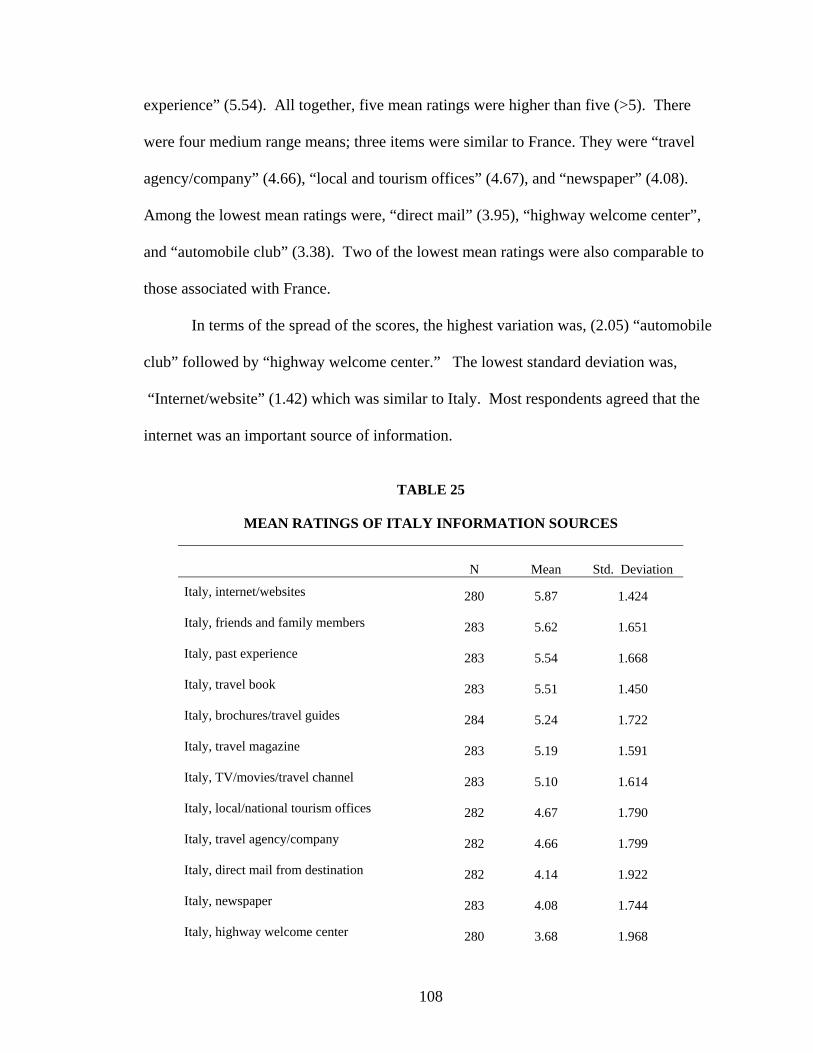
experience” (5.54). All together, five mean ratings were higher than five (>5). There
were four medium range means; three items were similar to France. They were “travel
agency/company” (4.66), “local and tourism offices” (4.67), and “newspaper” (4.08).
Among the lowest mean ratings were, “direct mail” (3.95), “highway welcome center”,
and “automobile club” (3.38). Two of the lowest mean ratings were also comparable to
those associated with France.
In terms of the spread of the scores, the highest variation was, (2.05) “automobile
club” followed by “highway welcome center.” The lowest standard deviation was,
“Internet/website” (1.42) which was similar to Italy. Most respondents agreed that the
internet was an important source of information.
TABLE 25
MEAN RATINGS OF ITALY INFORMATION SOURCES
N Mean Std. Deviation
Italy, internet/websites 280 5.87 1.424
Italy, friends and family members 283 5.62 1.651
Italy, past experience 283 5.54 1.668
Italy, travel book 283 5.51 1.450
Italy, brochures/travel guides 284 5.24 1.722
Italy, travel magazine 283 5.19 1.591
Italy, TV/movies/travel channel 283 5.10 1.614
Italy, local/national tourism offices 282 4.67 1.790
Italy, travel agency/company 282 4.66 1.799
Italy, direct mail from destination 282 4.14 1.922
Italy, newspaper 283 4.08 1.744
Italy, highway welcome center 280 3.68 1.968
108
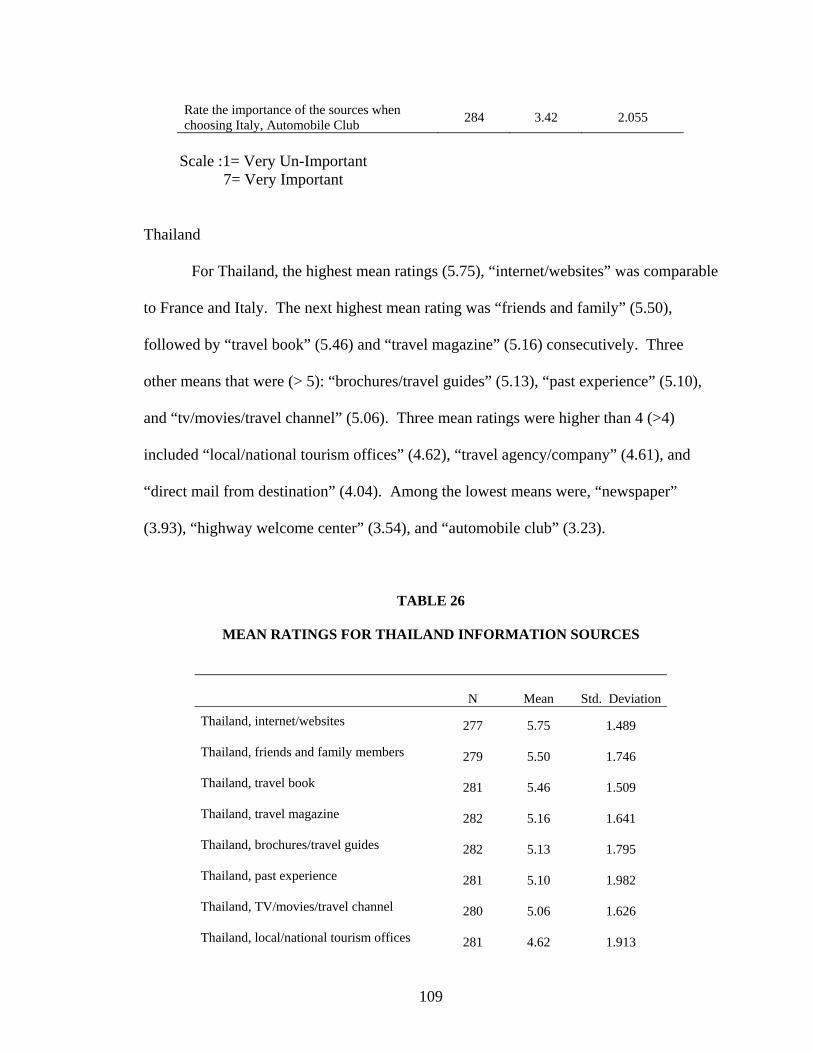
Rate the importance of the sources when choosing Italy, Automobile Club 284 3.42 2.055
Scale :1= Very Un-Important 7= Very Important Thailand
For Thailand, the highest mean ratings (5.75), “internet/websites” was comparable
to France and Italy. The next highest mean rating was “friends and family” (5.50),
followed by “travel book” (5.46) and “travel magazine” (5.16) consecutively. Three
other means that were (> 5): “brochures/travel guides” (5.13), “past experience” (5.10),
and “tv/movies/travel channel” (5.06). Three mean ratings were higher than 4 (>4)
included “local/national tourism offices” (4.62), “travel agency/company” (4.61), and
“direct mail from destination” (4.04). Among the lowest means were, “newspaper”
(3.93), “highway welcome center” (3.54), and “automobile club” (3.23).
TABLE 26
MEAN RATINGS FOR THAILAND INFORMATION SOURCES
N Mean Std. Deviation
Thailand, internet/websites 277 5.75 1.489
Thailand, friends and family members 279 5.50 1.746
Thailand, travel book 281 5.46 1.509
Thailand, travel magazine 282 5.16 1.641
Thailand, brochures/travel guides 282 5.13 1.795
Thailand, past experience 281 5.10 1.982
Thailand, TV/movies/travel channel 280 5.06 1.626
Thailand, local/national tourism offices 281 4.62 1.913
109
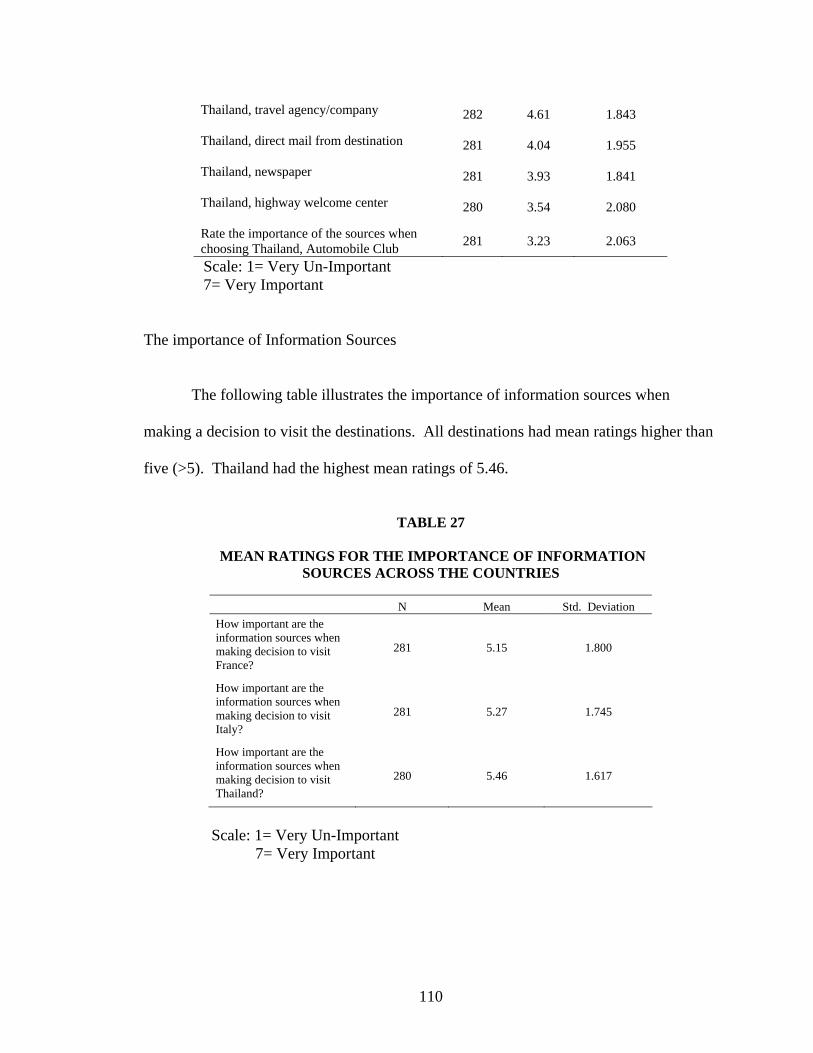
Thailand, travel agency/company 282 4.61 1.843
Thailand, direct mail from destination 281 4.04 1.955
Thailand, newspaper 281 3.93 1.841
Thailand, highway welcome center 280 3.54 2.080
Rate the importance of the sources when choosing Thailand, Automobile Club 281 3.23 2.063
Scale: 1= Very Un-Important 7= Very Important The importance of Information Sources The following table illustrates the importance of information sources when
making a decision to visit the destinations. All destinations had mean ratings higher than
five (>5). Thailand had the highest mean ratings of 5.46.
TABLE 27
MEAN RATINGS FOR THE IMPORTANCE OF INFORMATION
SOURCES ACROSS THE COUNTRIES
N Mean Std. Deviation How important are the information sources when making decision to visit France?
281 5.15 1.800
How important are the information sources when making decision to visit Italy?
281 5.27 1.745
How important are the information sources when making decision to visit Thailand?
280 5.46 1.617
Scale: 1= Very Un-Important
7= Very Important
110
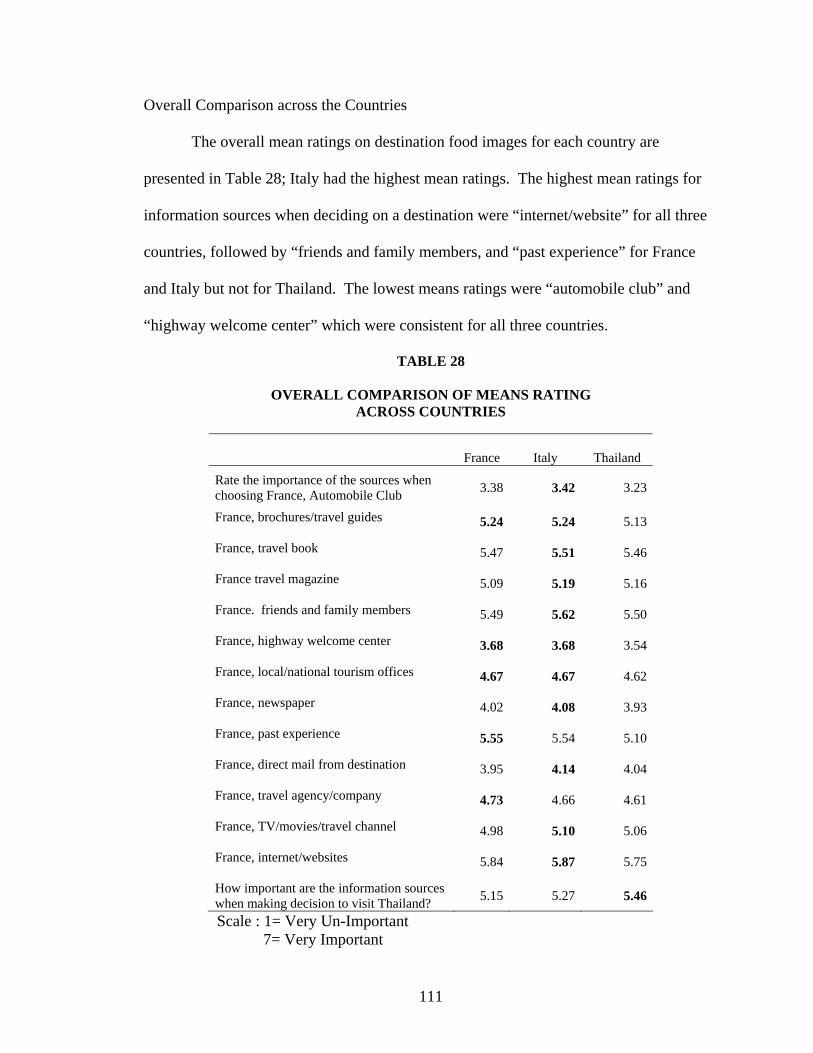
Overall Comparison across the Countries The overall mean ratings on destination food images for each country are
presented in Table 28; Italy had the highest mean ratings. The highest mean ratings for
information sources when deciding on a destination were “internet/website” for all three
countries, followed by “friends and family members, and “past experience” for France
and Italy but not for Thailand. The lowest means ratings were “automobile club” and
“highway welcome center” which were consistent for all three countries.
TABLE 28
OVERALL COMPARISON OF MEANS RATING ACROSS COUNTRIES
Scale : 1= Very Un-Important
France Italy Thailand
Rate the importance of the sources when choosing France, Automobile Club 3.38 3.42 3.23
France, brochures/travel guides 5.24 5.24 5.13
France, travel book 5.47 5.51 5.46
France travel magazine 5.09 5.19 5.16
France. friends and family members 5.49 5.62 5.50
France, highway welcome center 3.68 3.68 3.54
France, local/national tourism offices 4.67 4.67 4.62
France, newspaper 4.02 4.08 3.93
France, past experience 5.55 5.54 5.10
France, direct mail from destination 3.95 4.14 4.04
France, travel agency/company 4.73 4.66 4.61
France, TV/movies/travel channel 4.98 5.10 5.06
France, internet/websites 5.84 5.87 5.75
How important are the information sources when making decision to visit Thailand? 5.15 5.27 5.46
7= Very Important
111
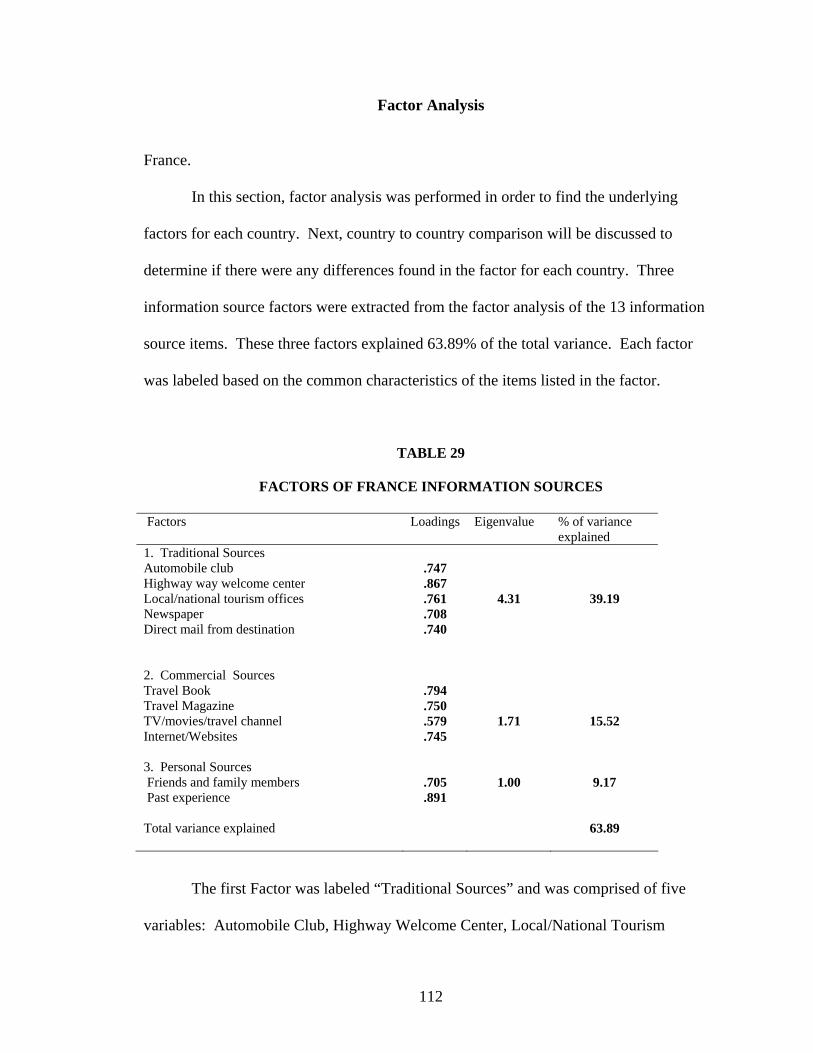
Factor Analysis France. In this section, factor analysis was performed in order to find the underlying
factors for each country. Next, country to country comparison will be discussed to
determine if there were any differences found in the factor for each country. Three
information source factors were extracted from the factor analysis of the 13 information
source items. These three factors explained 63.89% of the total variance. Each factor
was labeled based on the common characteristics of the items listed in the factor.
TABLE 29
FACTORS OF FRANCE INFORMATION SOURCES Factors
Loadings Eigenvalue % of variance explained
1. Traditional Sources Automobile club Highway way welcome center Local/national tourism offices Newspaper Direct mail from destination
.747 .867 .761 .708 .740
4.31
39.19
2. Commercial Sources Travel Book Travel Magazine TV/movies/travel channel Internet/Websites
.794 .750 .579 .745
1.71
15.52
3. Personal Sources Friends and family members Past experience
.705 .891
1.00
9.17
Total variance explained
63.89
The first Factor was labeled “Traditional Sources” and was comprised of five
variables: Automobile Club, Highway Welcome Center, Local/National Tourism
112
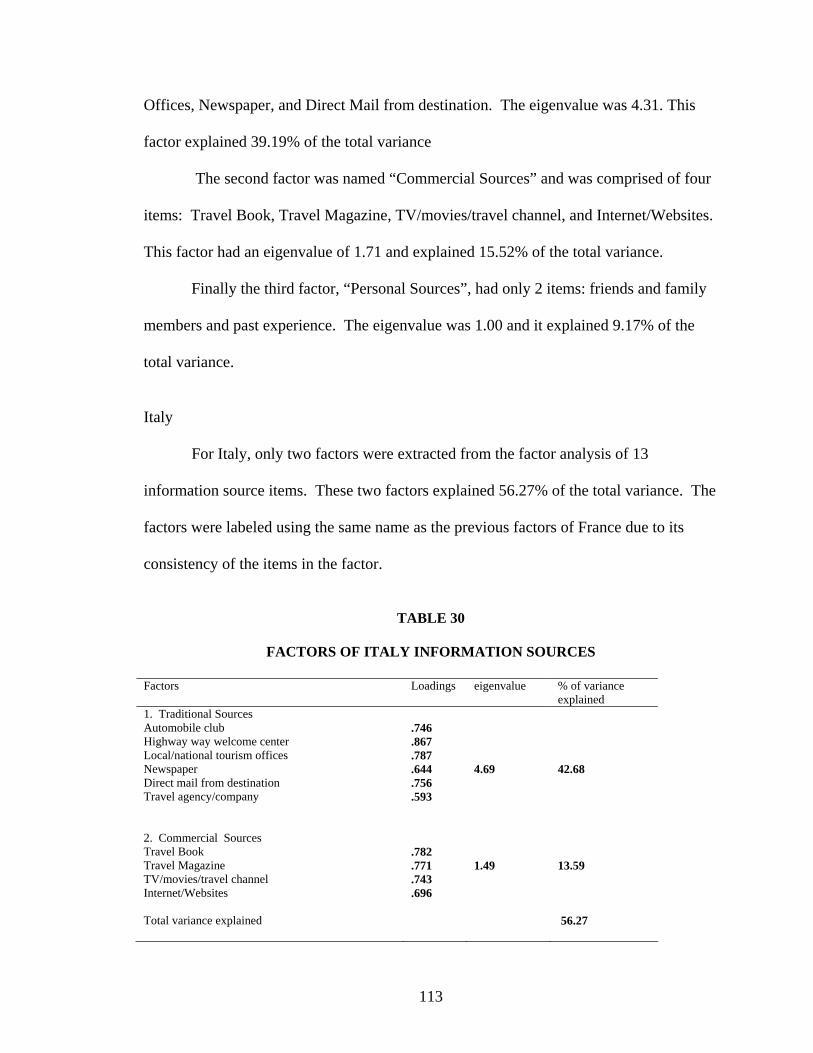
Offices, Newspaper, and Direct Mail from destination. The eigenvalue was 4.31. This
factor explained 39.19% of the total variance
The second factor was named “Commercial Sources” and was comprised of four
items: Travel Book, Travel Magazine, TV/movies/travel channel, and Internet/Websites.
This factor had an eigenvalue of 1.71 and explained 15.52% of the total variance.
Finally the third factor, “Personal Sources”, had only 2 items: friends and family
members and past experience. The eigenvalue was 1.00 and it explained 9.17% of the
total variance.
Italy For Italy, only two factors were extracted from the factor analysis of 13
information source items. These two factors explained 56.27% of the total variance. The
factors were labeled using the same name as the previous factors of France due to its
consistency of the items in the factor.
TABLE 30
FACTORS OF ITALY INFORMATION SOURCES
Factors
Loadings eigenvalue % of variance explained
1. Traditional Sources Automobile club Highway way welcome center Local/national tourism offices Newspaper Direct mail from destination Travel agency/company
.746 .867 .787 .644 .756 .593
4.69
42.68
2. Commercial Sources Travel Book Travel Magazine TV/movies/travel channel Internet/Websites
.782 .771 .743 .696
1.49
13.59
Total variance explained
56.27
113
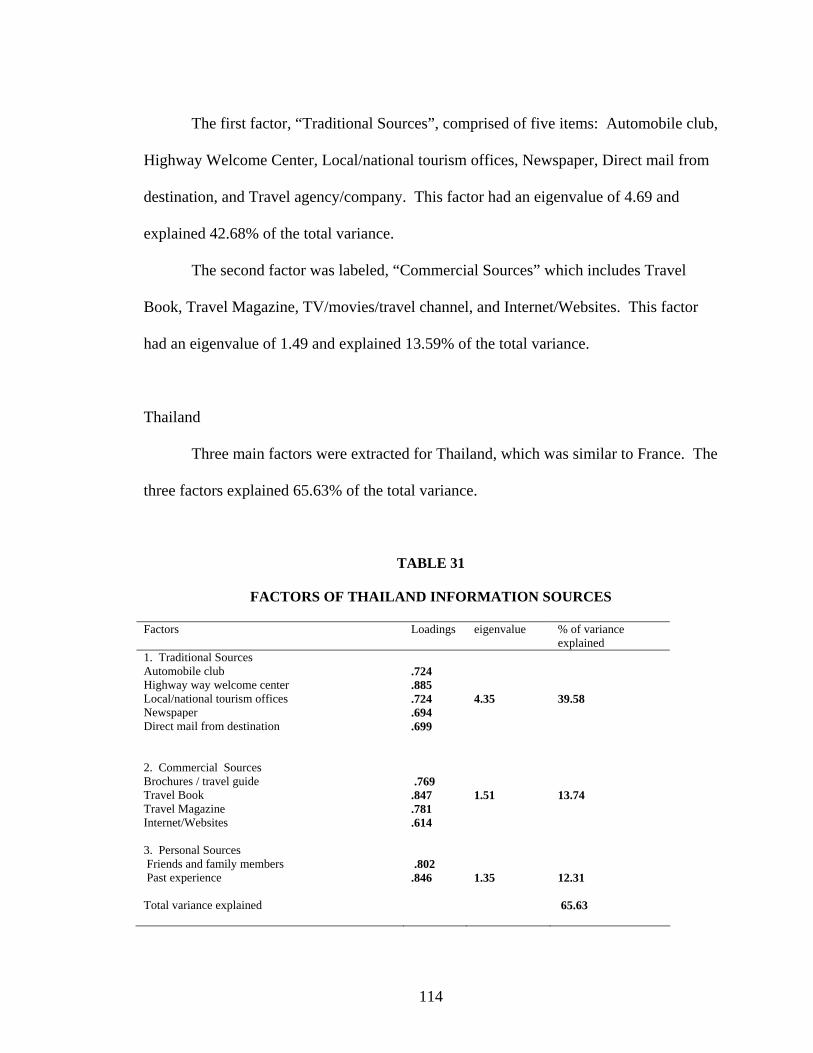
The first factor, “Traditional Sources”, comprised of five items: Automobile club,
Highway Welcome Center, Local/national tourism offices, Newspaper, Direct mail from
destination, and Travel agency/company. This factor had an eigenvalue of 4.69 and
explained 42.68% of the total variance.
The second factor was labeled, “Commercial Sources” which includes Travel
Book, Travel Magazine, TV/movies/travel channel, and Internet/Websites. This factor
had an eigenvalue of 1.49 and explained 13.59% of the total variance.
Thailand Three main factors were extracted for Thailand, which was similar to France. The
three factors explained 65.63% of the total variance.
TABLE 31
FACTORS OF THAILAND INFORMATION SOURCES Factors
Loadings eigenvalue % of variance explained
1. Traditional Sources Automobile club Highway way welcome center Local/national tourism offices Newspaper Direct mail from destination
.724 .885 .724 .694 .699
4.35
39.58
2. Commercial Sources Brochures / travel guide Travel Book Travel Magazine Internet/Websites
.769 .847 .781 .614
1.51
13.74
3. Personal Sources Friends and family members Past experience
.802 .846
1.35
12.31
Total variance explained
65.63
114
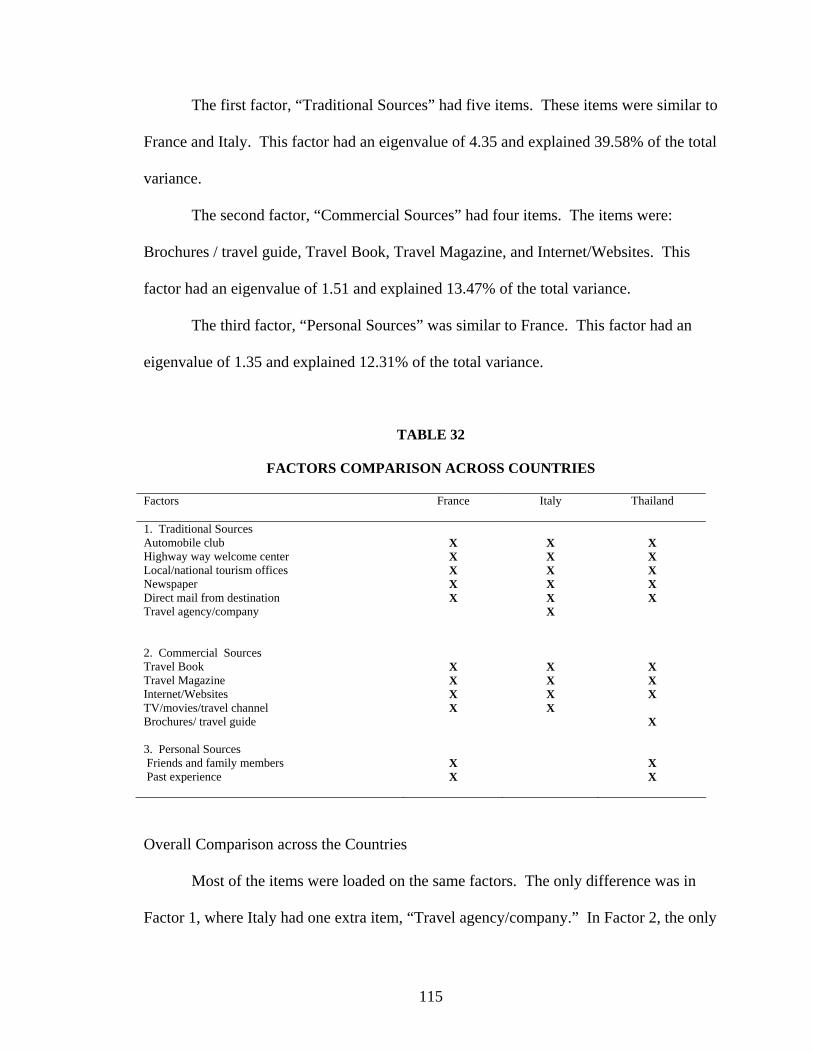
The first factor, “Traditional Sources” had five items. These items were similar to
France and Italy. This factor had an eigenvalue of 4.35 and explained 39.58% of the total
variance.
The second factor, “Commercial Sources” had four items. The items were:
Brochures / travel guide, Travel Book, Travel Magazine, and Internet/Websites. This
factor had an eigenvalue of 1.51 and explained 13.47% of the total variance.
The third factor, “Personal Sources” was similar to France. This factor had an
eigenvalue of 1.35 and explained 12.31% of the total variance.
TABLE 32
FACTORS COMPARISON ACROSS COUNTRIES
Factors
France Italy Thailand
1. Traditional Sources Automobile club Highway way welcome center Local/national tourism offices Newspaper Direct mail from destination Travel agency/company
X X X X X
X X X X X X
X X X X X
2. Commercial Sources Travel Book Travel Magazine Internet/Websites TV/movies/travel channel Brochures/ travel guide
X X X X
X X X X
X X X
X
3. Personal Sources Friends and family members Past experience
X X
X X
Overall Comparison across the Countries
Most of the items were loaded on the same factors. The only difference was in
Factor 1, where Italy had one extra item, “Travel agency/company.” In Factor 2, the only
115
difference was that Thailand had one item that was loaded into its factor,
“Brochures/travel guide” but was not loaded into France and Italy. All other items in the
factor were similar. In Factor 3, Italy and Thailand countries had the same item loaded
into their factor. It can be said that, in general most items were loaded in the same factors
for each of the three countries.
Regression Analysis
France
The regression model results for France are illustrated as follows. The R2 value
of .270 stated that 27% of the total variance in the dependent variable can be explained
by the independent variables in the model. The F-ratio of 34.047 was significant at p <
.0001 which indicated that the results were reliable. However, Factor 3 was not
significant (p > .05). Another regression model was performed in order to check if there
were any changes in the R square of the model. At this time, only Factor 1 and Factor 2
were regressed on the dependent variable. In this model, the R squared was similar to the
first model. The F-ratio increased to 51.101, was significant at p < .0001 which indicated
that the results were reliable. Both Factor 1 and Factor 2 were significant.
116
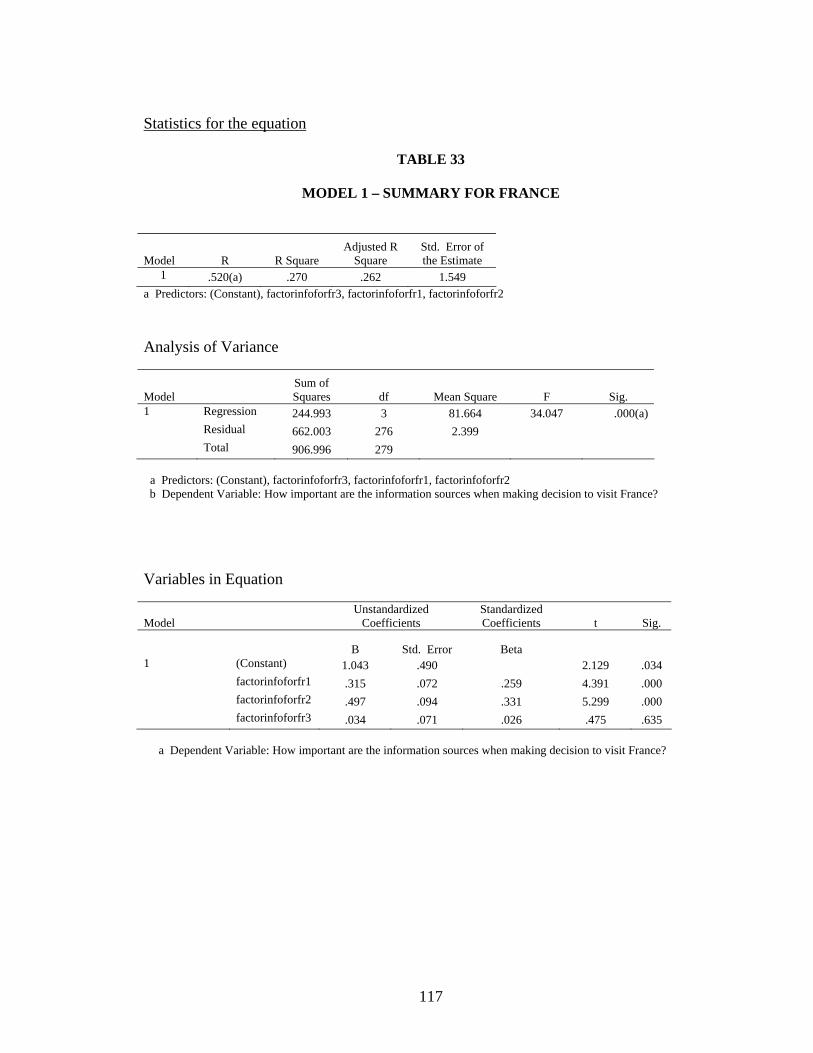
Statistics for the equation
TABLE 33
MODEL 1 – SUMMARY FOR FRANCE
Model R R Square Adjusted R
Square Std. Error of the Estimate
1 .520(a) .270 .262 1.549 a Predictors: (Constant), factorinfoforfr3, factorinfoforfr1, factorinfoforfr2 Analysis of Variance
Model Sum of Squares df Mean Square F Sig.
1 Regression 244.993 3 81.664 34.047 .000(a) Residual 662.003 276 2.399 Total 906.996 279 a Predictors: (Constant), factorinfoforfr3, factorinfoforfr1, factorinfoforfr2 b Dependent Variable: How important are the information sources when making decision to visit France? Variables in Equation
Model Unstandardized
Coefficients Standardized Coefficients t Sig.
B Std. Error Beta 1 (Constant) 1.043 .490 2.129 .034 factorinfoforfr1 .315 .072 .259 4.391 .000 factorinfoforfr2 .497 .094 .331 5.299 .000 factorinfoforfr3 .034 .071 .026 .475 .635 a Dependent Variable: How important are the information sources when making decision to visit France?
117
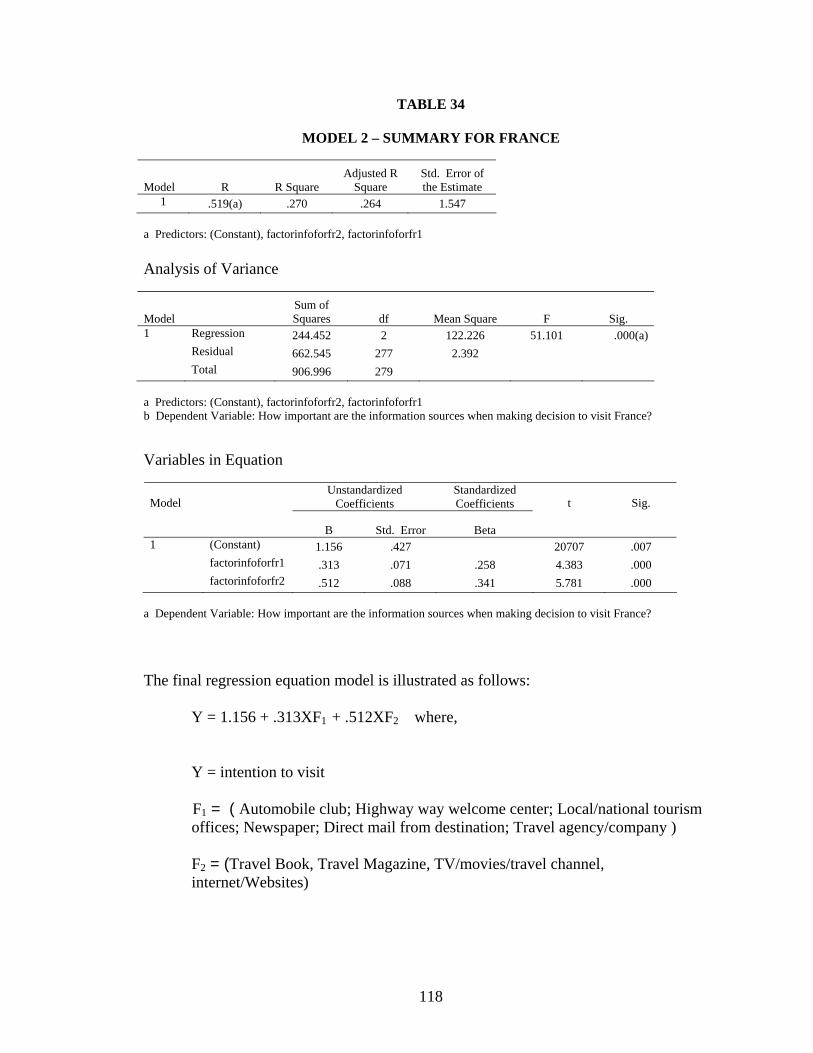
TABLE 34
MODEL 2 – SUMMARY FOR FRANCE
Model R R Square Adjusted R
Square Std. Error of the Estimate
1 .519(a) .270 .264 1.547 a Predictors: (Constant), factorinfoforfr2, factorinfoforfr1 Analysis of Variance
Model Sum of Squares df Mean Square F Sig.
1 Regression 244.452 2 122.226 51.101 .000(a) Residual 662.545 277 2.392 Total 906.996 279 a Predictors: (Constant), factorinfoforfr2, factorinfoforfr1 b Dependent Variable: How important are the information sources when making decision to visit France? Variables in Equation
Model Unstandardized
Coefficients Standardized Coefficients t Sig.
B Std. Error Beta 1 (Constant) 1.156 .427 20707 .007 factorinfoforfr1 .313 .071 .258 4.383 .000 factorinfoforfr2 .512 .088 .341 5.781 .000
a Dependent Variable: How important are the information sources when making decision to visit France?
The final regression equation model is illustrated as follows:
Y = 1.156 + .313XF1 + .512XF2 where,
Y = intention to visit F1 = ( Automobile club; Highway way welcome center; Local/national tourism
offices; Newspaper; Direct mail from destination; Travel agency/company ) F2 = (Travel Book, Travel Magazine, TV/movies/travel channel,
internet/Websites)
118
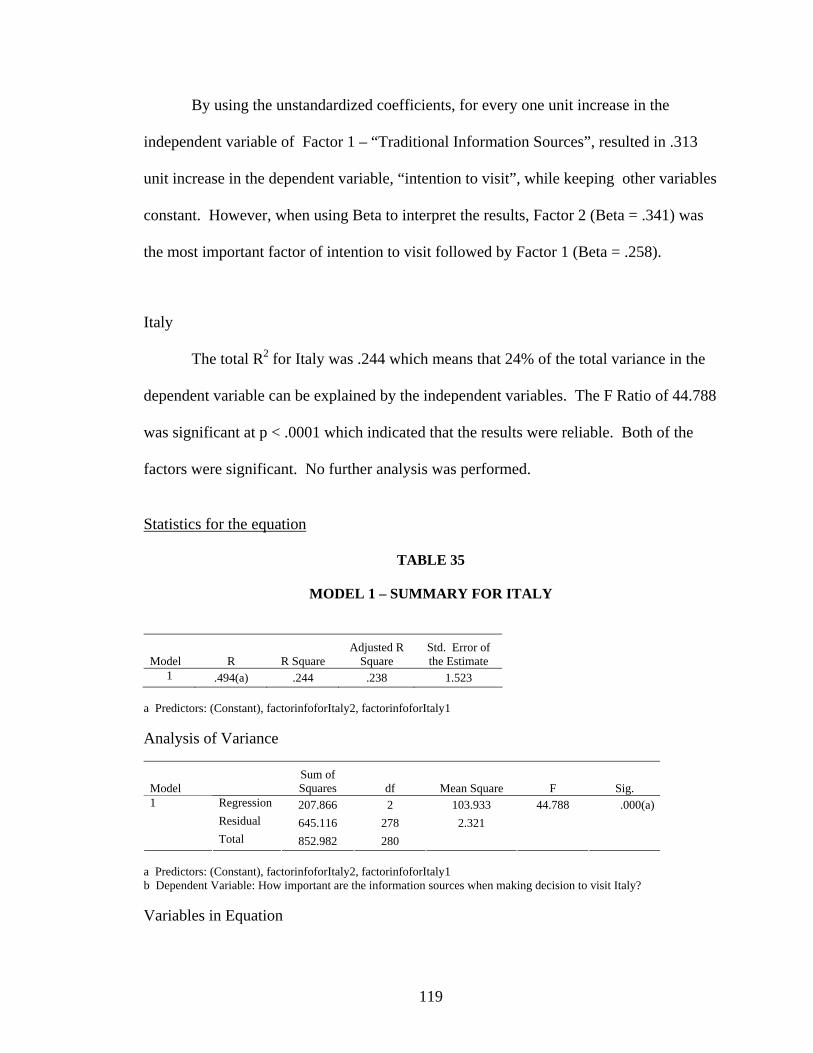
By using the unstandardized coefficients, for every one unit increase in the
independent variable of Factor 1 – “Traditional Information Sources”, resulted in .313
unit increase in the dependent variable, “intention to visit”, while keeping other variables
constant. However, when using Beta to interpret the results, Factor 2 (Beta = .341) was
the most important factor of intention to visit followed by Factor 1 (Beta = .258).
Italy
The total R2 for Italy was .244 which means that 24% of the total variance in the
dependent variable can be explained by the independent variables. The F Ratio of 44.788
was significant at p < .0001 which indicated that the results were reliable. Both of the
factors were significant. No further analysis was performed.
Statistics for the equation
TABLE 35
MODEL 1 – SUMMARY FOR ITALY
Model R R Square Adjusted R
Square Std. Error of the Estimate
1 .494(a) .244 .238 1.523 a Predictors: (Constant), factorinfoforItaly2, factorinfoforItaly1 Analysis of Variance
Model Sum of Squares df Mean Square F Sig.
Regression 207.866 2 103.933 44.788 .000(a)Residual 645.116 278 2.321
1
Total 852.982 280 a Predictors: (Constant), factorinfoforItaly2, factorinfoforItaly1 b Dependent Variable: How important are the information sources when making decision to visit Italy? Variables in Equation
119
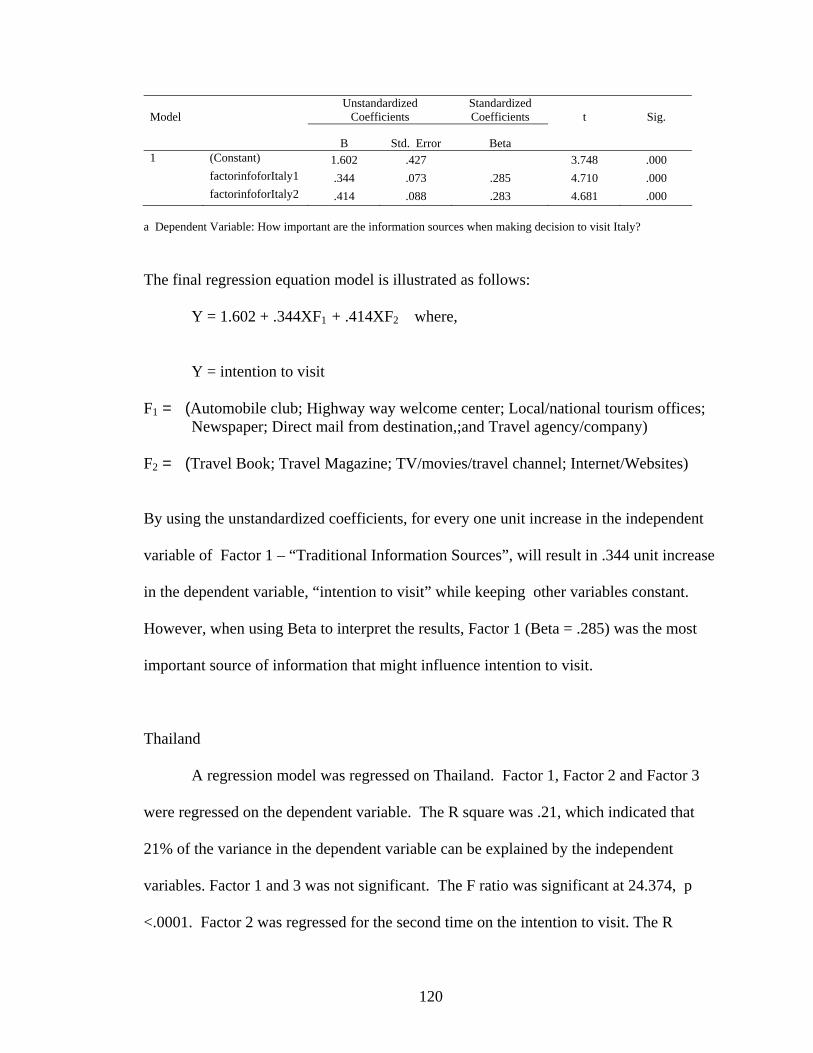
Model Unstandardized
Coefficients Standardized Coefficients t Sig.
B Std. Error Beta 1 (Constant) 1.602 .427 3.748 .000 factorinfoforItaly1 .344 .073 .285 4.710 .000 factorinfoforItaly2 .414 .088 .283 4.681 .000
a Dependent Variable: How important are the information sources when making decision to visit Italy?
The final regression equation model is illustrated as follows:
Y = 1.602 + .344XF1 + .414XF2 where,
Y = intention to visit F1 = (Automobile club; Highway way welcome center; Local/national tourism offices; Newspaper; Direct mail from destination,;and Travel agency/company) F2 = (Travel Book; Travel Magazine; TV/movies/travel channel; Internet/Websites)
By using the unstandardized coefficients, for every one unit increase in the independent
variable of Factor 1 – “Traditional Information Sources”, will result in .344 unit increase
in the dependent variable, “intention to visit” while keeping other variables constant.
However, when using Beta to interpret the results, Factor 1 (Beta = .285) was the most
important source of information that might influence intention to visit.
Thailand
A regression model was regressed on Thailand. Factor 1, Factor 2 and Factor 3
were regressed on the dependent variable. The R square was .21, which indicated that
21% of the variance in the dependent variable can be explained by the independent
variables. Factor 1 and 3 was not significant. The F ratio was significant at 24.374, p
<.0001. Factor 2 was regressed for the second time on the intention to visit. The R
120
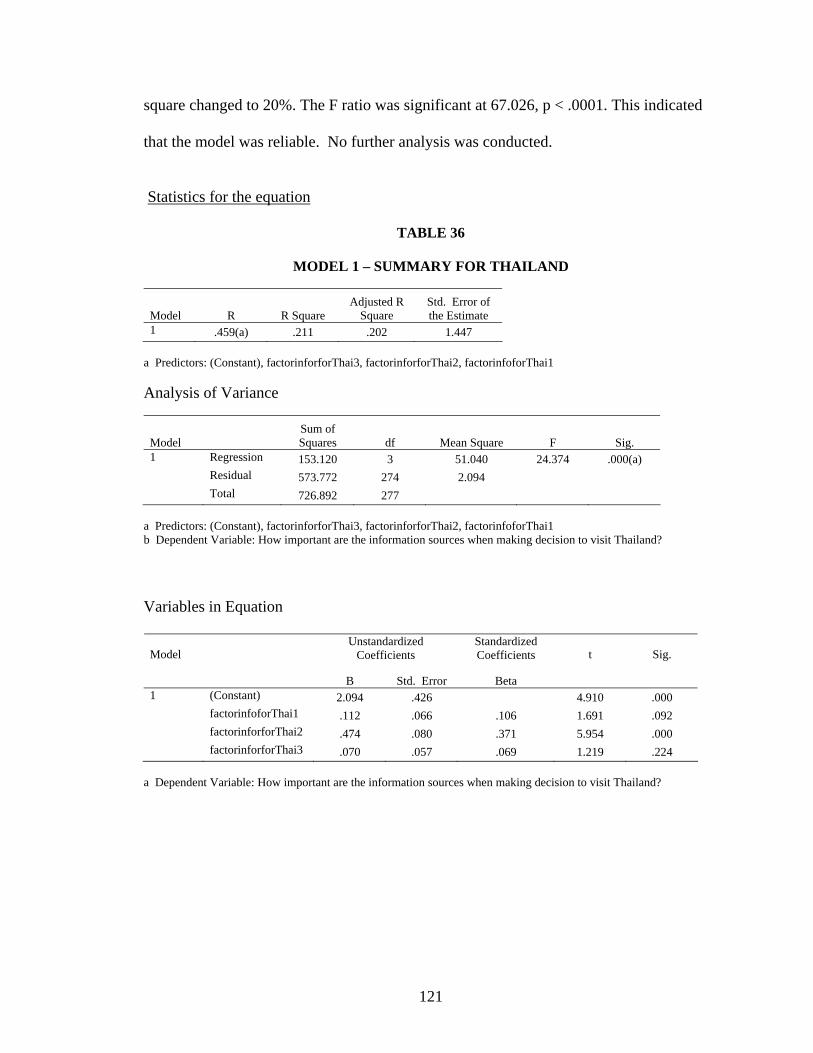
square changed to 20%. The F ratio was significant at 67.026, p < .0001. This indicated
that the model was reliable. No further analysis was conducted.
Statistics for the equation
TABLE 36
MODEL 1 – SUMMARY FOR THAILAND
Model R R Square Adjusted R
Square Std. Error of the Estimate
1 .459(a) .211 .202 1.447 a Predictors: (Constant), factorinforforThai3, factorinforforThai2, factorinfoforThai1 Analysis of Variance
Model Sum of Squares df Mean Square F Sig.
1 Regression 153.120 3 51.040 24.374 .000(a) Residual 573.772 274 2.094 Total 726.892 277
a Predictors: (Constant), factorinforforThai3, factorinforforThai2, factorinfoforThai1 b Dependent Variable: How important are the information sources when making decision to visit Thailand?
Variables in Equation
Model Unstandardized
Coefficients Standardized Coefficients t Sig.
B Std. Error Beta 1 (Constant) 2.094 .426 4.910 .000 factorinfoforThai1 .112 .066 .106 1.691 .092 factorinforforThai2 .474 .080 .371 5.954 .000 factorinforforThai3 .070 .057 .069 1.219 .224
a Dependent Variable: How important are the information sources when making decision to visit Thailand?
121
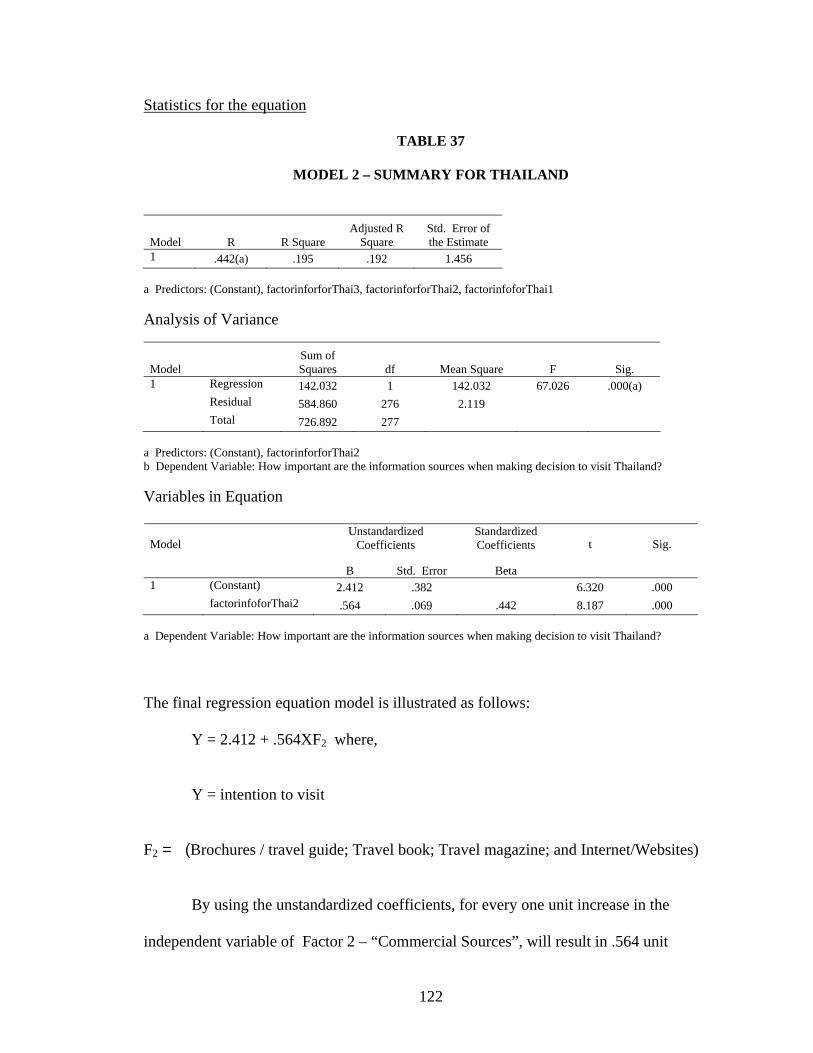
Statistics for the equation
TABLE 37
MODEL 2 – SUMMARY FOR THAILAND
Model R R Square Adjusted R
Square Std. Error of the Estimate
1 .442(a) .195 .192 1.456 a Predictors: (Constant), factorinforforThai3, factorinforforThai2, factorinfoforThai1 Analysis of Variance
Model Sum of Squares df Mean Square F Sig.
1 Regression 142.032 1 142.032 67.026 .000(a) Residual 584.860 276 2.119 Total 726.892 277
a Predictors: (Constant), factorinforforThai2 b Dependent Variable: How important are the information sources when making decision to visit Thailand? Variables in Equation
Model Unstandardized
Coefficients Standardized Coefficients t Sig.
B Std. Error Beta 1 (Constant) 2.412 .382 6.320 .000 factorinfoforThai2 .564 .069 .442 8.187 .000
a Dependent Variable: How important are the information sources when making decision to visit Thailand?
The final regression equation model is illustrated as follows:
Y = 2.412 + .564XF2 where,
Y = intention to visit F2 = (Brochures / travel guide; Travel book; Travel magazine; and Internet/Websites)
By using the unstandardized coefficients, for every one unit increase in the
independent variable of Factor 2 – “Commercial Sources”, will result in .564 unit
122
increase in the dependent variable, “intention to visit” while keeping other variables
constant. Beta was at .442 for Factor 2.
Overall Comparison across the Countries
It is concluded that Factor 1 and Factor 2 were the most significant predictors
for France and Italy. There were some similarities between these two countries.
However, Thailand had only Factor 2 (Commercial Sources) that was significant. In
conclusion, it could be summarized that travelers’ in this study had different perceptions
of the importance of information sources and intention to visit.
123
Research Question Three
This question assessed the moderating effects that the demographic characteristics
had on the relationship between a destination food image and intention to visit. The
destinations’ food image Factor 1 and 2 were regressed on the dependent variable. A
series of 8 multiple regressions were performed to test the effect of moderators on the
relationship between destination’s food image and intention to visit. A two-way
interaction was conducted to test the hypothesis of the moderators (Jaccard, Turrisi, and
Wan, 1990). Specifically, there were four moderators in this study: gender, age,
education, and income. These moderators were centered, where it was recoded in
deviation score forms so that the mean was zero. This procedure could help in reducing
multicollinearity in the predictors and help in the interpretation of the final regression
model (Aiken & West, 1991). The factors were also centered, by taking the grand mean
of each factors and subtracting the mean from each case in the factor so the mean would
be zero. After centering the moderators and Factors 1 and 2, the interaction terms were
computed by multiplying (Factor 1 × Gender) and were repeated for other moderators.
Same procedures were conducted for Factor 2 and the moderators.
Hierarchical regressions were conducted after completing the centering
procedure. For illustration, (Step 1/Model 1) centered Factor 1 and centered gender was
regressed on the intention to visit (main effects). Next, (Step 2/Model 2) the interaction
effect of Factor 1 (Factor 1 × gender) were also regressed on the intention to visit. If the
interaction effect was significant, it showed that the moderators had an effect on the
124

relationship between the independent variable and dependent variable. The same
procedures were conducted for all of the significant factors and moderators.
After conducting the analysis, none of the moderators showed a significant effect
on the relationship between destinations’ food image and intention to visit. These
findings were comparable to previous study on destination image. Further explanation
will be performed in the discussion of the hypotheses.
125
Research Question Four
This question assessed the moderating effects that the demographic characteristics
had on the relationship between the importance of information sources and intention to
visit. Similar procedures that were conducted for research question three were repeated
as well to answer research question four. A series of eight multiple regressions were
conducted in order to access the moderating effects of gender, age, education, and
income. A twoway interaction was conducted to test the hypothesis for the moderators
(Jaccard, Turrisi, and Wan, 1990). Each of the moderators (gender, age, education and
income) was centered in previous question. Both Factor 1 and 2 were centered by taking
the grand mean of each factors and subtracting the mean from each case in the factor so
the mean would be zero. The interaction terms between the factors and moderators were
calculated.
Consequently, hierarchical regressions were conducted in this section. For
example, (Step 1/Model 1) gender and the first factor were regressed on the intention to
visit. Next, (Step 2/Model 2) the interaction effects of the first factor and gender (Factor
1 × gender) was regressed on the intention to visit. If the interaction effect was
significant, it would show that the moderators had an effect on the relationship between
the independent variable and dependent variable. The steps were conducted for all the
factors and moderators separately.
The following tables illustrated only the significant results for this section. Out of
the eight analyses that were performed, four of the results were significant. These
findings confirmed that some of the moderators had a significant effect on the
126
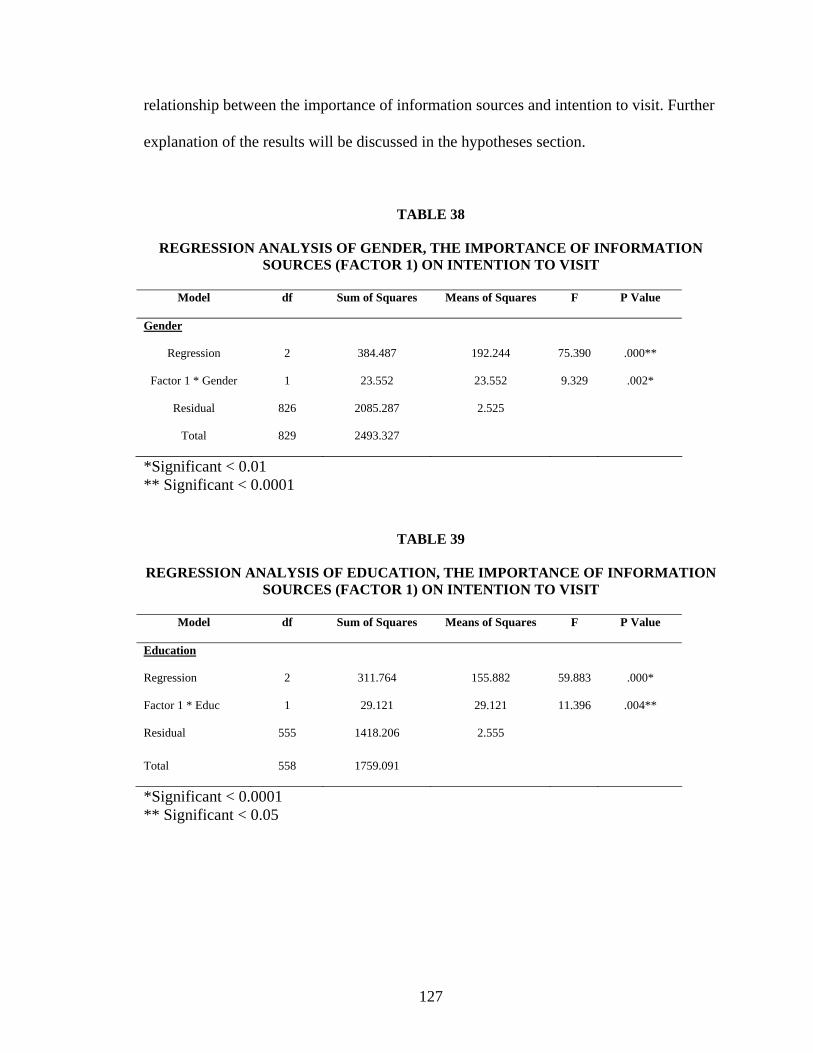
relationship between the importance of information sources and intention to visit. Further
explanation of the results will be discussed in the hypotheses section.
TABLE 38
REGRESSION ANALYSIS OF GENDER, THE IMPORTANCE OF INFORMATION SOURCES (FACTOR 1) ON INTENTION TO VISIT
Model df Sum of Squares Means of Squares F P Value
Gender
Regression 2 384.487 192.244 75.390 .000**
Factor 1 * Gender 1 23.552 23.552 9.329 .002*
Residual 826 2085.287 2.525
Total 829 2493.327
*Significant < 0.01 ** Significant < 0.0001
TABLE 39
REGRESSION ANALYSIS OF EDUCATION, THE IMPORTANCE OF INFORMATION SOURCES (FACTOR 1) ON INTENTION TO VISIT
Model df Sum of Squares Means of Squares F P Value
Education
Regression 2 311.764 155.882 59.883 .000*
Factor 1 * Educ 1 29.121 29.121 11.396 .004**
Residual 555 1418.206 2.555
Total 558 1759.091
*Significant < 0.0001 ** Significant < 0.05
127
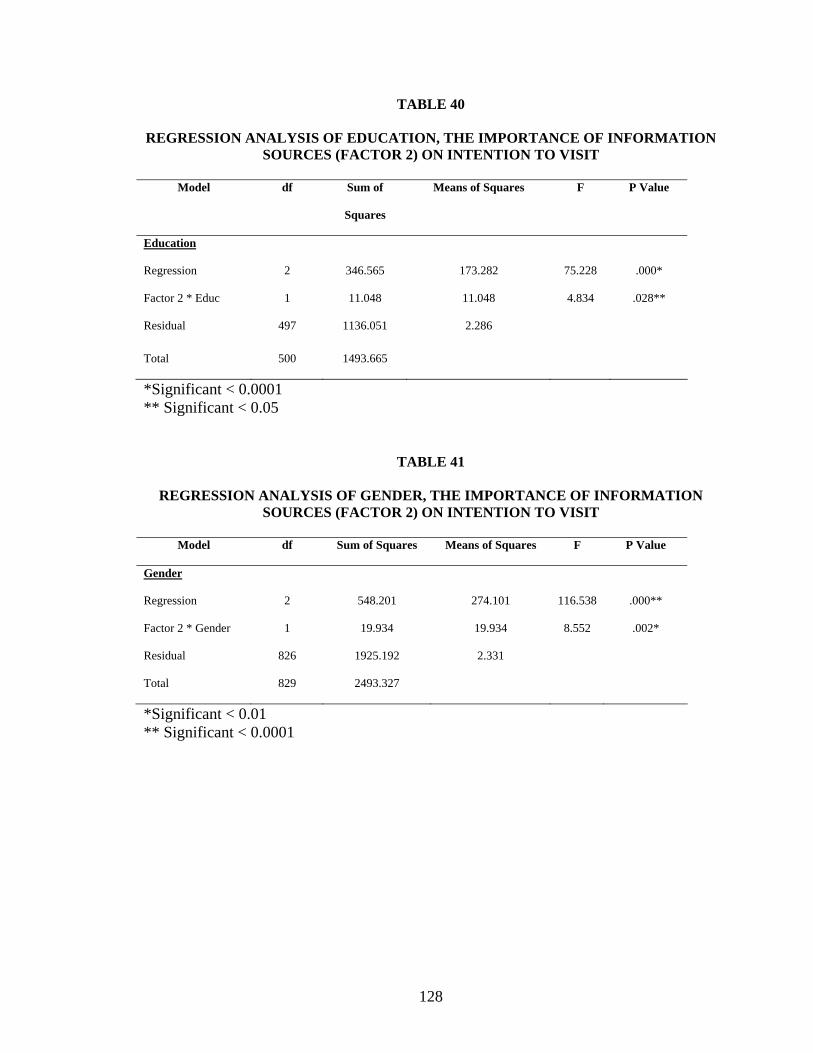
TABLE 40
REGRESSION ANALYSIS OF EDUCATION, THE IMPORTANCE OF INFORMATION SOURCES (FACTOR 2) ON INTENTION TO VISIT
Model df Sum of
Squares
Means of Squares F P Value
Education
Regression 2 346.565 173.282 75.228 .000*
Factor 2 * Educ 1 11.048 11.048 4.834 .028**
Residual 497 1136.051 2.286
Total 500 1493.665
*Significant < 0.0001 ** Significant < 0.05
TABLE 41
REGRESSION ANALYSIS OF GENDER, THE IMPORTANCE OF INFORMATION SOURCES (FACTOR 2) ON INTENTION TO VISIT
Model df Sum of Squares Means of Squares F P Value
Gender
Regression 2 548.201 274.101 116.538 .000**
Factor 2 * Gender 1 19.934 19.934 8.552 .002*
Residual 826 1925.192 2.331
Total 829 2493.327
*Significant < 0.01 ** Significant < 0.0001
128
Summary Analysis of the Hypothesis Testing
This chapter discussed the profile of the respondents and then statistically tested
the hypotheses as well as presented the relationships among the variables in the study.
Additionally, this chapter also presented the results of the focus group and additional
analysis on each of the destinations in the study. However, the discussion was focused
on the hypotheses developed for the research. In the following section the results of
hypotheses testing were discussed.
Hypothesis 1
Hypotheses one stated that the destination’s food image has a significant effect
toward the travelers’ intention to visit a culinary destination. Two factors were
extracted from the factor analysis. Factor 1 was labeled Destination’s Food Image
and Factor 2 was labeled Destination’s Unique Image. As stated in this section,
the named was arbitrarily chosen for each of the factors. However, the variables
in each factor seemed to be associated with the name of the factors. Both of the
factors extracted 56.92% of the total variance explained. The two factors could be
used to explain important characteristics of a culinary tourism destination. Next,
regression analysis was conducted. The findings indicated that intention to visit
had a significant impact on the destinations’ food image at p < .0001 level and
explained 9% of the variability of dependent variable that can be explained by the
independent variables. Although the variance was small, it showed that those
129
factors were important to travelers who had the intention to visit. Therefore, these
findings supported hypothesis one.
Hypothesis 2
Hypothesis two stated that the importance of information sources has a significant
effect toward the travelers’ intention to visit a culinary destination. Three factors
were extracted from the factor analysis. These factors were name: Factor 1 –
Traditional Sources; Factor 2 – Commercial Sources; and Factor 3 - Personal
Sources. Overall, these three factors contributed almost 64.12 % of the total
variance explained. Factor 1 and Factor 2 were found significant, but not Factor 3.
Next step, regression analysis was performed and it indicated that intention to
visit had a significant impact on the importance of various information sources at
p < .0001 level and contributed 24% of the variability of intention to visit can be
explained by the independent. These results supported hypothesis two in this
study.
Hypothesis 3
Hypothesis three stated that the demographic characteristics will significantly
moderate the relationship between the destination’s food image and intention to
visit.
H3A: Gender has a significant effect on the relationship between the destination’s
food image and intention to visit. This hypothesis was not supported in this study.
130
There was no interaction effect on the relationship among gender and the
destination’s food image and intention to visit. In general there were no
differences between male and female respondents.
H3B: Age has a significant effect on the relationship between the destination’s
food image and intention to visit. This hypothesis was not supported. There was
no interaction effect on the relationship among different age levels and the
destination’s food image and the intention to visit for all countries.
H3C: Educational background has a significant effect on the relationship between
the destination’s food image and intention to visit. This hypothesis was not
supported. There was no interaction effect among different educational
background and the destination’s food image and intention to visit for all
countries.
H3D: Income has a significant effect on the relationship between the destination’s
food image and intention to visit. This hypothesis was not supported. There was
no interaction effect among different income groups.
Hypothesis 4
Hypothesis 4 stated that the demographic characteristics will significantly
moderate the relationship between the importance of information sources and
intention to visit.
131
H4A : Gender has a significant effect on the relationship between the importance
of information sources and intention to visit. This hypothesis was supported for
Factor 1 and 2. There was an interaction effect on the relationship between
gender and the importance of information sources and intention to visit. In Factor
1, it was found that male travelers were highly associated with the importance of
information sources and intention to visit (slope = .5519; p<.001); for female
traveler it was slightly lower (slope = .3282; p < .01). In Factor 2, male was
found to have higher perceptions on the importance of information sources and
intention to visit: the slopes were; male (slope = .7715; p < .001); female (slope =
.5134; p < .001). The results indicated that gender was positively and significantly
moderated the relationship between the importance of information sources and
intention to visit. In addition, both of the factors regressed in this study had
similar results. It shows the results were comparable across the factors. In
general, there was a difference between male and female respondents.
H4B: Age has a significant effect on the relationship between the importance of
information sources and intention to visit. This hypothesis was not supported for
any of the age groups.
H4C: Educational background has a significant effect on the relationship between
the importance of information sources and intention to visit. This hypothesis
was supported. The results indicated that educational background was positively
and significantly associated with higher perceptions of the importance of
132
information sources and intention to visit at all levels for Factor 2: high school
and below; high school graduate; university graduate and post-graduate degree
( slopes = .4997; 6056; .8176; 9235, p < .001, respectively). For Factor 1, only
two levels were found to be significant: university graduate and post-graduate
degree (slope = .2512, p < .05; .4223, p <.001, respectively). In summary, the
results indicated that individuals’ level of education had a major influence on the
importance of information sources and the intention to visit.
H4D : Income has a significant effect on the relationship between the importance
of information sources and intention to visit. This hypothesis was not supported
for all of the countries. There was no interaction effect on the relationship among
different levels of income and the importance of information sources and the
intention to visit.
The following chapter will present a discussion of the findings with
respect to the hypothesis testing.
133
CHAPTER V
DISCUSSION AND CONCLUSIONS
Introduction In the previous chapter the results of the findings were tabulated on the data
collected for this study. In the first part of this chapter, the summary of the study was
discussed. The findings were discussed in regards to the theoretical relationship on
which this study was conceptualized, and the implication for theory and marketing was
exhaustively explained.
Summary of the Study
The purpose of the study was to examine the role of a destination’s food image, to
analyze the importance of information sources, and to test the moderating effects of
demographic profiles on the travelers’ intention to visit a culinary destination. There
were three main objectives of this study: (1) explain the relationship between a
destination’s food image and the travelers’ intention to visit; (2) examine the influence
134
that sources of information have on travelers’ intention to visit a culinary destination; and
(3) identify the moderating effect of demographic characteristics on: a) the relationship
between destination’s food image and the travelers’ intention to visit and b) the
relationship between information sources and the travelers’ intention to visit.
The population of the study was selected from two online websites. A total of 35
food and travel groups were selected from Yahoo and Msn. A questionnaire was e-
mailed to the members of each of the group. A total of 8067 e-mail was sent to the
members of the groups. Unfortunately, only a total of 294 responded to the survey.
After deleting ten partially completed surveys, only 284 were deemed usable for final
data analysis.
The destination’s food image questions were formulated based on previous
research (Dimance & Moody, 1998) and a focus group was conducted earlier in the
study. There were 20 items in section A of the instrument and a seven-point Likert scale
was used to evaluate the food image. Respondents were asked how likely it would be if
they were to visit each of the destinations. The importance of information sources were
measured by using 13 attributes that were adapted from Fondness (1994) study on tourist
motivation and information sources. These attributes were rated on a seven-point Likert
scale as described previously. Following these questions, respondents had to rate the
overall importance of information source before making decisions to visit the three the
destinations under the current study. The last section of the questionnaire measured the
demographic characteristics of the respondents.
135
A total of ten hypotheses were tested by using factor analysis, multiple, and
hierarchical regression. In particular, the moderating effects were analyzed using
hierarchical regression; when the interaction effects between the factors (independent
variables) and one of the demographic variables was found significant, the slope was
calculated in order to find out the level of relationship or interaction.
Discussion of the Hypotheses
Hypothesis 1: The destination’s food image has a significant effect on the travelers’
intention to visit a culinary destination.
This hypothesis was supported by factor and regression analysis. Factor 1 and 2
accounted for more than 50% of the total variance explained. The results of factor
analysis showed that the respondents in this study perceived that destinations’ food image
had a major role in their decision to visit a culinary destination. The factors also
characterized the type of destinations’ food image that might be crucial for an established
culinary destination such as France and Italy. On the other hand, for those destinations
inspired to expand their culinary tourism, might want to start developing their products
based on the findings of this study.
In terms of the regression analysis, the R square was only 9%, which means that
only 9% of the variability of the dependent variable that can be explained by the
independent variables. The R square represented a small percentage of how much the
destination’s food image can predict the intention to visit. Previous studies by Hunt
136
(1975) and Scott, Schewe, and Frederick (1978) confirmed that people would have a
better image of the destination if it was closer to their residence. In this study, the survey
was conducted online, and most of the respondents were from the United States. They
might have limited information about the destination’s food image of the countries being
studied that could have resulted in a rather low percentage of the variance in the intention
to visit which could be explained by the independent variables.
Hypothesis 2: The type of information sources has a significant effect on the travelers’
intention to visit a culinary destination.
This hypothesis was supported by factor and regression analysis. The results of
factor analysis indicated that 64.12% of the total variance explained. The findings
showed strong association between the importance of information sources and intention
to visit. Different types of information sources were important to today’s travelers. For
example, internet had the highest mean in comparison to other sources; however,
“Traditional Sources” were still preferred by most travelers. This finding was similar to
previous studies, which stated that travelers use multiple source of information before
making decisions to visit (Fodness and Murray, 1998).
Regression analysis results showed that the R square was .24, which means 24 %
of the variance in the dependent variable that can be explained by the independent
variables. A study by Beerli and Martin (2004) found that there was no significant
relationship between secondary information sources and destination image. However, the
researchers stated that travel agents played a pivotal role in portraying a destination’s
137
image in the customers’ minds. In addition, travel agents were found to be a highly
significant source of information for travelers. In this study, travel agency/company was
not chosen as one of the information sources. This could be due to the majority of the
population in the study, which was in the 20 - 29 years of age group. In addition, today’s
internet users might not reflect the population at large.
Hypothesis 3: Travelers’ demographic characteristics will significantly moderate the
relationship between the destination’s food image and the travelers’
intention to visit.
H3A – Gender has a significant effect on the relationship between the
destination’s food image and the travelers’ intention to visit.
This hypothesis was not supported by factor and hierarchical regression analysis.
This study did not find any differences between men’s and women’s perceptions on the
relationship between destinations’ food image and intention to visit. The hypothesis
would have been significant if the study had been conducted at the destination site.
Beerli and Martin’s (2004) performed research on the island of Lanzarote, Spain, found a
significant relationship between men and women as first- time visitors to the island.
Furthermore, Gunn (1972) stated that image formulation by different groups of visitors
would be totally different. For example, those who visited a destination would have a
clearer understanding of the images of the destination than those who had never been to
the destination. In this study, it was assumed that most of the participants had never been
138
to the destination; therefore, they would not have a clear understanding of the
destination’s food image.
H3B – Age has a significant effect on the relationship between
destination’s food image and the travelers’ intention to visit.
This hypothesis was not supported by factor and hierarchical regression analysis.
The respondents’ age did not influence the relationship between destination’s food image
and intention to visit. This finding was in congruency with the finding of Baloglu and
McCleary (1999), who stated that there was no relationship between tourists’ age and the
perception of a destination. However, earlier studies by Baloglu (1997) stated that age
was significant demographic variable (Baloglu, 1997). In this study, more than 50% of
the respondents were between the ages of 20 – 29 years; therefore, we can say that the
sample was a homogeneous group that might have the same perceptions of the
destinations’ food image and intention to visit. Obviously, this particular age group was
overrepresented in the current data set.
H3C – Educational background has a significant effect on the relationship
between the destination’s food image and the traveler’s intention to visit.
Also, this hypothesis was not supported by factor and hierarchical regression
analysis. In terms of educational levels, more than 80% of the respondents were college
graduates. The educational levels did not influence the relationship between destination’s
food image and the traveler’s intention to visit. Our findings were augmented by the
139
findings of Baloglu and McCleary (1999), who found no significant relationship between
education and evaluation of a destination’s image.
H3D – Income has a significant effect on the relationship between the
destination’s food image and the travelers’ intention to visit.
This hypothesis was not supported by factor and hierarchical regression analysis.
Goodall and Ashworth (1988) confirmed that traveler’s income might influence their
perceptions of a destination. As stated in the other section of this study, it was not known
how many percentages of the respondents had visited the destinations. Their responses
were based subjectively on their “unknown” perceptions of the destinations’ food image.
In general, it could be said that there was a bias of not knowing the actual food image of
the countries in this study.
Hypothesis 4: Travelers’ demographic characteristics will significantly moderate the
relationship between the importance of information sources and the
travelers’ intention to visit.
H4A: Gender has a significant effect on the relationship between the
importance of information sources and the travelers’ intention to visit.
This hypothesis was supported by factor and hierarchical regression analysis. Male
respondents were found to have a higher perception on the importance of information
sources and intention to visit. In this study, the ratio of male to female was almost 1 : 1.
140
The result was consistent with the findings of previous research conducted by
Schumacher & Morahan-Martin, (2001). Male and female differed in their information
search behavior. Men were found to be highly motivated by technology. Additionally,
men were also found to make quick decision based on their own opinions; however,
women would carefully choose the type of information that they utilized (Meyers-Levy,
1988).
H4B: Age has a significant effect on the relationship between the
importance of information sources and the travelers’ intention to visit.
This hypothesis was not supported by factor and hierarchical regression analysis.
Previous research stated that sosiodemographic characteristics did not have any influence
on travelers’ information source behavior (Bieger & Laesser, 2004). However, the
information source behavior was based on the characteristics of the trips. For example,
the level of familiarity with a destination, accommodation and the types of activities
related to the trips.
H4C: Educational background has a significant effect on the relationship
between the importance of information sources and the travelers’
intention to visit.
This hypothesis was supported by factor and hierarchical regression analysis.
Individuals with higher education had the highest perception on the importance of
information sources and intention to visit. This finding was similar to Eby, Molnar, and
Cai (1999), who stated that information sources behavior differed based on an
141
individuals’ educational level. In general, people who are highly educated would search
for more information before making a decision.
H4D: Income has a significant effect on the relationship between the
importance of information sources and the travelers’ intention to visit.
This hypothesis was not supported by factor and hierarchical regression analysis.
This study was similar to Fodness and Murray (1997) who found no difference between
higher income and lower income groups’ information search behavior. However, the
authors noted that lower income groups had lesser tendency to search for information the
as compared to the higher income.
Implications of the Research
This study has shed some lights on culinary tourism with major emphasis on two
major contributions: theoretical and managerial implications. In terms of the theoretical
contributions, the study enriched the body of literature in culinary tourism and was one of
the first studies to document destinations food image and intention to visit. The results of
this study could provide a foundation for future research in this topic. In addition, the
countries that were selected for this study were well known for their cuisines. As such,
the main factors that contributed to their popularity might be used for other countries to
develop their own culinary tourism products. So far, this is the pioneer study that had
complete analysis on destinations’ food image, information sources, and demographic
142
characteristics. Previous studies had focused on: food choice behavior (Marris, 1986);
authentic food and sustainable tourism (Reynolds, 1993); foodservice and tourism
(Sheldon and Fox, 1988); and tourism and local food industries (Telfer & Wall, 1996).
The results of this study outlined that there were two main factors that
characterize a culinary destination. Specifically, the factors were: destination’s food
image and destination’s unique image. The variables in each of the factor comprised of
vital culinary tourism products. For example, France and Italy are well known for their
wine producing regions and the popularity of their cuisines. Similarly, Australia which is
a new emerging market in wine production, is also aggressively promoting culinary
tourism as one of its core products. Obviously, there is an association between wine
regions and culinary tourism.
In addition, the types of information sources chosen by the respondents were
comparable from one country to another. Specifically, there were three main factors that
were consistent across the countries mentioned in the study: (1) traditional sources, (2)
commercial sources, and (3) personal sources. These findings showed the importance of
information sources and the type information sought by travelers. The results of this
study showed that internet was the most popular source of information; however, other
types of information sources were important as well.
From the managerial marketing perspective, this study could assist those
destinations in promoting their local food segments. The findings of this study could also
help destinations to formulate the type of food image they want to establish. In addition,
by using the appropriate marketing channel for their products, destinations could further
143
enhance their culinary tourism. For example, by implementing marketing program that
focuses toward a specific group and using a communication channel that could be
effective for that particular group. Marketers can also use a combination of information
sources for different market segments. The results of this study reveled information
sources were divided into three main categories. Managers could use multiple sources in
order to maximize the benefit from marketing efforts.
Limitations of the Study
Some of the possible limitations of this study were as follows:
1. The results of this study cannot be generalized to the whole population
because of the convenience sampling procedure or non-probability sample.
Also, using internet as the only source for data collection made it difficult to
determine whether the respondents were a true representation of the group
targeted by the researcher and the population was limited to users of the
internet. In addition, the respondents of this study were in the younger age
brackets, which could be overrepresented in the data set. If the sample was
larger, more differences in the groups could have been observed.
2. The study was only conducted online. If an intercept survey or mail survey
was conducted, we might have a larger sample population, which would
provide a better facet for comparison. Also, the results would be more
realistic, if this study was conducted at the destination site itself. It is
144
predicted that the travelers would respond differently because they might have
already experienced the tourism products of the destination.
3. It was quite obvious that the respondents had not visited all the countries in
the study. Therefore, if a question about previous visit has been included in
the questionnaire, the study could compare the difference between previous
visitors and non-visitors.
4. The findings were limited to only three destinations: France, Italy, and
Thailand. Future studies should include other culinary destinations such as
Australia, New Zealand, Canada and Singapore.
5. The variables used in this study were limited to the objectives of the study. If
more variables were added, additional findings could have been discovered.
However, more variables contribute to a lengthy survey that would deter and
maybe discourage the respondents to participate in the study.
6. The respondents’ degree of familiarity with the countries was questionable. It
is predicted that the findings of this study would be totally different if
respondents had previously visited the countries in this study.
145
Implications for Future Research and Recommendations
Future research should be conducted in order to understand how destinations can
effectively use the factors suggested in this study and apply them in their destinations’
marketing strategy. In addition, future studies should be performed at the designated
destinations to have better findings. As was stated earlier, first timers or repeat visitors
might have a different image of a destination. As such, future researchers can compare
the image of first time visitors versus repeat visitors of a particular destination.
It is also recommended that future studies should compare travelers from different
countries. Marris (1986) proved that food was important to the Germans travelers in
comparison to the British and the Swiss travelers. Morris found that the Germans were
more selective in terms of their food choices. This present study can be replicated to
assess the perceptions of travelers from different countries on destination’s food image.
In this study, only one focus group was conducted to evaluate travelers’
perception on food and tourism. It is suggested that future research should conduct at
least four focus group sessions so that a comparison can be made from one group to
another. More focus groups could provide more insight into the relationship between
food and tourism and would help to strengthen the design and consequently its results.
146
Conclusion
Since this investigation was exploratory in nature, future research should focus on
how to refine the methods employed in their study. Nevertheless, the results of the study
somehow confirmed that there was a significant correlation between destinations’ food
image and the travelers’ intention to visit. Also, it was proven that the type of
information sources were important in determining travelers’ intention to visit a
particular destination. As we are living in a technological global village, most travelers’
preferred to use the internet as the most important source of information.
Understanding the influence of a destination’s food image could further enhance
the location’s overall image. Not only the “general” image of a destination is known, but
a specific food image can be developed that would contribute and create the destination’s
potential niche market. Obviously, potential culinary destinations might use some of the
factors in this study in order to improve their destination’s food image. Undoubtedly,
strong relationship between the importance of information sources and intention to visit,
countries could apply various channels of information sources recommended in this study
in their marketing program.
By actively seeking the appropriate destination’s food image and focusing on
various sources of information, countries rich in culinary heritage can develop a powerful
marketing tool that can greatly boost their economic and tourism industry.
147
REFERENCES
Ahmed, Z.(1997) Determinants of the components of a State’s tourist image and their
marketing implications. Journal of Leisure and Hospitality Marketing 2(1), 55-
69.
Aiken, L. & West, S. (1991) Multiple regression: testing and interpreting interaction.
Newbury Park, Calif: Sage Publications.
Alant, K., & Bruwer, J. (2004). Wine tourism behavior in the context of a motivational framework for wine regions and cellar doors. Journal of Wine Research, 15(1),
27-37.
Anderson, C (1986). Hierarchical moderated regression analysis: A useful tool for retail
management decisions. Journal of Retailing, 62(2), 186- 203.
Asseal, H. (1984). Consumer Behavior and Marketing Action. Boston: Kent
Au, L. & Law, R. (2002). Categorical classification of tourism dining.
Annals of Tourism Research, 29(3), 819-833.
Avery, R. (1996). Determinants of search for nondurable goods: An empirical
assessment of the economic of information theory. Journal of Consumer Affairs,
30, 390-420.
Baloglu, S. & Mangaloglu. M. (2001). Tourism destination images of Turkey, Egypt,
Greece, and Italy as perceived by US-based tour operators and travel agents.
Tourism Management, 22, 1-9.
Baloglu, S. & McCleary, K. (1999) A model of destination image formation. Annals of
Tourism Research, 26(4), 868-897.
148
Baloglu, S. (1996). An empirical investigation of determinants of tourist destination
image (Doctoral dissertation, Virginia Polytechnic Institute and State University,
1996). Dissertations Abstract International.
Baloglu, S. (1997). The relationship between destination images and sociodemographic
trip characteristics of international travelers. Journal of Vacation Marketing, 3,
221- 233.
Beardsworth, A. & Keil, T.(1997). Sociology of the menu, London: Routledge.
Beatty, E. & Smith, M. (1987). External search effort: An investigation across several
product categories. Journal of Consumer Research, 14, 83-95.
Beerli, A., & Martin, J. (2004). Factors Influencing Destination Image. Annals of
Tourism Research, 31(3), 657-681.
Belisle, F. (1983). Tourism and Food Production in the Caribbean. Annals of Tourism
Research, 10, 497-513.
Bessiere, J. (1998). Local development and heritage: Traditional food and cuisine as
tourist attractions. The European Society for Rural Sociology, 38(1), 21- 34.
Bloc, P., Sherrell, D., & Ridgway, N. (1986). Consumer search: An extended
framework. Journal of Consumer Research, 13, 119-126.
Bonn, A., Furr, H., & Hausman, A. (2001). Using internet technology to request travel
information and purchase travel services: A comparison of X’ers, boomers, and
mature market segments visiting Florida. In J.A. Mazanec, G.I. Crouch, J.R.
Brent, and A.G. Woodside (Eds.), Consumer, Psychology of Tourism, Hospitality
and Leisure, Vol. 2 (pp. 187-193) New York: CABI.
149

Boyne, S., Williams, F. and Hall, D., (2002). The Isle of Arran Taste Trail. In Anne-
Mette Hjalager and Greg Richards (Eds.). Tourism and Gastronomy ( pp. 91-
114). London: Routledge.
Brucks, M. (1985). The effect of product class knowledge on information search
behavior. Journal of Consumer Research, 12, 1-16.
Burnett, J. (1989). Plenty and want: a social history of food from 1815 to the present day
(3rd ed.) London: Routledge.
Burns, A. & Bush, R. (1995). Marketing Research, New Jersey: Prentice Hall.
Canadian Tourism Commission (2002). Acquiring a taste for cuisine tourism. A product
development strategy. Canadian Tourism Commission, Ottawa.
Capon, N. & Burke, M. (1980). Individual, product class, and task-related factors in
consumer information processing. Journal of Consumer Research, 7, 314-326.
Cha, S., McCleary, W., & Uysal, M. (1995). Travel motivations of Japanese Overseas
travelers: A factor-cluster segmentation approach. Journal of Travel Research,
34(2), 33-39.
Charters, S. & Ali-Knight (2002). Who is the wine tourist?, Tourism Management,
23(3), 311-319.
Charters, S., & Ali-Knight. (2000). Wine Tourism – A Thirst for Knowledge?
International Journal of Wine Marketing, 12(3), 70-80.
Chaudhary, M. (2000). India’s image as a tourist destination – a perspective of foreign
tourists. Tourism Management, 21(2000), 293-297.
Churchill, G. (2001). Basic marketing research, (4th ed.). Florida: Harcourt, Inc.
150
Claxton, J. Fry, J., & Portis, B. (1974). A taxonomy of pre-purchase information
gathering patterns. Journal of Consumer Research, 1, 35-42.
Cohen, E. & Avieli (2004). Food in tourism. Attraction and impediment. Annals of
Tourism Research, 31(4), 755- 778.
Corigliano, A.(2002). The route to quality: Italian gastronomy networks in operations.
In A.M. Hjalager and G. Richards (Eds.), Tourism and Gastronomy (pp. 166-
185). London: Routledge
Correia, A. (2002). How do tourist choose? Tourism, 50(1), 21-29.
Coupey, E., Irwin, R., & Payne, J. (1998). Product category familiarity and preference
construction. Journal of Consumer Research, 24, 459-468.
Crompton, J. (1979). An assessment of the image of Mexico as a vacation destination
and the influence of geographical location upon the image. Journal of Travel
Research, 17(4), 18-23.
Csergo, J. (1996). The emergence of regional cuisines. In J. L. Flandrin (Eds.), Food.
A culinary history (pp. 500-515). New York Columbia University Press.
Cunningham, M (1967). Perceived risk as a factor in informal consumers’
communications. In D.F. Fox (Eds.), Risk Taking and Information Handling in
Consumer Behavior (pp. 265-288). Boston: Harvard University.
Dimanche, F. & Moody, M. (1998). Perception of destination image. A study of Latin
America intermediary travel buyers. Tourism Analysis, 3., 173-180.
Duncan, C., & Olshavsky, R. (1982). External Search: The role of consumer beliefs.
Journal of Marketing Research, 19, 32-43.
151
Eby, D., Molnar, L, Cai, L. (1999). Content preferences for in-vehicle tourist
information systems: an emerging tourist information source. Journal of
Hospitality and Leisure Marketing 6, 41-58.
Echtner, C. & Ritchie, J. (1991). The meaning and measurement of destination image.
Journal of Tourism Studies, 2(2), 2-12
Echtner, C. & Ritchie, J. (1993). The measurement of destination image: An empirical
assessment. Journal of Travel Research, 31(Spring) 3-13.
Einspruch, E. (2005). Introductory guide to SPSS for windows. Thousand Oaks, Calif:
Sage Publication.
Embacher, J. & Buttle, F. (1989). A repertory grid analysis of Austria’s image as a
summer vacation destination. Journal of Travel Resesarch, 28(3), 3-23
Engel, J. Blackwell, R. & Miniard, P. (1995). Consumer Behavior. (8th ed.). Fort
Worth TX: Dryden.
Fekeye, P. & Cropmton, J. (1991). Image differences between prospective, first-time, and
repeat visitors to the Lower Rio Grande Valley. Journal of Travel Reseasrch,
30(2), 10-16.
Fields, K.(2002). Demand for the gastronomy tourism products: motivational factors. In
A.M. Hjalager and G. Richard (Eds), Tourism and Gastronomy (pp. 36-50).
Routledge. London.
Fondness, D. (1994). Measuring tourist motivation and information sources. Annals of
Tourism Research, 21(3), 555- 581.
152
Fondness, D. and Murray, B. (1998). A typology of tourist information search
strategies. Journal of Travel Research, 37(2), 108-119.
Frochot, I. (2003). An analysis of regional positioning and its associated food images in
French Tourism Regional Tourism Brochures. In C. Michael Hall (Eds.), Wine,
Food, and Tourism Marketing (pp. 77-96). New York: The Haworth Hospitality
Press.
Gallarza, M., Saura, I., & Garcia, H. (2002). Destination image. Towards a conceptual
framework. Annals of Tourism Research, 29(1), 56-78.
Gartner, W.(1993). Image formation process. Journal of Travel and Tourism Marketing,
2(2/3), 191-215.
Gartner, W. (1996). Tourism development: Principles, policies, and policies. New York:
Van Nostrand Reinhold.
Gartner, W. and Hunt, J. (1987). An analysis’s of state image change over a twelve-year
period (1971-1983). Journal of Travel Research, 26(2), 15-19.
Getz, D. & Brown, G. (2006). Critical success factors for wine tourism regions: A
demand analysis. Tourism Management, 27, 146-158.
Gitelson, R. & Crompton, L. (1983). The planning horizons and sources of information
used by pleasure vacationers. Journal of Travel Research, 21(3), 2-7.
Gitelson, R. & Kerstetter (1990). The relationship between socio-demographic
variables, benefits sought and subsequent vacation behavior: A case study.
Journal of Travel Research, 28(3), 24-29.
153
Goodall, B. (1988). How tourist choose their holidays: An analytical framework. In B.
Goodall and G. Ashworth (Eds), A Marketing in the tourism industry: The
promotion of destination regions (pp. 1-17) London: Routledge.
Goodall, B., & Ashworth, G., (1988). Marketing in the tourism industry. United
Kingdom: Croom Helm.
Goodrich, J. (1980). Benefit segmentation of U.S international travelers: An empirical
study with American Express. In E.H. Donald, L.S. Elwood, & M. R. James
(Eds.),Tourism marketing and management issues (pp. 133-147). Washington,
D.C: George Washington University.
Graziani, J. (2003). Travel spending leads to 5,000 more restaurants in AAA Tourbook
Guides. Retrieved February 22, 2005 online from http://www.aaanewsroom.net
/Articles.asp?ArticleID=273&SectionID=4&CategoryID=8&SubCategoryID=31
Gunn, C. (1972). Vacationscape: Designing tourist regions. Austin: Bureau of Business
Research, University of Texas.
Gursoy, D. and Chen, J. (2000). Competitive analysis of cross cultural information
search behavior . Tourism Management, 21(6), 583-590.
Guthrie, J. & Gale, P. (1991). Positioning ski areas. In New Horizons Conference
Proceedings, pp. 551- 569. Calgary: University of Calgary.
Hair, J., Anderson, R., Tatham, R., & Black, W. (1998). Multivariate data analysis (5th.
Ed.). New Jersey: Prentice Hall.
Hair, J., Anderson, R., Tatham, R., & Black, W. (2005). Multivariate data analysis (6th.
Ed.). New Jersey: Prentice Hall.
154
Hall, M. & Mitchell, R. (2000). “We are what we eat”. Food, Tourism and
Globalization. Tourism, Culture and Communication, 2(1), 29-37.
Hall, M.& Mitchell, R. (2001). Wine and food tourism. In N. Douglas and R. Derrett,
(Eds), Special interest tourism (pp. 307-325). Australia: John Wiley.
Hall, M. & Mitchell, R (2002). Tourism as a force for gastronomic globalization and
localization. In M. A. Hjalager and Richards, G. (Eds.), Tourism and
Gastronomy (pp. 71-87). London: Routledge.
Heal, F. (1972). Hospitality in early modern England. Oxford: Clarendon Press.
Hegarty, J. & O’Mahony, G. (1999) Gastronomy. A phenomenon of cultural expression
and ecstatic for living. Journal of Hospitality and Tourism Education, 11(4), 25-
29.
Henderson, J. (2000). Food hawkers and tourism in Singapore. International Journal of
Hospitality Management, 19, 109-117
Henderson, J. (2004). Food as a Tourism Resource: A view form Singapore. Tourism
Recreation Research, 29(3), 69-74.
Hjalager, A & Richards, G. (2002). Research issues in tourism and gastronomy. In M.
A. Hjalager and Richards, G. (Eds.), Tourism and Gastronomy (pp. 36-50).
London: Routledge.
Hjalager, A. & Corigliano, M. (2000). Food for tourists – determinants of an image.
International Journal of Tourism Research, (2) 281-293.
Hjlager, A.(2002). A typology of gastronomy tourism. In M.A. Hjalager and G.
Richard (Eds.), Tourism and Gastronomy (pp.21-35). Routledge: London.
155
Hobsbawn, E. & Ranger, T. (1983). The invention of tradition. Cambridge University
Press. Cambridge.
Hu, Y. & Ritchie, J. (1993). Measuring destination attractiveness: A contextual
approach. Journal of Travel Research, Fall, 25-34.
Hunt, J (1971). Image: A Factor in Tourism. Cited in N. Telisman-Kosuta (1989)
Tourism Destination Image. In Tourism Marketing and Management Handbook,
S.F. Witt and L. Moutinho (Eds.), pp. 557-561. Cambridge: Prentice Hall.
Hunt, J. (1975). Image as a factor in tourism development. Journal of Travel Research,
13(3), 1-7.
Jaccard, J., Turrisi, R., & Wan, C. (1990). Interaction effects in multiple regression.
Newbury Park, California: Sage Publications, Inc.
Javlagi, R., Edward, T., & Roa, S. (1992). Consumer behavior in the US pleasure travel
marketplace: An analysis of senior and non-senior travelers. Journal of Travel
Research, 31, 14-20.
Jefferson, A. & Lickorish, L (1988). Marketing tourism: A practical guide. Harlow,
Essex, England: Longman Group UK.
Jenkins, O., (1999). Understanding and measuring tourist destination images. The
International Journal of Tourism Research, 1(1), 1-15.
Jones, A., & Jenkins, I.(2002). A taste of wales – Blas Ar Gymru. Institutional malaise
in promoting welsh food tourism products. In A.M Hjalager, & G. Richards
(Eds.), Tourism and Gastronomy (pp.112- 115). London: Routledge.
156
Josiam, B., Mattson, M., & Sullivan, P. (2004). The Historount: heritage tourism at
Mickey’s Dining Car. Tourism Management, 25(2004), 453-461.
Jueneda, C. & Sastre, F.(1999). Belearic island tourism: A case study in demographic
segmentation. Tourism Management, 20, 549-552.
Katz, E. & Lazarfeld, P. (Eds.) (1955). The part played by people in the flow of mass
communication. Glencoe, IL: Free Press.
Kearns, G. & Philo, C. Preface. In G. Kearns & C. Philo (Eds). Seling Places: The
city as cultural capital past and present (pp. ix-x). Oxford. Pergamom Press,
Oxford.
Kilara, K. & K. Iya (1992). Food and dietary habits of Hindus. Food Technology, 46
(10), 94-104.
Kim, E. & Geistfeld, L. (2003). Consumers’ restaurant choice behavior and the impact
of sosio-economic and demographic factors. Journal of Foodservice Business
Research, 6(1), 3-24.
Kim, H. (1998). Perceived attractiveness of Korean destinations. Annals of Tourism
Research, 25 (2), 340-36.
Kittler, P. & Sucher, K.(1989). Food and culture in America: A nutrition handbook,
New York, NY: Van Nostrand Reinhold.
Kotler, P. & Armstrong, G. (1994b). Principles of Marketing, 6th ed. Englewood
Cliffs, NJ: Prentice Hall.
Kotler, P., Bowens, J. & Makens, J. (2002). Marketing for hospitality and tourism
(3rd ed). New Jersey: Prentice Hall.
157
Kotler, P., Haider, D. & Rein, I. (1993). Marketing Places. New York: Free Press.
Kotler, P., Haider, D.,& Rein, I. (1994). Mercadotecnia de Localidades: Diana
Kraut, R., Olson, J., Banaji, M., Bruckman, A. Cohen, J., & Couper, M.(2004).
Psychological research online. American Psychologist, 59(2), 105-117.
Laws, Scott and Nick (2002). Synergies in destination image: A case study and
conceptualization. The International Journal of Tourism Research. 4(1), 39-55.
Lawson, F., and Bond-Bovy, M., (1977). Tourism and Recreational Development.
London: Architectural Press.
Lee, G., O’Leary, J. & Hong, G. (2002). Visiting propensity predicted by destination
image: German long-haul pleasure travelers to the U.S. International Journal of
Hospitality & Tourism Administration, 3(2), 63- 92.
Lee, M. & Cunningham, L. (2001). A cost/benefit approach to understanding service
loyalty. Journal of Services Marketing, 15(2), 113-130.
Long, L. (2004). Culinary tourism. Lexington, Kentucky: The University Press of
Kentucky.
Lowenberg, M. (1970). Socio-cultural basis of food habits. Food Technology, 24, 27-32.
Lowenberg, M., Todhunter, E., Wilson, E., Savage, J. & Lubawski, J. (1979). Food and
People 3rd ed. New York: John Wiley & Sons.
Lurie, N. (2004). Decision making in information-rich environments: The role of
information structure. Journal of Consumer Research, 30(4), 473- 486.
Lutz, R. & Reilly, P. (1973). An exploration of the effects of perceived social and
performed risk on consumer information acquisition. In Advances in Consumer
158
Research, Vol. 1. (Eds.) K. Weiermair, M. Peters, and M. Schipflinger.
Innsbruck: ITD, pp. 324-335.
MacCannell, D. (1976). The tourist: A new theory of the leisure class. New York:
Schocken Books.
Macionis, N., & Cambourne, B. Wine and food tourism in the Australian capital
territory: Exploring the links. International Journal of Wine Marketing, 10(3), 5-
22.
Maeser, B. (1996, May). Information und Informationsverhalten von Touristen. In
Alpine Tourism: Proceedings of the International Conference at the University of
Insbruck, edited by K.Weiermair, M, Peters, and M.Schipflinger. Innsbruck, ITD.
pp 324-335.
Markin, J. (1974). Consumer Behavior: A cognitive Orientation. Macmillan.
Marris, T. ( 1986). Does food matter. The Tourist Review, 41 (40), 17-20.
Marzursky, D & Hirschman, E. ( 1987). A cross-organizational comparison of retail
buyers’ information search utilization. International Journal of Retailing, 2(1),
44-62.
Maslow, A. (1954). Motivation and Personality. New York: Harper.
Mathieson, A. & Wall, G. (1982). Tourism: economic, physical and social impacts,
London: Longman.
Mayo, E.J., (1973). Regional images and regional travel behavior. In The Fourth Annual
Conference Proceedings of the Travel Research Association, Research for
159
Changing Travel Patterns: Interpretation and Utilization, (pp. 211-218) August
12-15.
McHone, W. & Rungeling, B., (1999). Special cultural events: Do they attract leisure
tourists? Hospitality Management, 18, 215-219.
McIntosh, E. (1995). American food habits in historical perspective, Westport, CT:
Praeger.
McIntosh, R. & Goeldner, C. (1990). Tourism: principles, practices, philosophies.
New York: Wiley.
Mennell, S., Murchott, A. & Van Otterloo, A.(1992). The Sociology of Food: Eating,
Diet, and Culture, London: Sage.
Meyers-Levy, J. (1989). Gender differences in information processing: A selective
interpretation. In P. Cafferata, & A. Tybout (Eds.), Cognitive and affective
responses to advertising (pp.219-260). Lexington, MA: Lexington Book.
Money, R., & Crotts, J. (2003). The effect of uncertainty avoidance on information
search, planning, and purchase intention of international travel vacations.
Tourism Management, 24, 191-202.
Moorthy, S., Ratchford, T. and Debabrata T.(1997). Consumer information search
revisited: Theory and empirical analysis. Journal of Consumer Research, 23,
263-277.
Moutinho, L. (1987). Consumer Behavior in Tourism. European Journal of Marketing,
21, 5-44.
160
Murray, B. (1991). A test of services marketing theory: Consumer information
acquisition activities. Journal of Marketing, 55(1), 11-25.
Newman, J. (1977). Consumer external search: Amount and determinant, in Consumer
and Industrial Buying Behavior, (eds.) Arch G. Woodside, Jangdish N. Sheth,
and Peter D. Bennett, Amsterdam, Holland: North Holland Publishing Company,
pp 79-94.
Nield, K., Kozak, M., & LeGrays, G. (2000). The role of food service in tourist
satisfaction. Hospitality Management, 19, 375-384.
Nunnally, J. & Bernstein, I. (1994). Psychnometric theory, (3rd ed.). New York:
McGraw Hill.
Parenteau, A. (1995). Marketing Pratico del Tourisme. Madrid: Sintesis S.A.
Parsa, H. & Khan, M. (1992). Menu trends in quick service restaurant industry during
the various stages of industry life cycle (1919-1988), Hospitality Research
Journal, 15(1), 93-107.
Pingol, J., & Miyazaki, A.(2005) Journal of Advertising Research, 45(1),132-139.
Pleasure, UK: Cambridge University Press.
Pomero, P. (2005). Travelers explore new world of culinary tourism. Nation’s
Restaurant News. 39(26), 3- 5.
Porter, M. (1985). Competitive Advantage. New York: Free Press.
Preece, J.,(2000). Online communities: Designing Usability, Supporting Sociability.
Wiley: Chichester.
161
Price, L. & Feick, L. (1984). The role of interpersonal sources in external search: An
informational perspective. In Kinner, T.C. (Eds.), Advances in Consumer
Research (pp.366-380). Association For Consumer Research.
Punj, G. & Stnelin (1983). A model of consumer information search behavior for new
automobiles. Journal of Consumer Research, 9, 366- 380.
Quan, S., & Wang, N. ( 2004). Towards a structural model of tourist experience: an
illustration from food experiences in tourism. Tourism Management, 25, 297-
305.
Rand, G., Heath, E., and Alberts, N. (2003). The role of local and regional food in
destination marketing: A South African situation analysis. In C. M. Hall (Eds.),
Wine, Food, and Tourism Marketing (pp. 77-96). New York: The Haworth
Hospitality Press.
Reynolds, P.( 1993). Food and Tourism: Towards an understanding of sustainable
culture. Journal of Sustainable Tourism, 1(1), 48-54
Richards, G. (2002). Gastronomy: an essential ingredient in tourism production and
consumption? In A.M. Hjalager and G. Richards (Eds.). Tourism and
Gastronomy ( pp. 3-20). London: Routledge.
Richards, G.(1996). The scope and significance of cultural tourism. In G. Richard
(Eds.), Cultural Tourism In Europe. ( pp. 19-45). Oxon: CAB International.
Riley, M. (2000). What are the implications of tourism destination identity for food and
beverage policy? Culture and cuisine in a changing global marketplace in
162
strategic questions. In R. Woods (Eds.), Food and Beverage Management (pp
187-194) London: Butterworth Heinemann.
Rimmington, M. & Yuskel, A. (1998). Tourist Satisfaction and food service
experience: Results and implications of an empirical investigation, Anatolia, 9(1),
37-57.
Rittichainuwat, Qu, & Brown. Thailand's international travel image: mostly favorable.
The Cornell Hotel and Restaurant Administration Quarterly, 42( 2), 82-95.
Ryan, C (1997). Recreational Tourism: A social perspective. London, Routledge.
Santich, B (1996). Introduction to sustaining gastronomy, in B. Santich, J. Hiller and C.
Kerry (Eds). Proceeding of the Eight Symposium of Australia Gastronomy,
Adelide: self- published.
Santich, B. (2004). The study of gastronomy and its relevance to hospitality education
and training. International Journal of Hospitality Management, 23(2004), 15-24.
Santos Arrebola, J. (1994). La imagen en tourismo. In I Congreso de la Asociacion
Espafinla de Expertos cientificos en Tourismo, pp. 209 – 217. Marbella: Institute
de Estudios Turisticos.
Scarpato, R.(2002). Perspective of gastronomy studies. In Hjalager, A, and Richard, G.
(Eds), Tourism and Gastronomy. Routledge. London, pp. 51-70.
Schmidt, J. and Spreng, R. (1996). A proposed model of external consumer information
search. Journal of Academy of Marketing Science, 24, 246-256.
Schnider, I & Sonmez, S. (1999). Exploring the touristic image of Jordan. Tourism
Management, 20(4), 539-542.
163
Schumacher, P., & Morahan-Martin, J.( 2001). Gender, Internet, and computer attitudes
and experiences. Computers in Human Behavior 17(1), 95-110.
Scott, R., Schewe, C. & Frederick, D. (1978). A multi-brand/multi-attribute model of
tourist state choice. Journal of Travel Research, 17(3), 23-29.
Sheldon, P. & Fox, M. (1988). The role of foodservice in vacation choice and
experience. A cross-cultural analysis. Journal of Travel Research, 27(2), 9-15.
Singapore Tourism Board (2003). Muslim Visitor’s Dining Guide. The Best of Local and
International Cuisine. Singapore.: Singapore Tourism Board.
Singapore Tourism Board(2004). Makan Delights. An Insider Guide to Singapore’s
Unique Flavours. Singapore.:Singapore Tourism Board.
Singapore Tourism Board. (2002). Singapore Wins Gold at IFEA. Singapore Tourism
Board Press Release. 23 January.
Sirgy, M. & Su, C.(2000). Destination image, self congruity, and travel behavior:
Toward an integrative model. Journal of Travel Research, 38(4), 340-352.
Smith, S. (1991). The supply-side definition of tourism: Reply to Leiper. Annals of
Tourism Research, 15, 179-190.
Snepenger, D., Meged, K., Snelling, M., & Worrall, K. (1990). Information Search
strategies by destination-naïve tourist. Journal of Travel Research, 29(1), 13-16.
Srinivas, N. (1990). Pre-purchase external information search for information. In
V.Ziethaml (Eds.), Review of Marketing (pp. 153-189). Chicago: American
Marketing Association.
Tannahill, R (1988). Food history, New York: Crown Trade Paperbacks.
164
Tapachai, N & Waryszak, R. (2000). An examination of the role of beneficial image in
tourist destination selection. Journal of Travel Research, 39(1), 37-44.
Tassiopoulos, D., Nancy, N., & Haydam, N.(2004). Wine tourist in South Africa: A
demographic and psychographic study. Journal of Wine Research, 15(1), 51-63.
Tefler, D., and Wall, G., (1996). Linkages between tourism and food production. Annals
of Tourism, 23(3), 635-653.
Torres, R. (2003). Linkages between tourism and agriculture in Mexico. Annals of
Tourism, 30(3), 546-566.
Travel Industry Association of America (2004). The economic review of travel in
America, 2004 edition. Retrieved January 23, 2005 from http://tia.org/
Um, S. & Crompton, J. (1990). Attitude determinants in tourism destination choice.
Annals of Tourism Research,17, 432-448.
Uysal, M., McDonald, C., & Reid, L. (1990). Sources of information used by
international visitors to US parks and natural areas. Journal of Parks and
Recreation Administration, 8(1), 51-59.
Van Raaij, W. & Francken, D. (1984). Vacation decisions, activities and satisfaction.
Annals of Tourism Research, 11. 101- 112
Vogt, C. & Fesermaier, D.(1998). Expanding the functional information search model.
Annals of Tourism Research, 25(3), 551-578.
Walmsley, J, & Lewis, (1984). Human geography: behavioral approaches, New York:
Longman.
Warde, A. & Martens, L. (2000). Eating Out: social differentiation, consumption, and
165
Waters, S. (1988). Travel industry world yearbook: The big picture. New York: Child
& Waters.
Wenkman, N. (1969). Cultural determinants of nutritional behavior, Nutrition Programs
News, July/August.
Wilkerson, C. (2003). Travel and tourism: An overlook industry in the U.S. and tenth
district. Economic Review – Federal Reserve Bank of Kansas City, 88(3), 45- 71.
Wilkie, L. & Dickson, P. (1985). Shopping for appliances: Consumer’s strategies and
patterns of information search. Cambridge, MA: marketing Science Iinstitute.
Williams, P. (2001). The evolving images of wine tourism destinations. Tourism
Recreation Research, 28(2), 3-10.
Wolf, Erik (2002). Culinary Tourism: A Tasty Economic Proposition. Retrieved from
http://www.culinarytourism.org.
Woodside, A. & Lysonski, S. (1989). A general model of traveler destination choice,
Journal of Travel Research, 16(1), 14-18.
Woodside, G. & Ronkainen, A. (1980). Vacation travel planning segments: Self-
planning vs. user of the motor club and traveler agents. Annals of Tourism
Research, 7(3), 385-394.
Yoder, D. (1972). “Folk Cookery.” In Folklore and Folklife: An introduction. In R. M.
Dorson (Eds.) pp. 325. Chicago: University of Chicago Press.
Zhang, H., Qu, H. & Tang, V. (2004). A case study of Hong Kong residents’ outbound
leisure travel, Tourism Management, 25, 267-273.
166

APPENDIX A
FOCUS GROUP QUESTIONS
167
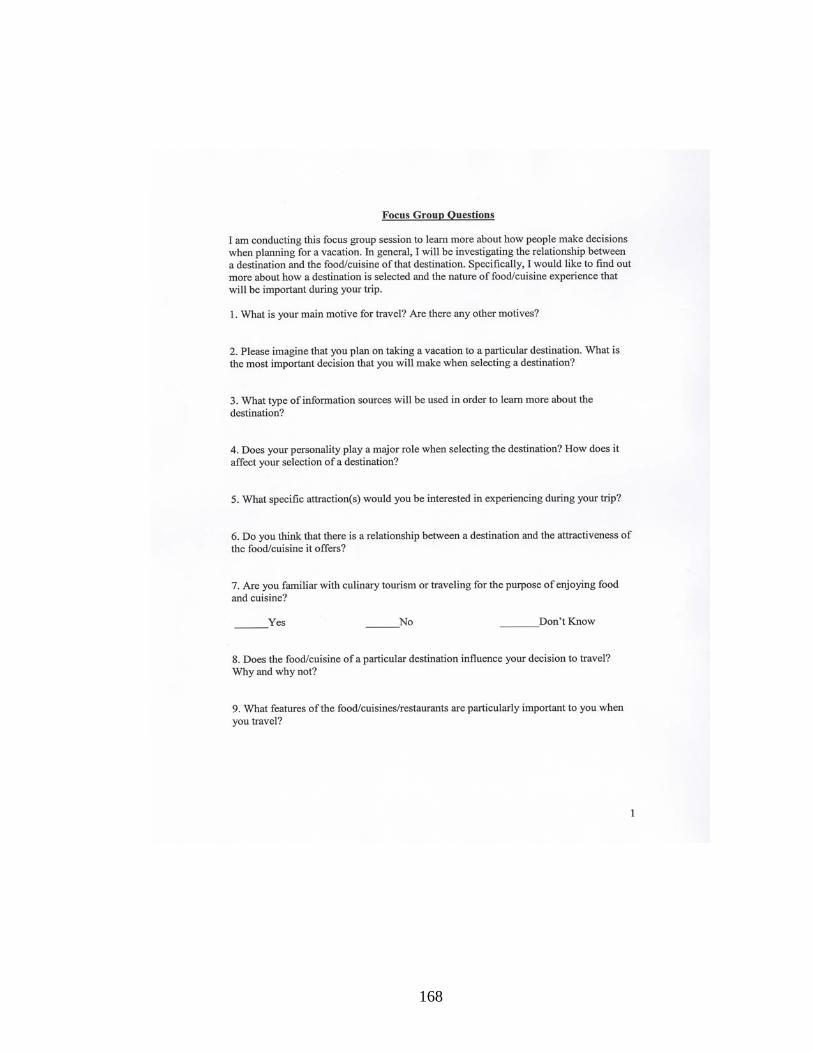
168

APPENDIX B
SURVEY QUESTIONAIRE
169
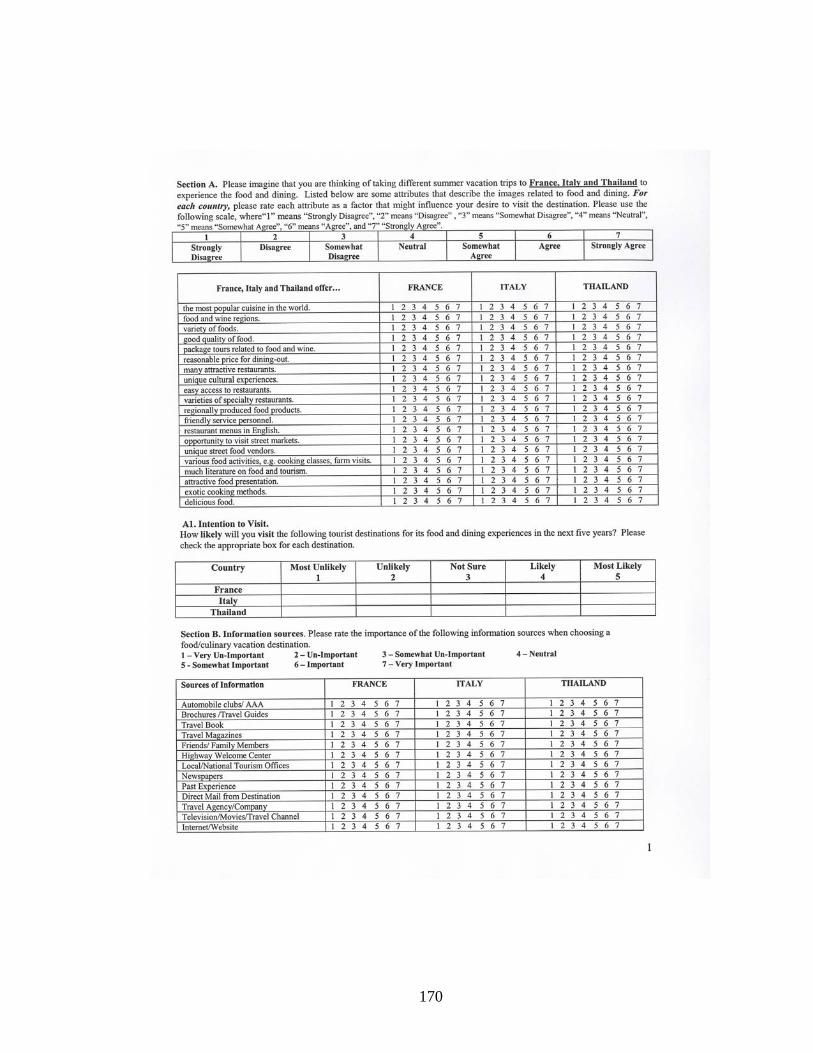
170
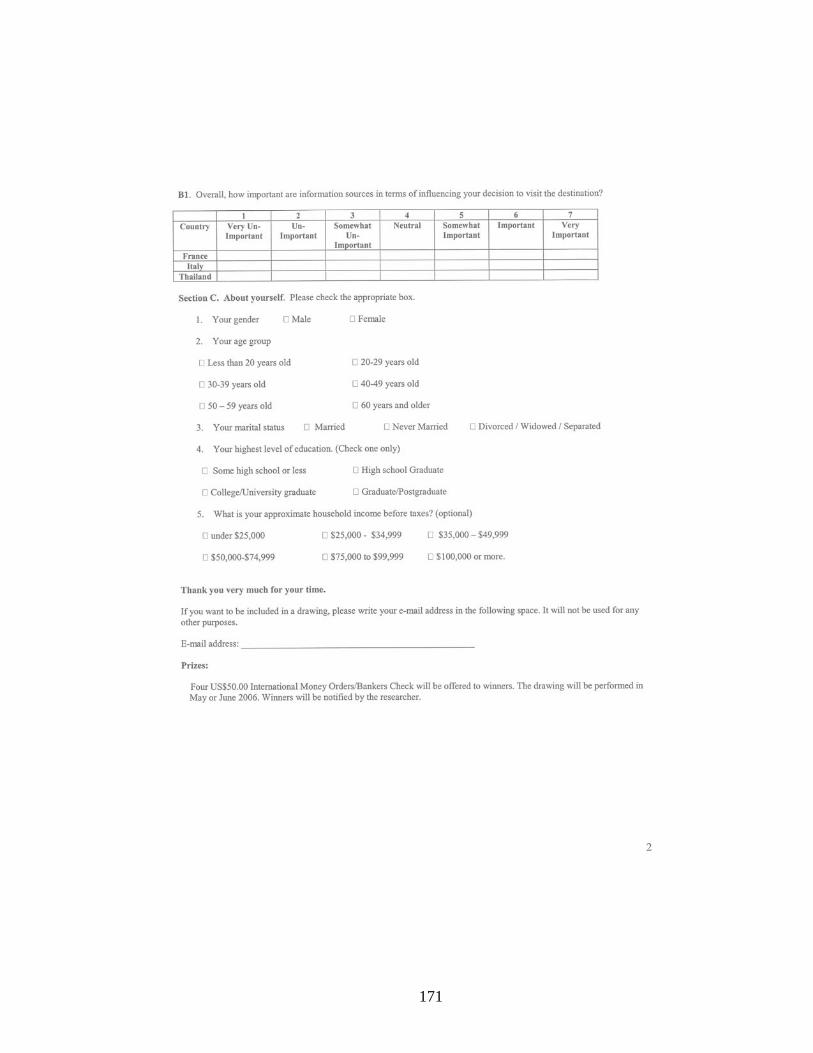
171

APPENDIX C
IRB FOR SURVEY RESEARCH
172
173
APPENDIX D
IRB FOR FOCUS GROUP
174
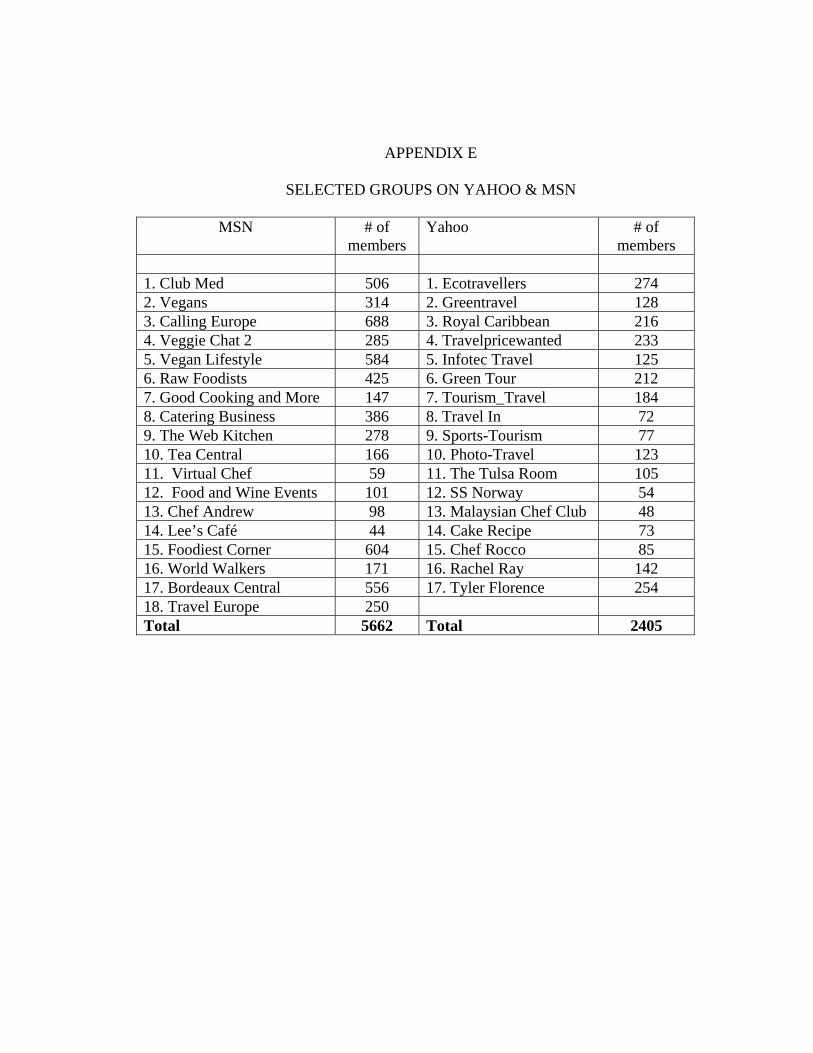
APPENDIX E
SELECTED GROUPS ON YAHOO & MSN
MSN # of members
Yahoo # of members
1. Club Med 506 1. Ecotravellers 274 2. Vegans 314 2. Greentravel 128 3. Calling Europe 688 3. Royal Caribbean 216 4. Veggie Chat 2 285 4. Travelpricewanted 233 5. Vegan Lifestyle 584 5. Infotec Travel 125 6. Raw Foodists 425 6. Green Tour 212 7. Good Cooking and More 147 7. Tourism_Travel 184 8. Catering Business 386 8. Travel In 72 9. The Web Kitchen 278 9. Sports-Tourism 77 10. Tea Central 166 10. Photo-Travel 123 11. Virtual Chef 59 11. The Tulsa Room 105 12. Food and Wine Events 101 12. SS Norway 54 13. Chef Andrew 98 13. Malaysian Chef Club 48 14. Lee’s Café 44 14. Cake Recipe 73 15. Foodiest Corner 604 15. Chef Rocco 85 16. World Walkers 171 16. Rachel Ray 142 17. Bordeaux Central 556 17. Tyler Florence 254 18. Travel Europe 250 Total 5662 Total 2405
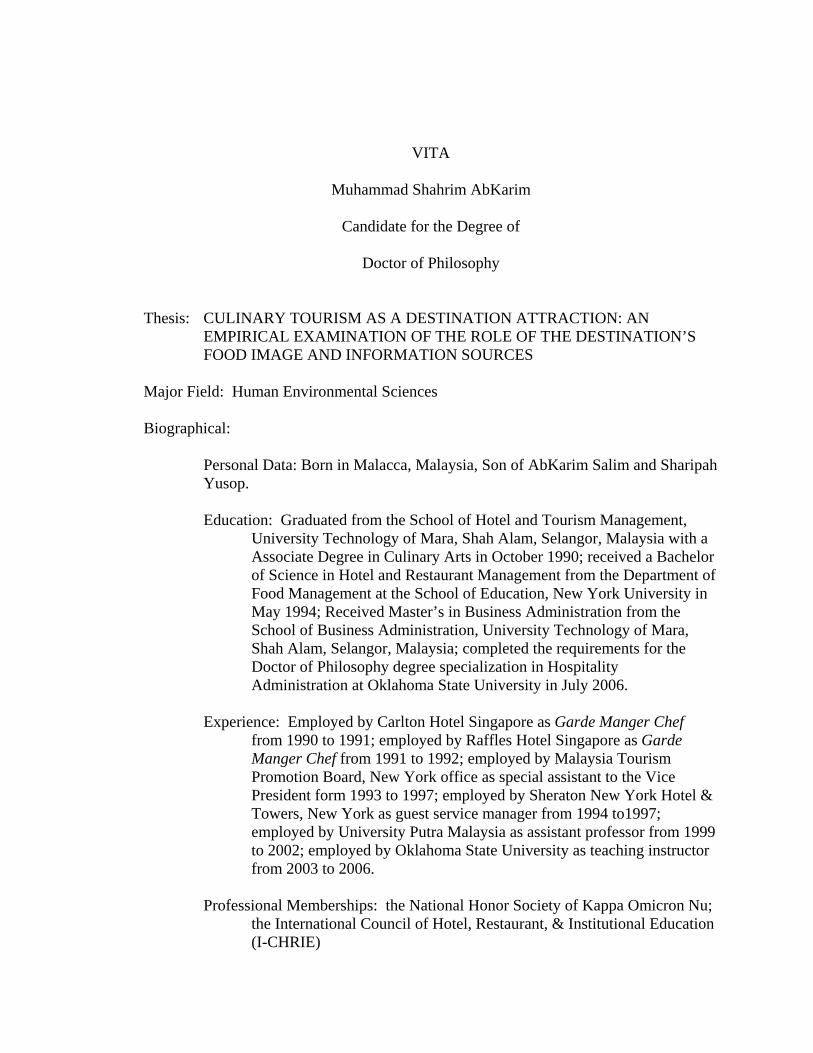
VITA
Muhammad Shahrim AbKarim
Candidate for the Degree of
Doctor of Philosophy Thesis: CULINARY TOURISM AS A DESTINATION ATTRACTION: AN
EMPIRICAL EXAMINATION OF THE ROLE OF THE DESTINATION’S FOOD IMAGE AND INFORMATION SOURCES
Major Field: Human Environmental Sciences Biographical:
Personal Data: Born in Malacca, Malaysia, Son of AbKarim Salim and Sharipah Yusop.
Education: Graduated from the School of Hotel and Tourism Management,
University Technology of Mara, Shah Alam, Selangor, Malaysia with a Associate Degree in Culinary Arts in October 1990; received a Bachelor of Science in Hotel and Restaurant Management from the Department of Food Management at the School of Education, New York University in May 1994; Received Master’s in Business Administration from the School of Business Administration, University Technology of Mara, Shah Alam, Selangor, Malaysia; completed the requirements for the Doctor of Philosophy degree specialization in Hospitality Administration at Oklahoma State University in July 2006.
Experience: Employed by Carlton Hotel Singapore as Garde Manger Chef
from 1990 to 1991; employed by Raffles Hotel Singapore as Garde Manger Chef from 1991 to 1992; employed by Malaysia Tourism Promotion Board, New York office as special assistant to the Vice President form 1993 to 1997; employed by Sheraton New York Hotel & Towers, New York as guest service manager from 1994 to1997; employed by University Putra Malaysia as assistant professor from 1999 to 2002; employed by Oklahoma State University as teaching instructor from 2003 to 2006.
Professional Memberships: the National Honor Society of Kappa Omicron Nu;
the International Council of Hotel, Restaurant, & Institutional Education (I-CHRIE)
Name: Muhammad Shahrim Ab Karim Date of Degree: July, 2006 Institution: Oklahoma State University Location: Stillwater, Oklahoma Title of Study: CULINARY TOURISM AS A DESTINATION ATTRACTION: AN
EMPIRICAL EXAMINATION OF THE ROLE OF THE DESTINATION’S FOOD IMAGE AND INFORMATION SOURCES
Pages in Study: 188 Candidate for the Degree of Doctor of Philosophy
Major Field: Human Environmental Sciences Scope and Method of Study: The objectives of the study were to: 1) explain the
relationship between a destination’s food image and the travelers intention to visit; 2) examine the influence that sources of information have on travelers’ intention to visit a destination; and 3) identify the moderating effect of demographic characteristics on: a) the relationship between a destination’s food image and the travelers’ intention to visit; b) the relationship between information sources and the travelers’ intention to visit. A cross-sectional sample survey was conducted. The population of the study was all members of online travel and food groups in Yahoo and MSN. A convenience sampling procedure was employed in this study. Descriptive Statistics, Factor Analysis, Multiple Regression and Hierarchical Regression were performed for the data analysis.
Findings and Conclusions: There were two major findings in this study: theoretical and
managerial implications. First, from a theoretical perspective, the study enriched the body of literature in culinary tourism. The results indicated that each destination has its own unique images that characterize the destination. Second, in terms of the managerial implications of the study, it was expected that this study would be used as a foundation in developing culinary tourism strategies for destination rich countries with culinary heritage. Specifically, the findings of this study could help destinations to formulate the type of food image they want to establish. Managers could also use the different sources of information recommended in this study to maximize their marketing efforts. By projecting suitable destinations’ food image and utilizing an appropriate marketing strategy, culinary tourism could be a crucial segment of the tourism industry.
ADVISER’S APPROVAL: Jerrold Leong