CUBE: A success story -- But does it have a future?
29
Mitglied der Helmholtz-Gemeinschaft CUBE: A success story -- But does it have a future? Vi-HPS 10 th Anniversary Workshop | Bernd Mohr
Transcript of CUBE: A success story -- But does it have a future?

Mitg
lied
der H
elm
holtz
-Gem
eins
chaf
t
CUBE: A success story -- But does it have a future?
Vi-HPS 10th Anniversary Workshop | Bernd Mohr

JSC 2
Context: 18 Years of Automatic Trace Analysis
• 1999 – 2004
• Working Group § EU ESPRIT + IST
• http://webarchiv.fz-juelich.de/apart/
• Sequential analyzer
§ EXPERT • http://webarchiv.fz-juelich.de/jsc/kojak.html
• 2006 – now
• Virtual Institute § Helmholtz
• http://www.vi-hps.org/
• Parallel analyzer § SCOUT
• http://www.scalasca.org
3 © 2005 Bernd Mohr, Forschungszentrum Jülich
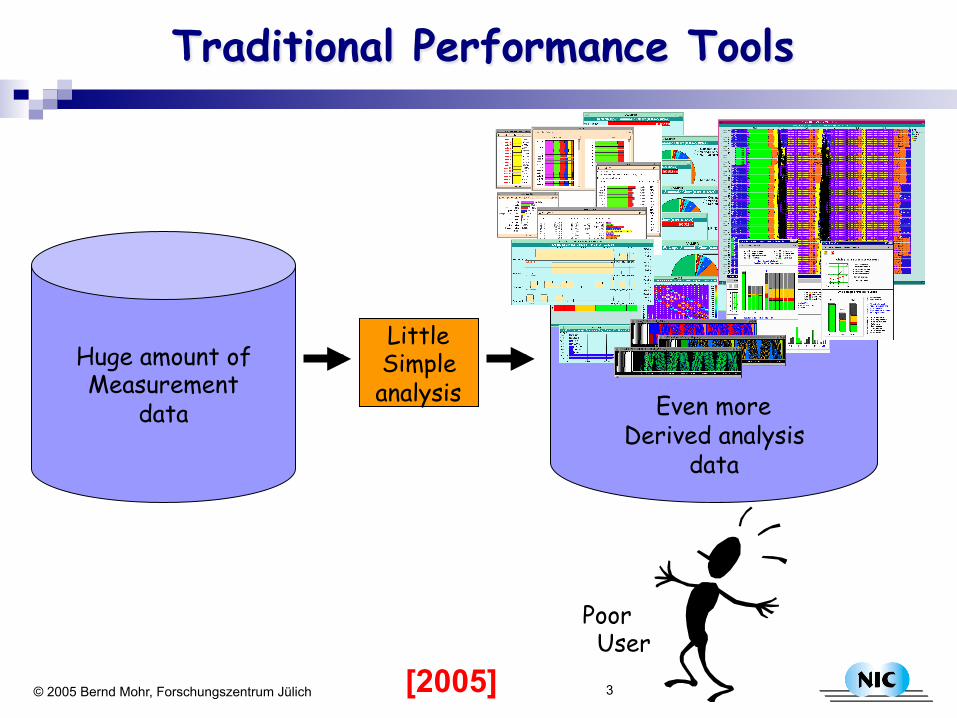
Traditional Performance Tools
Huge amount of Measurement
data
Little Simple analysis
Even more Derived analysis
data
Poor User
[2005]
4 © 2005 Bernd Mohr, Forschungszentrum Jülich
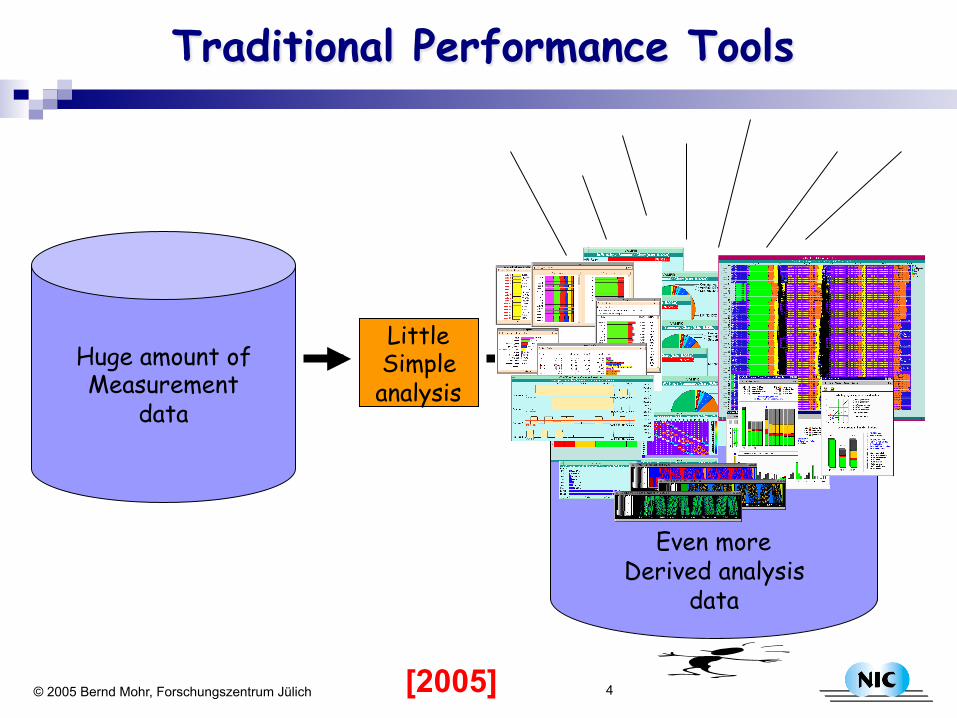
Huge amount of Measurement
data
Little Simple analysis
Even more Derived analysis
data
Traditional Performance Tools
[2005]
5 © 2005 Bernd Mohr, Forschungszentrum Jülich
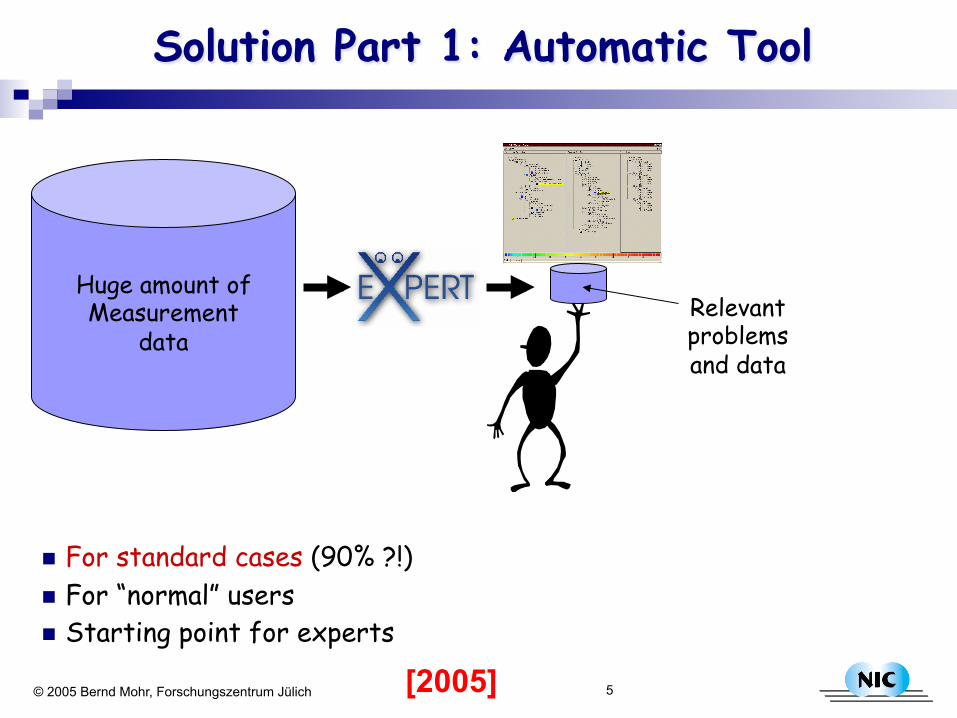
Solution Part 1: Automatic Tool
n For standard cases (90% ?!) n For “normal” users n Starting point for experts
Huge amount of Measurement
data Relevant problems and data
[2005]

6 © 2005 Bernd Mohr, Forschungszentrum Jülich
Solution Part 2: Expert Tools + Expert
Huge amount of Measurement
data
Little Simple analysis
Even more Derived analysis
data
User
Tool Expert
n For non-standard / tricky cases (10%) ð More productivity for performance analysis process!
[2005]

Forschungszentrum Jülich
7
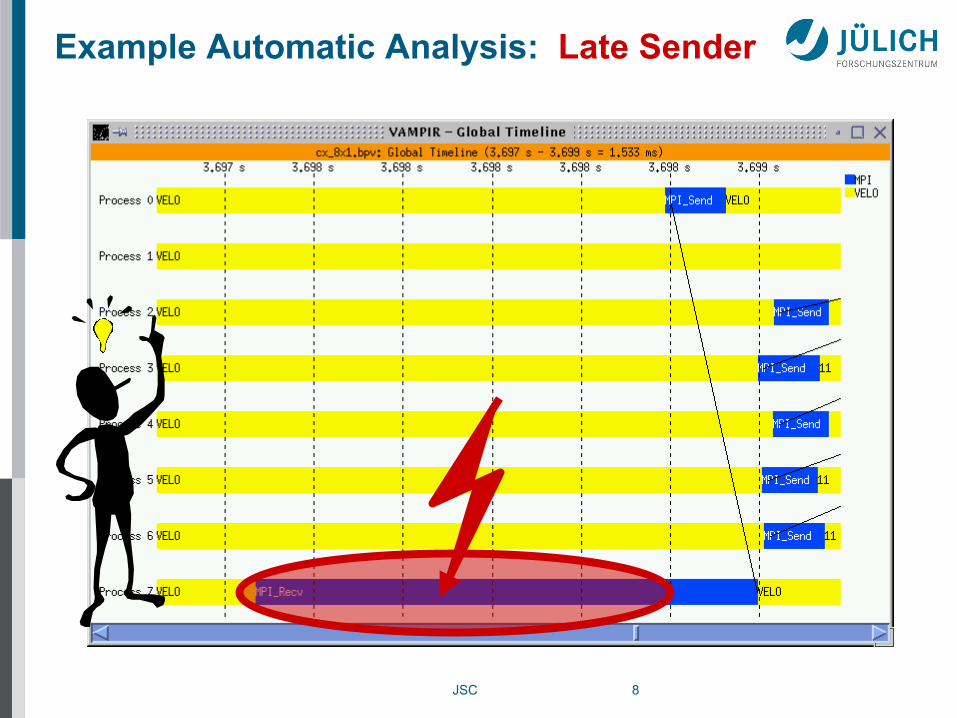
Example: Late Sender (blocked receiver)
Czochralski crystal growth
[2001]
JSC 8
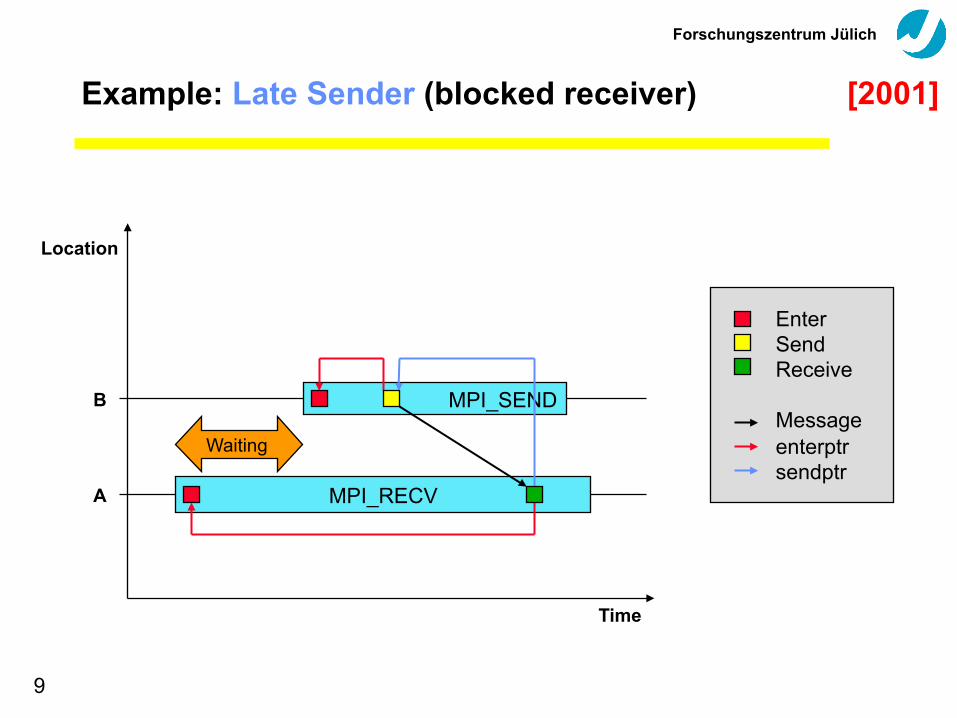
Example Automatic Analysis: Late Sender
Forschungszentrum Jülich
9
Example: Late Sender (blocked receiver)
Location
Time
MPI_SEND
MPI_RECV
Enter Send Receive Message enterptr sendptr
Waiting
B
A
[2001]

JSC 10
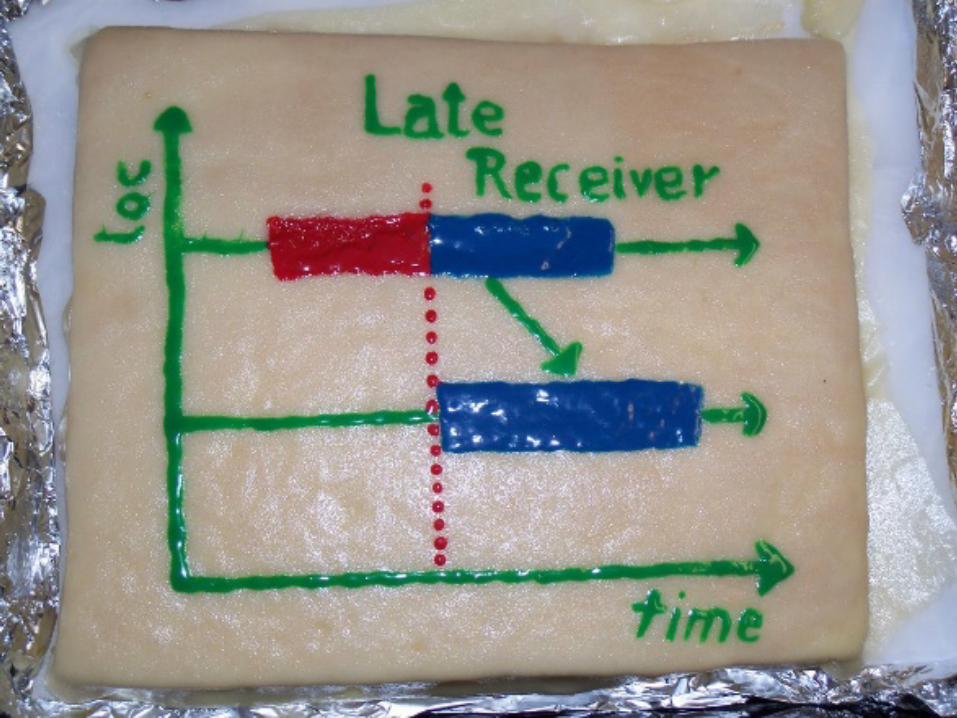
Scalasca: Example MPI Patterns
time
proc
ess
ENTER EXIT SEND RECV COLLEXIT
(a) Late Sender time
proc
ess
(b) Late Receiver
time
proc
ess
(d) Wait at N x N time
proc
ess
(c) Late Sender / Wrong Order
Forschungszentrum Jülich
11
Presentation of Performance Behavior
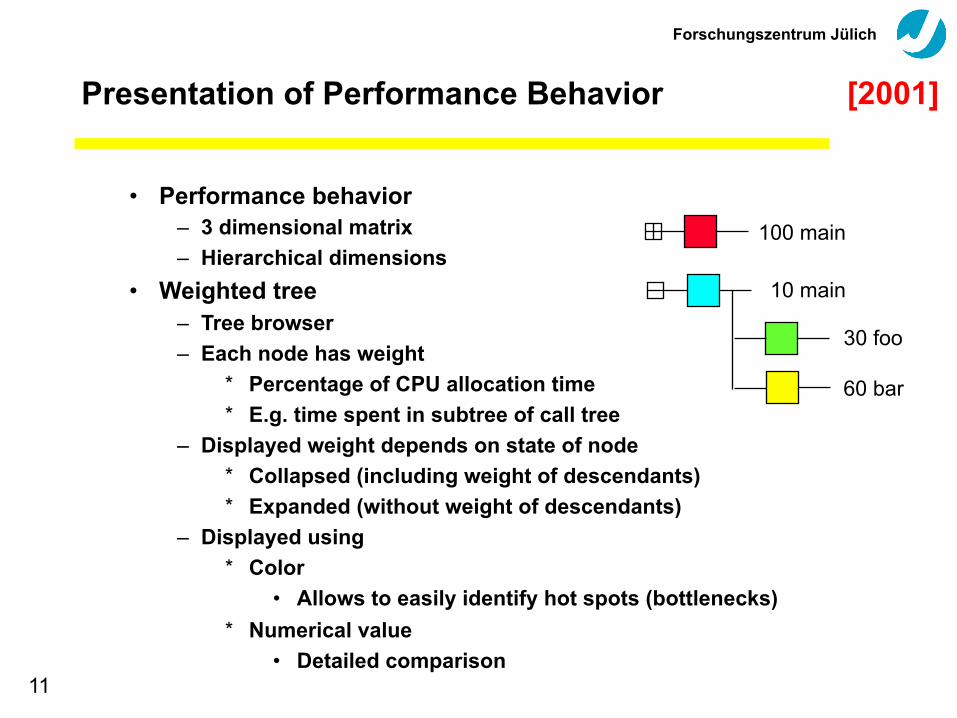
• Performance behavior – 3 dimensional matrix – Hierarchical dimensions
• Weighted tree – Tree browser – Each node has weight
* Percentage of CPU allocation time * E.g. time spent in subtree of call tree
– Displayed weight depends on state of node * Collapsed (including weight of descendants) * Expanded (without weight of descendants)
– Displayed using * Color
• Allows to easily identify hot spots (bottlenecks) * Numerical value
• Detailed comparison
100 main
60 bar
10 main
30 foo
[2001]
Forschungszentrum Jülich
12
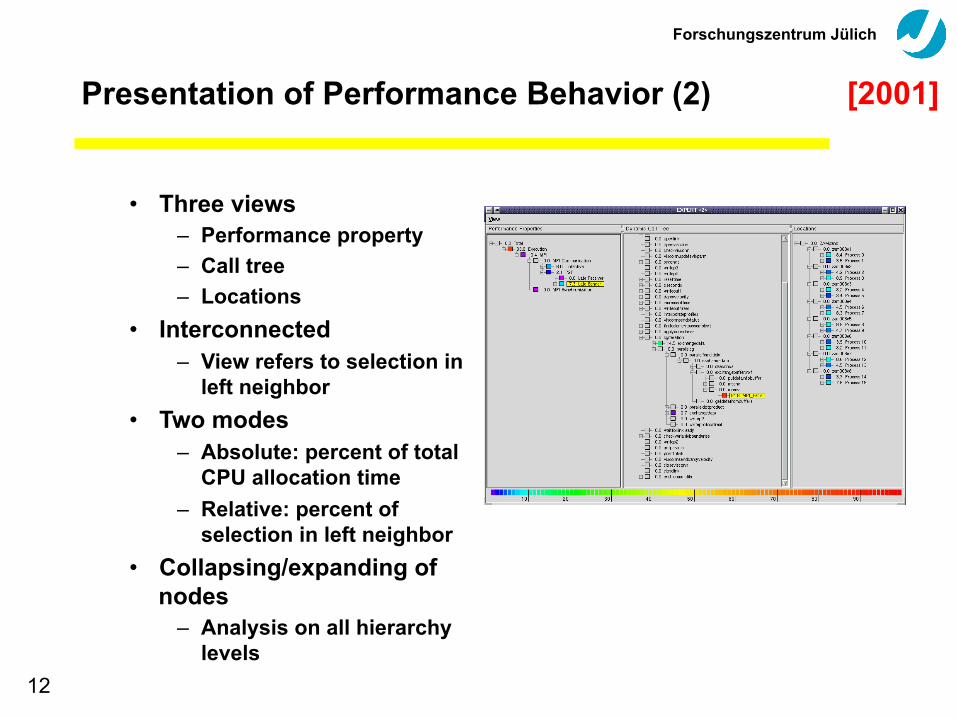
Presentation of Performance Behavior (2)
• Three views – Performance property – Call tree – Locations
• Interconnected – View refers to selection in
left neighbor • Two modes
– Absolute: percent of total CPU allocation time
– Relative: percent of selection in left neighbor
• Collapsing/expanding of nodes
– Analysis on all hierarchy levels
[2001]
Forschungszentrum Jülich
13 [13]
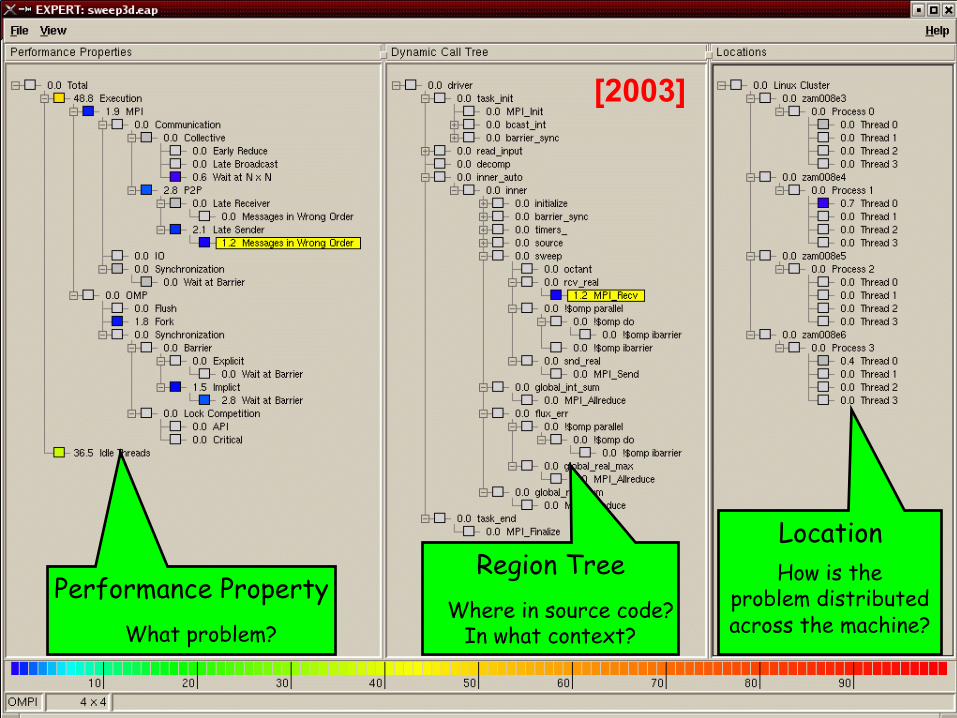
Location How is the
problem distributed across the machine?
Performance Property What problem?
Region Tree Where in source code?
In what context?
[2003]
14 © 2007 Bernd Mohr, Forschungszentrum Jülich
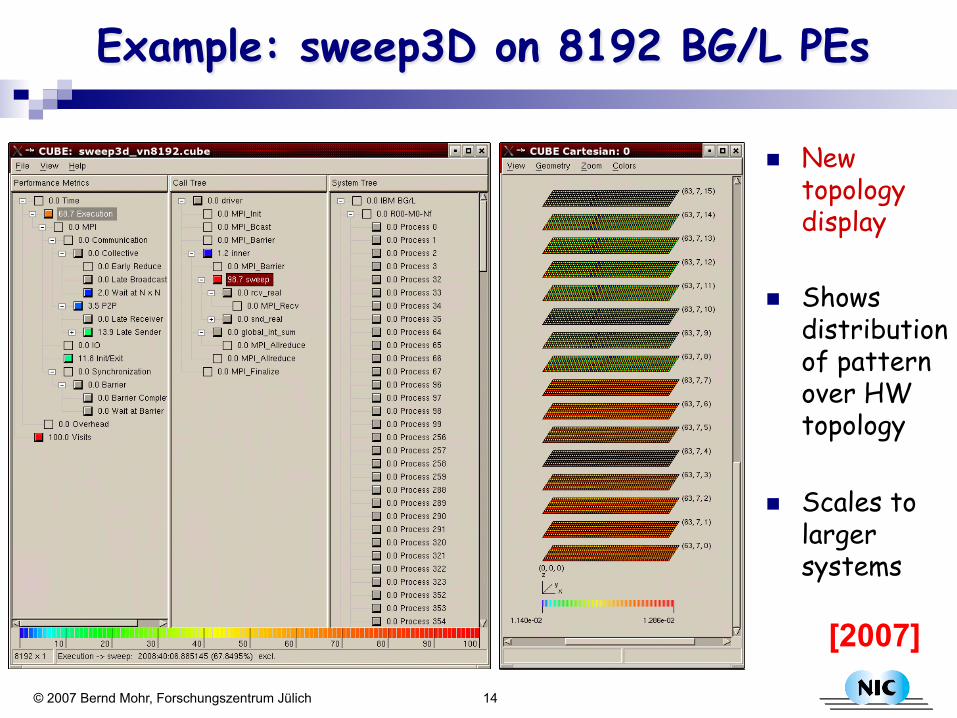
Example: sweep3D on 8192 BG/L PEs
n New topology display
n Shows distribution of pattern over HW topology
n Scales to larger systems
[2007]
26. May 2008 JSC 15
2009
http://www.scalasca.org [email protected]
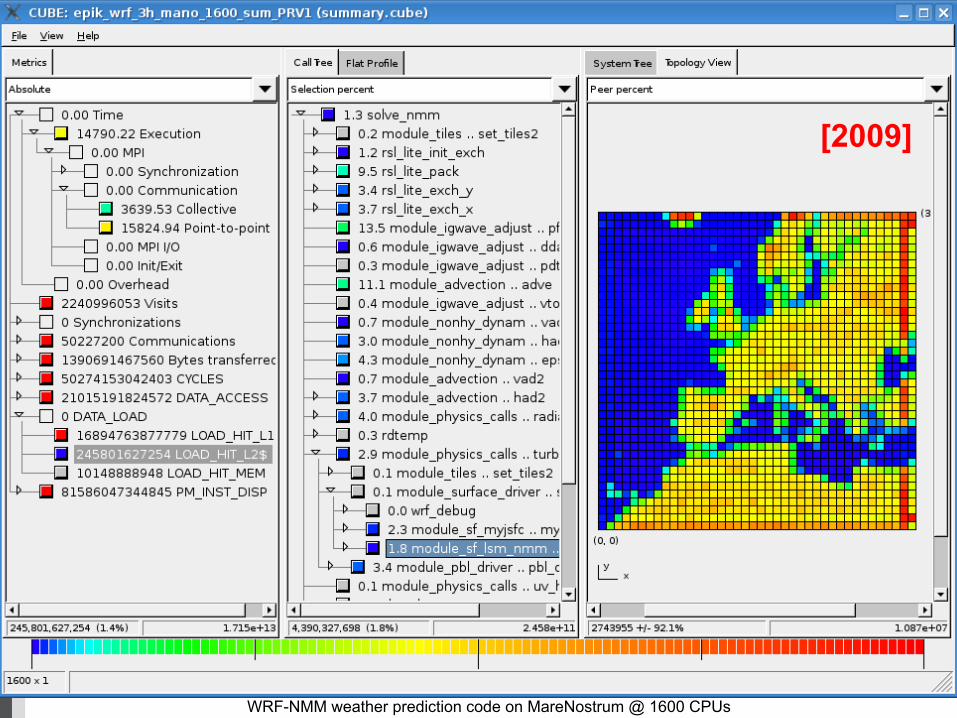
WRF-NMM weather prediction code on MareNostrum @ 1600 CPUs
[2009]
JSC 16
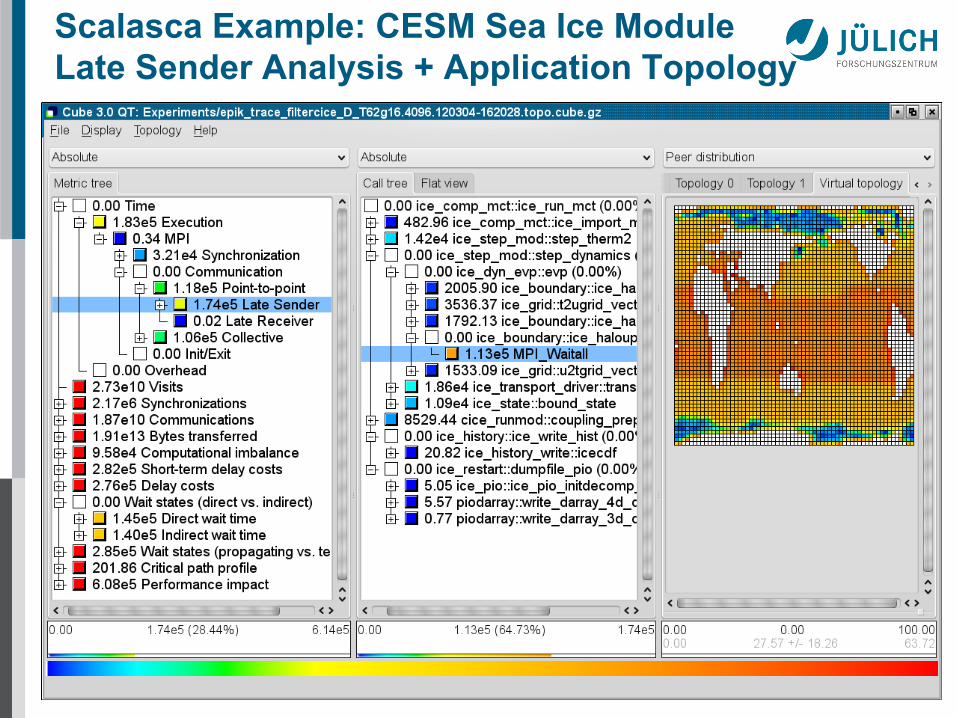
Scalasca Example: CESM Sea Ice Module Late Sender Analysis + Application Topology
30. June 2010 JSC 17
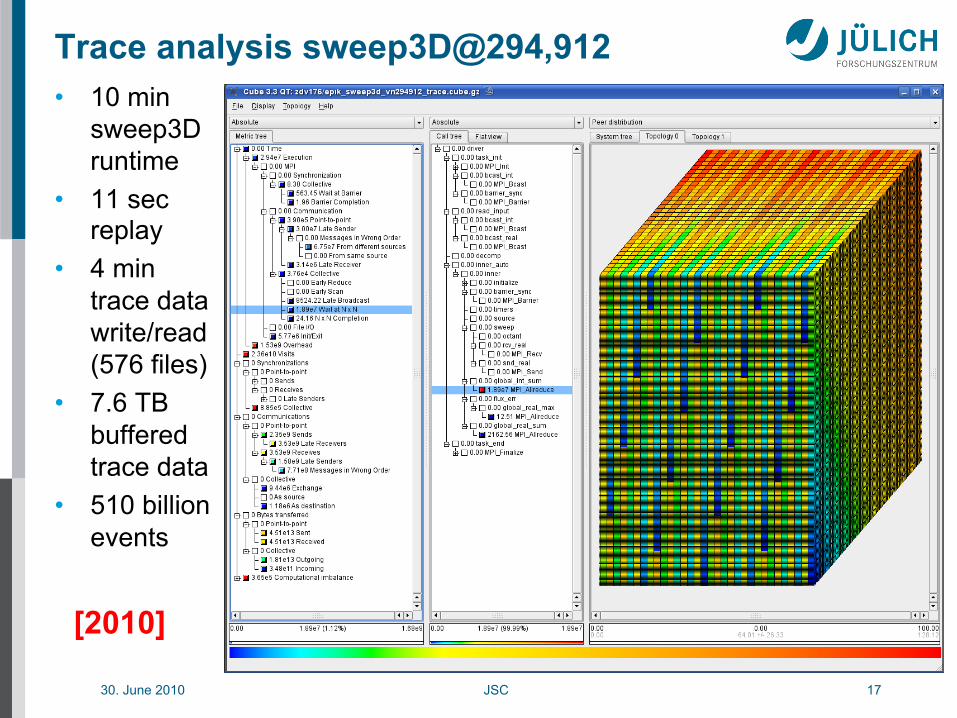
Trace analysis sweep3D@294,912 • 10 min
sweep3D runtime
• 11 sec replay
• 4 min trace data write/read (576 files)
• 7.6 TB buffered trace data
• 510 billion events
[2010]
Feb 2013 JSC 18
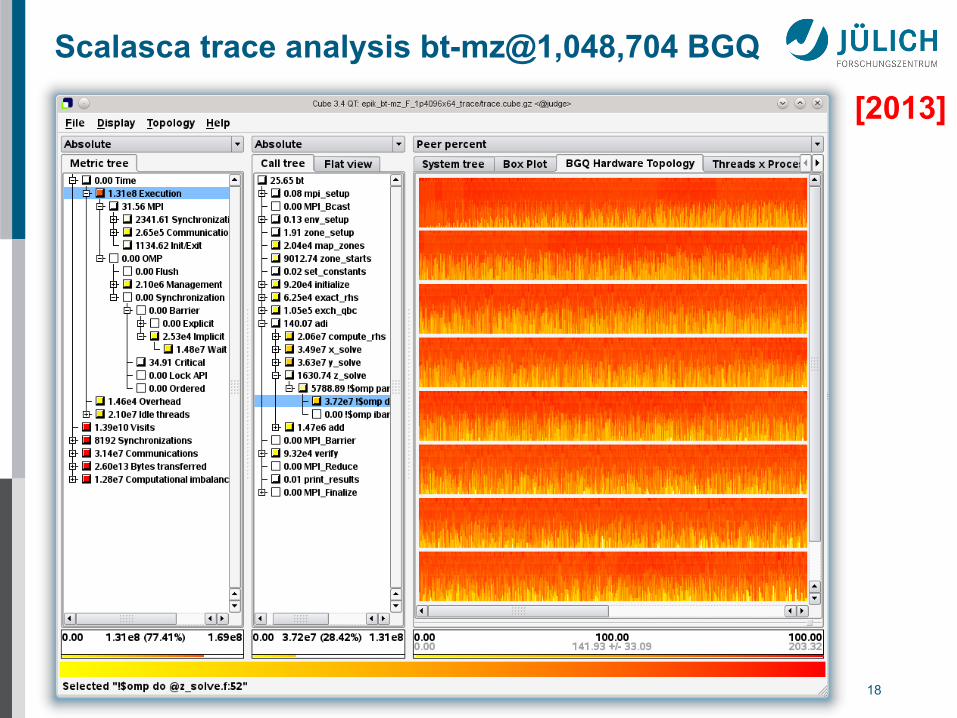
Scalasca trace analysis bt-mz@1,048,704 BGQ
[2013]
August 2015 JSC 19
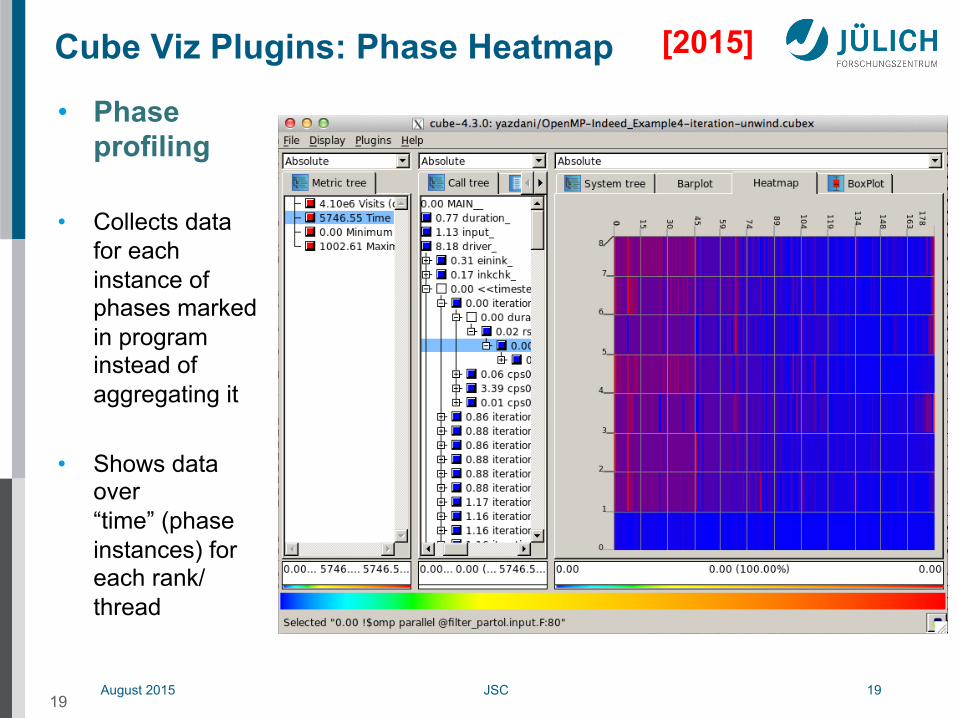
Cube Viz Plugins: Phase Heatmap
• Phase profiling
• Collects data for each instance of phases marked in program instead of aggregating it
• Shows data over “time” (phase instances) for each rank/thread
19
[2015]

August 2015 JSC 20
Cube Viz Plugins: Phase Barplot
• Phase profiling
• Collects data for each instance of phases marked in program instead of aggregating it
• Shows min/max/avg metric value over “time” (phase instances)
20
[2015]
August 2015 JSC 21
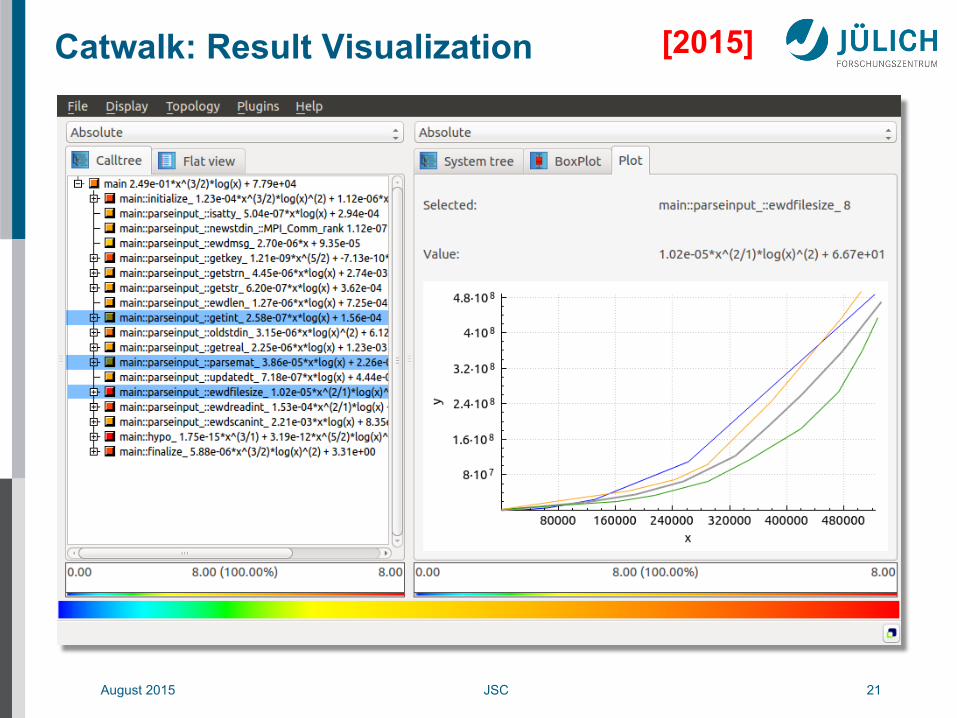
Catwalk: Result Visualization [2015]
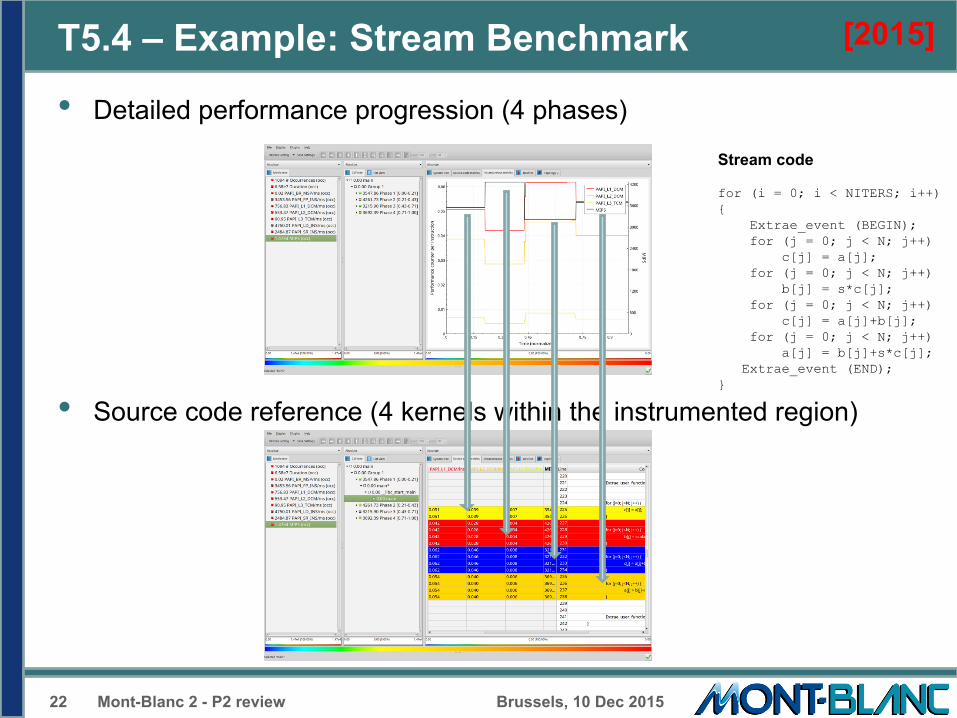
T5.4 – Example: Stream Benchmark
• Detailed performance progression (4 phases)
• Source code reference (4 kernels within the instrumented region)
Brussels, 10 Dec 2015 22
Stream code for (i = 0; i < NITERS; i++) { Extrae_event (BEGIN); for (j = 0; j < N; j++) c[j] = a[j]; for (j = 0; j < N; j++) b[j] = s*c[j]; for (j = 0; j < N; j++) c[j] = a[j]+b[j]; for (j = 0; j < N; j++) a[j] = b[j]+s*c[j]; Extrae_event (END); }
Mont-Blanc 2 - P2 review
[2015]
JSC 23
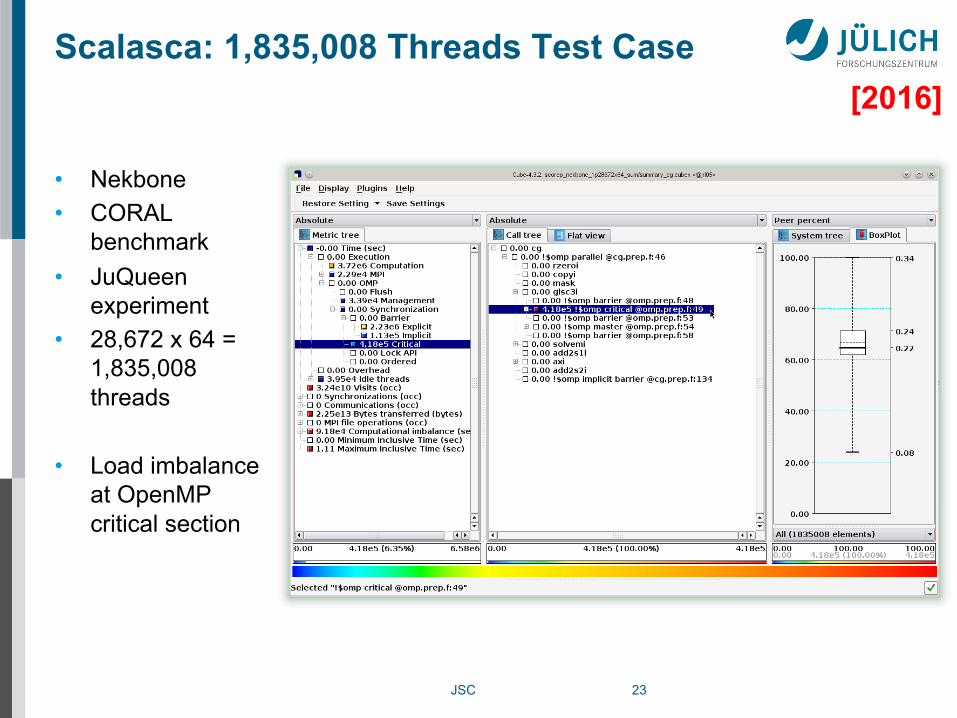
Scalasca: 1,835,008 Threads Test Case
• Nekbone • CORAL
benchmark • JuQueen
experiment • 28,672 x 64 =
1,835,008 threads
• Load imbalance at OpenMP critical section
[2016]
JSC 24
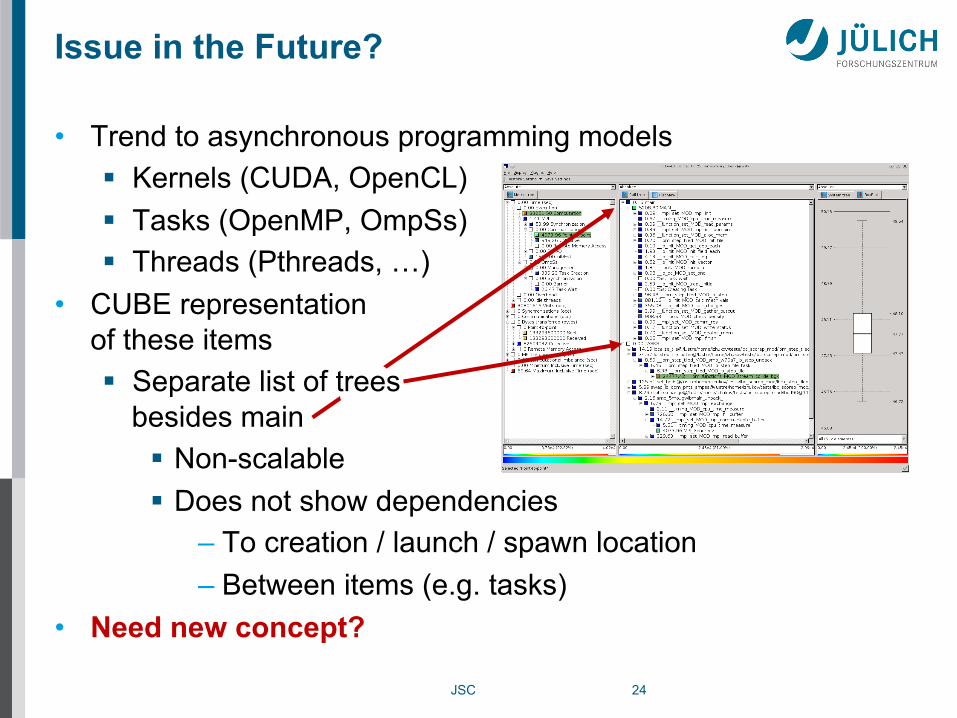
Issue in the Future?
• Trend to asynchronous programming models § Kernels (CUDA, OpenCL) § Tasks (OpenMP, OmpSs) § Threads (Pthreads, …)
• CUBE representation of these items § Separate list of trees
besides main § Non-scalable § Does not show dependencies
– To creation / launch / spawn location – Between items (e.g. tasks)
• Need new concept?

JSC 25
YOU KNOW YOU MADE IT … … IF LARGE COMPANIES “COPY” YOUR STUFF
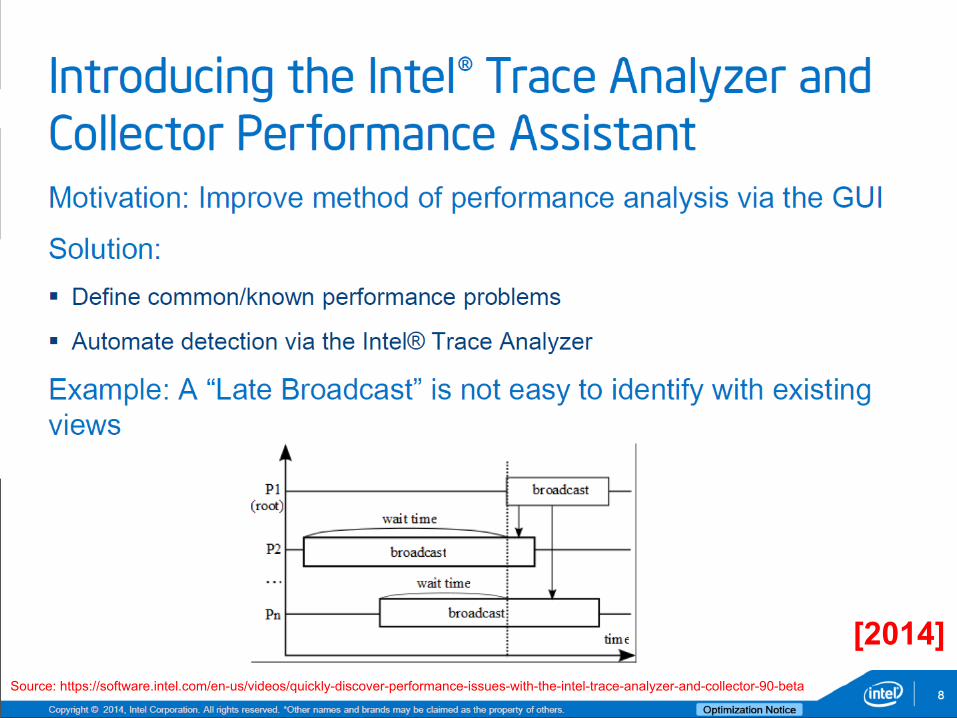
JSC 26 Source: https://software.intel.com/en-us/videos/quickly-discover-performance-issues-with-the-intel-trace-analyzer-and-collector-90-beta
[2014]
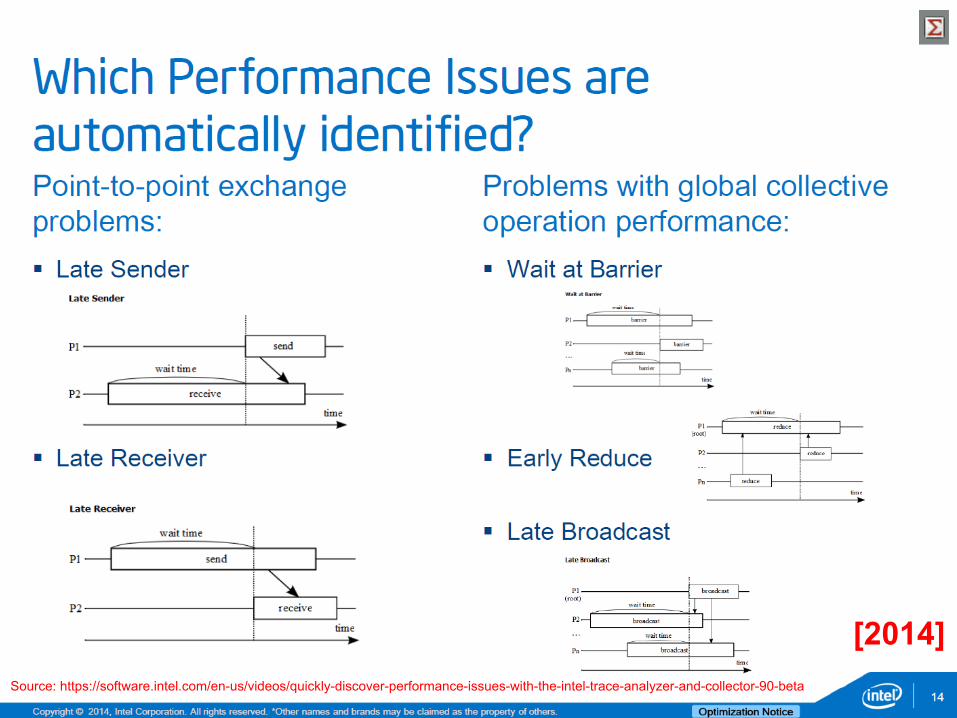
JSC 27 Source: https://software.intel.com/en-us/videos/quickly-discover-performance-issues-with-the-intel-trace-analyzer-and-collector-90-beta
[2014]
JSC 28
JSC 29
Questions?
• http://www.scalasca.org • [email protected]
• http://www.score-p.org • [email protected]