Superelastic Cyclic Properties Of Cu-Al-Mn And Ni-Ti Shape ...
Cu-based Shape Memory Microwires:Towards Complex Structures
by
Mac Gager
MASSACHUSETTS I iii EOF TECHNOLOGY
JUN 4 2014
LIBRA RIES
Submitted to the Department of Materials Science and Engineeringin Partial Fulfillment of the Requirements for the Degree of
Bachelor of Science in Materials Science and Engineeringat the
Massachusetts Institute of Technology
June 2014
Q 2014 Massachusetts Institute of Technology. All rights reserved.
Signature redactedSignature of A uthor........................................................................................... .
Mac GagerDepartment of Materials Science and Engineering
May 2, 2014
Signature redactedC e rtifie d b y .......................................................................................................................................................................................
Christopher A. SchuhDepartment Head of Materials Science and Engineering
Thesis Supervisor
Signature redactedA ccepted by..................................................................................................................
Jeffrey C. GrossmanCarl Richard Soderberg Associate Professor of Power Engineering
Chair, Undergraduate Committee
IWO dOMMMOL

Cu-based Shape Memory Microwires:Towards Complex Structures
by
Mac Gager
Submitted to the Department of Materials Science and Engineeringon May 2 2014 in Partial Fulfillment of the Requirements for
the Degree of Bachelor of Science in Materials Science and Engineering
Abstract
Shape memory alloys are a distinctive type of material that exhibits the fascinatingproperties of the shape memory effect and superelasticity. Shape memoryproperties are characterized by the diffusionless phase transformation betweenaustenite and martensite that can be thermally or stress induced. Cu-based shapememory alloys provide an exciting area of research due to lower costs and higherworking temperatures compared to Ni-Ti alloys prevalent in industry today. Thiswork investigates the shape memory properties of oligocrystalline Cu-Al-Ni and Cu-Al-Mn-Ni microwires produced using a melt spinner. The melt spinner yieldedcontinuous wires in quantities useful for the creation of complex structures. Thecomposition of the wires is observed to change throughout processing of alloys andwires. Electropolishing rates were determined for improving surface texture andsize constraint.
Thesis Supervisor: Christopher A. Schuh
Title: Department Head and Danae and Vasilis Salapatas Professor of Metallurgy
2
Acknowledgements
First, I would like to thank Nihan Tuncer for her support throughout this
entire thesis. I wouldn't have been able to do this without her assistance in
fabricating wires and the overall direction she provided. I would also like to thank
Chris Schuh, my thesis advisor, for taking me in with the group. Also, many thanks
to the rest of the Schuh group members for their assistance, sharing lab space, and
teaching me about their own research.
3

Table of Contents
A b stra ct ....................................................................................................................................................................................... 2
A ck n o w le d g e m e n ts ......................................................................................................................................................... 3
T a b le o f C o n te n ts ............................................................................................................................................................... 4
L ist o f F ig u re s ........................................................................................................................................................................ 5
L ist o f T a b le s ........................................................................................................................................................................... 5
1 . In tro d u ctio n ...................................................................................................................................................................... 6
1 .1 C ry stallo grap h y ............................................................................................................................................... 6
1 .2 Sh ap e M em o ry E ffect ................................................................................................................................. 7
1 .3 S u p erelasticity .................................................................................................................................................. 9
1 .4 C u rren t A p p licatio n s ............................................................................................................................... 1 0
1 .5 C u -b a sed Sh ap e M em o ry A llo y s ................................................................................................... 1 1
1.5.1 Single Crystals, Polycrystals, and Oligocrystals ..................................... 12
1 .5 .2 M icro stru ctu re .................................................................................................................... 1 4
2 . M e th o d s ............................................................................................................................................................................ 1 5
2 .1 W ire C astin g .................................................................................................................................................... i s
2 .2 H eat T reatm en t ............................................................................................................................................ 1 7
2.3 SEM for Imaging and Com position M easurem ents ....................................................... 17
2 .4 T ran sitio n T em p eratu res .................................................................................................................... 1 8
2 .5 E lectro p o lish in g ........................................................................................................................................... 1 9
2 .6 M ech an ical T estin g ..................................................................................................................................... 1 9
3 . R e su lts a n d D iscu ssio n ...................................................................................................................................... 2 0
3 .1 W ire castin g .................................................................................................................................................... 2 0
3 .2 C o m p o sitio n s ................................................................................................................................................. 2 1
3 .3 E lectro p o lish in g an d Im ag in g ......................................................................................................... 2 4
3 .4 M ech a n ical T estin g ................................................................................................................................... 2 8
4 . C o n clu sio n s ................................................................................................................................................................... 3 1
S . F u tu re W o rk .................................................................................................................................................................. 3 2
R e fe re n ce s ............................................................................................................................................................................. 3 3
4

List of Figures
1.1 A schematic phase diagram of a shape memory alloy showing austenite-
m a r te n s ite tr a n s itio n s ........................................................................................................................................................... 8
1.2 Schematic of the shape memory effect and superelastic hystereses...................... 10
1.3 Bamboo and oligocrystalline structure in a wire...................................................................... 13
1.4 Vertical section of the Cu-Al-3%Ni phase diagram................................................................ 14
2 .1 Im a g e s o f th e m e lt sp in n e r.................................................................................................................................1 5
2.2 DSC curves for a Cu-Al-Ni wire as-cast and annealed............................................................18
3.1 MS-11 and MS-9 microwires fabricated with the melt spinner................................... 21
3.2 EDS plot of a MS -3 Cu-Al-Mn-Ni wire after heat treatment............................................22
3.3 Before and after electropolishing images of a MS -3 Cu-Al-Mn-Ni wire.............. 24
3.4 SEM image montage of grains boundaries in a MS -3 Cu-Al-Mn-Ni wire............ 25
3.5 Electropolishing rates for a MS -3 Cu-Al-Mn-Ni wires........................................................ 26
3.6 SEM image of a Cu-Al-Ni wire with and without glass coating produced with the
T ay lo r liq u id d ra w in g m eth o d .................................................................................................................................... 2 8
3.7 Shape memory effect hysteresis for a MS-3 Cu-Al-Mn-Ni wire................................... 29
3.8 Shape memory effect hysteresis for a MS-11 Cu-Al-Ni wire........................................... 30
List of Tables
3 .1 C om p osition of a M S-9 C u-A l-N i w ire........................................................................................................2 1
5
1. Introduction
Arne Olander first discovered peculiar properties in an Au-Cd alloy in 1932.
A material deformed at a cool temperature would return to its original state upon
heating [1]. This was the first report of the shape memory effect. Since then shape
memory alloys have been explored in many families of alloys including Au-Cd [2],
Fe-Mn-Si [3], Ni-Ti [4], Cu-Al-Ni [5], among others. The fundamental theory of
shape memory behavior has been studied in depth, although the mechanisms for
transformations are not fully understood today. Ni-Ti is the most commercially
successful shape memory alloy, with heavy applications in the medicine and
aerospace industries [6]. However, Ni-Ti is prohibitively expensive for many
applications, thus an alternative is needed. This chapter will describe the
fundamental crystallography of shape memory alloys, the thermomechanical
properties of the shape memory effect and superelasticity, as well as current work
on Ni-Ti and alternative alloys, specifically Cu-based alloys.
1.1 Crystallography
Shape memory alloys are characterized by a diffusionless, solid-to-solid
reversible phase transformation between austenite and martensite known as
martensitic transformation. Austenite is a high temperature phase, while
martensite is the lower temperature phase. Most SMA austenite phases are
composed of a super lattice structure with body centered cubic sub lattices while
martensite lattices are typically orthorhombic or monoclinic [7]. The austenite
phase has higher crystallographic symmetry than martensite, leading to variants of
6

martensite [7]. When transforming to martensite, different variants may arise; the
coexistence of multiple variants of martensite is know as a twin [8]. Austenite
transforms to martensite when nucleation and growth of crystals occur, this
transformation can be thermally or stress induced under isothermal conditions.
Thermally induced phase transformation is related to the shape memory effect,
while the stress induced phase transformation is related to superelasticity. Both the
shape memory effect and superelasticity are critical properties for applications of
shape memory alloys.
1.2 Shape memory effect
The shape memory effect involves the transformation of austenite to
martensite, a martensite to martensite transformation, and cycles of heating and
cooling. The austenite, twinned martensite, and detwinned martensite lattices are
represented schematically in Figure 1.1. The red atoms represent the austenite
lattice and the blue atoms represent the martensite lattices. Austenite is stable to
the right of the 4 black lines, at high temperatures and low stresses, while
martensite is stable to the left of the 4 black lines, at low temperatures and high
stresses.
For the shape memory effect, the material is first cooled from austenite to
martensite, from right to left along the green arrow in Figure 1.1. The
transformations occur over a range of temperatures, beginning at the martensite
start temperature (Ms) and ending at the martensite finish temperature (Mf) when
the material has fully transformed to martensite. The martensite variants will be
7

arranged such that there is little or no macroscopic change to the sample. The
resulting microstructure is represented in the bottom left corner of Figure 1.1,
shown schematically with 2 variants of martensite. The martensite sample is then
subjected to deformation and macroscopic change occurs as the variants are
rearranged. When the deformation force is removed the deformed macroscopic
state is preserved, denoted by the single directionality of the black arrow.
StrSS
aASa(At
Reorientationof martensitevariants
MMA At Temperature
Figure 1.1 Diagram of austenite and martensite transformations in temperature-
stress space [9].
The material is now heated to a temperature where austenite is stable. During
heating, martensite begins to transform to austenite at the austenite start
8

temperature (As) and is finished transforming when the material is all austenite
after the austenite finish temperature (Af). This atomic, diffusionless
transformation cycle is reversible.
The transition temperatures are dependent on sample composition, size, and
heat treatment [10]. Hysteresis occurs from cycling the material over the
temperature range, as seen in Figure 1.2 (a), leading to dissipation of energy
through frictional work.
1.3 Superelasticity
Superelasticity, also known as pseudoelasticity, allows some shape memory
alloys to achieve extremely high recoverable strains. Recoverable strains of greater
than 10% have been observed in some alloys before plastic deformation occurs [11].
Most metals can only achieve recoverable strains of less than 2%. In this case, the
material begins at a temperature slightly above the austenite finish temperature,
where austenite is stable. The transformation to martensite is triggered by external
stress shown by moving up the vertical green arrow in Figure 1.1, from red
austenite to blue martensite, as stress increases. Macroscopic deformation occurs
as the material is strained. When the external stresses is removed the material
returns to its original form. If the external stress is too high, plastic deformation will
occur and not all strain will be recoverable, or the sample could yield.
Similar to the thermally induced transformation, this stress induced
transformation occurs over a range of stresses. The forward transformation begins
when the martensite start stress, oMS, is reached and is completed when the stress
9

increases further to the martensite finish stress, uf. The reverse transformation
occurs as the stress is removed. Austenite begins to form at the austenite start
stress, ,,, and the transformation is complete after the austenite finish stress, YV,
is reached.
Also similar to the thermally induced transformation, the distinct transition
stresses lead to hysteresis through stress cycles as seen in Figure 1.2 (b). Energy is
lost as heat in order for the transformations to occur.
(a) (b)
Strain Stress
Temperature Strain
Figure 1.2. (a) Schematic of the shape memory effect hysteresis under constant
stress. (b) Schematic of superelastic hysteresis under isothermal conditions.
Adapted from [12].
1.4 Current Applications
The most prevalent shape memory alloy used in industry today is Nitinol.
Nitinol was discovered accidently by researchers in the Naval Ordnance Laboratory
(hence the name) in 1959 [13][14]. Nitinol is a nickel-titanium alloy of roughly
equal atomic percentages. The transition temperatures can be controlled to some
extent by post processing heat treatment methods, but are typically spread around
10

30-40 degrees Celsius [15]. Nitinol is highly biocompatible and has found extensive
applications in medicine ranging from stents and sutures to orthodontic brackets.
Nitinol is also common in eyeglass frames to allow accidental bending without
fracture.
Other applications for shape memory alloys include actuators and sensors in
a variety of markets. Shape memory alloys are common in MEMS devices as valves
and actuators. Ni-Ti-Cu springs are used to control flow of transmission fluids and
anti-scalding valves of Ni-Ti-Cu seal hot water flow above scalding temperatures.
Thermally activated SMAs are also used as current interrupters to prevent battery
meltdowns. [6]
1.5 Cu-based shape memory alloys
A number of Cu-based alloys have been tested for shape memory properties
and show promise as an alternative to Nitinol. Cu-based alloys are much less
expensive than Ni-Ti in terms of both basic material cost and processing [16].
Interesting and useful properties that Ni-Ti lacks, such as ability to be welded, and
high thermal and electronic conductivity are readily available in Cu- based alloys
[17]. These characteristics lead to Cu-based alloys being an area of active research,
however, the mechanical properties of Ni-Ti remain superior to Cu-based alloys at
this time.
11

1.5.1 Single Crystals, Polycrystals, and Oligocrystals
Shape memory performance for all alloys is heavily dictated by
microstructure. For Cu-based alloys, the key aspect of microstructure impacting
performance is grain boundaries.
Single crystals of Cu-based alloys have excellent shape memory and
superelasticity properties. The absence of grain boundaries makes the transition
from austenite to martensite easier and large recoverable strains are achievable.
This means a small hysteresis loop with little energy wasted. However, the
production of single crystals is more involved and much more expensive than
polycrystals, making them unsuitable to replace Nitinol.
The extensive network of grain boundaries found in polycrystals is
detrimental to the performance of Cu-based shape memory alloys. The transition
from austenite to martensite occurs from the nucleation and growth of martensitic
plates triggered by heating or stress. As the material expands during the transition
grain boundaries are sources of friction and resist the growth of the martensitic
plates. Incompatibilities between grains also inhibit transformation. This results in
an additional energy barrier for the transformation. Stress can build up and lead to
fracture if the transition stress or temperature becomes too high. Triple junctions
(the meeting of three grain boundaries) are very likely to be areas of high stress
concentration. Triple junctions can lead to areas of a polycrystal not fully
transforming or transforming to a different variant of martensite [9], both are non-
ideal for shape memory performance. To mitigate the effects of grain boundaries on
performance, the total free surface area to grain boundary ratio must be increased.
12

One way to do this is through the use of oligocrystals. Oligocrystalline
materials have grain boundaries, but they are orientated as bamboo-like grain
structures where grain boundaries are perpendicular to the longitudinal axis of the
structure as seen in Figure 1.3. This leads to a significant reduction in triple
junctions relative to polycrystals. Constraining dimensions to enable grain sizes
similar wire diameter can lead to the complete absence of triple junctions. For
shape memory alloy microwires, this means stress concentrations are replaced by
free surfaces resulting in single crystalline-like performance. [9]
Oligocrystals provide an exciting opportunity where the desirable properties
of single crystals (absence of grain boundaries inhibiting performance) are
captured, and the expensive production costs can be avoided.
Grain 5
Grain 4
Grain 3
Grain 1
(a) (b)
Figure 1.3. (a) A picture of bamboo showing oligocrystalline like structure [18] and
(b) a schematic of grains in an oligocrystalline wire.
13

1.5.2 Microstructure
The reversible transition from austenite to martensite relies on the
proper microstructure. For Cu-Al-Ni, the fl-phase is transformed to 13' or y
depending on Al composition [19]. A phase diagram of Cu-Al-3wt%Ni, a
composition similar to the ones used in this research, is shown in Figure 1.4. The
addition of Mn to the system increases the range of Al that allows for shape memory
behavior. In order to secure the high temperature fl-phase at room temperature,
the alloy is heat treated and subsequently water quenched as described in Chapter
2.2.
L:LIQUID1200
LL+ a
1000
L
(x+ Ni A]600
+ a+ P+ NMAI c+ NiAl Y,
400
0 5 10 15
Al Concwtration (wt%)
Figure 1.4. Vertical section of the Cu-Al-Ni phase diagram at 3wt%Ni with the 6-
phase shaded in gray [19].
14

2. Methodology
2.1 Wire casting
Shape memory alloys were drawn into wires using a wire casting, rapid
solidification technique. Alloys of Cu-Al-Mn-Ni and Cu-Al-Ni were drawn. As
displayed in Figure 2.1 the wire caster, or melt spinner, consists of a silica crucible
containing the alloy that is heated by an induction coil and a rotating drum. The
rotating drum is filled with water that is held against the walls by centrifugal forces.
The crucible has a small orifice, 100-300um depending on the viscosity of the melt,
at the bottom of the tapered end to allow for the alloy to be ejected. The crucible
containing the alloy is subjected to low vacuum conditions to prevent oxidation as
the temperature is increased.
(a) (b)
Figure 2.1. (a) Melt spinner set up used to fabricate microwires and (b) a close up
of a glowing alloy being heated by the induction coil [20].
15
Once the material melts and reaches a critical viscosity, the melt is ejected
through the orifice at the tip of the tube via the application of inert gas pressure. A
filament of molten alloy is forced out of the orifice and into the water, where it is
quenched and rotated away as a microwire. The ejection pressure was 4 bar for all
trials and the speed of the drum was 324-330 rpm. Each crucible was filled with
approximately 6 grams of alloy in 4-7 pieces.
The characteristics of the resulting microwires are dependent on a number
of factors in the wire casting process. The rotation speed of the drum, relative
location of the orifice to the drum, the viscosity of the melt at ejection, and the
ejection pressure all impact the size and continuity of the wires. Many of these
factors are not fully automated and lead to inconsistencies from repeated trials.
Wires were also produced using the Taylor liquid drawing technique. In this
production method alloy pieces are insert into a thin Pyrex glass tube, which will be
used to draw wires. The tube is subjected to vacuum and then filled with low
pressure argon and sealed using a hydrogen flame. The alloy is then heated inside
the tube over the oxyhydrogen flame. Once the glass softens and is able to be
worked and the alloy is molten, the tube is pulled apart, leaving a glass capillary
containing a microwire. Following heat treatment and quenching, the glass coating
is removed by soaking the wires in a hydrofluoric acid solution.
16

2.2 Heat Treatment
Following casting, microwires were heat treated to stabilize the austenite
phase and promote grain growth. Grain growth leads to the oligocrystalline,
bamboo-like structure discussed earlier. This can substantially increases the
mechanical properties of the microwires.
The wires were placed in quartz tubes, which were subjected to vacuum
conditions before being filled with argon to prevent oxidation. Based on the phase
diagrams of the specific composition of alloy, the wires were annealed at 800C-900C
for 1-3 hours. The wires were water quenched to lock in the appropriate phase at
room temperature.
2.3 SEM for Imaging and Composition Measurements
A scanning election microscope was used to create images and take
measurements of microwires. The SEM allowed for measurements of diameters of
wires and grain size, as well as identification of grain boundaries. In some cases
martensitic plates were observed.
Energy dispersive x-ray spectroscopy was used to determine the
composition of the wires. This was performed throughout the process of casting
and heat-treating the wires.
17

2.4 Transition Temperatures
Differential scanning calorimetry was used to determine the transition
temperatures of the microwires. The transition temperatures vary based on the
composition of the wires and need to be known to inform the proper conditions for
mechanical testing. Figure 2.2 shows a typical DSC curve for an as-cast and
annealed Cu-Al-Ni wire. For the annealed wire the transition temperatures are
approximately 110C and 140C for austenite start and finish temperatures,
respectively, and 125C and 90C for the martensite start and finish temperatures,
respectively.
0.7 --
Annealed wireAs Af
01
As-cast wire
Mf S
-0.3
0 50 100 150 200Temperature (C)
Figure 2.2. DSC curves for a Cu-Al-Ni wire. The upper, black curve is endothermic
for the martensite to austenite transformation and the lower, black is exothermic for
the austenite to martensite transformation for an annealed wire. The red curve
represents the same transformations for an as-cast wire.
18
2.5 Electropolishing
Wires were electropolished in a 67% phosphoric acid solution for 7-15
minutes as recommended for copper alloys with significant aluminum content [21].
The electrodes were pure copper and the polishing voltage ranged from 2.0-3.0
volts. Surface defects, which are a likely place for cracks to develop, can be
eliminated with electropolishing. Electropolishing is very useful for revealing grain
size and grain boundaries in the microwires. Electropolishing is also effective at
reducing the diameter of the wires, which can reduce stress concentrations and
triple junctions.
Over polishing can also occur and is detrimental to the integrity of the wire.
A non-uniform diameter will lead to different rates of attack and can lead to a
necking-like effect where thin sections lead to failure. A lower polishing voltage can
help diminish this drawback.
2.6 Mechanical testing
Microwires were tested for shape memory effect and superelastic properties
using a dynamical mechanical analyzer with a closed furnace for temperature
control. The ends of the wires were fastened into place using plastic mechanical
grips, which were clamped tight. A high-resolution linear optical encoder within the
furnace tracked the wire displacement to calculate strain. The gage length was
measured to be 3-10 mm for different wires. The dimensions of the wire, after
being measured using a SEM, were entered into the instrument in order to apply
specific loads.
19

3. Results and Discussion
3.1 Wire casting
Microwires were successfully drawn using a melt spinner as detailed in
Chapter 2.1. The different alloys led to the fabrication of many types of wires and
the results were not consistent with repeated trials. Cu-Al-Ni was able to be drawn
using crucibles with nozzles down to 100 um. Cu-Al-Mn-Ni was unable to be drawn
at this nozzle size and had both successes and failures as the nozzle size was
increased to 300 um.
The advantage of using the melt spinner over previously used methods is the
length of the wires that can be drawn. This was shown with the drawing of wires
greater than a meter in length. Many trials led to many pieces of wires around tens
of centimeters in length, however some trials led to only small fragments of wires
centimeters or less in length. Figure 3.1 shows the results of successive trials of Cu-
Al-Ni. It can be clearly observed that MS-11 Cu-Al-Ni, shown on the left, produced
longer and more wires than MS-9 Cu-Al-Ni, shown on the right. The width of MS-11
was measured to be greater than that of MS-9, at 150-160 um versus 75-100 um.
Additionally, MS-9 yielded many fragments of wires only millimeters in length.
These trials had very similar operating condition, but the human element
controlling the placement of the nozzle relative to the drum, current through the
induction coil, and the timing of the ejection led to different outcomes.
20

(a) (b)
Figure 3.1. (a) Microwires obtained from trial MS-11 Cu-Al-Ni and (b) MS-9 Cu-Al-
Ni.
The wires cast using the melt spinner were rectangular in cross section, not
circular. This was easily observed while handling the wires. This was not the case
for the wires drawn using the Taylor method, which were circular in cross section.
3.2 Compositions
The composition of some alloys changed during the processes of casting the
alloy into microwires and heat treatment. Metal powders were mixed for
compositions within the aluminum range described by the phase diagrams.
However, the aluminum content increased considerably for some Cu-Al-Ni wires
and in one case nickel content also rose significantly.
21

Table 3.1 shows the changes in composition of MS-9 at different stages in the
process and after 3 different heat treatment methods. A decreasing trend of the
amount of copper and nickel is observed, while the amount of aluminum increases
with treatment.
MS-9 Wire Composition (wt)Cu Al Ni
Alloy 80.0 13.9 6.2Wire - as cast 78.3 15.4 6.3Wire - HT 850C - 1hr 77.0 16.7 6.3Wire - HT 870C - 2.5hr 75.8 18.7 5.4Wire - HT 870C - 2.5hr,850C - 1hr 74.5 20.2 5.3
Table 3.1. Composition of a MS-9 Cu-Al-Ni wire throughout fabrication and post
processing.
Considerable losses of copper are noticed after casting and heat treatment.
The resulting wires are not in the range for shape memory properties. Copper is
being lost due to oxidation, non-homogeneity of the mixture, or due to a zone
refining effect as different parts of the alloy are melted and solidified during wire
casting.
A MS-6 wire shows nickel content at 24% weight, approximately 6 times
higher than the original mixed composition. This wire also has very high aluminum
content, 39% weight. The original intended composition of this wire was
79.96%Cu-12.43%Al-4.45%Mn-3.16%Ni.
22
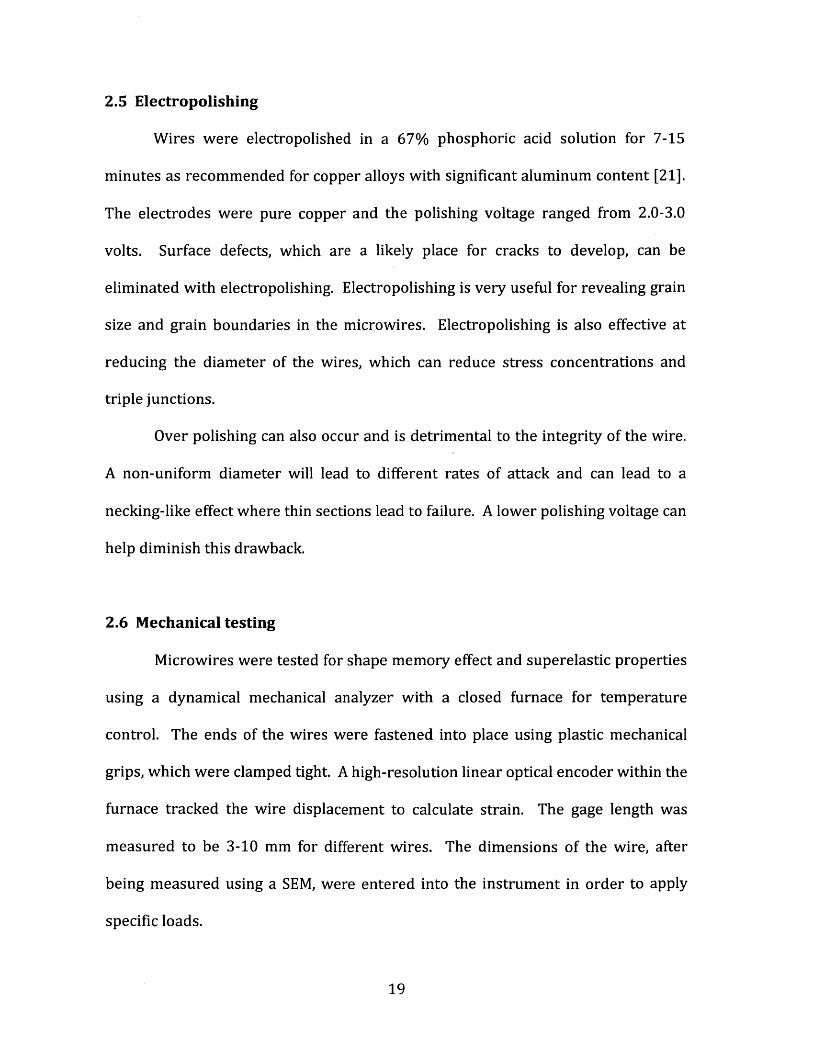
However, in general the Cu-Al-Mn-Ni wires showed more consistent
composition. An EDS plot of a MS-3 Cu-Al-Mn-Ni wire shows weight percents of
80.6%Cu-12.3%Al-3.9%Mn-3.2%Ni in Figure 3.2
2
Cnts
3.0K -
2.0K-
CA
1.0K -
Al
Mn Mn Ni
Mbn Ni
Cu
SCU
5Cursor=Vert=3537 Window 0.005 - 40.955= 66,239 cnt
Figure 3.2. An EDS plot of an MS-3 Cu-Al-Mn-Ni wire
hours.
10 15 keV
heat treated at 800C for 3
Wires drawn using the Taylor method also showed more consistent
compositions. The absence of the melt spinner for production lead to no loss of
copper in the drawing process and the glass coating provided another layer of
protection during annealing. The wires produced with the Taylor method had a
composition of 79.0%Cu-15.1%Al-5.9%Ni, very close to the original prepared alloy.
However, non-homogeneities in composition were observed over all wires. Even in
wires produced with the Taylor method, while the average composition was very
23
clearly near the alloy composition, aluminum rich and copper poor sections were
encountered. This non-homogeneity could compromise mechanical performance.
Alloys were also prepared with intentionally high copper weight
percentages, expecting to lose copper as the alloys and wires are processed.
Aluminum content for these alloys ranged from 8-10% weight. These alloys were
ejected at higher temperatures than the other alloys, near 1400C as opposed to near
1200C. However, continuous wires were unable to be cast using these
compositions.
3.3 Electropolishing and Imaging
Wires were electropolished to improve the quality of the surface of the wires.
This process helps to alleviate sources of stress concentrators and reduce wire
diameter to eliminate triple junctions. A polished surface also allowed for grain
boundaries to be more easily identified.
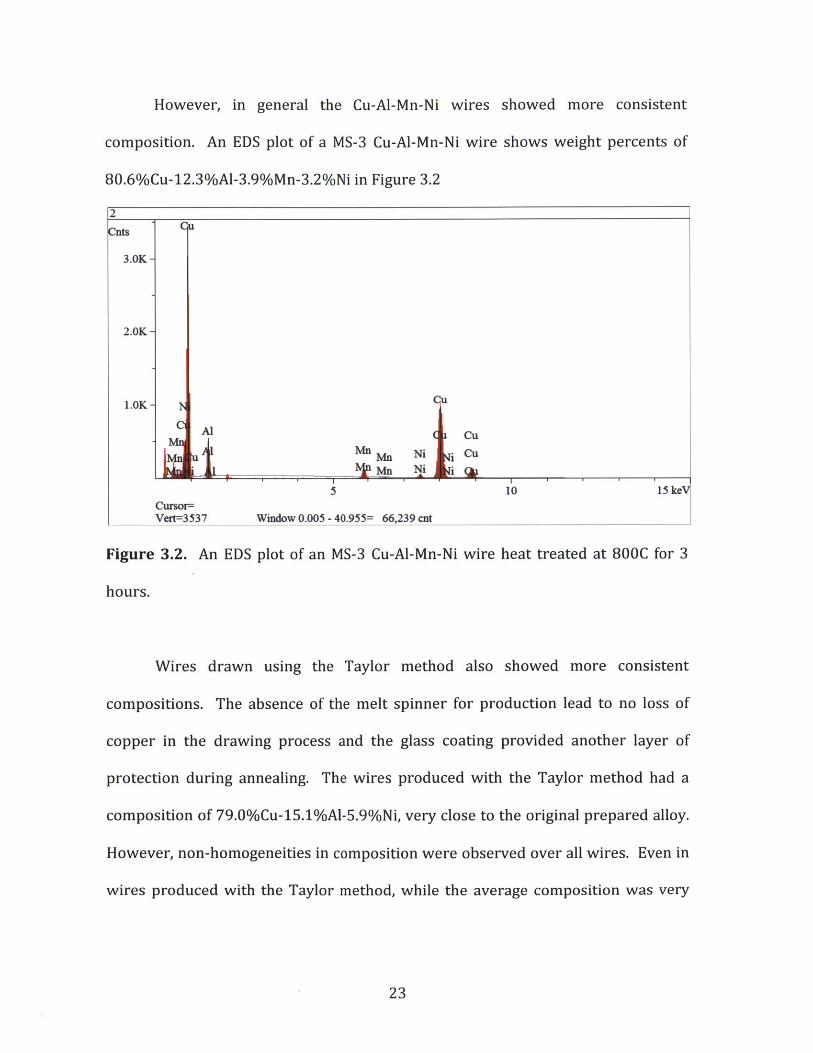
Only a few minutes were necessary to smooth the surface of the wires with
more time decreasing wire diameter until over polishing occurs. Figure 3.3 shows a
before and after pictures for a Cu-Al-Mn-Ni wire. The before image shows a rough
surface of the annealed wire with an average width of 210 um. After 4 minutes of
electropolishing at 3.0 V and 0.12 A the surface is smooth and the average width has
decreased to 180 um. Increasing the electropolishing time to 25 minutes results in
an even smoother surface. In this case the width of the wire has become more
uniform in this section. The average width has decreased to 110 um, close to the
size where size effects begin to improve the performance of microwires [10].
24
(a) (b)
(c)
Figure 3.3. (a) Before and (b) after images of a Cu-Al-Mn-Ni wire. (c) Shows the
diameter decreasing further with more electropolishing.
25
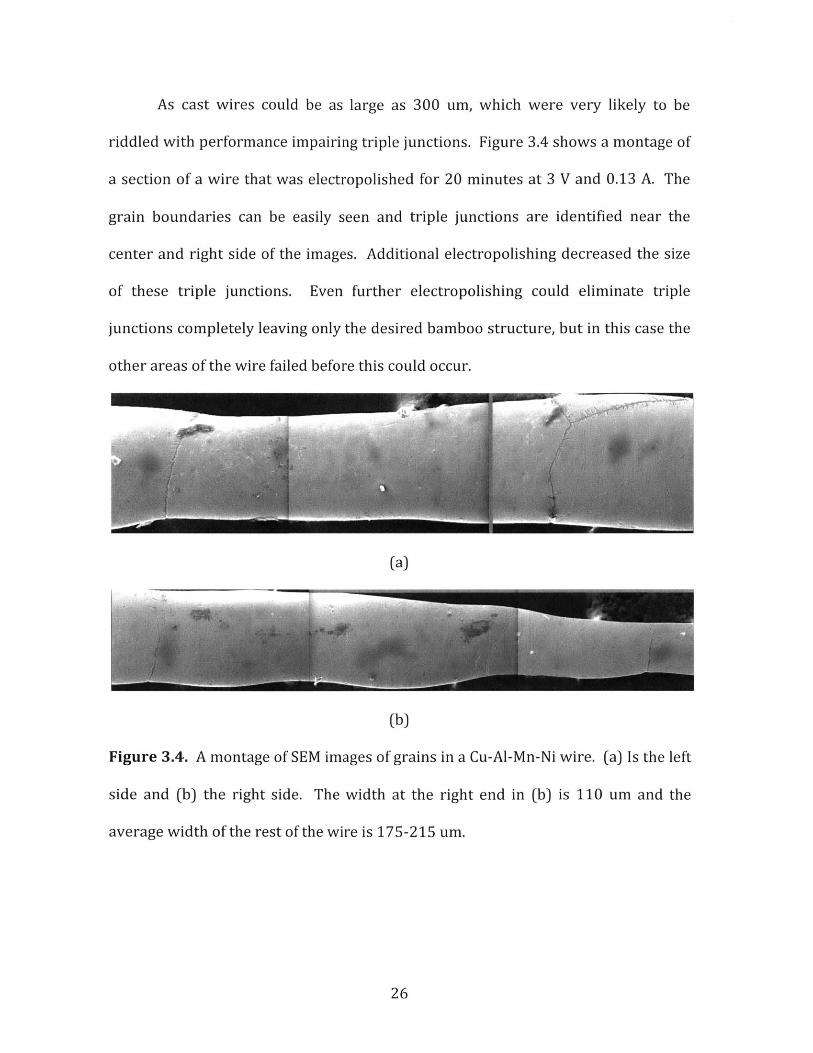
As cast wires could be as large as 300 um, which were very likely to be
riddled with performance impairing triple junctions. Figure 3.4 shows a montage of
a section of a wire that was electropolished for 20 minutes at 3 V and 0.13 A. The
grain boundaries can be easily seen and triple junctions are identified near the
center and right side of the images. Additional electropolishing decreased the size
of these triple junctions. Even further electropolishing could eliminate triple
junctions completely leaving only the desired bamboo structure, but in this case the
other areas of the wire failed before this could occur.
(a)
(b)
Figure 3.4. A montage of SEM images of grains in a Cu-Al-Mn-Ni wire. (a) Is the left
side and (b) the right side. The width at the right end in (b) is 110 um and the
average width of the rest of the wire is 175-215 um.
26

Electropolishing rates were determined for MS-3 Cu-Al-Mn-Ni microwires.
Figure 3.5 shows a plot of mass loss per starting surface area vs. time. The starting
wire cross section dimensions was approximately 325 um by 100 um and exposed
lengths of 15-18mm. The plot shows a rate of mass loss to be 0.011 .mm 2 * min
Assuming equal mass loss along the length of the microwire, this rate can be used to
determine the time required to reach a specified final wire size. As surface area
decreases, current density and the rate of material loss increases this assumption
does not hold, which can lead to over polishing. If a wire does not have a consistent
diameter to begin with, thin sections are attacked more rapidly than other sections.
This can lead to a weak spot in the wire under mechanical testing or the wire
breaking in the polishing solution. This occurred during attempted testing of
electropolishing rates for thinner wires.
0.250
0.200
0.150
0.100
y =0.0109x - 0.0047
0.050
0.000
0 5 10 15 20
Time (min)
Figure 3.5. Electropolishing rates for MS-3 Cu-Al-Mn-Ni microwires.
27

Figure 3.6 shows a wire drawn using the Taylor method. The wire is shown
with the glass coating still around the wire, except for a section in the middle where
the unpolished wire is exposed. The wire shows a very uniform diameter of 97 um.
Figure 3.6. SEM image of a wire produced using the Taylor drawing method. The
fractured glass capillary is seen around the wire.
3.4 Mechanical Testing
Composition issues led to poor mechanical performance of the wires. Many
wires with correct, or within range for shape memory properties also did not
perform well, possibly due to the increased size of these wires. Larger cross
sections are more likely to contain detrimental triple junctions. Several wires were
tested under shape memory effect and pseudoelastic conditions. The
28

transformation temperatures for Cu-based alloys are significantly higher than Ni-Ti
based systems, which transition near room temperature.
Figure 3.7 shows shape memory hysteresis for a MS-3 Cu-Al-Mn-Ni wire,
which was heat treated at 800C for 3 hours. There are clear transition
temperatures, which are seen to increase with applied stress. However, the strains
are observed to be around 1 percent and not fully recoverable, which is not
sufficient for shape memory applications. The cross section of the wire measured
200 um x 105 um.
05
0.8-
0.6-
0.4-
0.2-
0.0-
-0.2 -
50 10 150 200 250 300
Temperture (*C)
Figure 3.7. Shape memory
were 20 MPa and 40 MPa.
hysteresis for a Cu-Al-Mn-Ni wire. The applied stresses
29
-VA I l

Figure 3.8 shows shape memory hysteresis for a MS-11 wire as cast, with no
heat treatment. This thermal cycle shows improved strain, greater than 2.5%, but
no clear transition temperatures. This is likely due to the wire being highly
polycrystalline as grains were not given time to grow through heat treatment. The
wire cross section measured 150 um x 70 um.
0
C)
-2 -
-3-
do do 10
Figure 3.8. Shape memory
applied stress was 20 MPa.
1io 140 160Temperature (*C)
160 200 20 240
hysteresis for an as cast MS-11 CuAlNi wire. The
Despite correct or near correct compositions for many wires including the
MS-3 Cu-Al-Mn-Ni, MS-11 Cu-Al-Ni, and the Taylor method Cu-Al-Ni wires, adequate
shape memory properties were not observed. In addition to size and triple
junction's potential impact on performance, non-homogeneity or poor quenching
may have contributed to poor performance. If not enough of the microwire had the
proper 6-phase, shape memory properties would not be observed.
30
4. Conclusions
Cu-based shape memory alloys remain a promising alternative to expensive
Ni-Ti alloys. With a higher working temperature than Ni-Ti alloys, Cu-based SMAs
can reach a variety of new applications.
This work showed that the long length scales of Cu-Al-Ni and Cu-Al-Mn-Ni
microwires needed for the creation of complex structures can be successfully
achieved with a melt spinner. Continuous wires greater than a meter in length were
produced in addition to numerous wires of shorter, but still useful length. The melt
spinner shows promise as an alternative to hand or automated wire fabrication
using the Taylor liquid drawing technique. Composition consistency from alloy to
annealed microwire and uniform shape remain issues.
SEM imaging revealed the melt spinner is able to produce oligocrystalline
wires on the length scale for improved shape memory property performance.
Electropolishing was found to successfully improve surface quality and further
reduce wire size to eliminate triple junctions.
31
5. Future Work
This research has identified several areas that require more detailed
investigations in order to further understand the potential applications of Cu-based
shape memory alloys.
A more robust method for wire fabrication is needed. An in depth study on
the melt spinner would help to enable future success. The melt spinner needs to
have more predictable and repeatable results. The basic properties of the wires
(size, shape, composition) need to be produced consistently before this work
proceeds.
The composition changes from alloy casting to wire casting and annealing
should also be studied. Composition differences impact the heat treatment
temperatures needed to stabilize the f-phase for shape memory properties.
Deviations from target composition or non-homogeneities significantly decrease
performance of the wires and must to be corrected.
Finally, the investigation of the use of microwires in complex structures, such
as braided cables and fabrics, is a very exciting opportunity for future work.
Potential applications are high in this area and successful production of long wires
with improved shape memory properties could make this an exciting area of
research.
32
References
[1] Olander, A. (1932) J. Amer. Chem. Soc. 54: 3819[2] Chang LC, Read TA. T Am I Min Met Eng 1951;191:47.[3] Sato, A. et al. Orientation and composition dependencies of shape memory effect inFe-Mn-Si alloys. Acta Metallurgica, Vol 32 Issue 4 1984[4] Otsuka K, Ren X. Prog Mater Sci 2005;50:511.[5] Otsuka K, Sakamoto H, Shimizu K. Acta Metall Mater 1979;27:585.[6] Wu, Ming H and Schetky, L. Mc.D.. Industrial Applications for Shape MemoryAlloys, Proceedings of the International Conference on Shape Memory and SuperelasticTechnologies, Pacific Grove, CA, p. 17 1-182 (2000).[7] MIT 3.022 Lecture, Cima, Spring 2012[8] Hane, Kevin H. Microstructures in Thermoelastic Martensitic Transformations.Mechanics of Materials[9] Ueland, S.M. Grain Constraint and Size Effects in Shape Memory Alloy MicrowiresMassachusetts Institute of Technology, 2013[10] Chen Y., Schuh C. Size effects in shape memory alloy microwires. Acta Materialia59 (2011) 537-553.[11] Miura, S. and Maeda, S. Pseudoelastic and Shape Memory Phenomena related toStress-Induced Martensite in Cu-15 at % Sn Alloy. Scripta Metallurgica, Vol. 9, pp.675-680, 1975.[12] We, S; Wayman C (1987). "Martensitic transformations and the shape-memoryeffect in Ti50Ni10Au40 and Ti50Au50 alloys". Metallography 20 (3):359[13] Buehler, W.J. et al. Effect of Low Temperature Phase Changes on the MechanicalProperties ofAlloys near Composition NiTi. Journal of Applied Physics 34, 1475(1963).[14] Wang, F.E. et al. Crystal Structure and a Unique "Martensitic" Transition of TiNi.Journal of Applied Physics 36, 3232 (1965).[15] NDC "Nitinol Facts"[16] Wilkes, K. E.; Liaw, P.K. (2000), "Thefatigue behavior of shape memory alloys"JOM 52 (10): 45[17] Cederstom J., Van Humbeeck J. (1995). "Relationship between Shape MemoryMaterial Properties and Applications". J Physics IV 5: C2-325[18] calibamboo.com/bamboopoles.html[19] Dunne, D.P., Kennon, N.F. Ageing of Copper-based Shape Memory Alloys. MetalsForum, Volume 4, Issue 3, Pages 176-183[20] Phoenix Scientific Industries Ltd.[21] Davis, Joseph R. Copper and Copper Alloys ASM International, 2001
33