CTEAiIMfiHOVSE FOR FBDEBAL SCIENTIFIC AND … LIST OF FIGURES Figure Page Number Number 1...
115
' CO ?0 AMRA CR 63.04/4 INVESTIGATION OF gaiDIHCATION OF HIGH^TRENOTH STEEL,CASTINGS - t • • : 3 INTERIM REPOR CTEAiIMfiHOVSE FOR FBDEBAL SCIENTIFIC AND TBCH^JICAl, INFORMATION Hardaopr Mloroflohi iig- / «11 Wlf CO IK u I ; M. C. Fbmlngs Metallurgy ' r toofTthnöloav D. It Poirier qnd '. i Deportment of Metallurgy Massachusetts Institute of Technology for Contract Period dates October 1,1964 — September MASSACHUSETTS INSTITUTE OF TECHNOLOGY i • ' u., . .• T . . . ' -4
Transcript of CTEAiIMfiHOVSE FOR FBDEBAL SCIENTIFIC AND … LIST OF FIGURES Figure Page Number Number 1...

'
CO
?0
AMRA CR 63.04/4
INVESTIGATION OF gaiDIHCATION OF HIGH^TRENOTH STEEL,CASTINGS
-
t • • :
3 INTERIM REPOR
CTEAiIMfiHOVSE FOR FBDEBAL SCIENTIFIC AND
TBCH^JICAl, INFORMATION Hardaopr Mloroflohi
iig- / «11 Wlf
CO
IK u
I
; M. C. Fbmlngs Metallurgy ' r
toofTthnöloav
D. It Poirier qnd '. i Deportment of Metallurgy Massachusetts Institute of Technology
for Contract Period dates
October 1,1964 — September
MASSACHUSETTS INSTITUTE OF TECHNOLOGY
■
i ■
• ' u., . .• T. . . '■ -4

AMRA CR 63-OA/A
INVESTIGATION OF SOLIDIFICATION OF HIGH-STRENGTH STEEL CASTINGS
INTERIM REPORT
by
D. R. Poirier, M. C. Flemings Department of Metallurgy
Massachusetts Institute of Technology
for Contract Period dates
October 1, 1964 - September 30, 1965
MASSACHUSETTS INSTITUTE OF TECHNOLOGY CAMBRIDGE, MASSACHUSETTS 02139
Contract No. DA-19-020-AMC-5443(X)
AMCMS Code No. 5025.11.842 Department of the Army Project No. 1AO2440A110
Distribution of this document is unlimited.
U.S. ARMY MATERIALS RESEARCH AGENCY WATERTOWN, MASSACHUSETTS 02172

ABSTRACT
An analytical and experimental study has been made of microsegregatlon in dendritic solidification of ternary iron-carbon- chromium alloys. The most realistic model considered assumes uniform concentrations of carbon and chromium in the interdendritic liquid, equilibrium at the solid liquid interface, no diffusion of chromium in the solid, and a uniform concentrations of carbon in the solid.
Alloys studied experimentally were all of 1.5 per cent chromium, with carbon contents ranging from .96 to 3.00 per cent carbon. Estimates of the extent of diffusion for carbon and chromium as well as microprobe analyses showed that carbon diffuses extensively in the solid during solidification and chromium diffuses only a limited amount.
Segregation ratios of common alloying elements in medium carbon, low alloy steel were compiled from the literature. Some of these data were combined with measurements from this investigation to illustrate the overall effect of carbon on the segregation ratio of chromium in iron-low chromium alloys.
An alternative measure of microsegregatlon to the "Segregation Ratio", S, was introduced. This measure, om, was termed "Composition Deviation Index". Comparison of theory and experiment was made for the segregation ratio and the composition deviation index for iron-1.5 per cent chromium alloys with carbon. Experimental results for om
were determined for carbon contents between .96 and 1.75 per cent carbon and compared to theoretical calculations for carbon contents from .96 to 3.00 per cent. Theoretical values (based on no diffusion of chromium in the solid) of am increased from .22 at .96 per cent carbon to .35 at 1.75 per cent carbon and then decreased to .16 at 3.00 per cent carbon. The experimental values were somewhat lower (15 to 30 per cent lower) due, it is believed, to limited diffusion of chromium in the solid.
Segregation ratios were experimentally and theoretically determined for alloys between .96 to 3.00 per cent carbon, and measurements of other investigators at lower carbon contents were used. The segregation ratio Increased from unity at zero per cent carbon to about 4.5 - 5.0 at 1.5 per cent carbon and then decreased to 3 at 3.00 per cent carbon. Theoretically derived segregation ratios between .96 and 3.00 per cent carbon showed the same general dependence; however, the theoretical values were lower except at one per cent.
Fundamental to the study of solute redistribution during solidifi- cation is detailed knowledge of the solid-liquid equilibria. For this reason the determination of the austenite-liquidus of the iron-carbon- chromium system was made which included evaluating the activity of iron, carbon, and chromium in liquid iron and austenite as functions of temperature and composition.

ii
Section Number
TABLE OF CONTENTS
Page Number
ABSTRACT
LIST OF FIGURES
LIST OF TABLES
ACKNOWLEDGEMENTS
INTRODUCTION
PART I: Microsegregation Calculations
A. Analysis of Microsegregation in Multi- Component Alloys
1. Complete Diffusion in the Solid 2. No Diffusion in the Solid
B. Determination of the Iron Rich Corner of the Ternary Phase Diagram Fe-C-Cr (with Tie Lines)
C. Evaluation of Solute Redistribution of Ternary Iron-Carbon-Chromium Alloys
D. Measures of Microsegregation
1. Segregation Ratio 2. Amount of Second Phase 3. Composition Deviation Index
PART II: Measurements of Microsegregation
A. Experimental Procedure
lo Castings Poured 2. Microstructures 3. Microprobe Analysis
B. Results
1. Microsegregation in Unidirectionally Solidified AISI 52100 (Iron-l.S Per Cent Chromium-1.0 Per Cent Carbon)
2. Effect of Carbon
i
iv
vi
vii
1
7
8 9
9
13
20
20 23 26
29
29
29 32 32
39
39 41
II SUMMARY AND CONCLUSIONS 52

ill
Section Page Number Number
BIBLIOGRAPHY 56
APPENDIX A - Llquld-Austenite Equilibria for the Iron-Carbon-Chromium System 60
APPENDIX B - Activity of Carbon in Austenitic and Liquid Iron-Carbon Solutions 75
APPENDIX C - Activity of Carbon in Liquid-Iron- Carbon Chromium Solutions 85
APPENDIX D - Activity of Carbon, Chromium, and Iron in Austenitic and Liquid Solutions 91
APPENDIX E - Construction of Solidus Surface 102
APPENDIX F - Conversion of X-Ray Intensities to Weight Per Cent Chromium 106
DISTRIBUTION LIST 107

iv
LIST OF FIGURES
Figure Page Number Number
1 Segregation ratio for common alloying elements in medium carbon, low alloy steels 4
2 The iron-carbon-chromium gamma liquidus surface 11
3 The iron-carbon-chromlum gamma solidus surface 12
4 Partition ratio of chromium versus liquid concentration of chromium 14
5 Partition ratio of carbon versus per cent chromium in the liquid 15
6 Solid composition iron-1 per cent carbon-1.5 per cent chromium alloy, assuming complete diffusion of both solutes in the solid during solidification 16
7 Solid composition iron-i per cent carbon-1.5 per cent chromium alloy, assuming no diffusion in the solid of chromium, and complete diffusion of carbon 17
8 Solid composition iron-1 per cent carbon-1.5 per cent chromium alloy, assuming no diffusion of either solute in the solid 18
9 Calculated weight per cent chromium versus fraction solid for a series of iron-carbon-chromium alloys containing 1.5 per cent chromium, assuming no diffusion of chromium m the solid and complete diffusion of carbon 21
10 Fraction solid versus temperature for iron-carbon- chromium alloys calculated assuming no diffusion of chromium and complete diffusion of carbon in the solid 22
11 Calculated segregation ratio, iron-1.5 per cent chromium alloy containing 1-3 per cent carbon 24
12 Calculated fraction eutectic (ledeburite) assuming no diffusion of chromium and complete diffusion of carbon during solidification 25
13 Calculated composition deviation index, o , versus weight per cent carbon for iron-carbon-chromium alloys containing 1.5 per cent chromium 28

Figure Page Number Number
14 Assembly used for cooling curves of small melts 31
15 Mold for producing unidirectional ingot 33
16 Cooling curves for the unidirectionally solidified 52100 ingot 3A
17 Dendritic structure of 52100 unidirectional ingot two inches from the chill 35
18 Dendrite arm spacing in 52100 unidirectional ingot 38
19 Schematic microprobe analysis to determine volume fraction of material with a composition of C^ and greater 42
20 Segregation ratio of chromium versus weight per cent carbon 43
21 Concentration profile for iron-1.0 per cent carbon alloy 45
22 Concentration profile for iron-1.5 per cent carbon alloy 46
23 Concentration profile for iron-1.75 per cent carbon alloy 47
24 Comparison of calculated and experimental segrega- tion ratio for iron-1.5 per cent chromium alloys
25 Comparison of calculated and experimental composi- tion deviation indlcies from iron-1.5 per cent chromium alloys.

vi
LIST OF TABLES
Table Page Number Number
I Summary of Mlcrosegregatlon Measurements In Multicomponent Carbon Steels 3
II Summary of Mlcrosegregatlon Measurements on Iron-1.5 Chromium Alloys Containing 0 to 2 Per Cent Carbon 6
III Summary of Experiments on Small Ingots 30
IV Mlcrosegregatlon of Chromium in AISI 52100 Unidirectional Ingot 37

vll
ACKNOWLEDGEMENTS
Portions of this work, where referenced, are from an earlier
study conducted under United States Air Force Sponsorship
Computations were performed, primarily, at the M.I.T. Computation
Center, using an IBM 7090 Computer. Assistance of Dr. H. D. Brody
In programming Is gratefully acknowledged.

INTRODUCTION
This report summarizes research conducted during the third year
of a continuing research program on steel solidification. Work con-
1 2 ducted during the first two years of the program has been reported * .
The first period (December 9, 1962 to September 30, 1963) comprised
a study of dendrite structure, microsegregation and homogenization of
13 / \ low alloy steel * . Dendrite morphology was found to be platelike; micro-
segregation was found to be significant and relatively insensitive to
cooling rate. Substantial homogenization of alloy elements other than
carbon was found to require much higher temperatures and longer times
4 than those generally employed in practice. Abeam and Quigley then
showed the substantial improvement in mechanical properties obtainable
when more complete homogenization is obtained.
2 The second period (October 1, 1963 to September 30, 1964) comprised
a theoretical and experimental study of microsegregation in binary iron-
base alloys, in which substantial diffusion occurs in the solid during
solidification. Reasonable agreement between theory and experiment was
obtained for an iron-nickel alloy. Work on this topic has continued
and is to be the subject of a later report.
The aim of the research described herein is to apply the theoretical
model for microsegregation to a ternary iron-base alloy, and to compare
results of calculations with experiment. The ternary iron-carbon-
chromium system was chosen for study; experiments and calculations were

conducted on alloys containing 1,5 per cent chromium, with carbon
varied from 0 to 3 per cent. Calculations /ere done, for the most part,
using an IBM 7090 computer.
Only a limited amount of data are available In the literature on
mlcrosegregatlon measurements In multi-component Iron-base alloys, and
nothing Is available on quantitative comparison with theory. Investlga-
1 5-12 tlons * ' have been made of segregation In ferrous-alloys, notably
medium carbon (.21 - .62 per cent carbon), low alloy steels; results
for these steels are presented in Table I. Results reported are for the
common alloying elements (manganese, nickel, chromium, molybdenum,
silicon, tungsten, and copper); impurity elements (sulfur, phosphorus,
and arsenic) are excluded as well as less frequently encountered elements
(tin, niobium). Average values of the segregation ratios are given In
Figure 1 (along with the number of alloys in which the segregation ratio
was determined and the range of composition for the applicable ratio).
Figure 1 Indicates that segregation ratio for manganese and nickel lie
between 1 and 2 for all alloys examined. Segregation ratios for chromium
and molybdenum are higher and show more scatter. The casting conditions
of the various alloys Investigated varied widely. Ingots ranged from
100 tons to laboratory size with structures that included columnar and
equlaxed zones; some ingots solidified rapidly, other slowly.
Philibert et al have Indicated that carbon increases the extent
of mlcrosegregatlon of various elements in iron alloys. It was stated
that the extent of carbon's effect depended on the absolute value of
thermodynamic interaction parameter of the third element with carbon in

tfl
u
a
tn a» c o N
X n)
•r-l 3 a* OJ
T3 C (0
t->
o u
o to a
B o
o
0 u
o
c
c o
tn at c o N
-a <u X (0
•H 3 O" 01
T3 c
o c "a
•H ai x
iw (0 O -H
3 M cr 4) 0) w c "O <u c U (I)
C (9
i " i 3 OJ 3
O .H MM O O "O 0
O OC c
u
u G
u
o 00 c
u <u 4-1 c a> o
0)
u c
O
C (D C V CO C n) X §ca
60-H 00 3 <H Ö
eg J:
la 3 B
O O O O 00 00 00 00 c c e c
0 o 00 ( a c
c o
e o
vO
g c o
ON
c 0
c o
•H U WO u u u at u>*-i cMtntNts
tn <u ja u c
I
I
o
U H-l
1° 3 e
rH O o u
(8
00 e
o o o
o 00 c •H
•O u C 3 3 C
a e <N O
• e
o oo c
t-l
iJ
I u c
oo
tn u (U 3
U 3
vO
to
• iH I
I
U4 W H CO
Z o
to 0 I
Ou
U
H
§ Z o
I
c o
<u 01 tu
CO
m m
u o
<N I
<n
I I CM
CTN l-l M F-(
^H <r <N CN • • • i-H FH M
-* n fn • • • CO H •H M
t-( CM rH —(
I
H I
«» <r «» ^ ^
till
m
I
fo
i CM
I -3-
oo m vO
I I vO
I
c (U
l-l C) a.
in
01
£
3 U
m
o> sr r» «N CM (S en
00 CM
m CM
in
n oo lllilim miifMi
3
C o
u u
m
m
CN
vO ON r-» \£> <j\ <y\
m en m
CM
CM O
m o o ao
m CM m m ON ^ CM M m O i r^
IH m .-i
00 ON O CO ON sr -* oo o r»
I I I I I rH i-l PH <» CM
o <n t m i oo i
in oo
tn o o. I Cl u 4.i
3 c
W3
I
o
o m co co
CM
m
-* •»
O CO I CM H
O in
in co
o
ao ro
co
O fO
00 o
00 o co
ON o
m ro
00 m
NO ro
o
o
O m I i -a- i i i co
CO 00 o •* vc m oo
•—I iH CO tM CM m i—t CM CM CM •* -* ■* CO
ON I I I CM I
o CO
NO r^ co ^■
i-H m m oo
CM o vO NO -a- <»
U c <U u 01 U-l <u
vD so oo m m ON ON ON ON ON CM NO

0
9
8
(/)
S 6 o X c 5 o
S. 4 w
en 3
I -
Alloy Ranges1
Q4
10 II
i
c .21- .62% Mn .51- 1.85% Ni 1.35- 2.79%
Cr .5 - 3.13% Mo .27- .53% Cu .57 W .75 SI 1.29
Oi
Mn NI Cr Mo Element
Cu W Si
Figure 1: Segregation ratios for common alloying elements In medium carbon, low alloy steels.
Numbers beside the points represent the number of alloys Involved for the respective elements. Data from Table I.
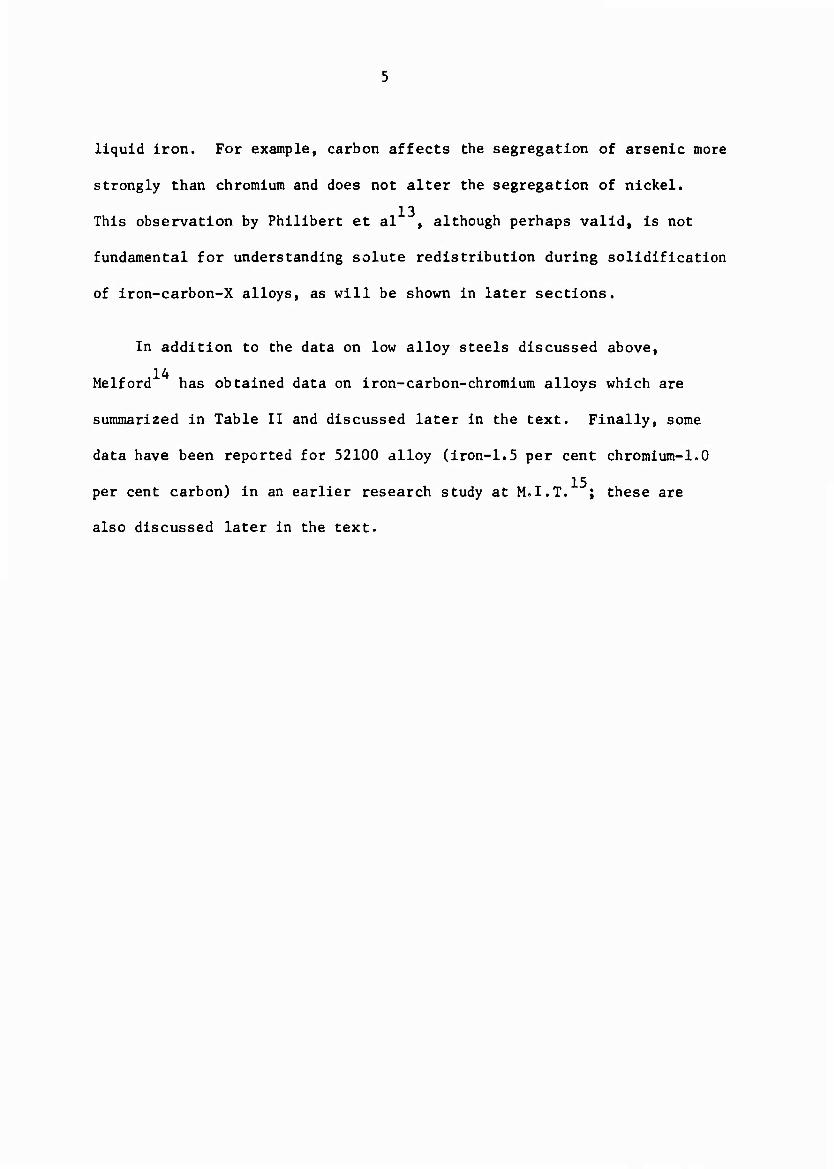
liquid iron. For example, carbon affects the segregation of arsenic more
strongly than chromium and does not alter the segregation of nickel.
13 This observation by Philibert et al , although perhaps valid, is not
fundamental for understanding solute redistribution during solidification
of iron-carbon-X alloys, as will be shown in later sections.
In addition to the data on low alloy steels discussed above,
14 Melford has obtained data on iron-carbon-chromium alloys which are
summarized in Table II and discussed later in the text. Finally, some
data have been reported for 52100 alloy (iron-1.5 per cent chromium-1.0
per cent carbon) in an earlier research study at M.I.T. ; these are
also discussed later in the text.

TABLE II
Summary of Mlcroseg egatlon Measurements on Iron-1.5 Cr Alloys Containing 0 to 2% Carbon (from Melford1^)
Per Cent Carbon Segregation Ratio. S
0 1.4
0.3 1.7
0.7 2.9
0.8 3.0
1.1 4.8
1.5 5.5
1.8 3.5
2.0 3.6

PART I: MICROSEGREGATION CALCULATIONS
A. Analysis of Mlcrosegregatlon In Multi-Component Alloys
Ingots and castings of alloys contain three regions during
solidification; the extent of each of these depends on alloy analysis
and thermal conditions. The regions are (1) completely solid, (2)
partially solid and partially liquid, and (3) completely liquid. The
redistribution of solute which is considered herein occurs within a
small "volume element" situated in the liquid-solid zone as it passes
from being completely liquid to completely solid.
The assumptions used for developing expressions of solute
redistribution during the dendritic solidification of alloys have been
discussed in detail * , and are:
1. Negligible undercooling before formation of solid.
2. Negligible interface supercooling from kinetic or curvature
effects.
3. Equilibrium partition ratio applies at the interface.
4. Negligible constitutional supercooling.
5. No tnermal gradient in the liquid.
6. No macroscopic mass flow.
7. Solidification proceed.3, at a given point in a casting or
ingot, by continuous advance of a liquid-solid interface (e.g.,
continuous thickening of dendrite arms) .

It follows from the foregoing assumptions that the liquid within each
"volume element" is uniform In composition, and the equilibrium partition
ratio applies at the liquid-solid interface. The equilibrium partition
ratio may vary as solidification proceeds and the composition of the
solid may or may not be uniform.
With the foregoing assumptions, it is possible to describe solute
redistribution (and hence microsegregation) in multi-component alloys
provided only that extent of diffusion in the solid is also described.
In the following we consider two limiting cases: (1) complete diffusion
in the solid, and (2) no diffusion in the solid. It will be shown later
that the first limiting case is an excellent approximation of solute
redistribution of carbon in iron-carbon-chromium alloys and the second is
a reasonable approximation for redistribution of chromium in most such
alloys.
1. Complete Diffusion in the Solid.
A material balance for component 1 is written:
Coi • 'sCSl + fLCLl (1)
where C . ■ overall weight fraction of component 1
C-,, C. . ■ weight fraction of component 1 in solid and
liquid respectively
fc, f = weight fraction solid and liquid respectively O Li
k.C ,
or CSi " 1 - fs(l - k^ (2)
CSi where k = -— = equilibrium partition ratio (2a)
1 LLi
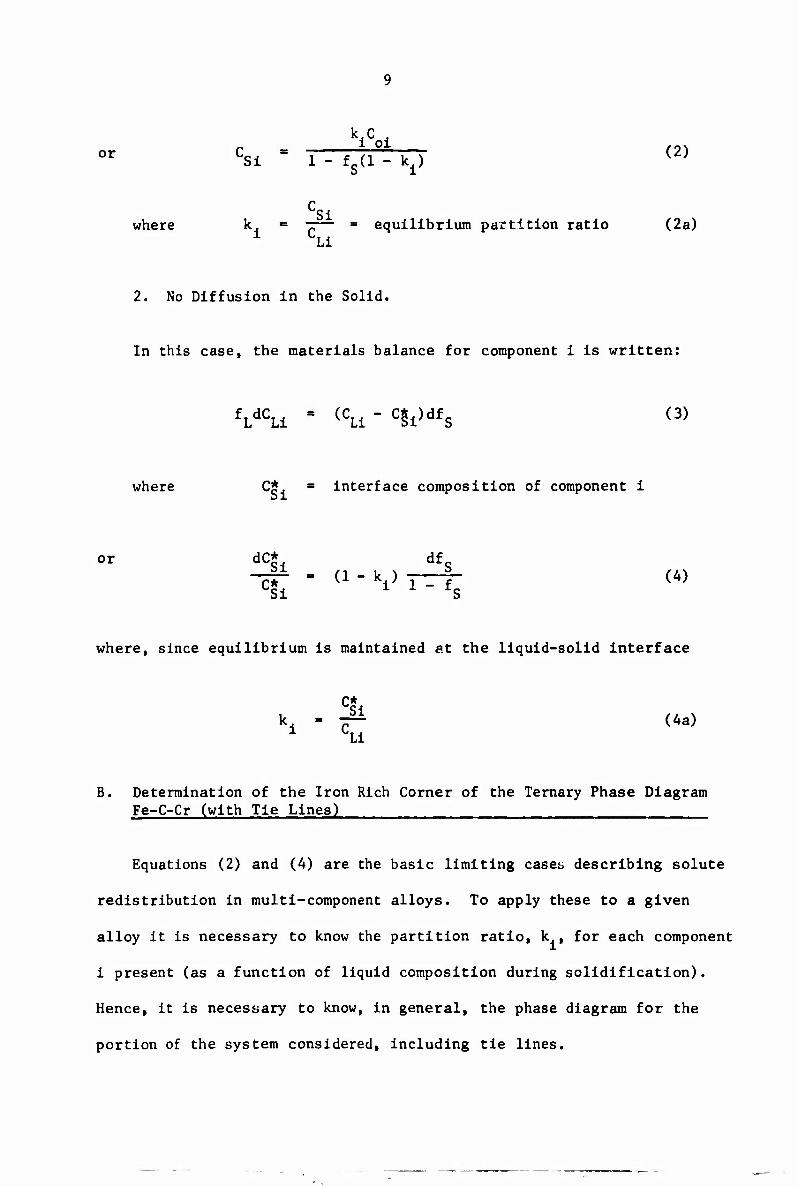
2. No Diffusion in the Solid.
In this case, the materials balance for component i is written:
fLdCLi " (CLi-C§i)dfS (3)
where C* ■ interface composition of component i
or dC* df_ -r|i = (1- k ) f- (4)
CSi i 1 " fS
where, since equilibrium is maintained at the liquid-solid interface
CSi k. = f± (4a) 1 LLi
B. Determination of the Iron Rich Corner of the Ternary Phase Diagram Fe-C-Cr (with Tie Lines)
Equations (2) and (4) are the basic limiting cases describing solute
redistribution in multi-component alloys. To apply these to a given
alloy it is necessary to know the partition ratio, k., for each component
i present (as a function of liquid composition during solidification).
Hence, it is necessary to know, in general, the phase diagram for the
portion of the system considered, including tie lines.

10
Unfortunately, for iron base alloys, ternary (or quaternary) phase
diagrams are scarce; when they are available, tie lines are not
generally given. In the iron-carbon-chromium system, to be considered
herein, some data on ternary phase fields are available, but almost no
information is available on tie lines.
Because reliable data on partition ratios, k , were not available
for iron-carbon-chromium alloys, a substantial portion of this work has
been devoted to establishing these through (1) correlation of existing
data, (2) thermodynamic calculations, and (3) experiment. This work is
summarized in the Appendices and only the result given here.
Figure 2 shows the liquidus surface of the iron-carbon-chromium
system for 0-20 per cent chromiun and 0.5 - 4.5 per cent carbon. The
isotherms in Figure 3 show the gamma solidus surface for the iron-carbon-
chromium system („1 - 2.3 per cent carbon, 0-17 per cent chromium).
Superimposed on this diagram are the locii of liquid compositions (per
cent chromium) that are in equilibrium, at the temperatures given, with
solid austenite of composition given by the axes. This method of plotting
the data permits the same data to be represented by the two figures as
would be given by a series of fourteen diagrams if the equilibria were
presented in the customary manner (i-e., isothermal sections showing the
tie lines in the two phase regions).
As an example of the use of Figures 2 and 3, consider a liquid
containing 5 per cent chromium- At 1225i'C, the solid in equilibrium
with this liquid contains (according to Figure 3) 4 per cent chromium
and 1.61 per cent carbon. From Figure 2, the liquid is seen to contain

11
5.0-
4.5
4.0-
^ 3.5 m
I 3.0
2.5- c o x> w
ü 2.0
c 5 w I 5 a.
1.0-
0.5-
0- i
0
L+8-- y
L*(Cr,Fe)7 Cj'y
I 10
l l 4 6 8 10 12 14 16
Percent Chromium of Liquid, %Cr| 18 20
Figure 2: The iron-chrcc.iuin-carbon garana liquidus surface.

12
r> 0)
>. <u ^3 jr
*J •o o m -2 C CO
^ ~ 3 -H o
_ .•* M-l 0)
t \ V S 0 4-1
CO CO •H -H
'^
\ S5 eg
\ 1 . t \ / _ w u
o o 1 \ / \
^ 1 ' V A •• •H U
K) I \> N 4J Q-
" , \ H.' > A CO CO o
K\ \ h / , -5 « comp
the
vi\ l\ l^sL 1/17/ o "O 4J — 1 \ü\ \ 7^ \ / J I a? •H fH
~k\j>\ \ l^-K /I / =1 * IWK: \ X T sin » tr* \i— \l ^ k. / / / /i « •H ß 0 \ ^K \J y / -~ £ • ^H O
•H
vKsK W^7 / / « •• i-> 4J CO CO W \» X 7^ / /III «A «0 iH U
\N: ^ v / /y/wfl 3 <
3 4-t O c
\ \ \ / / l yi f n 3 •H 0)
\\ \ tui^m - 9 o
E
(0
3 part
cone
00 J\ V 4 11 im 3
E o
13
O
(0 |
\j ^ ^J r^^^ 1 *** ! I Jr 1 *\ \ i\ u CO 4-1 B
0N x "XINL ///>7 /// «5 01
•H O
\ X E J3 \ N IV / ^^^J^ / / ^^^i 1 1/ i u «^B f s 13 1 \ w |^^^ 1 J**** / [^ 1 l^i 1 ß C n 3
«1 x ^v | ^^iL / / / / Jt^^I \j' 0» 6C •H T3 X ^Vl /^^«J / / ^^^1 / Vf 1 u M -H K 1 N ^^. / j^ / l^^} / IS\ hi B XI 3 1 x V^ 1 ^^^1 / 1 / / 1 ^^f \ iXm •> 3 •H cr n^ ̂ HijuMiJ
— U) 0. 1 Ja e
quil
he li
1 Pv 1 >^ / / 1 ^1 1 1 1 JSl 1 U u «•i XJ ps—/ / / / / X^r 1 | a rv ^ / T—+ l /—r~i / ;>fl c •H «4-1 h X ^KLT/TT/TJ^J — ^• o O (U
X <sj rr _ 1 1 1 1 1 / 1 • M «0
4-1 C / 7 rTT / / JA H O ^x r^j^ / i i^*^\ i CJ C iH
o \
o 0
^
^ ^ iS -CM
1 g o M
•H
9) 4J
PJmv 4-) U
/ / rtTTJ h CO M 4)
di i-i
2\ — — j.!//1 n n in*- M/
ß 65 - X/ ///// 1/ ////// / ••
— O
o in o m o «o o 0) M
lO cj Csi — •
Ö 3 00
,0%'d4fu»4«nv *o uoqiOQ |u99Jad

13
3.58 per cent carbon. Hence, the partition ratio for chromium,, k at
this liquid composition is 0.80 and the partition ratio of carbon, k ,
is 0.45.
Figures 4 and 5 show, respectively, the partition ratios of chromium
and carbon for the iron-carbon-chromium alloys of interest. By knowing
the temperature involved and the concentration of one component, in one
phase, the partition ratio can be uniquely determined. The partition
ratios are plotted In Figures 3 and 4 as a function of chromium concen-
tration in the liquid with the temperature as a parametric variable.
For chromium, the partition ration at a given temperature increases
with per cent chromium in the liquid. The lower partition ratios are at
intermediate temperatures (1275 - 13250C) which correspond to carbon con-
tents of approximately 3 per cent. At higher or lower temperatures (lower
or higher carbon contents, respectively), the partition ratio of chromium
increases. This diagram clearly shows that the partition ratio of chromium
varies considerably during the solidification process.
The partition ratio of carbon can be described as decreasing with
chromium additions for all temperatures down to 12250C. Below this tempera-
ture the ra^ o increases with increasing amounts of chromium. With no excep-
tion, the pa. ition ratio of carbon increases with decreasing temperature.
C. Evaluation of Solute Redistribution of Ternary Iron-Carbon-Chromium Alloys
Using the partition ratios of Figures A and 5 it is now possible to
calculate solute redistribution (and hence final microsegregation) for
various iron-carbon-chromium alloys. This is done by simultaneous
solution of equations (2) and/or (4) for the two solutes present, over

14
Q «• •
T3 •H 3 CT
■H
m JZ
ro u c
•H
c 0
t O "O u
ro 3 4J c
CT (V u
-J C a
u in C
3
CNJ o 01 .0 > k. 0 0 ♦— u
O • c 01
CVJ u 1*^ %m O 9} a. u
•H
2 IO g • •H
4-1 •H ♦J M
a,
O • •
• «1
5 00
10
O 0) 00 * • •
ujniuiojgo ^o oi|Od uouuJOd
u>

15
m \n in in m ^ 3 cr
(VJ ^ CO N cv i—i
C\J CJ ro ro ^t
e o ki
x; y
4-i
c aj
■D u
3 u
a. _J in
r C u
OJ >
F D c
o
E XI u
o £ '4-.
u o o
c. 0) o b k. 0) C 0. 0
•^H iJ
■rH
U M R) a.
• • in
V u D Qt
CD in ^ ro • • • uoqjoo ±0 oijoy uonnjod
cvj

16
small Intervals of solidification*. We consider as example below AISI
52100 alloy (iron-1.15 per cent chromlum-l.O per cent carbon).
Assume first that both solutes in the 52100 alloy diffuse completely
.n the solid. Hence solute redistribution for both elements is described
by equation (2). Results of simultaneous solution of equations (2), for
carbon and chromium, are plotted in Figure 6 as interface composition,
C*, versus fraction solid f_.
As second example, consider that the carbon diffuses completely in
the solid and the chromium diffuses negligibly (and the activity coefficient
of the carbon is independent of chromium concentration). Now the solute
redistribution of carbon obeys equation (2) and that of chromium obeys
equation (4). Results of calculation using these two equations, and the
partition ratios of Figures 4 and 5, are given in Figure 7.
Finally, if neither carbon nor chromium diffuse in the solid,
solute redistributions for both elements are given by equation (4),
and are plotted in Figure 8.
Figures 6 and 8 are included for illustrative purposes only, since
as will be shown later for the alloys considered herein, by far the most
realistic assumptions are those embodied in Figure 7 (i.e., complete
diffusion of carbon in the solid, no diffusion of chromium).
* These calculations are time consuming if done manually; for this work an IBM 7090 Computer, Computation Center, M.I.T., was employed.

17
3
O if)
c 0) o 0)
0 J- ± 0.2 0.4 0.6
Fraction Solidified
0.8 1.0
Figure 6: Solid composition, iron-1 per cent carbon-1.5 per cent chromium alloy, assuming complete diffusion of both solutes in the solid during solidification.
Solid lines represent interface compositions during solidification; dotted lines represented solute distribution after solidification.

18
o W
♦- c • u
- 2
± ± 0.2 0.4 0.6
Fraction Solidified 0.8 1.0
Figure 7: Solid composition iron-1 per cent carbon-1.5 per cent chromium alloy, assuming no diffusion in the solid of chromium, and complete diffusion of carbon.
The dotted line represents the final carbon distribution.

19
0)
3
O
c 0) o 0)
Q.
0)
0.2 0.4 0.5
Fraction Solidified
0.8 .0
Figure 8: Solid composition iron-1 per cent carbon-1.5 per cent chromium alloy, assuming no diffusion of either solute in the solid.

20
Final solute distribution was calculated for a series of experimental
alloys to be discussed later, all of which contained approximately 1.5 per
cent chromium. Results of these calculations (made identical to those
summarized in Figure 7} are given in Figure 9.
By combination of Figures 2, 3 and 9 (or by direct calculation), it
is possible to plot fraction solid (at a given location) versus temperature
at that location. This is done in Figure 10.
D. Measures of Microsegregation
The solute redistribution curves given earlier (Cc versus f ) provide
a complete description of "severity of microsegregation" (although not
its form or spacing, which depends on dendrite size and morphology). For
comparison with experiment, however, it is desirable to assign a simple
index to this "severity of segregation". Some useful Indices are
described below.
(a) Segregation Ratio.
1-18 An index of segregation that has been widely used to date is
the "Segregation Ratio", S, generally defined as:
IVmax (CS)min
where S ■ segregation ratio
(Cc) m maximum composition of solid (found in inter- b max
dendritic regions for k < 1)
(C„) ■ minimum composition of solid (found in dendrite
spine for k < 1)

21
1 ~
■H^
^
1
>
\
—
1 1 ,
1 1 1 1 | 1
— —
Ü
a* o \ "
— ro v 1 1 1 1 r
q
op
(VI
o
1 1 1 !l i
— \
—
— u ro A
\ - —
-
1 1 1 1
CD
ID O if)
^ c o •^ Ü
CVJ o
_ '
i
\ -
u
q v i i i i 1
iß CO o to t
uumuuojgo iudojaj m&!a/V\
0) u J: U 4-1
u c 1 •H HI u- 6 u-, •H 0 E
O CO u QJ s:
•H u U 9i n-> V) o
o
O (0
•4-1 •a >4-i
O U3
c o
u to
o c M c
tn 3 » m e >-i 3 ■ a» «H c > E o
o XI B u u 3 x: tg
•H U U B O 4-1 U-l M C O x: 'j
c 0) CJ
IM 0) a
CJ c o
Ul -H tu en a 3
«4-1
x; QC C
•H -H rJ to 3
OX 0) C 4J
T3
a. e o u c
o y -a
c in >. -a O -H
fO •—i O U CO tfl
u 3 K

22
1500
0.4 0.6 Fraction Solid
1.0
Figure 10: Fraction solid versus temperature for Iron-carbon-chromlum alloys calculated assuming no diffusion of chromium and complete diffusion of carbon in the solid.
Calculated for alloys of 1.5 per cent chromium, and of carbon contents from 1.0 to 3.0 per cent carbon.

23
This index has the advantages that (1) it is simply calculated,
(2) it can be approximately determined experimentally quite simply.
Disadvantages include the fact that it is tedious and sometimes
impossible to obtain experimentally a segregation ratio with a high
degree of accuracy, because concentrations may approach asymptotically
very high values at the end of solidification (and hence over very small
distances). These concentration changes may take place over distances
of the same order as probe spot size, and in any case, the steep concen-
tration gradients over small distances mean that small difference in
amount of diffusion can profoundly affect measured segregation ratio.
Other disadvantages Include the fact that, in multiphase alloys, segre-
gation ratio may not be a very sensitive index to changes in
microsegregat ion.
Segregation ratios for the iron-carbon-chromium alloys shown in
Figure 9 are plotted in Figure 11, as segregation ratios versus per cent
carbon, for constant chromium. Because composition of alloys in Figure
9 asymptotically approach high values at the end of solidification
(Cc) , of equation (5) has been arbitrarily taken as that composition
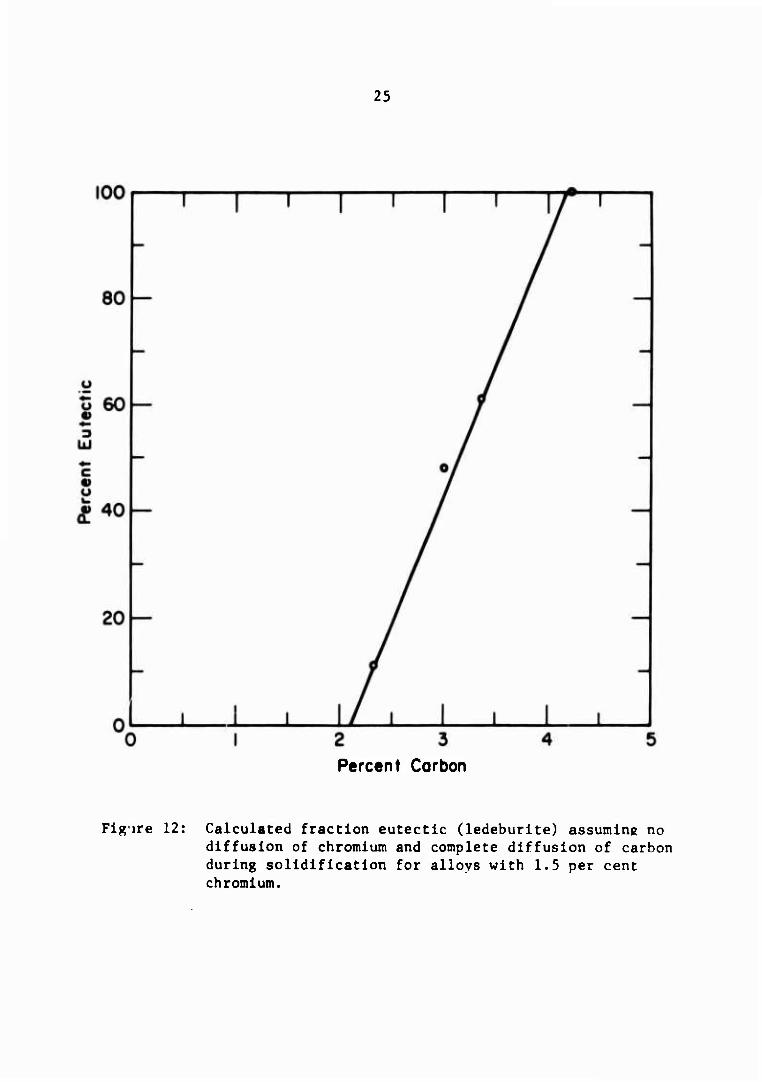
of fs - 0.99.
2. Amount of Second Phase.
A second measure of microsegregatlon which has been employed ' *
is amount of second phase (e.g., fraction eutectic). Fraction eutectic,
fp, taken from curves such as those of Figure 9 are plotted versus per
cent carbon in Figure 12, for chromium = 1.5 per cent.

24
a> oo N CD m ^- fO
S 'OIJOU uojioßajßas
c •H c CO 4-1 c o o
o
I •H
% u X u
4-1 c a» u
ki <u a
m
i c o u
u
c • o c
•H O 4-1 X) (0 M at ft
ÖC 4J 0) c CO (U o
■v V u 4-1 (V to a
M 3 fi U
>H I (0 U r-l
u 3
25
2 3 Percent Carbon
FiRire 12: Calculated fraction eutectlc (ledeburite) assuming no diffusion of chromium and complete diffusion of carbon during solidification for alloys with 1.5 per cent chromium.

26
3. Composition Deviation Index.
An alternative measure of mlcrosegregatlon. Incorporating some of
the attributes of both the foregoing Is composition deviation index
m a , defined as:
"" - 07 / lcs1 - Coll dfs <6'
01 0
where C - composition of Isoconcentratlon surface enclosing
volume fraction o:
solid diffusion.)
volume fraction of solid f'. (f' ■ f,, for no
This parameter has the following properties. If there Is no
m segregation 0 • 0; for maximum segregation the partition ratio equals
zero and the alloy must solidify so that
csl - 0 0 < f • < (1 - ^i)
CS1 ■ CM1 d-^iXf- <1 Ml
where C... « maximum concentration, and
am - l-^i (7)
Sii
For alloys that are homogenized at a temperature such that the
equilibrium state Is a single phase, 0 approaches zero with time.
For alloys whose equilibrium state is two phases,

27
0 * F7c =~c—)— (8)
where C ,, C . = concentration of i in the two equilibrium phases ai pi
To eliminate experimental difficulties in determining the exact concen-
tration profile for the last stages of solidification, equation (6) is
written:
^ = it f |Csi-Coil dfs (9)
0
where f' = volume fraction at C equal to C
Advantages of a as an index of segregation include (1) it allows
comparison of microsegregation in single phase alloys with that in
multiphase alloys, (2) it can be introduced directly into solutions of
Pick's second law to describe homogenization kinetics.
From an experimental point of view, advantages include (1) determina-
tion of am depends not on accurate location and measurement of maxima and
minima, but on compositions at all values of f', and (2) o can readily
be determined by simple experimental procedures to be described later.
Figure 13 shows am plotted versus per cent carbon for iron-carbon-
chromium alloys containing approximately 1.5 per cent chromium, calculated
from curves in Figure 9.

28
u V
c • 0) E U 3
•H ^ 6 « o
U 4J •H C 0) QJ » u (0 M
w a M 4> in > •
6 or D c • c
0) I« T3 c
c o
> «0
^ I C -H O E •H O
•H X CO u O I Ou C e o u u
CO u I
• g ^H U 3 -rt u
•H U m o
0)
s
01
m^) 'xtpui uoi4D|A»a uojiitoduioo
29
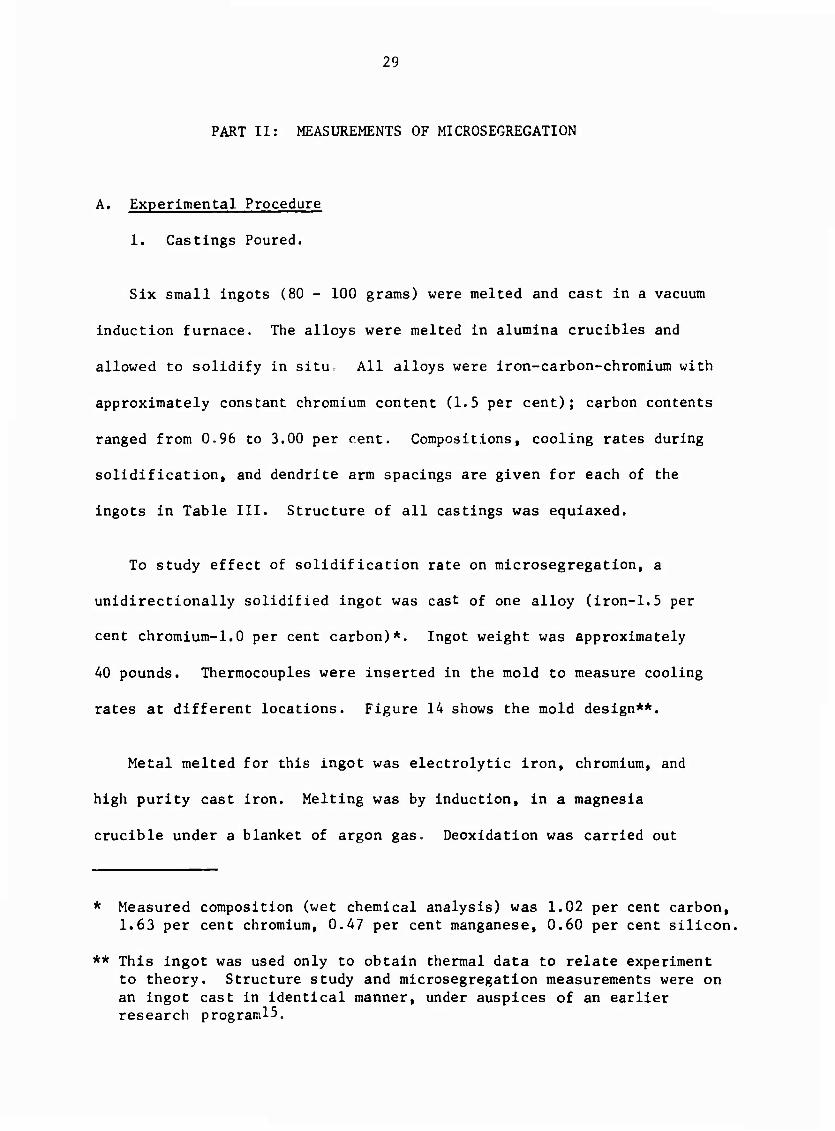
PART II: MEASUREMENTS OF MICROSEGREGATION
A. Experimental Procedure
1. Castings Poured.
Six small ingots (80 - 100 grams) were melted and cast in a vacuum
induction furnace. The alloys were melted in alumina crucibles and
allowed to solidify in situ All alloys were iron-carbon-chromium with
approximately constant chromium content (1.5 per cent); carbon contents
ranged from 0-96 to 3.00 per cent. Compositions, cooling rates during
solidification, and dendrite arm spacings are given for each of the
ingots in Table III. Structure of all castings was equiaxed.
To study effect of solidification rate on microsegregation, a
unidirectionally solidified ingot was cast of one alloy (iron-1.5 per
cent chromium-1.0 per cent carbon)*. Ingot weight was approximately
40 pounds. Thermocouples were inserted in the mold to measure cooling
rates at different locations. Figure 14 shows the mold design**.
Metal melted for this ingot was electrolytic iron, chromium, and
high purity cast iron. Melting was by induction, in a magnesia
crucible under a blanket of argon gas. Deoxidation was carried out
* Measured composition (wet chemical analysis) was 1.02 per cent carbon, 1.63 per cent chromium, 0.47 per cent manganese, 0.60 per cent silicon,
** This ingot was used only to obtain thermal data to relate experiment to theory. Structure study and microsegregation measurements were on an ingot cast in identical manner, under auspices of an earlier research program^.

30
TABLE III
Summary of Experiments on Small Ingots
Solidification Casting Melt Analyses Interval Cooling Dendrite Element
Designation %__C % Cr Rate. "C/Second Spacing y
a 3.00 1.44 .91 55
b 2.32 1.48 1.03 72
c 2.01 1.49 .94 84
d 1.75 1.48 .89 70
e 1.54 1.45 .92 72
f 0.96 1.48 .87 87

31
EXOTHERMIC MATERIAL
23cm
11 4r'D
WATER COOLED COPPER CHILL
Figure 14: Mold for producing unidirectional ingot. Shown are locations of thermocouples used to obtain cooling curves.

32
with 0.1 per cent aluminum, and the ingot was poured at 1600oC. After
cooling, the ingot was sectioned and examined; structure was fully
columnar. The cooling curves for the ingot, obtained by a sixteen-
point recorder for the thermocouples 4.0 to 11.4 cm. from the chill
and by a continuous strip chart recorder for the thermocouple 1.7 cm.
from the chill, are shown in Figure 15.
2. Microstructures.
Prior to microprobe study, specimens were removed for metallographic
study from an identical unidirectional Ingot to the one on which thermal
analysis was conducted. In order to better delineate the structure, the
specimens were heated for 15 minutes at 825 - 850oC in an argon atmo-
sphere and water quenched. At the elevated temperature carbides coexist
with austenite; quenching results in a martensitlc matrix with a higher
concentration of carbides in the interdendritic (chromium-rich) regions.
Typical microjtructures can be seen in Figure 16; dendrite arm spacings
are plotted in Figure 17.
3. Microprobe Analysis.
In the alloys studied, the concentration gradients of chromium are
small in the low solute regions, but often quite steep in the inter-
dendritic regions. Thus the chromium minima could be found easily, by
directing the microprobe scan across dendrite cores. To determine
maxima the samples were manually scanned in the interdendritic areas,
and the instaneous intensity was detected; point counts (30 second inter-
gration times) were then made at close Intervals (1 - 3u) across the
maximum.

33
1 1 f I500
I450
1400
^ I350 o o
3 I300 <
UJ a 2 £ I250 -. ?
I200
II50
100
1—I—i—r
11.4 CM
1 0 5 10 15 20 25 30 35 40 45 50 55 60
TIME AFTER POURING (MINUTES)
Figure 15: Cooling curves for the unidirectionally solidified 52100 ingot.

34
(a)
|! 1 ;i j • i •
mm- K •/ • • • .
i7, • • . « . - •• * ■ « .
X- .i -" * '*'■'}
(b)
Figure 16: Dendritic structure of 52100 unidirectional ingot two inches from the chillis.
(a) perpendicular to heat flow, 12X. (b) parallel to heat flow, 12X.

35
500
m
er
o
400
o 300 < CL C/)
S (T < 200 UJ H OC o 7 UJ 100 Q
Primary Arm Spacing
Secondary Arm Spacing
0 2.5 5.0 7.5
DISTANCE FROM CHILL, CM
10.0
Figure 17: Dendrlte arm spacing In 52100 unidirectional Ingot 15

36
For the columnar samples, the normalized intensities were converted
to compositions by the use of a calibration curve based on homogenized
standards all with approximately 1 per cent carbon. Analyses were
carried out using an A.R.L. microprobe with a "take-off" angle of 52.5°.
The results of these microprobe analyses are given in Table IV. Maxima
and minima only were determined for these samples.
For the equiaxed small ingots, maxima and minima were determined in
similar manner, except that X-ray intensities were converted to weight
per cent chromium using the procedure outlined in Appendix F. In addi-
tion, three of the specimens (ingots d, e, and f) were scanned with
long paths of random orientation, to obtain directly the form of the
overall final solute distribution; i.e., chromium concentration, C
versus fraction solid, f'*. This is done following a procedure identi-
cal to that for determining amount of second phase by lineal analysis;
in this case the amount of "second phase" is the volume fraction solid,
f', with a composition of C_. and greater. It is determined simply
from the results of a probe scan, as shown schematically in Figure 18, as:
£• - -i 2_J dO)
The three specimens scanned to determine f', (d, e, and f) were
scanned at 40, 80, and 80 micron» per minute, respectively. Each
specimen was scanned a total of 5000 microns. Statistics of lineal
* This procedure was first suggested by Dr. Paul J. Ahearn and employed in his doctoral thesis, "Solute Redistribution in the Dendritic Soli- dification of a Tin Alloy", Department of Metallurgy, M.I.T., February, 1966.
37
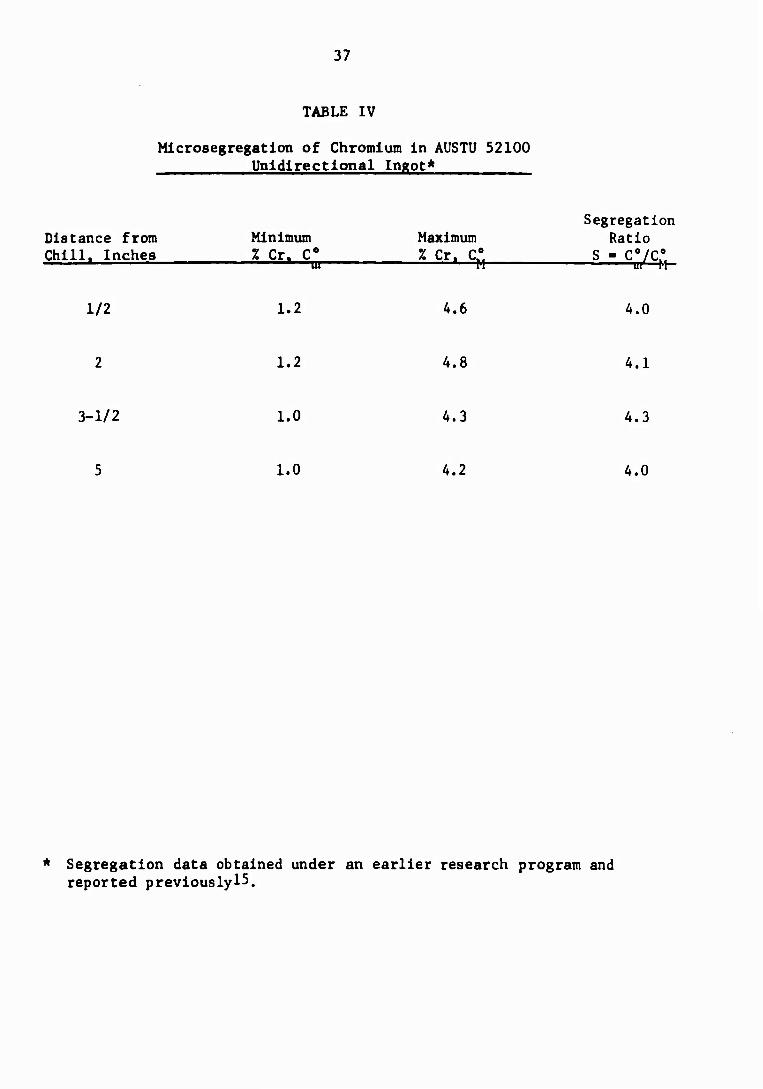
TABLE IV
Mlcrosegregation of Chromium in AUSTU 52100 Unidirectional Ingot*
Distance from Chill. Inches
Minimum % Cr. C
in-
Maximum g Cr. C»
Segregation Ratio
S-CVC ur M-
1/2 1.2 4.6 4.0
1.2 4.8 4.1
3-1/2 1.0 4.3 4.3
1.0 4.2 4.0
* Segregation data obtained under an earlier research program and reported previouslylS,

38
t Q) Ü C o «A
•H
(J CD I-
(V
<u
UOUISOdlUOQ
o > 4J
CO 0) 0) C »i •H ex.
U "V 01 c ♦J nt 0) t) -H
e <A 0 J 4J
CO O t-l (0 C ^ o (0 *-> C -H id to
o 01 Q.
o o P u p. o a M
•H *J
u ■H fH 4J (Q «0 -H e ^ 0) 0) x: « o (0
co B
0) 1-1

39
20 analysis as given by Milliard and Cahn were applied to these
experimental conditions to indicate probable erros.
B. Results
1. Microsegregation in Unidirectionally Solidified AISI 52100 (Iron-1.5 Per Cent Chromium-1.0 Per Cent Carbon).
Table IV summarizes the results of microprobe data for AISI 52100
alloy at four different distances from the chill. Minimum and maximum
values of composition, and segregation ratio, do not change appreciably
with distance from the chill (and hence with cooling rate). Minimum
values are essentially those predicted by theory given in Part I
^Figure 7) while maximum values are somewhat less, presumably because
of some diffusion in the solid down to steep concentration gradients
present near the end of solidification.
An estimate of extent of diffusion of alloy elements in the solid
during solidification can be made from the factor, , where :
' 5si 'f a. - 5 (11)
d
where: a ■ constant (4 or 8 depending on whether df^/dt is assumed a linear or parabolic function of time)
DS ■ mean diffusion coefficient during solidification in the solid
tf ■ solidification time interval
d = dendrite arm spacing
For a. << 1, diffusion in the solid during solidification is negligible,
and for a, >> 1, diffusion is complete.

40
As example of application of equation (11), consider the
unidirectional ingot, 6,5 cm. from the chill. Here, d - 160 x 10~
cm., (secondary dendrite arm spacing, Figure 17). Local solidifica-
tion time, 6 , is 860 seconds (determined from Figure 15 assuming
liquidus and solidus temperature as given by Figure 10). Now take the
21 22 diffusion coefficients of carbon and chromium as:
Dc = 0 12 exp [ - -^^ ] (12a)
DCr - 2.35 x 10"5 exp [ - 17'T300 ] (12b)
Using these values at a temperature we expect the alloy to be
approximately 50 per cent solid (1420'C, Figure 10), ot " 120, and
a_ » .01. Hence, we consider that, as the model examined in most
detail in Part I assumed, diffusion of carbon is essentially complete
during solidification. We expect the diffusion of chromium to be small
but as experiment seems to indicate, not negligible.
Of course, some of the reduction of the maxima in solute concentra-
tions observed could be due to diffusion in the solid after, as well as"
during, solidification In this case, it can be readily shown that the
extent of diffusion depends on the parameter
t 4D t
^Cooling " ' -T dt (13> 0
and when (a.)_ .^ is much less than 1 diffusion during cooling is i Cuoling
small; when (a.)_ ,. is much less than a., this diffusion is small * i Cooling 1'

41
compared with that occurring during solidification. The quantity (a ) cooling
was calculated for chromium for each thermocouple location In the uni-
_3 directional Ingot (Figure 14) and In each case was approximately 10
Hence, It Is concluded that diffusion In the solid during cooling may
be neglected for this alloy.
2. Effect of Carbon.
(a) Segregation Ratio.
Segregation ratios for the iron-carbon-chromlum containing
approximately 1.5 per cent chromium are shown in Figures 19 and 20.
The segregation ratios shown in Figure 19 are based on the maximum
concentration of the carbide in ledeburite when present divided by
minimum measured compositions. In Figure 20, the maximum concentration
is the average of the ledeburite phases. Also shown in Figures 19 and
9 20 are (1) data from low alloy steels given in Table 1 , (2) data for
14 iron-carbon-1.5 por cent chromium alloys of Melford and Doherty , and
(3) a point for an lron-1.5 per cent chromium alloy containing 0 per
cent carbon obtained in this work.
The alloys of Figures 19 and 20 may be classified into three groups:
1. Up to approximately 0.5 per cent carbon, initially ferrite
solidifies.
2. From 0.5 per cent to approximately 1.5 per cent carbon,
only austenite forms during the solidification, and
3. When more than 1.5 per cent carbon is present, the alloys
solidify as austenite with ledeburite forming as the liquid

42
1 1 1 1 1 'I 1 i (A
"I —
1
1
1
'
This W
ork, U
nidi
rect
iona
l li
This
Wor
k, S
mal
l In
gots
Z
hu
ren
ko/ a
nd
Gol
ikov
M
elfo
rd
and
Doh
erty
/
6 +
—
a < • + { +
-
\
\ ■♦•
—
—
+ >v —
" 0N
< mm
\ \
\
I l I 1 1 1 i
+\
cn
-a »«-1 c o «
c 00 m
a. o •H rsi
nta
lnin
p
nd
Gol
ikov
r c
alc
ula
t te
cti
c.
* o « u
O 3 UH OJ cvi
or st
eels
Z
hure
nkov
OJ X4= (Q 4-1
•H
• X >^ 4J
Q U-i m 3 > M 4-1 oJ u U
c o cn u
cn -H c 4J ■H x>
s C Ul JZ u O -H 4J a
u \- 4J c o G •H 01 O O E X
to x> o 4-1 4-1 u u cn
■^ ♦• CO U. (0 VM c a u o « u w • cn c i. 3 E 4-» O « «0 3 O "H
a. 01 E > o
OC 4-1
•H w ♦■ M o
CVI £ E jr c c 9 3 u •H g
•■• •H Q
i e 4J 4J CJ
^ a c Ui 0)
c OJ E cn 3
o • 0) E h>* ki -H
X-l 0) >H al3 a a >. 4-1 cn E
00 O i/") Wi co
d •H . a» 3 01 4J iH j= J= i« a U 4-1 >- >,Q •H
•H 4J cn c <u T3 u co O 4-1 c 0)
•H «g «8 4J C *-» E T (U a -H TJ U * 00 X U CO ^r u o O 01 4-1 u u >4-l t4 o öc a>H 0) cn o) a (u S 5
o> oo r- ^) ^ ^
S 'oiPd uoüoßajSas
ro CVJ
ON
0J
3 0C

43
(0 u X o *J »M
>^ 00 4J
s-1 cvi si 0) * 0\ s*** iH (fl •
0) U 01 •-• -H >-> 01 4J
f
a e u 60 cd «
(VJ
leal to Fl
(black tr
i of the
eut
o • 4J C >N C
(VJ 0» "O O •O 3 -rt M 4-1 M
c (0 fH CO o • to o
A c -H a. k. a j= e o J3 4-1 O
ID o cd c *? U -H 0) ^ «*— oc c 4J 4-t (fl « C (0 h u « cd oi w U (J >
f cd M 4J 0) O 0)
^ C 4J
(VJ o 4J -H
^J • ■«• oc c cd • •H -H
^ 0) c 3 4-» 0)
00 Ö
6
C M co o) cd 3 (fl 4-1 (0 01 U U to o) a cd > ?
n O «fl /-v
•H J VJ 4J (Q U >4-i VJ -H O
a> oo N to m ^f
S •oijoy uo!4oßij6»s
C O 0 0)
•H 4J *J 3 (fl 0) OC « OJ ^4 (-. Ob 0) 01 £
o
3 01

4A
becomes enriched enough In carbon that the ledeburlte-
llquld eutectlc valley Is reached.
Note the segregation ratio increases as carbon increases until ledeburite
forming alloys are reached where the segregation index decreases as car-
bon increases still more.
In the small castings, as in the unidirectional ingot discussed
above, reasonable assumptions are complete diffusion of carbon and small
diffusion of chromium since, using the data of Table III, and the curves
of Figure 10 to calculate a at approximately 50 per cent solid for all
alloys, a_ ■ 100 and ac •• .01.
(b) Concentration Profiles.
Experimental profiles for the three alloys examined (using the lineal
analysis technique described above) are given in Figures 21 through 23.
These are compared with the theoretical curves calculated earlier and
presented in Figure 9. Note the generally close agreement of experiment
with theory; it is expected that deviations are prln.arlly due to (1)
presence of limited diffusion of chromium during solidification, and
(2) errors in phase diagram determination. Figure 24 summarizes the
experimental and theoretical results of segregation ratio, S, versus
weight per cent carbon.
The composition deviation index, amt described earlier, was
calculated from the experimental curves of Figures 21 through 23. Results
are shown in Figure 25, and compared with the theoretical curve presented
earlier in Figure 13. Agreement between experiment and theory is

45
•v <u
u •H
u c
U] 0) 0) t-i > « 3 (A
o T3 »-I •H »-I ^H <U O
.•/> rH (0 a
• •■)
>, 4) O U)
iH 4J (0 (0
4J C V5 O
_T
u 1-1
« H y u n u ^H
w •r 1 O c i-> > (U 0) Ü p O
o (S u w • <u y. p. «J 4-1
o aj CO • )-i rH
1 CO
(U c 03 ,c n 01 4-1 u >
>H u h 3 0
t-i o <4-(
i) IM •o c
(U o a» x: •H
IS 4J u
U-t T3 c o a, u T3 (X C "O
« a> G "T3 o rH s •H (0 4-1 4J a « c X u 0) m 4-> E c •H <u 0) U Ä o 0) iJ
c a. o x c u (U •H
VD »n ^r ro oj
3 00
u«

46
U> m v ro cvi
a) 4-1 « Ü
•H
M c
CO (U
D u
•H
O
to Ü
• t) >. w O (D H tH rH 4J (0 (0
U a & o •e . cd o
<D
4-1
c
co a Ü rH
•H O . W >
o ^ o O CN
U 01 •
Ct 4J *J (0
m o) (0
(0
M x:
3 O O IM
I C o
u o
<U O 0) J3 -H
•H to 4J •H (0 M »4-( T3 O O D-
ft. C T3 co m
a -v O M ß
•H (0 <0 4-1 4J ft CO C X U <U d)
0)
(U 4.i
4-» a
01 u o S" c U 0» «H
CM
01
g

47
"O 0) 4J
o u o 0) •H • (0
(0
X) C •H
<u 01
m e M
9> 3
O o (0
"O o •H M rH u o «
O en 0» (0 O • o
J*-n • o w ß
.H CO O iH •H -H
m 00
«0 *J 4J (0 U U CO
o o W M Xi «4-1 u CO . 01
s o -31 c 4J a in Ü o c •H O
■^ <u *J > u u 0)
o o u o *< w p O «N Ä b 0) 0) •
O..C « 4-1 U
m CO E r^. <U CO 3 • U iH
00 O 1 CO
a» o > g CO X
0) 4J U
•H 9 O
M U «4-1
(0 o •o c
o <u 0) o
J3 «H rH atJ •H «4-1 Tj o o o. M •o
^■ ex S'S 6 c •o o
CO 3 •H 4-» u p. M (U (V
CM 4-1
C 3« o 0) H J= o 0) 4J
(0 m V ro CJ CN
01
3 Q0
(K

48
a* oo N (O m t ro S 'oiioy uouoöajßas
CM —
u 01 a
u-i •
1 . 1 • C O
ro o~ •H 0)
u U 3 o ac
U- M U,
o ^-( "O 4-1 C (fl fl u
iH
C <H o
■H OJ 4-1 W (0 3 61 01 (U -H U (h ex OJ E
t\i Ul 0
C o eg 2 4J c i_ c V o a, x o •H U
u •*- 0) Qi c a u v> x « u 0) u. 10 9> •O tt) Q. c >
rt u 3
t$m "O u C « O» 4-1
« • ^ rH (fl
_ ^ 3 > u o
rH iH «0 rH U («
<** E O 3
•H c e o 0 10 U
•H £ w. u «d a 4J E C O 01 u u
• • ^ (N
0) W 3 K

49
^J- IO CVJ — • o 6 ö o
XJJJD 'xapui uoi|0|Aaa uomsoduioo
0 o u in
en (V • fi rn u i-i
T*
-o 0) c u
•H 3 0.
c •H
o It •H 4-1 e « 0
•H V- > u-, IU
TJ Cfl ■H
C o a»
•H > 4-1 »1
•H 3 Cfl U o G.T3 E: OJ O 4-1 u (0
rH rH 3 nj U 4-1 iH c Ifl (V U e
•H
t-l • ai (fl a >> X o <u t—1
rH •a m c cfl
3 •O •H IU E 4J o « u
iH SI 3 u U
M 4-1 CO c U 01
u »4-1
o t-l 0)
c a o Cfi iTl
•H • ^ rH « 1 a c e o o u u ■H
■ •
in rsi
(V W 3 ex.

50
excellent. The experimental curve Is completely below the theoretical
as to be expected If some diffusion took place In the solid during
solidification.
One further discrepancy between theory and experiment should be
mentioned. Alloys studied herein which contained greater than about
1.5 per cent carbon were found to form some ledeburite at the end of
solidification. However, theory (e.g.. Figures 9, 10, and 12) indicates
that about 2.1 per cent carbon should be required to form ledeburite.
This descrepancy is probably related to the assumption made In calcula-
tions that the activity coefficient of carbon in the solid is indepen-
dent of chromium content. The assumption appears to be excellent for
low carbon alloys but to introduce significant error for carbon contents
of 1.5 per cent or greater. Introduction of a chromium's effect on
carbon's activity coefficient would result in lower predicted carbon
23 levels for ledeburite formation, in agreement with experiment .

51
II. SUMMARY AND CONCLUSIONS
1. An analytical and experimental study has bef.n made of solute
redistribution in dendritic solidification of ternary iron-carbon-
chromium alloys. Three possible cases of solidification were
considered; all assumed uniform concentrations of carbon and
chromium in the interdendritic liquid, and equilibrium at the
solid-liquid interface. Case 1 assumed complete diffusion of both
carbon and chromium in the solid; Case 2 assumed no diffusion of
either carbon or chromium in the solid; Case 3 solidification
assumed no diffusion of chromium and complete diffusion of carbon
in the solid.
2. Estimates of the extent of diffusion for carbon and chromium showed
Case 3 to be the best of the three models for iron-1.5 per cent
chromium with carbon contents between 0.96 per cent and 3.00 per
cent.
3. Microprobe analyses were carried out to determine "Segregation
Ratio", S, of chromium, and data from the literature were compiled
which include segregation ratios of common alloying elements in
medium carbon, low alloy steel.
4. An alternate measure of microsegregation in the "Segregation Ratio"
was introduced. This parameter, o , is termed "Composition Devia-
tion Index" and is obtained by simple calculation from results of
statistically long, random microprobe scans.

52
5. Advantages of describing microsegregatlon by a rather than S
Include:
(a) o is readily measured experimentally, and for many alloys
(e.g., solid solutions) It is expected that measurements of
o will be more reliable than those of S.
(b) o depends on all values of the concentration and not merely
the minimum and maximum.
(c) For certain alloys (e.g., complete solid solutions) small
amounts of diffusion in the solid may change S markedly, with
relatively little effect on o .
(d) o allows comparison of single phased and eutectic forming
alloys, and
(e) a is a parameter that can be introduced into formulations of
homogenlzation kinetics.
6. The Msolidification curves" (fraction solid as a function of
temperature) for iron-1.5 per cent chromium alloys containing car-
bon between 0.96 and 3.00 per cent have been calculations. Calcula-
tions for these alloys indicate that for carbon contents greater
than about 2.1 per cent carbon, ledeburite will form at the end of
solidification. Experimental results show that ledeburite forms in
those alloys containing about 1.5 per cent carbon and greater.
7. The concentration profiles (chromium composition versus volume
fraction of material) were calculated for three alloys of 1.5 per
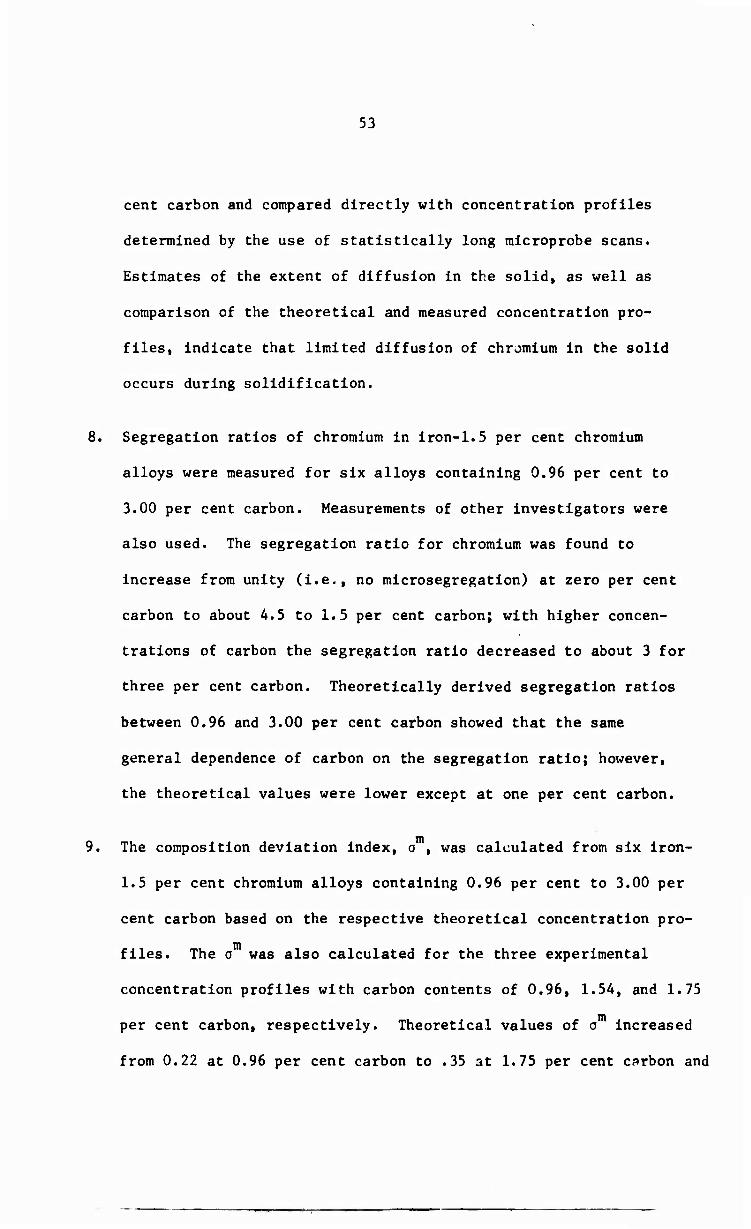
53
cent carbon and compared directly with concentration profiles
determined by the use of statistically long microprobe scans.
Estimates of the extent of diffusion in the solid, as well as
comparison of the theoretical and measured concentration pro-
files, indicate that limited diffusion of chromium in the solid
occurs during solidification.
8. Segregation ratios of chromium in lron-1.5 per cent chromium
alloys were measured for six alloys containing 0.96 per cent to
3.00 per cent carbon. Measurements of other investigators were
also used. The segregation ratio for chromium was found to
Increase from unity (i.e., no microsegregation) at zero per cent
carbon to about 4.5 to 1.5 per cent carbon; with higher concen-
trations of carbon the segregation ratio decreased to about 3 for
three per cent carbon. Theoretically derived segregation ratios
between 0.96 and 3.00 per cent carbon showed that the same
general dependence of carbon on the segregation ratio; however,
the theoretical values were lower except at one per cent carbon.
9. The composition deviation index, a , was calculated from six lron-
1.5 per cent chromium alloys containing 0.96 per cent to 3.00 per
cent carbon based on the respective theoretical concentration pro-
files. The a was also calculated for the three experimental
concentration profiles with carbon contents of 0.96, 1.54, and 1.75
per cent carbon, respectively. Theoretical values of o increased
from 0.22 at 0.96 per cent carbon to .35 at 1.75 per cent csrbon and

54
then decreased to .16 at 3.00 per cent carbon. The three
experimental values were somewhat lower (15 to 30 per cent
lower) because of limited diffusion of chromium in the solid.
10. Fundamental to the study of mlcrosegregation Is knowledge of
the equilibria between liquid and solid. For this reason the
study of solidification was preceded by the determination of
the austenite-liquidus equilibria for the iron-carbon-chromlum
system. Results of this study include:
(a) The gamma-liquidus surface was determined for iron-carbon-
chromium alloys containing up to twenty per cent chromium.
(b) An experimental method was devised to measure the solid-
liquid equilibria partition ratio in a ternary system. The
method should be applicable to measure the equilibria of
any element in multi-component systems that can be measured
with a microprobe analyzer. Specifically» the partition
ratio was measured for chromium in iron-carbon-chromlum alloys
between austenite and liquid iron.
(c) Using data from the literature concerning the thermodynamics
of the iron-carbon-chromlum system, and the chromium equili-
brium measurements between austenite and liquid, the activities
of carbon, chromium, and iron were determined as functions of
composition and temperature for both liquid and austenite.

55
(d) The austenlte solidus surface was determined based on the
thermodynamlc study. A presentation for ternary systems
was devised to represent two-phase equilibria other than
the customary manner of presenting a series of isotherms
with tie lines.

56
BIBLIOGRAPHY
1. "investigation of Solidification of High Strength Steel Castings", M,I.T., Interim Report, Contract No, DA-19-020-ORD-5443(X), Army Materials Research Agency, October 1963.
2. R. V- Barone, H. D, Brody, M. C. Flemings, "Investigation of Solidification of High-Strength Steel Castings", M.I.T., Interim Report, Contract No DA-19-020-ORD-5443(X), Army Materials Research Agency, 30 September 1964.
3. To Z- Kactamis, M- C Flemings, "Dendrite Morphology, Microsegrega- tion and Homogenization of Low Alloy Steels", Trans. A I.M.E., V. 233, 1965, pp. 992-999.
4. F. C. Quigley, P. J. Ahearn, "Homogenlzation of Steel Castings at 2500^", Trans. A.F.S., V. 72, 1964, pp. 813-817,
5. T. B. Smith, J, S Thomas, R. Goodall, "Banding in a 1-1/2% Nickel- Chromium-Molybdenum Steel", J-I S-I-, V. 209, 1963, p. 602.
6. J. Philibert, H. Bizouard, "Quelques Nouvelles Applications de la Microsonde Electronique de Castaing et leur Importance Practique", Memoires Scientifiques de la Revue de Metallurgie, V. 46, 1959, p. 187.
7- C, Crussard, A, Kohn, C. de Beaulieu, J. Philibert, "Etude de la Segregation de l'As et du Cu Paria Technique Autoradiographique et Examen Quantitatif a la Microsconde de Castaing", Rev. Met., V. 56, 1959, p. 395.
8. W. Steven, D. R. Thomeycroft, "Variations of Transformation Characteristics Within Samples of an Alloy Steel", J.I.S.I., V. 187, 1957, p. 15.
9. P. M. Zhurenkov, I. N. Golikov, "Dendritic Liquation of Alloyed Elements in Structural Steels", Metal Sei. Heat Treat Metals, No. 5-6, 1964, p. 293,
10. P. J, Ahearn, F- C. Quigley, "Mass Effect and Microsegregation in a High-Strength Steel Casting", Modern Castings, V. 47, 1964, p. 435.
11. C- de Beaulieu, J. Philibert, "Etude Quantitative de l'heterogenelte Dendrltique dans les Alliages de Fer", Comptes Rendus, V. 246, 1958, p. 3615.
12. D. A, Colling, P. J, Ahearn, M. C. Flemings, "Effect of Solidification Variables on Mechanical Properties of Cast Steel", Trans. A.F.S., V, 70, 1962, p. 1083.

57
13. J. Philibert, E. Weinryb, M. Ancey, "A Quantitative Study of Dendritic Segregation in Iron-Base Alloys with the Electron Probe Microanalyzer", Metallurgia, November 1965, p. 203.
14. R. 0. Melford, D. A. Doherty, "A Study of Solidification and Microse- gration in Killed Steel Ingots with Particular Reference to 1% C, 1.5% Cr Steel", Tube Investments Research Laboratories, Technical Report No. 201, January 1966.
15. D. R. Poirier, R. F. Polich, M. C. Flemings, "Development of Superior Steels for Precision Gyro Spin Bearings", M.I.T., Contract No. AF 33(615)-1030, Wright-Patterson Air Force Base, Ohio, 1964.
16. H. D, Brody, M. C. Flemings, "Solute Redistribution in Dendritic Solidification", Trans. A.I.M.E., V. 236, 1966, p. 615.
17. T. F. Bower, H. D. Brody, M. C. Flemings, "Measurements of Solute Redistribution in Dendritic Solidification", Trans. A.I.M.E., V. 236, 1966, p. 624.
18. M. C. Flemings, "Microsegregation in Castings and Ingots", Hoyt Memorial Lecture of American Foundrymen's Society, Atlantic City, New Jersey, presented May 1964.
19. A. B. Michael and M. B. Bever, "Solidification of Aluminum-Rich Aluminum-Copper Alloys", Trans. A.I.M.E., V. 200, 1954, p. 47.
20. J. E. Milliard, J. W. Cahn, "An Evaluation of Procedures in Quantitative Metallography for Volume-Fraction Analysis", Trans. A.I.M.E.. V. 221, 1961, p. 344.
21. C. Wells, R. F. Mehl, "Rate of Diffusion of Carbon in Austenite in Plain Carbon, in Nickel and in Manganese Steels", Trans. A.I.M.E., V. 140, 1940, p. 279.
22. N. L. Peterson, "Diffusion in Refractory Metals", WADD Technical Report 60-793 (AMR-1107), 1960, p. 117.
23. D. R. Poirier, "Microsegregation in Ternary Iron-Carbon-Chromium Alloys", Sc.D. Thesis, M.I.T., 1966.
24. C. Austin, "Alloys in the Ternary System Fe-Cr-C", J.I.S.I., V. 108, 1923, p. 235.
25. A. B. Kinzel, W. Crafts, The Alloys of Iron and Chromium. McGraw- Hill, New York, 1937, p. 65. '
26. N. R. Griffing, W. D. Forgeng, G. W. Healy, "C-Cr-Fe Liquidus Surface", Trans. A.I.M.E., V. 224, 1962, p. 148.

58
27. M. G. Benz, J, F. Elliott, "The Austenice Solidus and Revised Iron- Carbon Diagram", Trans. A.I.M.E., V. 221, p. 323.
28. F. Adcock, "The Chromium-Iron Constitutional Phase Diagram", J.I.S.I., V. 125, 1931, p. 99.
29. A. Rist, J. Chipman, "Activity of Carbon in Liquid Iron-Carbon Solutions", The Physical Chemistry of Steelmaking, Technology Press and John Wiley, New York, 1958, p. 3.
30. F. D. Richardson, W. E. Dennis, "Thermodynamic Study of Dilute Solutions of Carbon in Molten Iron", Trans. Faraday Soc., V. 49, 1953, p. 171.
31. R. P. Smith, "Equilibrium of Iron-Carbon Alloys with Mixtures of CO-CO2 and CH4-H2", J.A.C.S., V, 68, 1946, p, 1163.
32. H. Schenck, H. Kaiser, "Untersuchungen über die Aktivität des Kohlenstoffs in kristallisierten binaren und ternaren Eisen- Kohlenstoff-Legierungen", Archiv für das Eisenhuttenwesen, V. 31, 1960, p. 227
33. E. Scheil, T. Schmid", J. Wunning, "Ermittlung der Gleichgewichte von Kohlenoxyd-Kohlensaure-Gemischen mit dem Y-Mischkristall, mit Zementit und mit Graphit", Archiv, fur das Eisenhuttenwesen, V. 32, 1961, p. 1-
34. K. Bundgardt, H Preisendanz, G- Lehnert, "Einfluss von Chrom auf den Aktivitatsverlauf von Kohlenstoff im System Eisen-Chrom- Kohlenstoff bei 1000 C", Archiv fur das Eisenhuttenwesen, V. 35, 1964, p. 1.
35. J. S. Kirkaldy, G- R- Purdy, "The Thermodynamics of Dilute Ternary Austenite Solutions", Canadian J. of Physics, V, 40, 1962, p. 202.
36. T. Fuwa, J. Chipman, "Activity of Carbon in Liquid-Iron Alloys", Trans, A-I.M.E., V. 215, 1959, p 708
37. F. D. Richardson, W. E- Dennis, "Effect of Chromium on the Thermo- dynamic Activity of Carbon in Liquid Iron", J.I.S.I., V. 175, 1953, p. 257,
38. K. Goto, S, Ban-ya, S. Matoba, "Activity of Carbon and Oxygen in Molten Iron-Nickel and Iron-Chromium Alloys", Tetsu to Hagana, V. 49, 1963, p, 138-
39. M. Ohtani, "On the Activities of Cr and C in Molten Fe-Cr-C Alloys", Tetsu to Hagane, V. 42, 1956, p 1095.
40. S. Ban-ya, S. Matoba, "The Effect of Si, Cr and Mn on the Equilibrium of Carbon and Oxygen in Molten Iron Saturated with Carbon (II)", Technology Reports, Tohoku University, V- 22, 1957, p. 97.

59
41. J. S. Kirkaldy, R. J. Brigham, "The Interaction Parameter for Solutions of Carbon and Chromium in Austenite at 1000oC, Trans. A.I.M.E., V. 227, 1963, p. 538.
42. L. C. Brown, J. S. Kirkaldy, "Carbon Diffusion in Dilute Ternary Austenites", Trans. A.I.M.E., V. 230, 1964, p. 223.
43. C. Wagner, Thermodynamics of Alloys, Addison-Wesley, Reading, Massachusetts, 1952, p. 18.
44. Y. Jeannin, C. Mannerskantz, F. D. Richardson, "Activities in Iron-Chromium Alloys", Trans. A.I.M.E., V. 227, 1963, p. 300.
45. 0, Kubaschewski, G. Heymer, Acta Met., V. 8, 1960, p. 416.
46. T. 0. Ziebold, R. E. Ogilvie, "An Empirical Method for Electron Microanalysis", Anal. Chem., V. 36, 1964, p. 322.
60
APPENDIX A
LIQUID-AUSTENITE EQUILIBRIA FOR THE IRON-CARBON-CHROMIUM SYSTEM
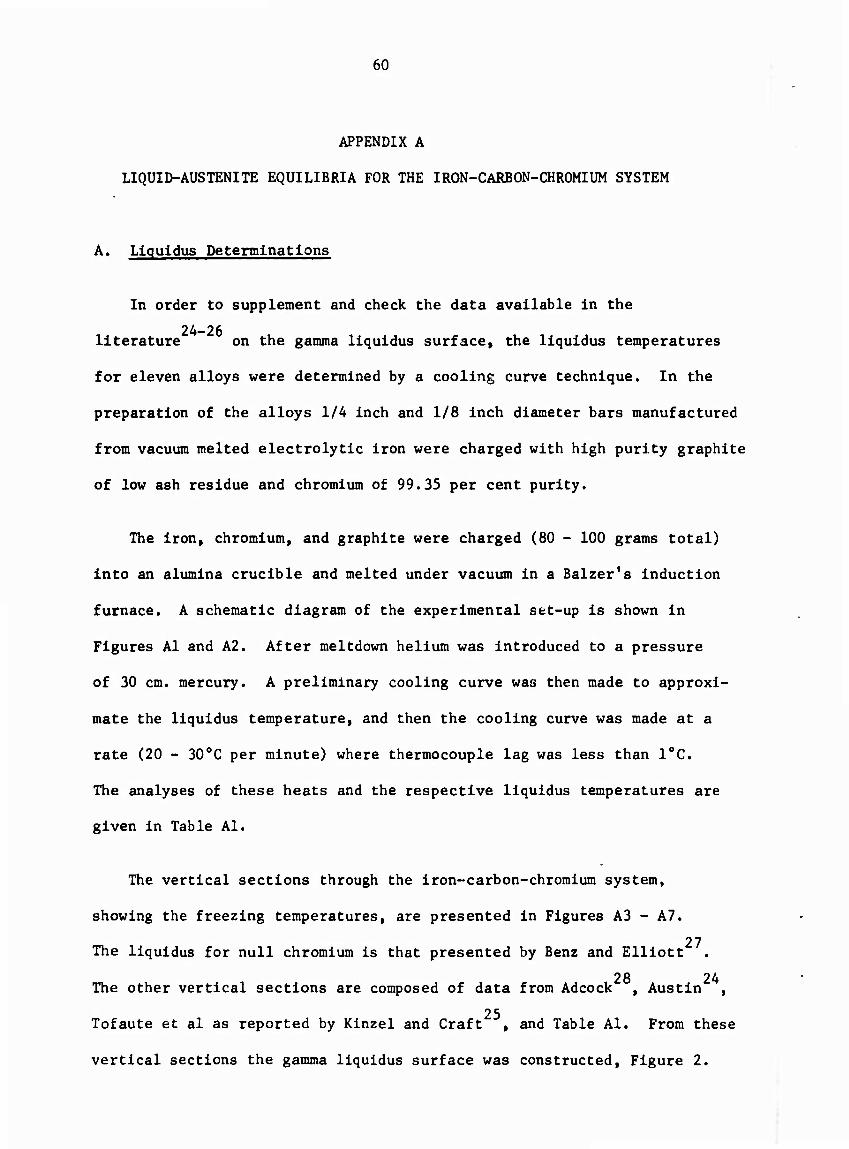
A. Llquidus Determinations
In order to supplement and check the data available In the
literature on the gamma llquidus surface, the llquidus temperatures
for eleven alloys were determined by a cooling curve technique. In the
preparation of the alloys 1/4 inch and 1/8 inch diameter bars manufactured
from vacuum melted electrolytic iron were charged with high purity graphite
of low ash residue and chromium of 99.35 per cent purity.
The iron, chromium, and graphite were charged (80 - 100 grams total)
Into an alumina crucible and melted under vacuum in a Balzer's induction
furnace. A schematic diagram of the experimental set-up is shown In
Figures Al and A2. After meltdown helium was Introduced to a pressure
of 30 cm. mercury. A preliminary cooling curve was then made to approxi-
mate the llquidus temperature, and then the cooling curve was made at a
rate (20 - 30oC per minute) where thermocouple lag was less than 10C.
The analyses of these heats and the respective llquidus temperatures are
given in Table Al.
The vertical sections through the iron-carbon-chromium system,
showing the freezing temperatures, are presented in Figures A3 - A7.
27 The llquidus for null chromium is that presented by Benz and Elliott
28 24 The other vertical sections are composed of data from Adcock , Austin ,
25 Tofaute et al as reported by Kinzel and Craft , and Table Al. From these
vertical sections the gamma llquidus surface was constructed. Figure 2.

61
The positions of the eutectlc valleys and the gamma-delta joint are
26 from Figures A3 - A7 and approximately correspond to Griffing et al .
The dip in some of the isotherms at approximately 16 per cent chromium
2fi is real although not indicated by Griffing et al .
B. Solidus Determinations
Two similar techniques were employed for the determination of the
solid chromium concentration in equilibrium with liquid iron-carbon-
chromium alloys using the apparatus depicted in Figure A8. The first
method involved the insertion of a pure iron-bar into the melt held at
a constant temperature above its liquidus. An interface, with the
equilibrium partition of chromium, can be established at any position
without the collapse of the liquid column by containing the iron rod
within an alumina tube and applying a vacuum to its free end, as depicted
in Figure A8. At the end of a run the alumina tube with its contents
was withdrawn from the melt; the liquid remaining in the bottom of the
tube solidified dendritically fast. Subsequent sectioning and metallo-
graphic preparation showed the interface, and the samples were micro-
analyzed to determine the concentration of chromium in the solid in
equilibrium with the liquid alloys. The liquid concentration was
determined by chemically analyzing the remaining solidified ingot.
The second method employed the same apparatus with the exception
that no iron rod was irr/mersed. Instead, the alloy was cooled to some
temperature between its liquidus and solidus. The temperature of the
solid-liquid ingot was held constant for a period of time and then cooled
by shutting off the power and immersing an iron rod, 1/A inch diameter.
62
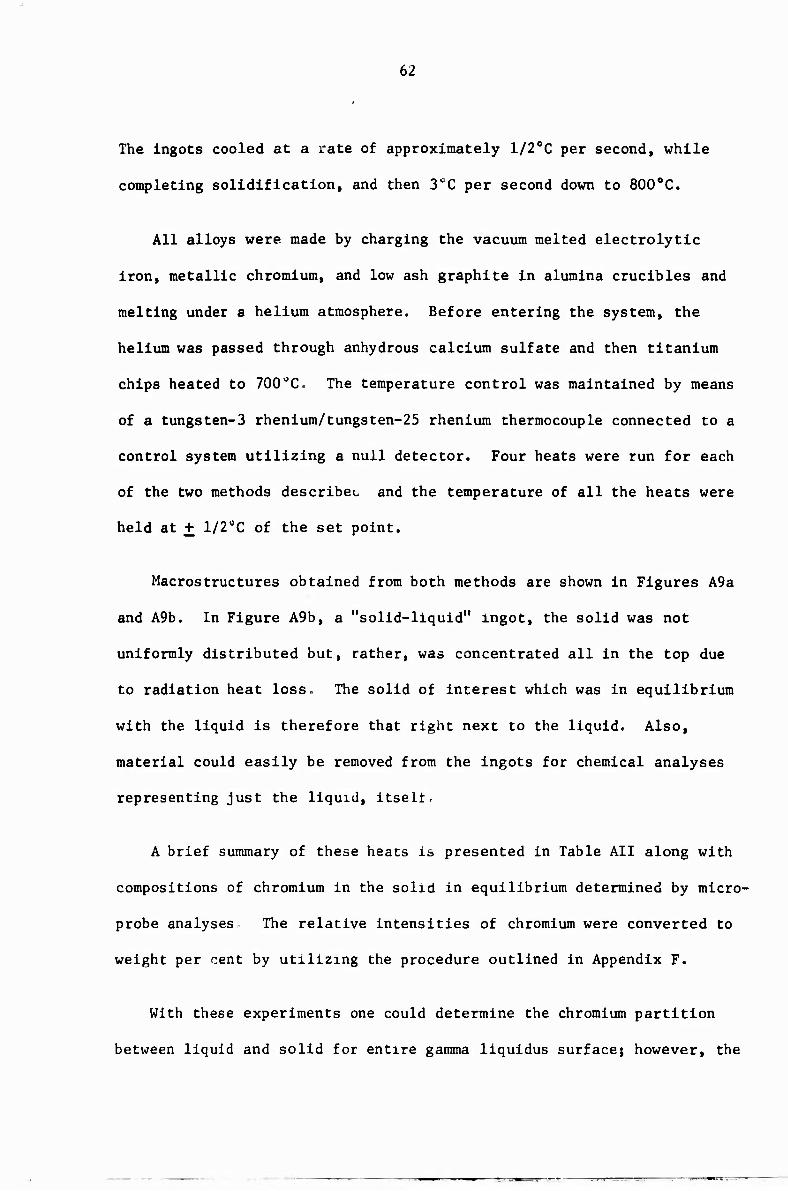
The ingots cooled at a rate of approximately 1/20C per second, while
completing solidification, and then 30C per second down to 800oC.
All alloys were made by charging the vacuum melted electrolytic
iron, metallic chromium, and low ash graphite in alumina crucibles and
melting under a helium atmosphere. Before entering the system, the
helium was passed through anhydrous calcium sulfate and then titanium
chips heated to 700"C. The temperature control was maintained by means
of a tungsten-3 rhenium/tungsten-25 rhenium thermocouple connected to a
control system utilizing a null detector. Four heats were run for each
of the two methods describee and the temperature of all the heats were
held at + 1/20C of the set point.
Macrostructures obtained from both methods are shown in Figures A9a
and A9b. In Figure A9b, a "solid-liquid" ingot, the solid was not
uniformly distributed but, rather, was concentrated all in the top due
to radiation heat loss- The solid of interest which was in equilibrium
with the liquid is therefore that right next to the liquide Also,
material could easily be removed from the ingots for chemical analyses
representing just the liquid, itselt.
A brief summary of these heats is presented in Table All along with
compositions of chromium in the solid in equilibrium determined by micro-
probe analyses The relative intensities of chromium were converted to
weight per cent by utilizing the procedure outlined in Appendix F.
With these experiments one could determine the chromium partition
between liquid and solid for entire gamma liquidus surface; however, the

63
equilibrium carbon concentrations can not be determined. A thermodynamlc
analysis of the iron-carbon-chromium system is then evident in order to
reduce the experimental work to a practical limit.
The solidus surface presented in Figure 3 was developed by such an
analysis. The treatment relies upon the activity data of carbon in iron-
carbon austenite, iron-carbon liquid, and the effect of chromium on the
activity of carbon on both phases, as well as the thermodynamics of the
iron-chromium system. Using this data, the results of the austenite-
liquid chromium equilibria, and aiplying Gibbs-Duhem relations for ternary
systems, the activities of all three components is analytically described.
The following sections give this thermodynamlc analysis leading to the
construction of the solidus surface.

6A
to recorder
thermocouple (Pt/Pt-IORh)
induction coil
graphite susceptor
AI2O3 crucible
(I'/e" I.D.)
specimen
raphite plug
Figure Al: Assembly used for cooling curves of small melts.
65
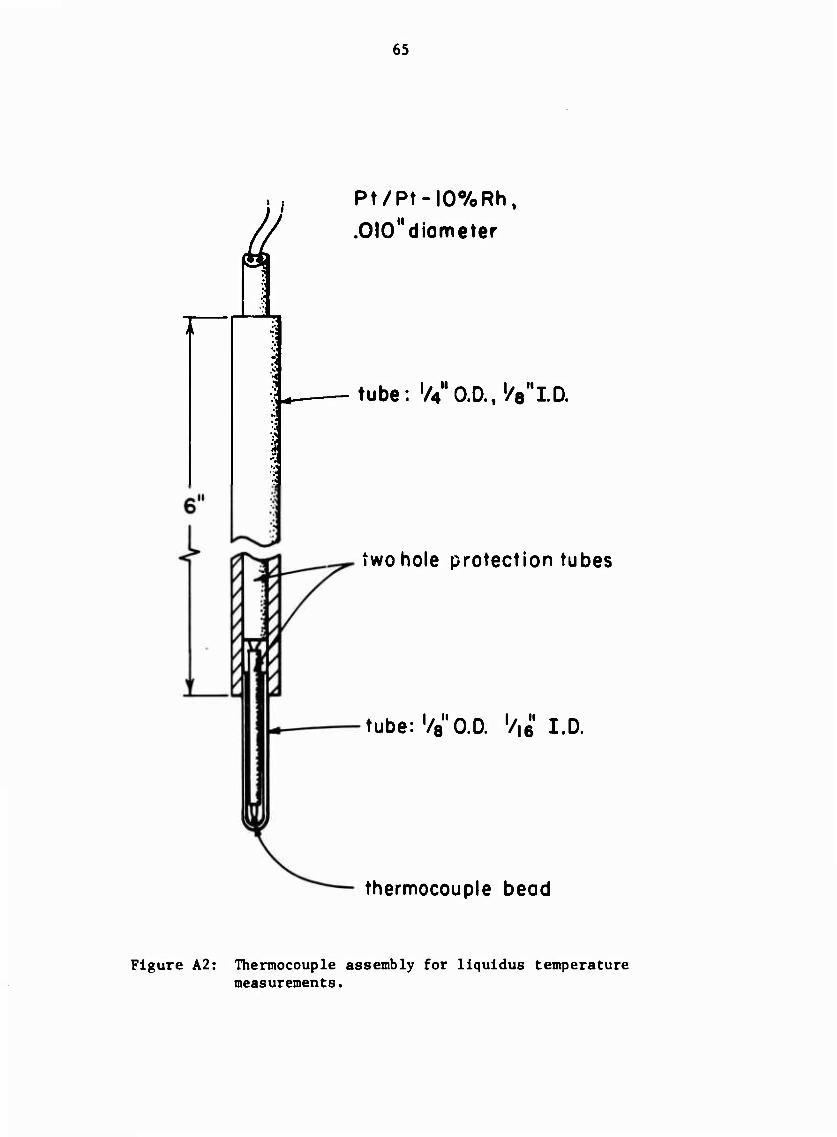
a Pt/Pt-IO%Rh,
.OIOMdiameter
tube: '//O.D.^Vl.D.
two hole protection tubes
1/'• tube: '/e O.D. 7|6 I.D.
thermocouple bead
Figure A2: Thermocouple assembly for liquidus temperature measurements.

66
1100 2 3
PERCENT CARBON
Figure A3: The llquidus at zero per cent chromium 27

67
1500
1400
3
^1300
1200
1100
o o
i 7 4
Adcock Austin' XCr/XFe XCr/XFe XCr/XFe
XCr/XFe .0542 .0457 .0432
.0526
%Cr/ZFe - .0335
I 2 PERCENT CARBON
Figure A4: The liquidus at a chromium-iron ratio of .053.
68
1500-
o 1400 e
UJ K
»-
p; 1300 ÜJ Q.
UJ
1200
1100
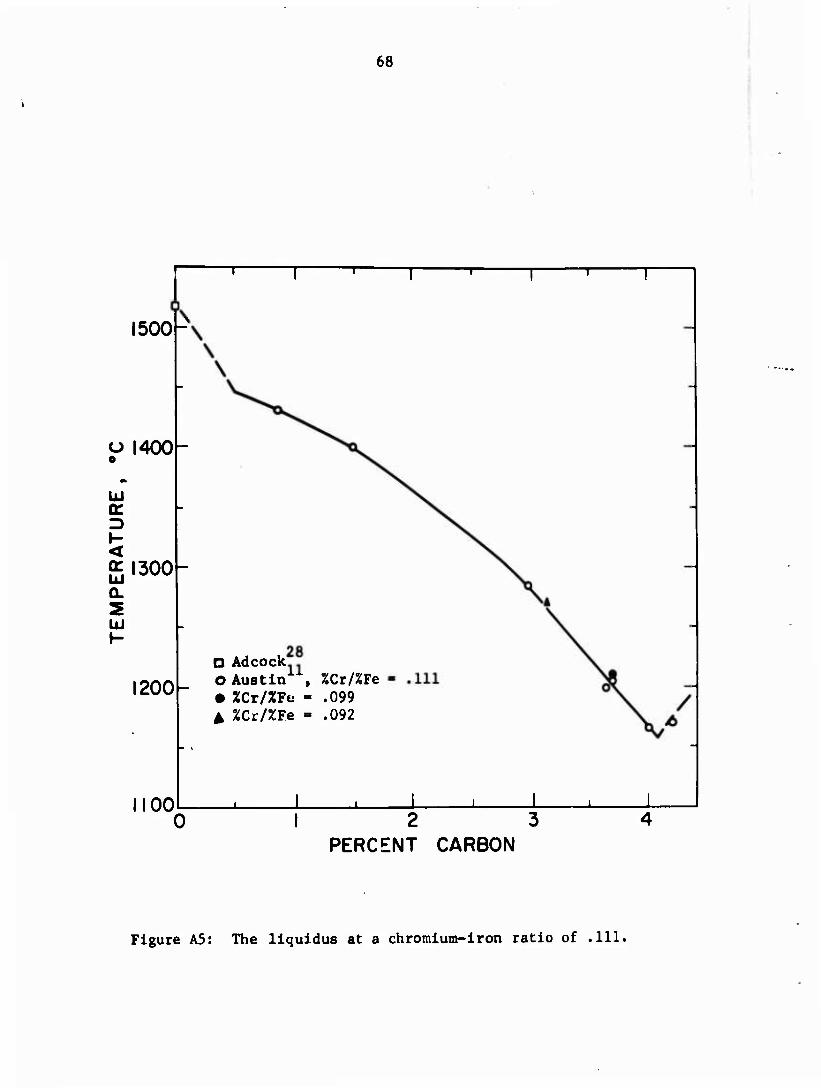
D Adcock ©Austin", %Cr/%Fe • %Cr/%Fe - .099 A %Cr/ZFe - .092
2 3 PERCENT CARBON
Figure A5: The liquidus at a chromium-iron ratio of .111.

69
0J40C|- UJ IE
I- < QC UJ Q! 1300
UJ
1200
1100
D Adcock O Austin"*, %Cr/%Fe - .176 A Tosaute at al (reported by Kinzel
and Crafts) XCr/XYe - .176
1 1 2 3
PERCENT CARBON
Figure A6: The liquidus at a chromium-iron ratio of .176.

70
I 2 3 PERCENT CARBON
Figure A7: Tne liquldus at a chromium-iron ratio of .250.

71
o o o o o o o o o o
Al203 tube
pure iron rod, '/s'D.
helium atmosphere
Vycor tube,64mmO.D.
induction coil
alloy melt
alundum tube
AI2O3 crucible I'/e'O.D. x I'/g" long
graphite susceptor
thermocouple
{W-3Re/W-25Re)
Figure A8: Schematic diagram of apparatus use-' for austenite-liquid equilibria of chromium.

72
la)
(b)
Figure A9: Macrophotographs of austenite-liquid chromium equilibria specimens.
(a) heat number 8, 4X. (b) heat number 12, 4X.

Heat
73
TABLE AI
ANALYSES OF HEATS FOR LIQUIDUS TEMPERATURES
% c % Cr % Cr/% Fe Liquidus
Temperature, 0C
3.26 4.23 .0457 1270
3.08 4.01 .0432 1280
2.82 3.15 .0335 1318
3.13 8.16 .0920 1270
5a .75 5.09 .0541 1463
b 1.62 5.02 .0538 1396
c 2.02 5.08 .0547 1366
d 2.45 4.87 .0525 1331
e 3.05 5.01 .0545 1279
f 3.61 4.96 .0542 1230
g 4.03 4.91 .0539 1174
.0542 Avg.

74
TABLE All
AUSTENITE-HQUID EQUILIBRIA OF CHROMIUM IN Fe-C-Cr ALLOYS
Heat Number
Time of Run, Hrs.
Set-Point Temperature, 0C
Liquid Composition
% C % Cr
Solid Corooosition
% Cr
Interface Heats
6 3 1430 1.64 1.85 1.37
7 2 1412 2.08 2.52 1.68
8 2-3/4 1340 2.46 3.02 2.19
9 3 1300 2.86 4.25 3.50
Solid-Liquid Heats
10 2-3/4 1270 3.26 4.23 2.54
11 3/4 1450 1.25 1.60 .99
12 2-1/2 1270 3.13 8.16 5.74
13 3 1320 2.62 4.32 3.08

75
APPENDIX B
ACTIVITY OF CARBON IN AUSTENITIC AND LIQUID IRON-CARBON SOLUTIONS
A. Introduction
1. Liquid Solutions.
The activity of carbon in iron-carbon liquid solutions has been given
29 by Rist and Chipman based on their own data and on work of Richardson
30 and Dennis . The activity coefficient in their analysis was assumed to
obey the relation:
log Y1 - ot(l - xp + I (Bl)
where Y1 = activity coefficient of carbon
X1 = atom fraction of carbon
I = factor depending on choice of standard state
and» a - - ^—^ [1 + .0004 (T - 1770)] (B2)
The standard state chosen for this analysis is graphite. Thus
I - - a(l - xp2 - log X° (B3)
where X° = saturation atom fraction of carbon in binary
liquid iron-carbon solutions
27 From Elliott and Benz's review of the iron-carbon phase diagram:
X° = 0.0462 + 8.785 x 10"5 T (B4)
76
2. Austenlte Solutions.
Figure Bl shows the activity of carbon In Iron-carbon austenlte, as
31 32 33 determined by Smith , Schenck and Kaiser , Schell et al , and
3A Bungardt et al . It Is the purpose of the following argument to des-
cribe the activity of carbon In austenlte as a function of carbon con-
centration and temperature including temperatures above which data of
Figure Bl apply, by use of the accurate austenite-llquld phase equilibria
27 of Elliott and Benz .
B. Thermodynamic Model for Austenlte
35 Kirkaldy and Purdy have presented a model based on nearest-
neighbor Interactions with regular behavior for austenlte. With this
model the activity of carbon in austenlte can be given by:
a X RTln [ "^ (1 - 2X1) ] = Ao + Ai ( i - x ) (B5)
where a1 ■ activity of carbon
An, A1 ■ coefficients that are functions of temperature
and assumed independent of composition
The functional relationship between the activity of carbon and the
concentration of carbon, as indicated by equation (B5), fits the data
31 very well. An example is shown in Figure B2 where the data of Smith
at 1000oC have been plotted and the "least-squares" line drawn. All the
data of the various investigators likewise follow the form of equation
(B5). However, when the "least-squares" lines are compared for all four
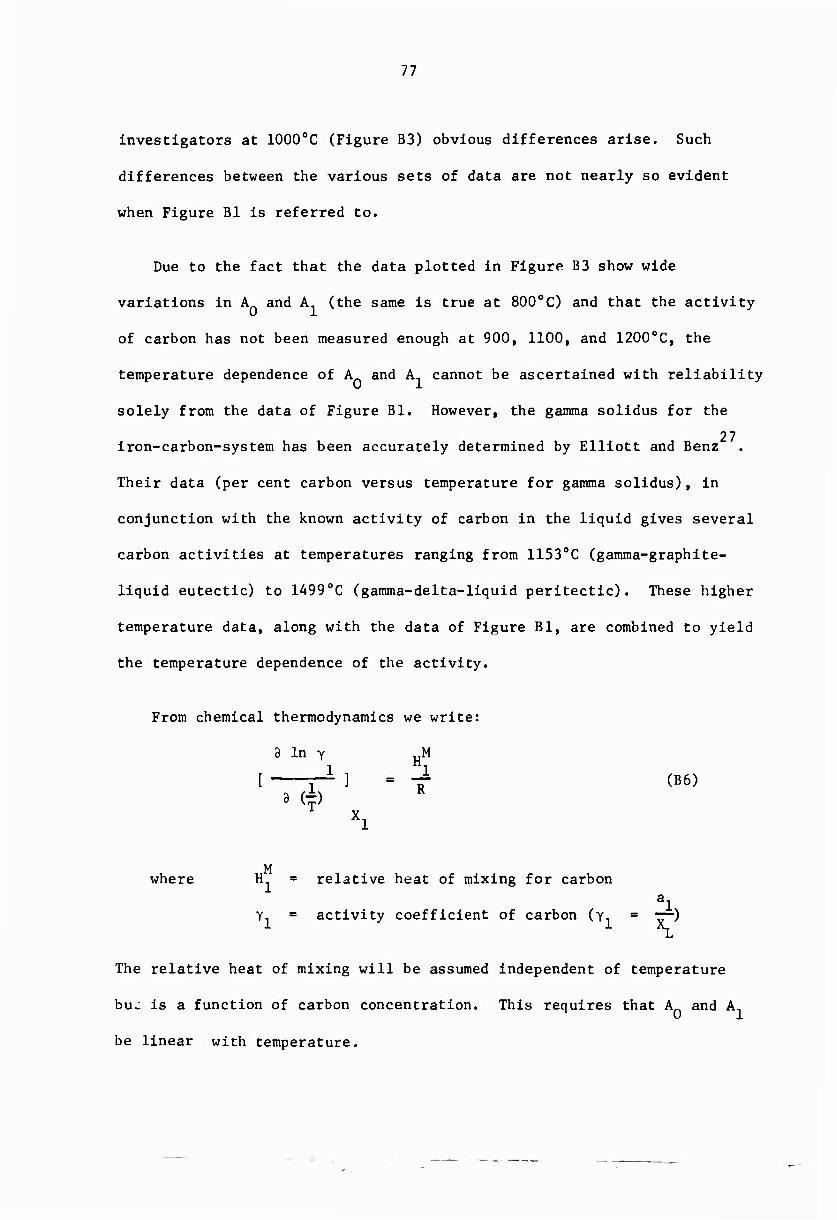
77
investigators at 1000oC (Figure B3) obvious differences arise. Such
differences between the various sets of data are not nearly so evident
when Figure Bl is referred to.
Due to the fact that the data plotted in Figure 33 show wide
variations in A and A (the same is true at 800oC) and that the activity
of carbon has not been measured enough at 900, 1100, and 1200oC, the
temperature dependence of A and A., cannot be ascertained with reliability
solely from the data of Figure Bl. However, the gamma solidus for the
27 iron-carbon-system has been accurately determined by Elliott and Benz
Their data (per cent carbon versus temperature for gamma solidus), in
conjunction with the known activity of carbon in the liquid gives several
carbon activities at temperatures ranging from 11530C (gamma-graphite-
liquid eutectic) to 1A990C (gamma-delta-liquid peritectic). These higher
temperature data, along with the data of Figure Bl, are combined to yield
the temperature dependence of the activity.
From chemical thermodynamics we write:
8 In Y uM
1 1 [ — ] = T (B6)
8 (h R
Xl
M where H. = relative heat of mixing for carbon
al Y1 = activity coefficient of carbon (y, = ~) 1 1 h
The relative heat of mixing will be assumed independent of temperature
hu- is a function of carbon concentration. This requires that A and A,
be linear with temperature.

and
78
A0 - H + bT (B7)
Aj^ = G + cT (B8)
The four constants (H, G, b and c) are evaluated to best fit the
data to Figure Bl along with the data taken from the gamma solidus in
the following manner- Substituting equations (B7) and (B8) into equa-
tion (B5) yields:
a XX Rln [^ (1 - 2X^1 = | [H + G (1 ^ )] + [b + c ^ ^ )]
(B9)
al Thus for a fixed carbon concentration, a plot of Rln [— (1 - 2X1)]
i h
versus — should yield a straight line. Ten compositions along the entire
gamma solidus were selected. The activities for these compositions were
29 calculated from Rist and Chipman's relation (equations Bl - B3) applied
to the compositions of the liquid in equilibrium with the respective
austenlte compositions. From the thermodynamic model plots (such as
Figure B2) the values of the left side of equation (B9) were taken at
the carbon concentrations in question, i.e., X1/(l -X,). The plots were
then made for each composition and the "least-squares" line drawn.
Figure B4 shows two extremes of the compositions chosen. The agreement
of the low temperature data with the points calculated from the phase dia-
gram point shown for (X../1 -X,) equal to 0 1002 was the largest
encountered for all ten plots-

79
From these ten plots values of Rln [-r— (1 - 2X) ] were taken and Al
plotted versus X./Cl - X.) at constant reciprocal temperatures. These
plots are also straight lines:
Rln [ x1 (1 - 2X1) ] - (f+b) + (£+c)( YTY- ) (BIO)
u whose Intercepts ( *r + b ) and slopes (G/T -I- c) are shown In Figures B5
yielding these results:
H - 10,550 cal/mole
G - -5,125 cal/mole
b ■ -4.106 cal/mole-deg
c ■ 15.967 cal/mole-deg

80
^p
If)
" (0
o 4J
't CO Oil •H
0) rO g
■H
en
c^J 3 O
•H ^ 5
^__ >, — ^
TJ
c c •H O o
O 4-1
<r> O 01
i <T3
00 c o
0)
•H • w- r:
(S 3
^_ c .c •H
c^ CD o
5 ^ o
4-» ■H
^t. >
U TO
^9
cvJ • •
rc
(U >-< 3 ; 6Q
" uoqjOQ ^o AjiAipv

81
6600
6400 1-
6200 1-
r^—i
g 6000
^L
o:
58001—
5600f-
5400
5200
1 i i i i 1 1
ß
/
s
—
/ /
//o
—
0 y^ /
- —
$4 A
o . i l 1 1 1 \
01 .02 03 .04 X,/ p-x,]
05 06 07 08
Figure B2: Application of the thenaodynar.ic model. Data fron Smith31 at 1000oC.

82
6600
6400 -
6200 -
•-—'6000 x I
ii^.5800
5600 —
5400
5200-
03 .04 05 Xi/fl-X,]
Figure B3: The activity of carbon as depicted by tae tftermodynamic model applied at 1000oC.
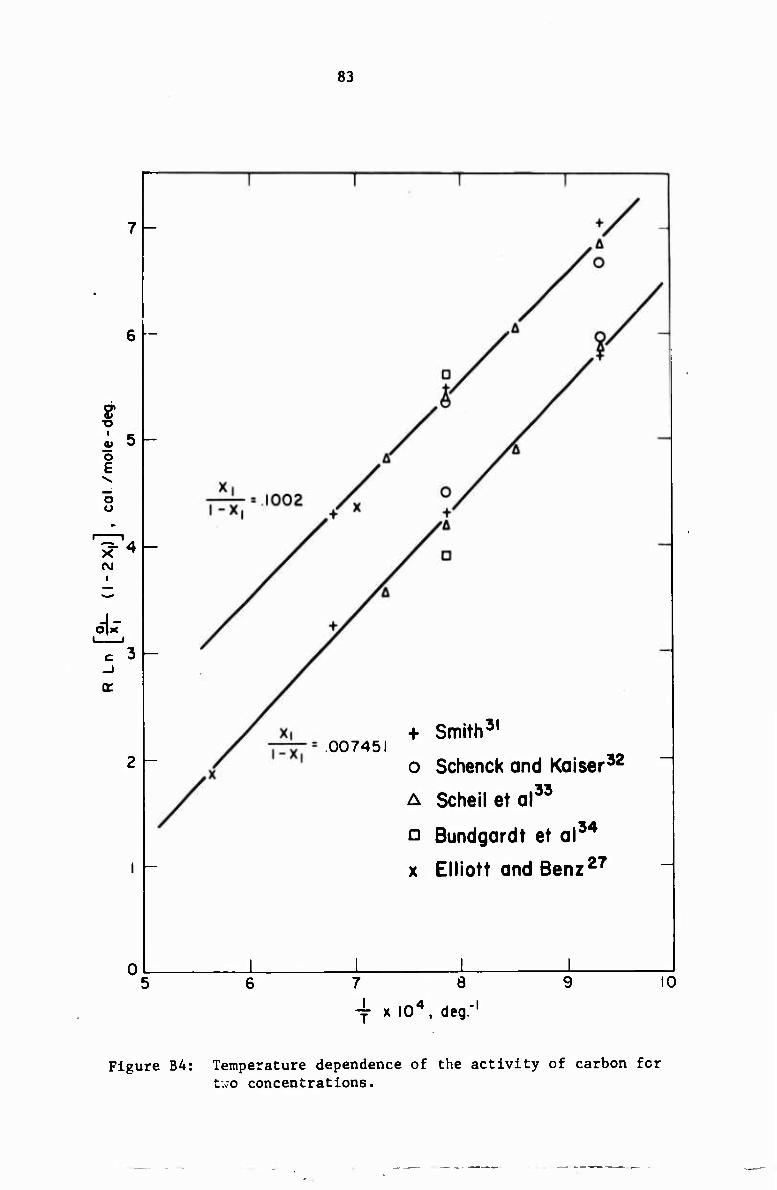
83
7 -
S1 ■o
; 5 o E
o o
•
=)-
.007451 + Smith31
o Schenck and Kaiser32
A Scheiletal33
a Bundgardt et al34
x Elliott and Benz27
7 8
-j x I04, deg."1 9 10
Figure B4: Temperature dependence of the activity of carbon for two concentrations.

84
O
x
-I»-
c
m
Ü
ac 03 •w C « w tn c o u u a o
c o
c •H
I 4J 01 Q
BQ
•69p-a|oui/-|oo • (a+-^)jo (q-l- -R-)

85
APPENDIX C
ACTIVITY OF CARBON IN LIQUID-IRON-CARBON CHROMIUM SOLUTIONS
A. Introduction
The activity of carbon in iron-carbon-chromium liquid solutions has
been measured by Richardson and Dennis , Fuwa and Chipman and Goto
38 36 et al . Fuwa and Chipman have presented their data along with data
37 of Richardson and Dennis and utilized an interaction parameter. How-
«
ever, the interaction parameter is only valid for dilute solutions of
carbon because, as they indicated, the same interaction parameter does
not apply to more concentrated solutions of carbon (i.e., the effect of
39 chromium on the saturation of graphite in liquid iron). Ohtani has
attempted to account for the effect of carbon concentration on the inter-
action parameter; however even his analysis does not apply to the satura-
tion data. Also, the effect of temperature on interaction parameters must
be taken into account. Therefore, in any process where the concentration
of carbon and/or the temperature changes over wide ranges (such as solidi-
fication) , the use of an interaction parameter is not adequate to know the
activity of carbon.
B. Empirical Relation for the Activity of Carbon
The purpose of the following argument is to make use of the existing
data on the effect of chromium on the activity of carbon in liquid iron
solutions in such a way that the activity can be described as a function
of both composition and temperature. The method is an extension of Rist

86
29 and Chipman's analysis for the binary iron-carbon solutions. As
in Rist and Chipman's analysis, the activity coefficient is assumed to
obey the relation:
log Y1 - at(l - X1)2 + It (Cl)
where, for the ternary solution a is a factor dependent on temperature
and chromium concentration, and
h ' -at(1-xis)2- losxis (c2)
where: X.- ■ saturation atom fraction of carbon which
depends on temperature and chromium concentration,
The saturation of carbon in iron melts containing chromium was
40 determined from the data of Ban-Ya and Matoba (1400oC to 1600oC) and
9 ft Griffing et al (16003C to 1800 C). These data are presented in
Figure Cl and by least-square analysis are found to obey the relation:
X1S = Xl ■," 0'2552 X2 (C3)
where: X.. = saturation of graphite in iron-carbon binary
melts
X„ ■ mole fraction of chromium.
C. Application of the Empirical Relation for the Experimental Data
37 The data of Richardson and Dennis (chromium contents up to 25 per
cent) are used exclusively to determine the factor a in equation (Cl).
Fuwa and Chipman's data are not used because they are limited to only
38 one activity and have wide scatter while the data of Goto et al yield

87
somewhat lower activities than Richardson and Dennis. Also, the
measurements of Richardson and Dennis were made at three temperatures
while those of the other workers are only at one temperature. Figure
37 C2 shows the data of Richardson and Dennis at 1660oC where equation
(Cl) is assumed to hold for a constant ratio of X„/X_ using saturation
points computed from equation (3). Similar plots were made at 1560oC
and 1760oC and all slopes, a , were determined by least-square analysis,
The effect of chromium on the activity of carbon is then shown in
Figure C3, where
X2 T (ot - a) - -4880 ( ~ ) (C4)
With these results we summarize this section:
The activity of coefficient carbon in iron-carbon-chromium melts
is given by:
log Y1 - at(l - X^2 + It (Cl)
at - .^(^j.^o [1+>0004(T.177O)] (c4)
lt " -at(1 " X1S)2 " l08 X1S (C2)
X1S = 0-0462 + 8-785 x 10'5T + 0-2552 x2 (c3)

88
to
(Si fO
00 CJ
CM X
E 3
c o
3 cr
•H
01
o •H
c
N c 0)
E (X
o o to u
Od £ bL i-H to * o u-l
o 0)
c c o o Of
•H c 10 «- iJ ■H
Ü 03 14-1 ^— ^ 14-1 * o 3 •H k> 4J li li. to
«3 o
E 0) a
cvJ o 4J ■♦- • < c o
o to
E ^3 3 o
•H 4J E to
00 q
o -a
U c to
U-l O to
4J 1
<t u 01
c to o kM PQ
O 00 (X) <T CVJ o fO CVJ CVJ CVJ CVJ CVJ
00
w
U 0)
3 öt
s,XtuoqjDO uojioojj luo^v

89
o
.30
.3
.2
.1
0
.1
.2
.3
.4
.5
.6
.7 —
.8 -
.9
"Saturation Points
x2/x3s.ll25
X2/X3 - 3435
.5 .7 .8
(l-x,)1
Figure C2: Activity coefficient of carbon in liquid iron at 1660oC for different chromium concentrations. Saturation points from equation (C3) and remaining points from Richardson and Dennis-*'.

90
o o
-200 -
-400 -
-600
-800
000
-I 200
-I 4001-
1 600
■1800
2 000
h-
t I8330K \ ^
— o I9330K
A 2033oK N 1 1 1 1 1 1
+1
i i i 0 04 .08 .12 .16 .20 .24 .28 .32 .36
x2/x3
Figure C3: Effect of chromium on the parameter, at, in liquid iron-carbon-chronium alloys.

91
APPENDIX D
ACTIVITY OF CARBON, CHROMIUM, AND IRON IN AUSTENITIC AND LIQUID SOLUTIONS
A. Introduction
The quasi-chemical model as described and used for the activity of
carbon in binary iron-carbon austenite is also utilized herein.
Extending this analysis for a ternary austenite yields:
a XX RTln[~ (1 - 2X1)] = Ao + Ai (T~rV) + A2 (1 "A ) (D1)
Just as A» and A. were shown to be linear functions of temperature in
Appendix B, A» is also a linear tunction of temperature and is likewise
assumed to be independent of composition.
One purpose of this section is to determine A„, and then the effect
of chromium on the activity of carbon in austenite can be described.
The available data in the literature are limited to a small temperature
range, 950° to IGSO'C. To supplement this the data of the literature,
experimentally measured chromium distributions between liquid alloys and
austenite are used to evaluate A9 at higher temperatures.
B. Data from Literature for the Activity of Carbon in Iron-Carbon- Chromium Austenite
The activity of carbon in iron-carbon-chromium austenite has been
41 32 measured by Kirkaldy and Brigham ' (1000oC), Schenck and Kaiser
(950, 1000, and 1050oC), and Bundgardt et al34 (1000oC). All theso
investigators measured the activity by the use of CO-CO» or CH.-K_

92
42 gas mixtures. In addition Kirkaldy and Brown have made measurements
at 1050oC by a "transient equilibrium" method-
For the determinations involving the use of gas mixtures the
data for each investigator were reduced in a manner such that
A»(X-/1-X ) could be calculated using equation (Dl). The values of
Ap. and A1 chosen were those determined from the binary system for the
particular investigator, i e., Bundgardt ec ai's data were referred
to their own particular carbon activities in binary austenite; the same
was true for Schenck et al- Kirkaldy and Brigham's data referred to
Smith's activity of carbon in binary austenite because they reported
using the same experimental method Fhe different binary reference
levels for the various investigators were used in order to isolate
the effect of chromium, alone, that they measured.
C. Evaluation of the Experimental Distributions Between Liquid Alloys and Austenite
The experiments used to determine the chromium distribution between
the liquid alloys and austenite yielded the temperature, composition of
both carbon and chromium in the liquid, but only the composition of
chromium in the solid Thus, the activity of carbon in the liquid is
known, but when equation (Cl) is applied co the solid to satisfy the
requirement that the activity of carbon m both phases must be equal,
two unknowns (X. and X») arise The values of A_ derived from the data
in the literature are limited to a small temperature range and cannot
be extrapolated to the higher temperatures so that a means is developed
to independently evaluate this parameter at higher temperatures. This

93
is accomplished by dealing with the activity of iron and/or chromium
in addition to carbon in both phases.
1. Activities in Ternary Systems.
43 Following a discussion of Wagner , the Gibbs-Duhem relation
applied to ternary solutions yields
Xl FE
FE = (1 - X )[FE (X = 0) + / r dX ] (D2) 0 (1 - X^' X2/X3,T
where: F = integral excess molar free energy
F1 = partial excess molar free energy of carbon
Since, a. F, = RT In -rp = RT In y, (D3)
and supposing the integral excess molar free energy is known for the
binary iron-chromium solutions, equation (D2) enables the calculation
E E of F for the ternary solutions. From F the activity of Iron and
chromium can then be determined as:
RT In Y0 = FE = FE + (1 - X„)( 4T- ) and, (D4) 22 2 3X2 x^
E RT In Y- = FE = FE+(1-X_)(||-) (D5)
33 3 3X3 X1/X2

94
2, Application of Gibbs-Duhem Relation to the Liquid.
Referring to the relations for the activity of carbon in liquid
iron-carbon-chromium solutions, (equations Cl - C4) we write:
E E Xl at(1 - V2 + h F = (1 - X MF^CX - 0) + 4.576T J — ^-5 ^ dX ] (D6)
0 u Äi; X2/X3,T
At a constant X2/X-,T both a and I are constants. Also, the
integral excess molar free energy (F ) for liquid iron-chromium solutions
39 is zero because iron and chromium form ideal solutions . Performing
the integration, equation (D6) becomes:
FE = 4.576T [oi^d - X^ + 1^] (D7)
E E Referring to equation (D4) F- can be found if (3F /9X ) ■ is
d, Z X. / X _
established. When X^X» is held constant, the differentiation of
equation (D7) is tedious because a and I vary. For this reason
only the results of this operation are presented.
g
F!; = RT In Y9 - FE+(1-X.)(||-) (D4) 2 2 2 8X2 X1/X3
where,
(f^-) = 4.576T{-[A] TTTT + [B]^) + [Cl (T^) > (D8) ^2 X1/X3
Xl+X3 dX2 X1/X3 dX2 X1/X3

95
[A] = ajd - ZX^ - (1 - Xls)2] + log T±- (D9)
[B] = X1[(l - X^ - (1 - Xls)2] (D10)
[C] = X1[2at(l - X1S) - ^303^ ] (Dll)
(^) - ^ (f )[T-TT-] (D12) 3X
2 X1/X3 T X3 X3 ^ Xl
3X i - X? X9 .2552X + 1.2552X ( ^ = 2Sci2( HI - ( )( -) 3X2 X /X 1.2552X2 + X3
;L k1.2552X2 + X3M X3 + Xi
(D13)
To evaluate the partial excess molar free energy for iron, the following
expression is used:
FE = X1FE + X2F2 + X3F3 (D14)
3. Application of Gibbs-Duhem Relation to the Solid.
Referring to equation (Dl), the partial excess molar free energy
for carbon in austenite can be written as
X X Fl = A0 + Al ( 1 iS > + A2 ( i A ) - RT In (1 - 2X1) (D15)
The binary system for austenitic iron-chromium alloy is assumed to be
regular so that
FE(X1 = 0) = ttXh2X
h3 (D16)
where: X^, X„ represent binary concentrations.
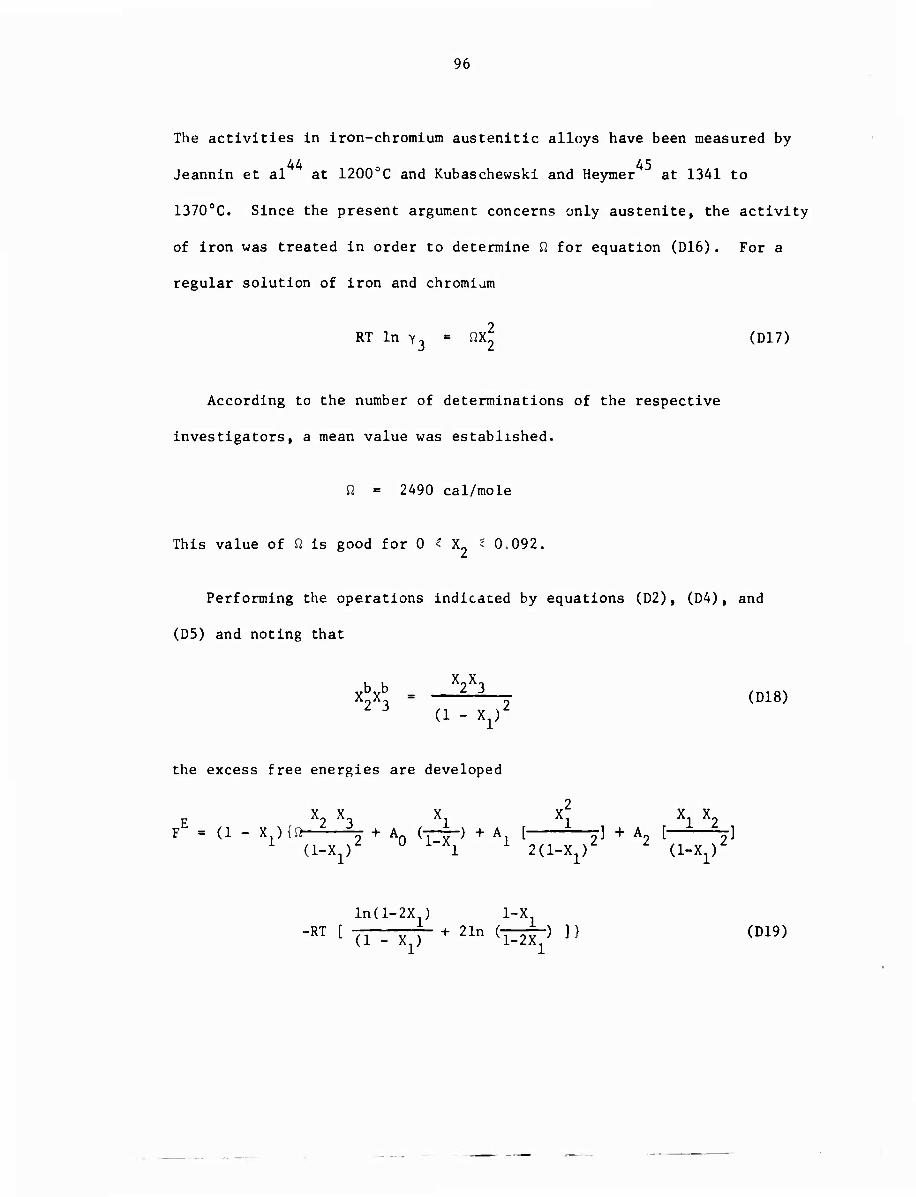
96
The activities in iron-chromium austenitic alloys have been measured by
4A a 45 Jeannin et al at 1200 C and Kubaschewski and Heymer ' at 1341 to
1370oC. Since the present argument concerns only austenite, the activity
of iron was treated in order to determine 0. for equation (D16). For a
regular solution of iron and chromiam
RT In Y3 = VX-l (D17)
According to the number of determinations of the respective
investigators, a mean value was established.
il = 2490 cal/mole
This value of fi is good for 0 < X- * 0.092.
Performing the operations indicaced by equations (D2), (D4), and
(D5) and noting that
xW = ^ . (D18) J (1 - XJ
the excess free energies are developed
F 7 A 1 1 1 ? F - (1 - Xjfn- \ + An (-r--) + A. [ i—r] + A, [ %]
1 (l-xy 1 2(1-X1)^ z (i-x.r
ln(l-2X ) 1-X -RT [ (1.Xi) +21n (—L-) 1) (D19)

97
üxl X* X X (1-2X ) F, ^ - [ L-j] A, + % A7 + RT In [ ^r] (D20) 2 (1-X )2 2(1-X )Z (1-X )^ (1-X )Z
„ nxl X X X (1-2X ) F^ *~r - [ ^-r] A, L-^~ A? + RT In [ ^r] (D21)
(i-x )z 2(i-x )z (i-x r (1-X )Z
As a check, equations (D15), (D19), (D20), and (D21) satisfy
FE = X^^ f X2F2 + X3F3 (D22)
A. Calculation of the Effect of Chromium from the Solid-Liquid Equilibria.
The activities of carbon, Iron and chromium can all be calculated for
the liquid alloys using equations developed herein. The activity of
carbon in the solid is then known since the standard state (pure graphite)
is the same for both phases. By changing the standard state from pure
liquid to pure gamma iron for the activity of iron in the liquid, the
activity of iron in the solid is calculated. Equation (Dl) is rearranged
to read
al A2X2 = RT(1 - X1)ln[^
i (1 - 2X^)1 - A0(l - X^ - A^ (D23)
Since the per cent chromium was measured in the solid, the mole fraction
of carbon is fixed for a given per cent carbon. Thus successive trials
were made by varying the per cent carbon and a set of corresponding
values of X1, X_ and A„ were generated.

98
These values are then substituted into equation (D21) to determine
the activity of iron apart from its calculated activity in the liquid
phase. Thus a plot of the activity of iron versus per cent carbon can
be made. An example of such a plot is shown in Figure Dl. The curve
displays a minimum and because only one solution is physically possible,
the minimum is the solution. These mimmums never exactly correspond
with the activity of iron as calculated for the liquid but all were
within + 1 per cent error, as shown in Table DI.
The value of A- that corresponds to the minimums was also calculated,
However, as Figure Dl shows. A- is extremely sensitive to the concentra-
tion of carbon. For this reason the plot of A~ versus temperature.
Figure D2, includes limits that correspond to + 2.5 per cent error in
the carbon concentration found at the mi ilmums. When least square
analysis is applied to this high temperature, as well as the low
temperature data, an expression tor A? is finally developed.
A2 = 826UT - 135,000 (D2A)

99
.8860
c o 1-
o
o <
0.8850
solution for activity of iron
10,000
5,000
-5,000
o 6
o o
CVi
<
- 10,000
1.00 1.05 1.10 1.15 Weight Percent Carbon
1.20
Fitur* Dl: calculatiDii for -he activitv ^c '.r'. aui ar.d tV.e ccrrespcr.dir.^ ' - valu^ is c'.ijsen as ^h- example.
"ca. 11, '.able A'.I

100
o Schenck and Kaiser32
▼ Kirkaldy and Brigham41
v Kirkaldy and Brown42
□ Bundgardt et al34
$ This investigation
-40 —
900 000 1 1
100 1200 1300 1400 Temperature , 0C
1500 ,'600
Figure D2: The parameter. A,,, versus temperature.

101
TABLE DI
COMPARISON OF IRON ACTIVITIES CALCULATED FOR THE LIOUID AND FOR THE SOLID
Equilibrium Activity of Iron* Activity of Iron* Temperature. 0C Calculated for Solid Calculated for Liquid
1444 .9688 .9678
1265 .8850 .8944
1318 .9164 .9237
1336 .9271 .9339
1370 .9422 .9492
2159 .9017 .9012
1295 .9051 .9163
1410 .9560 .9599
* Standard State is pure gamma iron.

102
APPENDIX E
CONSTRUCTION OF SOLIDUS SURFACE
In principle if the activities ot all three components can be
described for two phases, then the equilibrium between the two phases
can be completely describedr However, since the liquidus is known,
it is only necessary to consider the activity of two components. Carbon
is an obvious choice tor one of the components; if iron is chosen as the
second component difficulties arise so that a means is developed to use
chromium as the standard state.
Referring to Figure Dl, the activity of iron is seen to be hardly
sensitive to the concentration or carbon; because the activity of iron
is only known to within .01 (Table DI), the weight per cent of chromium
could only be known to about ^ 1 per cent (absolute, not a relative
value).
To avoid the difficulty of working with the activity of iron, a
relation was developed to express the change of state from chromium
from the liquid to the hypothetical scandard state of pure austenitic
chromium. Using the eight experimental chromium equilibria determinations
and accepting the activities tor carbon and chromium calculated in the
liquid equations (D15) and (D20) are solved simultaneously for the concen-
tration of carbon, X , and the activity of chromium in austenite, a». The
carbon concentrations derived in this manner were within the limits
specified for the determination ot A^ In Figure D2. The ratio of chromium
activities for the austenite relative to ehe liquid is plotted in Figure El

103
which yields the following relation for the change of standard state
for chromium:
aY
log -| - -—i - 1.076 (El)
a2
With this equation the solidus surface can now be constructed by
requiring that the activity of carbon and chromium in both phases be
equal when based on the same standard state. Equation (Dl) is compared
with the analogous equation for the change of standard state between
6-chromium and liquid-chromium in Figure El. The curve involving
Y-chromium Is higher than ö-chromium as it should be because 6-chromlum
is the stable phas«1..
The solidus derived in this manner is presented in Figure 3. In
Figure E2 the concentrations of chromium in the solid in equilibrium
witi: the experimental liquid compositions of Table All are compared with
the concentrations derived from the solidus. The probable error, based
on deviations from the line of perfect correlation, is + 0.171 per cent
chromium.

10A
o
« CM o
o» o
u.o 1 1 1 1 1 1
0.6 —
A ? * :
0.4
- * A
A
—
0.2 — "
8 —
0 . 1 1 1 i 1 1 5.6 6.0 6.4
Y * 10 , deg.
6.8 7.2
Figure El: Change of standard state for chromium hetween pure liquid chromium and the hypothetical pure v-chromium and comparison with the change of standard state involving 6-chromium.

105
2 3 4 5 % Chromium in Solid, Experimental
Figure E2: Comparison of experimental chromium concentrations in austenite with those from the derived phase diagram.

106
APPENDIX F
CONVERSION OF X-RAY INTENSITIES TO WEIGHT PER CENT CHROMIUM
46 Empirical relations developed by Ogilvie and Ziebold for ternary
systems were utilized. For the iron-carbon-chromium system their
empirical relations can be expressed simply as:
C2 — = C3(a23 - 1) + 1 (Fl)
and
iq ' C2(a32 - » + ! (ro
where: C„ ■ composition of chromium, weight fraction
C„ = composition of iron, weight fraction
K„ • normalized intensity of chromium
K_ = normalized intensity of iron
a»., a.„ = constants determined by the use of standards
Equations (Fl) and (F2) can be realized because carbon atoms do not
flouresce either iron or chromium atoms, nor absorb chromium or iron
characteristic radiation.
To determine the parameters a«^ and a-„, the average intensity ratios
of non-homogeneous specimens were determined by scanning in a random
manner for approximately 400 seconds while collecting detector counts.
Using equation (Fl), the composition of chromium can be calculated if
the c ncentration of carbon is known. If the concentration of carbon is
not known then both the intensities of chromium and iron are recorded
and equations (Fl) and (F2) are solved simultaneously for C..

![Li Alloying Nanomaterials - greenlionproject.eu · where M represents a group IV alloying element.[5] This equation implies a 3.75:1 lithium to alloying element atomic ratio at full](https://static.fdocuments.us/doc/165x107/5f7894293cf36b12a9415e0d/li-alloying-nanomaterials-where-m-represents-a-group-iv-alloying-element5-this.jpg)