CTD Data Processing and Calibration · 2010-01-11 · CTD Data Processing and Calibration 1....
8
CTD Data Processing and Calibration 1. Initial Processing using SeaBird Programs The files output by Seasave (version 7.18) have the appendices: .hex, .HDR, .bl, .CON. The .CON files for each cast contain the calibration coefficients for the instrument. The .HDR files contain the header information of each cast file. The .hex files are the data files for each cast and are in hex format. The .bl files contain information on bottle firings of the rosette. Initial data processing was performed on a PC using the Seabird processing software SBE Data Processing, Version 7.18. We used the following options in the given order: Data Conversion Align CTD Wild Edit Cell Thermal Mass Data Conversion - turns the raw data into physical units and applies the calibration coefficients in the instrument configuration file. The input files were named ctdnnn.hex where nnn refers to the three digit station number, ctdnnn.CON which is the instrument configuration file and ctdnnn.bl which contains information regarding bottle firing. The output files were specified as ctdnnn.cnv, where nnn is the station number. Once these files had been created they were overwritten by any subsequent seabird processing. Align CTD - takes the .cnv file and applies a temporal shift to align the sensor readings. The offsets applied were zero for the primary and secondary temperature and conductivity sensors as the CTD deck unit automatically applies the conductivity lag to the conductivity sensors. An offset of 5 was applied to the oxygen sensor. Wild Edit - The mean and standard deviation of each parameter are calculated for blocks of 500 cycles. Points that lie outside two times the standard deviation are temporarily excluded for recalculation of the standard deviation. Points outside ten times of the new standard deviation are replaced by a bad flag. It appears that, in later analysis, using a block size of 500 was too large and some 24 Hz records were excluded that should not have been. Cell Thermal Mass - takes the .cnv files and makes corrections for the thermal mass of the cell, in an attempt to minimise salinity spiking in steep vertical gradients due to temperature/conductivity mismatches. The constants used were: thermal anomaly amplitude α = 0.03; thermal anomaly time constant 1/β = 7. SeaPlot - provided an initial look at the data. 1
Transcript of CTD Data Processing and Calibration · 2010-01-11 · CTD Data Processing and Calibration 1....
CTD Data Processing and Calibration 1. Initial Processing using SeaBird Programs The files output by Seasave (version 7.18) have the appendices: .hex, .HDR, .bl, .CON. The .CON files for each cast contain the calibration coefficients for the instrument. The .HDR files contain the header information of each cast file. The .hex files are the data files for each cast and are in hex format. The .bl files contain information on bottle firings of the rosette. Initial data processing was performed on a PC using the Seabird processing software SBE Data Processing, Version 7.18. We used the following options in the given order: Data Conversion Align CTD Wild Edit Cell Thermal Mass Data Conversion - turns the raw data into physical units and applies the calibration coefficients in the instrument configuration file. The input files were named ctdnnn.hex where nnn refers to the three digit station number, ctdnnn.CON which is the instrument configuration file and ctdnnn.bl which contains information regarding bottle firing. The output files were specified as ctdnnn.cnv, where nnn is the station number. Once these files had been created they were overwritten by any subsequent seabird processing. Align CTD - takes the .cnv file and applies a temporal shift to align the sensor readings. The offsets applied were zero for the primary and secondary temperature and conductivity sensors as the CTD deck unit automatically applies the conductivity lag to the conductivity sensors. An offset of 5 was applied to the oxygen sensor. Wild Edit - The mean and standard deviation of each parameter are calculated for blocks of 500 cycles. Points that lie outside two times the standard deviation are temporarily excluded for recalculation of the standard deviation. Points outside ten times of the new standard deviation are replaced by a bad flag. It appears that, in later analysis, using a block size of 500 was too large and some 24 Hz records were excluded that should not have been. Cell Thermal Mass - takes the .cnv files and makes corrections for the thermal mass of the cell, in an attempt to minimise salinity spiking in steep vertical gradients due to temperature/conductivity mismatches. The constants used were: thermal anomaly amplitude α = 0.03; thermal anomaly time constant 1/β = 7. SeaPlot - provided an initial look at the data.
1
2. Mstar CTD Processing After initial processing with the Seabird routines, all data was run through the new MEXEC processing suite of programs (based on Pstar). The entire Mstar software suite is written in Matlab and uses NetCDF file format to store all data. There are four principal types of files: • SAM files: these contain information about rosette bottles samples, including upcast
CTD data from when the bottles were fired. Data from chemistry samples corresponding with each bottle are uploaded into this file
• CTD files: contain all data from CTD sensors. There are five different CTD files: _raw, _24hz, _1hz, _psal and _2db. The suite of programs averages and interpolates the raw data until it has 2db resolution.
• DCS files: store information necessary for CTD downcast processing (for example start, bottom and end points of the cast). These files are also used when merging in latitude and longitude.
• FIR files: contains information about rosette bottle firing.
2.1 Processing on JC031 After having converted CTD with the SBE programs, there are two files to work on: ctd_jc031_nnn.cnv and ctd_jc031_nnn.bl. The first one contains the raw CTD data including cast information and the second contains information about bottle firing. msam_01: creates an empty .sam file to store all information about rosette bottle samples. The set of variables are available in the M_TEMPLATES directory and can be changed according to what variables are needed. This file named as sam_jc031_nnn.nc contains space to store data for each sample bottle, their flags and appropriate CTD data needed for bottle analysis. mctd_01: reads the raw data (ctd_jc031_nnn_ctm.cnv) and stores it in a NetCDF file named ctd_jc031_nnn_raw.nc, which becomes write protected. mctd_02: copies ctd_jc031_nnn_raw.nc into ctd_jc031_nnn_24hz.nc renaming SBE sensor variable names. mctd_03: 24Hz data salinity is calculated as well as a 1Hz averaged file (ctd_jc031_nnn_1hz) and also an averaged potential salinity and potential temperature file (ctd_jc031_nnn_psal). mdcs_01: creates an empty file named dcs_jc031_nnn to store information about the start, bottom and end of the cast. mdcs_02: populates dcs_jc031_nnn with deepest pressure information.
2
mdcs_03: selects and shows surface data < 20db (ctd_jc031_nnn_surf) from which the analyst chooses the positions of the start and end scan numbers for the top and bottom of the cast. mctd_04: uses information from dcs_jc031_nnn to select the CTD downcast data from ctd_jc031_nnn_24hz file to create a 2db resolution file (ctd_jc031_nnn_2db). mdcs_04: loads position from the navigation file and merges it onto the points previously defined by mdcs_03 and stores it in dcs_jc031_nnn_pos.nc. mfir_01: extracts information about fired bottles from ctd_jc031_nnn.bl and copies into a new file named fir_jc031_nnn_bl.nc. mfir_02: uses information from fir_jc031_nnn_bl and ctd_jc031_nnn_1hz to merge the time from the CTD using scan numbers and puts this into a new file (fir_jc031_nnn_time.nc). mfir_03: stores the CTD data for the time each bottle was fired in fir_jc031_nnn_ctd. The CTD data are taken from ctd_jc031_nnn_psal and selected according to the firing time information stored in fir_jc031_nnn_time. mfir_04: copies information of each bottle from fir_jc031_nnn_ctd onto sam_jc031_nnn. mdcs_05: apply positions from dcs_jc031_nnn_pos.nc to all files.
2.2 Sample Files Chemistry and tracer data from the various disciplines were merged with CTD data to create master sample files. The sample files sam_jc031_nnn.nc were created when processing each CTD station. At this stage they were filled with upcast conductivity, temperature, oxygen and pressure from both primary and secondary sensors coincident with bottle firings (up to a maximum of 24 points). Merging of these data took two steps for each tracer: the first step generated an Mstar file which contained all the tracer data for a given section – these were the programs named moxy_01, mnut_01, mcfc_01 and mco2_01. The second step was to merge these individual Mstar files onto the master sam file for the station. This was performed by the programs moxy_02 etc. At this stage oxygen was converted from μm/l to μm/kg. Residuals were created using the program msam_02. 2.3 Sensor calibration - conductivity The CTD was lost on Station 12 therefore there were two separate station groupings: Stations 1-12 and then Stations 13-84. The CTD was fitted with two separate conductivity and temperature sensors; one on the main frame and the other on the fin of
3

the CTD. The primary conductivity sensor (on the frame) for Stations 1-12 had a pressure trend while the sensor on the fin appeared stable with just a bias needing to be applied to the laboratory calibrations (-.0027). For Stations 13-84 it was decided to use the frame conductivity sensor as the main sensor since the secondary sensor showed a slight pressure trend and also the secondary sensor appeared slightly less stable with occasional 'wanderings' of less than .001 between stations. A bias of .00055 and a slope correction of -.22*10-6 per db were initially applied to the data. The conductivity appeared stable for the duration of the cruise, any change was within the bounds of the accuracy of the salinity bottle samples. Figure 1 shows bottle salinity minus CTD salinity after calibration versus station number.
Figure 1: Salinity residuals plotted against station number 2.4 Sensor calibration - oxygen The oxygen sensor was attached to the primary conductivity-temperature sensor on the CTD frame. Early on in the cruise, the sensor was noted to suffer from large hysteresis between the down and up casts. No correction for this hysteresis was applied, but the downcast oxygen (rather than the upcast) was calibrated against bottle samples. The downcast data were matched with the bottle samples (taken on the upcast) on density. Density was chosen as a parameter more representative of the water mass than pressure/depth which may change between down and upcasts. The residuals calculated were shown to have a dependence on pressure. For stations 1-12 the pressure adjustment from 0 to 4500db was 8.5 μm/kg, for stations 13-84 the pressure adjustment from 0 to
4

4500 db was almost 14 μm/kg. As with the conductivity sensor, the oxygen sensor appeared stable throughout the length of the cruise. 3. Pressure Bias No on-deck pressure bias has been applied to the data. From the time the instrument was put into recording mode until entering the water, the bias was anywhere between 0 to -0.7 db as the instruments position changed on the deck. On recovery the bias was generally between -0.6 to -1.0. 4. Problems created with the use of 'wild edit' On several of the stations the use of wild edit had created small gaps in the data with some points that were rejected in conductivity and salinity which should not have been. This created the problem that when salinity was calculated at the 2db stage from the averaged temperatures and averaged conductivities there was the occasional salinity spike since averaged conductivity and temperature values were misaligned. Normally, the new Mstar suite of programs would calculate salinity from averaged 2db conductivity and temperature data. For the processing of JC031 we decided to calculate salinity at the 24Hz stage only when there were values for both conductivity and temperature and then average this consistent 24Hz salinity data directly to 2db data. Therefore if 2db conductivity and temperature data are used to calculate salinity, the resulting salinities may be slightly different. Those stations where the use of Wild Edit created a problem are shown in Table 1. Table 1: Stations that have corresponding Wild Edit problems
CTD Number Wild Edit Problems 9 Frame temp at 3237db Fin temp at 3237db
19 Frame temp at 2089db Fin temp at 3367db 20 Fin cond at 2187db 22 Frame cond at 1663db Fin cond at 1509db 29 Frame cond at 1819db Fin cond at 1819db 31 Frame temp at 3137db (Glitch in Fin at 1213db not WE) 32 Frame cond at 1867db (Frame sensor cond bad below 2143db) 33 (Fowling on Fin cond below 2143db) 40 Fin temp at 2297db 42 Fin cond at 1745db 43 Frame temp at 933db 47 Fin temp and cond 539db 51 Fin cond 468db 53 Fin temp 1329db 54 Frame temp at 1751db and 2727db Fin cond at 1377db 55 Frame temp at 1883db 59 Frame cond at 2508db and slight in both sensors at 948db
5
60 Frame and Fin temp at 2129db and 2783db 63 Frame temp at 695db and 2779db Fin cond at 1839db Fin temp 2735db 65 Frame temp 3449db 68 (Spike in Fin at 3393db) 69 Fin cond at 2975db Frame temp and cond 3460db 72 Fin cond at 2278db 75 Fin cond at 713db 76 (Fin cond at 20932-34pts.raw need removing)
( Problems in parentheses not caused by use of Wild Edit )
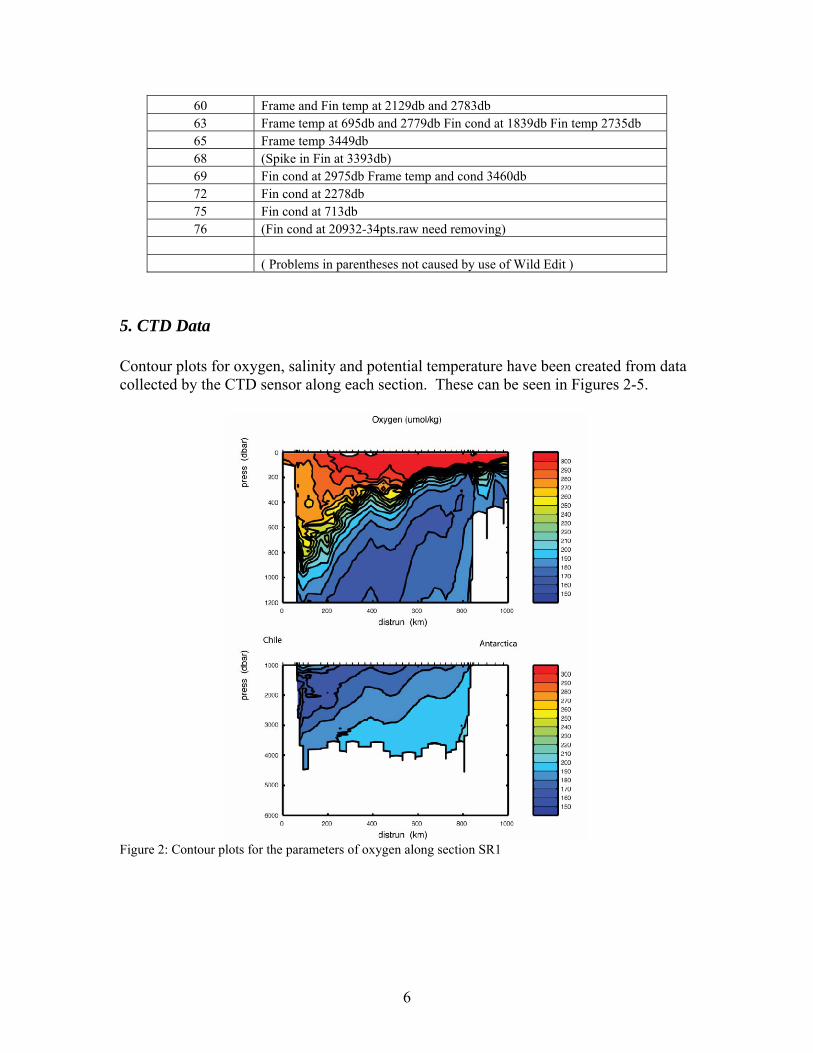
5. CTD Data Contour plots for oxygen, salinity and potential temperature have been created from data collected by the CTD sensor along each section. These can be seen in Figures 2-5.
Figure 2: Contour plots for the parameters of oxygen along section SR1
6

Figure 3: Contour plots for the parameters of oxygen along section SR1b
Figure 4: Contour plots for the parameters of potential temperature and salinity along section SR1
7

F
igure 5: Contour plots for the parameters of potential temperature and salinity along section SR1b
8