CTCF-Mediated Chromatin Loops between Promoter and Gene ... · Cell Systems Report CTCF-Mediated...
17
Report CTCF-Mediated Chromatin Loops between Promoter and Gene Body Regulate Alternative Splicing across Individuals Graphical Abstract Highlights d CTCF-mediated intragenic looping can regulate alternative exon usage d Genetic variation that affects CTCF looping leads to variation in splice isoforms d Genes regulated by CTCF loops are involved in signaling and cellular stress response Authors Mariana Ruiz-Velasco, Manjeet Kumar, Mang Ching Lai, ..., Kyung-Min Noh, Toby J. Gibson, Judith B. Zaugg Correspondence [email protected] In Brief The presence of CTCF-mediated intragenic chromatin loops regulates alternative splicing; this, in turn, may impact cellular decision making. Ruiz-Velasco et al., 2017, Cell Systems 5, 1–10 December 27, 2017 ª 2017 Published by Elsevier Inc. https://doi.org/10.1016/j.cels.2017.10.018
Transcript of CTCF-Mediated Chromatin Loops between Promoter and Gene ... · Cell Systems Report CTCF-Mediated...
Report
CTCF-MediatedChromatin
Loops betweenPromoterand Gene Body Regulate Alternative Splicing acrossIndividualsGraphical Abstract
Highlights
d CTCF-mediated intragenic looping can regulate alternative
exon usage
d Genetic variation that affects CTCF looping leads to variation
in splice isoforms
d Genes regulated by CTCF loops are involved in signaling and
cellular stress response
Ruiz-Velasco et al., 2017, Cell Systems 5, 1–10December 27, 2017 ª 2017 Published by Elsevier Inc.https://doi.org/10.1016/j.cels.2017.10.018
Authors
Mariana Ruiz-Velasco, Manjeet Kumar,
Mang Ching Lai, ..., Kyung-Min Noh,
Toby J. Gibson, Judith B. Zaugg
In Brief
The presence of CTCF-mediated
intragenic chromatin loops regulates
alternative splicing; this, in turn, may
impact cellular decision making.

Please cite this article in press as: Ruiz-Velasco et al., CTCF-Mediated Chromatin Loops between Promoter and Gene Body Regulate AlternativeSplicing across Individuals, Cell Systems (2017), https://doi.org/10.1016/j.cels.2017.10.018
Cell Systems
Report
CTCF-Mediated Chromatin Loops between Promoterand Gene Body Regulate Alternative Splicingacross IndividualsMariana Ruiz-Velasco,1 Manjeet Kumar,1,6 Mang Ching Lai,1,6 Pooja Bhat,1,3 Ana Belen Solis-Pinson,1,4
Alejandro Reyes,2,5 Stefan Kleinsorg,1 Kyung-Min Noh,2 Toby J. Gibson,1 and Judith B. Zaugg1,7,*1Structural and Computational Biology, European Molecular Biology Laboratory, 69117 Heidelberg, Germany2Genome Biology, European Molecular Biology Laboratory, 69117 Heidelberg, Germany3Present address: Institute of Molecular Biotechnology of the Austrian Academy of Sciences, 1030 Vienna, Austria4Present address: Department of Mathematics and Computer Science, Freie Universit€at Berlin, 14195 Berlin, Germany5Present address: Biostatistics and Computational biology, Dana-Farber Cancer Institute, Boston, MA 02215, USA6These authors contributed equally7Lead Contact
*Correspondence: [email protected]
https://doi.org/10.1016/j.cels.2017.10.018
SUMMARY
The CCCTC-binding factor (CTCF) is known to estab-lish long-range DNA contacts that alter the three-dimensional architecture of chromatin, but how thepresence of CTCF influences nearby gene expres-sion is still poorly understood. Here, we analyzeCTCF chromatin immunoprecipitation sequencing,RNA sequencing, and Hi-C data, together withgenotypes from a healthy human cohort, and mea-sure statistical associations between inter-individualvariability in CTCF binding and alternative exonusage. We demonstrate that CTCF-mediated chro-matin loops between promoters and intragenic re-gions are prevalent and that when exons are in phys-ical proximity with their promoters, CTCF bindingcorrelates with exon inclusion in spliced mRNA.Genome-wide, CTCF-bound exons are enriched forgenes involved in signaling and cellular stress-response pathways. Structural analysis of three spe-cific examples, checkpoint kinase 2 (CHK2), CDC-like kinase 3 (CLK3), and euchromatic histone-lysineN-methyltransferase (EHMT1), suggests that CTCF-mediated exon inclusion is likely to downregulateenzyme activity by disrupting annotated protein do-mains. In total, our study suggests that alternativeexon usage is regulated by CTCF-dependent chro-matin structure.
INTRODUCTION
In recent years, it has become evident that the three-dimensional
(3D) organization of chromatin is highly regulated and likely to
play important roles in gene regulation (Neems et al., 2016;
Nora et al., 2012). A key factor for regulating the chromatin archi-
tecture is CTCF, a DNA-binding protein known to bring distant
genomic elements into close spatial proximity by driving chro-
Cell System
matin loop formation (Splinter et al., 2006; Yusufzai et al.,
2004). The formation of these loops depends on the dimerization
of two CTCF molecules in a convergent orientation that are
bound to distant genomic loci (de Wit et al., 2015; Guo et al.,
2015; Rao et al., 2014). To date most studies on 3D chromatin
organization have focused on describing long-range gene-
enhancer interactions (de Wit et al., 2015; Ji et al., 2016) or entire
chromatin domains, and have largely remained descriptive with
only a few examples that provide a mechanistic understanding
for single loci reviewed in Ruiz-Velasco and Zaugg (2017). Func-
tional insights have been particularly limited for shorter-range
intragenic interactions, which are highly prevalent in many chro-
matin conformation experiments. By integrating multiple layers
of genome-wide molecular phenotype data with genotypes, as
well as curated genome and protein annotations, the results
from our study indicate a functional role for CTCF-mediated
intragenic chromatin looping in alternative splicing, particularly
in regulating the inclusion of domains in proteins involved in
signaling and cellular stress response.
RESULTS
Intragenic CTCF Motif Orientation Suggests PervasivePromoter-Exon LoopingCTCF-mediated chromatin loops preferentially form between
two convergently bound CTCF molecules (de Wit et al., 2015;
Guo et al., 2015). Here we sought to assess the potential of intra-
genic CTCF loop formation by using its dependency on conver-
gently oriented CTCF-binding sites. To do so, we quantified the
distribution and orientation of intragenic CTCFmotifs in genic re-
gions grouped into four classes: promoter (±1 kb from transcrip-
tion start site [TSS]), transcription termination site (TTS; ±1 kb),
intronic regions upstream of exons (�2 kb from the exon
50 end), and intronic regions downstream of exons (+2 kb from
the exon 30 end; STARMethods: Annotation of Intragenic Loops).
Next we scanned these regions for CTCF motifs, and defined
their directionality as sense if both the motif and gene had the
same orientation and antisense if vice versa.
We observe a bias for sense CTCF motifs at promoters (p =
7 3 10�7, binomial test) with a sharp increase 500 bp upstream
s 5, 1–10, December 27, 2017 ª 2017 Published by Elsevier Inc. 1

p−val=7e−7
0
50
100
150
200
250
−1000 −500 0 500 1000
Num
ber o
f mot
ifsAntisense=1427Sense=1706
Promoter -500bp Upstream (-2kb) Downstream (+2kb) TTS (+/-1kb)
prom-downstream
prom-TTS
downstream-TTS prom-upstream upstream-TTS
C
B
D
A
1e-2
0
50
100
150
200
250
0 500 1000 1500 2000
22642096
p−val=0.3
0
50
100
150
200
250
−1000 −500 0 500 1000
349377
OR=1.5, pval=5e-2 OR=0.9, pval=0.7
Upstream Downstream EMiddle exon
*
0.0 0.5 1.0 1.5 2.0 2.5
1e−8
0
200
400
0 25 50 75 100Intron length [%]
Num
ber o
f mot
ifs
Antisense=7220Sense=6551
F
0.0 0.5 1.0 1.5 2.0 2.5
Enrichment of exon motifs overlapping sQTLs [Li 2016]Observed/Expected
3,182 58
1,345 37
3,319 60
1,410 23
0.0 0.5 1.0 1.5 2.0
1.6e−5
0
50
100
150
200
250
−2000−1500−1000 −500 0
22541973
0.2
0
50
100
150
200
250
−1000 −500 0 500 1000
345378
0.7
1.5
0.7
1.3
1.50.5 0.7
1.41.8
0.5
0
50
100
150
200
1.prom
−up
2.prom
−dow
n
3.prom
−TTS
4.up−
TTS
5.dow
n−TTS
Num
ber
of m
otif
pairs ChIA−PET CHiC
1.prom−up
2.prom−down
3.prom−TTS
4.up−TTS
5.down−TTS
1.prom−up
2.prom−down
3.prom−TTS
4.up−TTS
5.down−TTS
0
50
100
0
25
50
75
Num
ber o
f int
erac
tions
CTCF−pair orientationConvergentDivergentBoth antisenseBoth sense
Antisense motifsSense motifs
Figure 1. CTCF Motifs Show Preferential Directionality along Transcripts
(A and B) Distribution of CTCF motifs (overlapping with CTCF ChIP-seq peaks) in sense (blue) and antisense (red) orientation for four genic regions: promoter,
upstream of exon, downstream of exon, and TTS (A; left to right; see also schematic), and along introns shown as percentage of their full length (B; see STAR
Methods: Annotation of Intragenic Loops). The number of motifs is shown for each region; p values (p-val) are given for binomial tests.
(C) Orientation of CTCF interactions based on the motif pairs: promoter:exon-upstream (prom-up), promoter:exon-downstream (prom-down), promoter:TTS
(prom-end), exon-upstream:TTS (up-end), and exon-downstream:TTS (down-end).
(D) Number of motif pairs with physical interaction based on ChIA-PET data of Rad21, H3K4me3 (Grubert et al., 2015), and CTCF (Tang et al., 2015) (left), and
C-HiC (Mifsud et al., 2015) (right).
(legend continued on next page)
2 Cell Systems 5, 1–10, December 27, 2017
Please cite this article in press as: Ruiz-Velasco et al., CTCF-Mediated Chromatin Loops between Promoter and Gene Body Regulate AlternativeSplicing across Individuals, Cell Systems (2017), https://doi.org/10.1016/j.cels.2017.10.018

Please cite this article in press as: Ruiz-Velasco et al., CTCF-Mediated Chromatin Loops between Promoter and Gene Body Regulate AlternativeSplicing across Individuals, Cell Systems (2017), https://doi.org/10.1016/j.cels.2017.10.018
of the TSS (p = 8.3 3 10�11, dashed box in Figure 1A), while the
region upstream and, to a lesser extent, downstream of exons
contain preferentially antisense motifs (p = 1.6 3 10�5 and 1 3
10�2, respectively; Figure 1A). Consistently, when considering
all motifs across the intron we find an increase in antisense mo-
tifs at the 50 end of exons (Figure 1B). TTS contain very few CTCF
sites and no preference for any motif orientation. Notably, long
non-coding RNAs showed no such pattern (Figure S1A), indi-
cating that their 3D chromatin structure is fundamentally
different from protein coding genes; thus, we excluded them
from further analyses.
To evaluate whether these enrichments of sense and antisense
motifs can form convergent CTCF pairs between promoter and
exon-proximal regions, we grouped pairs of CTCF sites into ‘‘pro-
moter:exon-upstream,’’ ‘‘promoter:exon-downstream,’’ ‘‘promo-
ter:TTS,’’ ‘‘exon-upstream:TTS,’’ and ‘‘exon-downstream:TTS’’
pairs (schematic in Figure 1A), and classified each pair as
‘‘convergent,’’ ‘‘divergent,’’ ‘‘both sense,’’ and ‘‘both antisense’’
depending on the relative orientation of the respective CTCF mo-
tifs. We found both classes of promoter-exon pairs strongly en-
riched for convergent configurations (odds ratio [OR] 1.5 and
1.3, p = 3.4 3 10�4 and 1.4 3 10�2 for promoter:exon-upstream
and promoter:exon-downstream, respectively; Fisher’s exact
test, Figure 1C). These findings suggest CTCF-mediated DNA
loop formation between promoters and exon-proximal regions
and allowed us to predict 181 promoter:exon-upstream loops
involving 136 promoters with stringent thresholds, and 1,463
loops involving 956 promoters with less stringent criteria (lympho-
blastoid cell line [LCL]-specific set; Figures S1B and S1C; STAR
Methods: Annotation of Intragenic Loops).
To validate the loop predictions we used promoter capture-
HiC (CHiC) and ChIA-PET data for Rad21, CTCF, and
H3K4me3 (STAR Methods: Overlap with Chromatin Conforma-
tion Data) (Grubert et al., 2015; Mifsud et al., 2015; Tang et al.,
2015). These contact maps captured 57% of the predicted
loops. In accordancewith our predictions, most contacts formed
between promoters and exon-proximal regions with CTCF mo-
tifs in convergent orientation (OR 3.4, p = 2.5 3 10�9 for ChIA-
PET and OR 1.6, p = 4 3 10�2 for CHiC; Fisher’s exact test,
Figure 1D).
Given this evidence of CTCF-mediated promoter-exon loops
along with a previous report associating CTCF with alternative
splicing at theCD45 locus (Shukla et al., 2011), we hypothesized
that CTCF might regulate alternative exon usage by bringing
exons into close physical proximity with their promoter. Indeed,
we found that exons whose upstream regions were predicted to
loop to their promoter were enriched for differentially used exons
(DUEs) across individuals (OR 1.5, p = 5 3 10�2, Fisher’s exact
test; Figure 1E and see below). No such enrichment was
observed for promoter:exon-downstream loops.
A recent study found that genetic variants affecting alternative
splicing across individuals (splicing quantitative trait loci [sQTLs])
(E) Schematic of contingency table for testing the association of differentially us
stream (right) loops. The p values (pval) are given for Fisher’s exact test; OR, odds
DUEs are calculated based on RNA-seq data from LCLs of 18 individuals (STAR
(F) Enrichment of sQTLs (FDR = 10%) (Li et al., 2016) overlapping with a particula
(right) of a middle exon (*p < 0.05, Fisher’s exact test).
See also Figure S1.
often coincide with QTLs for CTCF (Li et al., 2016), suggesting a
genome-wide role of CTCF in alternative splicing.We observed a
strong enrichment for sQTLs to overlap with convergent promo-
ter:exon-upstream CTCF pairs (OR 2.4, p = 2 3 10�2, Fisher’s
exact test; Figure 1F). Together, these results suggest a mecha-
nistic involvement of CTCF-mediated promoter-exon looping in
alternative exon usage.
CTCF-Mediated Intragenic Chromatin Loops RegulateAlternative Exon UsageOne prediction of such a mechanism is that exons which can
form a loop with their promoter are more likely differentially
used than non-looping exons. Thus we expect (1) that changes
in CTCF binding across individuals correlate with differential
exon usage for exons that can form a loop with their promoters
(convergent promoter:exon pairs), and (2) that such a correlation
does not exist for other exons.
We employed CTCF chromatin immunoprecipitation
sequencing (ChIP-seq) and matching RNA sequencing (RNA-
seq) data for 18 individuals (Kasowski et al., 2013) to calculate
the variation on CTCF binding and exon usage (Figure 2A;
STAR Methods: Identification of Differentially Used Exons). In
brief, we used DEXSeq (Anders et al., 2012) to identify DUEs
from the set of middle exons expressed in LCLs (62,663), which
resulted in 2,081 DUEs at a 10% false discovery rate (FDR)
(Figures S2A–S2D). CTCF binding at these DUEs was quantified
by averaging the signal of CTCF within 2 kb of the respective
exon boundaries (upstream and downstream; STAR Methods:
CTCF Correlation with DUEs). For each individual we then calcu-
lated log2 fold-change values of differential exon usage and
CTCF binding with respect to the median across all individuals.
These ratios were then assessed by Spearman correlation to
investigate the relationship between CTCF binding and exon
usage (Figure 2B; STAR Methods: CTCF Correlation with DUEs).
The correlations were generally not driven by outliers, as
shown for a few representative examples (Figure 2C). Notably,
we find that exonswith upstream convergent pairs show a strong
bias toward positive correlations, whereas the correlations of
CTCF with non-looping exons were indistinguishable from
empirical correlations (100 permutations; Figures 2D and S2E).
In summary, these results support the model in which CTCF-
dependent alternative exon usage is mediated by intragenic
promoter:exon loops. Interestingly, the evidence holds only for
promoter:exon-upstream pairs.
Allele-Specific Analysis Confirms the Model of CTCF-Dependent Alternative Exon Usage Mediated by DNAInteractionsTo directly test the link between chromatin loop formation and
exon usage, we sought to use genetic variation to quantify the
allelic fractions of chromatin contact frequencies (data taken
from Rao et al., 2014), CTCF binding, and exonic expression.
ed exons (DUE) and promoter-exon:upstream (left) and promoter-exon:down-
ratio. Background color represents ratio of observed versus expected events.
Methods: Identification of Differentially Used Exons).
rly oriented CTCF motif (± 20 bp from midpoint) upstream (left) or downstream
Cell Systems 5, 1–10, December 27, 2017 3
C
A
Middle exon (DUE)
B
Correlation CTCF ~ exon usage
Log2FC of exons:individual vs median
Log2FC of CTCF:individual vs median
Exons with convergent motifs
Control = 100 permutations
Compare distributions
Exons withoutinteraction
2 kb2 kb
0.0
0.5
1.0
1.5
−0.5 0.0 0.5Spearman correlation 5' CTCF and DUEs
Den
sity
CTCF
Filter expressed isoforms (kallisto)
Reduce/merge exons
Keep exons with >=10 mean counts and length 20bp-5kb
Calculate DUEs (DEXSeq)
Filter for middle exons
Identifying Differentially Used Exons (DUEs)
86,285 exons
3,844 exons
2,081 exons
109,960 exons
Keep autosomes and coding genes
145,989 exons
�
�
�
��
�
�
�
�
�
�
�
�
�
�
�
��
cor = 0.4
−2
−1
0
1
−1.2 −0.8 −0.4 0.0 0.4
�
�
�
�
�
� �
�
�
�
�
�
�
�
�
�
��
cor = 0.3
−1
0
1
−0.15−0.10−0.05 0.00 0.05 0.10�
��
�
�
�
�
��
�
�
�
�
�
�
�
�
�
cor = 0.7
−1.0
−0.5
0.0
0.5
1.0
−0.10 −0.05 0.00 0.05 0.10
CTC
F lo
g2 fo
ld c
hang
e
Exon log2 fold change
D
no interactionn=1545
convergentn=37
permutedn=159,400
6e-3
3e-2
0.0
0.5
1.0
1.5
−0.5 0.0 0.5Spearman correlation 3' CTCF and DUEs
no interactionn=1716
convergentn=22
permutedn=176,000
N.S.
N.S.
DownstreamUpstream
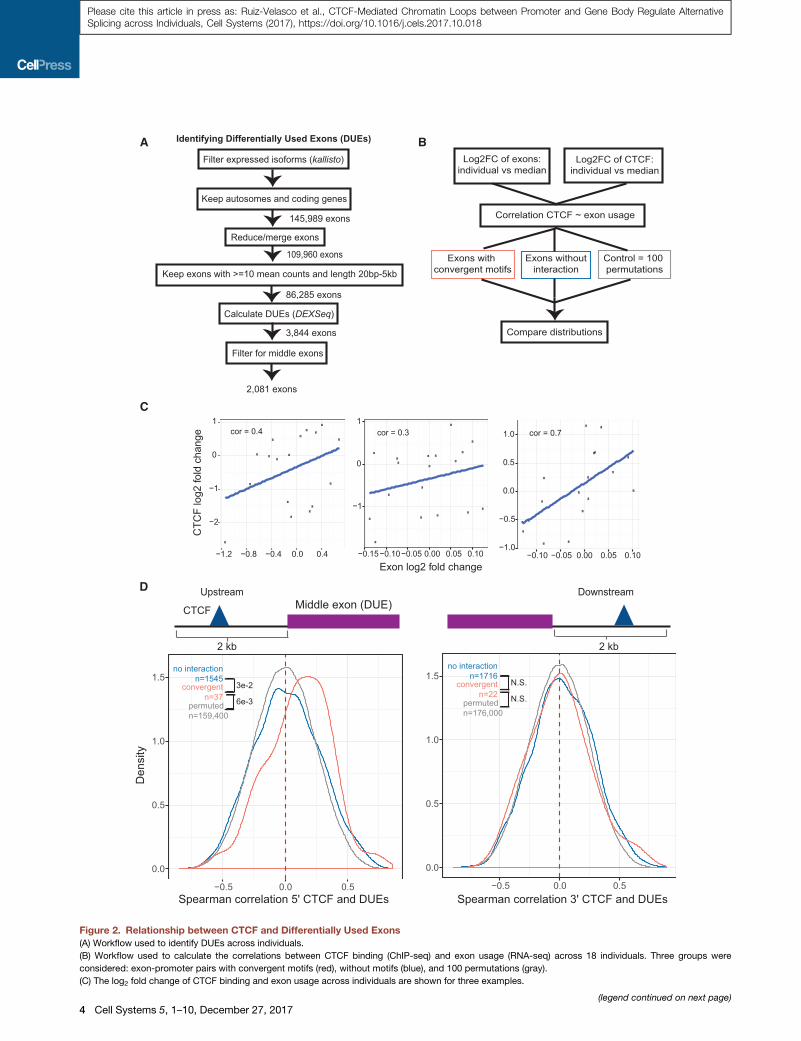
Figure 2. Relationship between CTCF and Differentially Used Exons
(A) Workflow used to identify DUEs across individuals.
(B) Workflow used to calculate the correlations between CTCF binding (ChIP-seq) and exon usage (RNA-seq) across 18 individuals. Three groups were
considered: exon-promoter pairs with convergent motifs (red), without motifs (blue), and 100 permutations (gray).
(C) The log2 fold change of CTCF binding and exon usage across individuals are shown for three examples.
(legend continued on next page)
4 Cell Systems 5, 1–10, December 27, 2017
Please cite this article in press as: Ruiz-Velasco et al., CTCF-Mediated Chromatin Loops between Promoter and Gene Body Regulate AlternativeSplicing across Individuals, Cell Systems (2017), https://doi.org/10.1016/j.cels.2017.10.018

Please cite this article in press as: Ruiz-Velasco et al., CTCF-Mediated Chromatin Loops between Promoter and Gene Body Regulate AlternativeSplicing across Individuals, Cell Systems (2017), https://doi.org/10.1016/j.cels.2017.10.018
To do so, we performed a joint allele-specific analysis at hetero-
zygous SNPs that overlapped with a CTCF peak within 2 kb up-
stream or downstream of an exon boundary and considered all
events that showed an allelic bias for CTCF binding at a nominal
p value of 0.05 (STARMethods: Allele-Specific Analysis of CTCF
Binding).
We observed a significant positive correlation between the
allelic fractions of CTCF and exon expression level for upstream
and, to a lesser extent, downstream regions (Pearson’s R = 0.5
and 0.3, respectively; top panel in Figure 3A). As a more robust
quantification we classified the exons according to the direction-
ality of the allelic bias in CTCF binding and assessed differences
in exon allelic fractions between the two groups by a t test
(bottom panel in Figures 3A and S3A). This revealed a significant
association only for the CTCF sites upstream of the exon.
When further grouping the exons into convergent and non-
looping (any other configuration), we found a strong association
between the allelic fractions of CTCF and exon usage for exons
in promoter:exon-upstream loops and not for others (Figure 3C,
left). This was even more pronounced for the association of
exons with Hi-C allelic biases (Figures 3B, 3C, and S3B; STAR
Methods: Allele-Specific Analysis of CTCF Binding). In summary,
we found a consistent allelic bias in CTCF, Hi-C, and exon usage
for exons in promoter:exons-upstream pairs in convergent orien-
tation, but not for other exons, which indicates that it is not the
loss of CTCF per se, but the loss of a CTCF-mediated promoter
interaction, that regulates exon usage—potentially through
changes in the chromatin environment (Figure 3B).
To experimentally validate these global correlations, we per-
formed 4C-seq (circular chromatin conformation capture com-
binedwith high-throughput sequencing) experiments for six indi-
viduals in a highly expressed gene that has a DUE (exon 5) in a
predicted promoter:exon-upstream loop, and exhibits high cor-
relation between CTCF and its DUE (THRAP3). We found exten-
sive chromatin interactions between the THRAP3 promoter and
several regions within the gene (Figure S3C). Notably, exon 5
showed a higher 4C-seq signal in individuals with more inclusion
of the exon (Figure 3D). No such difference in 4C-seq count was
observed for other exons (Figure S3D).
The findings above exemplify how a genetic variant can
disrupt CTCF binding upstream of an exon, which in turn pre-
vents the exon from being included in the transcript.
Functional Consequences of Genes and Exons withPredicted Promoter-Exon LoopsFinally, we sought to assess the potential impact of CTCF-loop-
regulated exons on the protein level. The analyses were carried
out for all exons involved in a predicted loop, regardless of their
expression status in LCLs (referred to as ‘‘unbiased set’’), and
corroborated with the LCL-specific set used in the analysis
above (STAR Methods: Functional Analyses). Corroborating
the CTCF-mediated splicing predictions, we found that for a
(D) Distribution of Spearman correlations between the log2 fold change of DUE
downstream (right) of the exon. The correlation values are grouped into converg
without motif pairs (blue; n = 1,545 and n = 1,716), and obtained from 100 sets of c
Convergently oriented upstream exons show a significant shift toward positive
significant [N.S.], Wilcoxon rank-sum test).
See also Figure S2.
large proportion of the loop-regulated exons a known protein
isoform exists that lacks the respective exon (Figure 4A).
These exons are more likely than others to overlap fully with a
missing region of a known alternative protein isoform (1.6-fold,
p = 4.2 3 10�2, Fisher’s exact test), suggesting that the loop-
regulated exons are indeed contributing to generate distinct pro-
tein isoforms.
We found that loop-regulatedexons tend tooverlapwith aPfam
protein domain more than expected (OR 1.8, p < 2.2 3 10�16
and OR 3.0, p < 2.2 3 10�16 for LCL-specific exons; Fisher’s
exact test), and in particular with kinase domains (OR = 2.3
and5.1; adjustedp value 2.2310�6 and3.0310�4, respectively).
A gene ontology analysis on the genes containing loop-
regulated exons revealed a strong enrichment for terms
related to ‘‘signaling’’ and ‘‘cellular response to stimuli’’
(Figures 4B, S4A, and S4C). Consequently, we found that
genes containing loop-regulatedexonsare predominantly associ-
ated with membrane, cell-periphery, or cell-projection structures
(Figure S4B).
In Figures 4C–4E we showcase three well-studied proteins
where the looped exon is absent from at least one of the known
isoforms: checkpoint kinase 2 (CHK2) has over 90 splice vari-
ants, 13 of which are annotated in Swiss-Prot/UniProt, and for
five of them the loop-regulated exon is missing (Figure 4C).
CDC-like kinase CLK3, involved in regulating the spliceosome,
has a known catalytically inactive isoform, which is caused by
a premature stop codon upon exclusion of exon 4 (Duncan
et al., 1995; Hanes et al., 1994), which is predicted to be loop
regulated (Figure 4D). The ratio of inclusion of exon 4 has been
proposed to control the differentiation process in multiple cell
types (Garcıa-Sacristan et al., 2005). Finally, euchromatic his-
tone-lysine N-methyltransferase 1 (EHMT1), involved in mono-
and dimethylation of H3K9, has four isoforms described in
Swiss-Prot, two of which involve a loop-regulated exon. Isoform
2 lacks the whole EHMT1 protein when excluding loop-regulated
exon 2 as a consequence of a premature stop codon, while iso-
form 4 skips the loop-regulated exon 26, thereby removing half
of the SET domain (Figure 4E), presumably eliminating the cata-
lytic activity while retaining the chromatin location and histone
tail-binding properties of the protein.
Overall, these examples illustrate that CTCF-mediated intra-
genic loop formation can impact on protein function, particularly
disrupting kinase domains and potentially playing a role in
cellular signaling and response to stimuli.
DISCUSSION
Chromatin topology and function are tightly linked to ensure
proper genomic regulation, but only few studies have shown a
direct link between chromatin organization and gene regulation
(Ruiz-Velasco and Zaugg, 2017). CTCF has been shown to
regulate alternative exon usage at the CD45 locus by Shukla
s and CTCF (as shown in C) are shown for CTCF bound upstream (left) and
ent (red; n = 37 and n = 22 upstream and downstream, respectively), exons
orrelations using permuted sample labels (gray; n = 159,400 and n = 176,000).
correlations (p < 0.05 are reported in the figure and otherwise stated as non-
Cell Systems 5, 1–10, December 27, 2017 5

Middle exon
2 kb2 kb
CTCF
xx
A
�
�
�
�
�
�
�
�
��
�
�
�
�
�
�
�
�
�
� �
�
�
�
�
� �
�
�
�
�
�
�
�
�
�
�
�
�
�
�
�
�
�
�
�
�
�
�
� �
�
�
�
�
�
�
��
�
�
�
�
�
�
�
�
��
�
�
�
�
�
�
�
��
�
�
�
� �
�
�
�
�
cor = 0.5
0
25
50
75
100
0 25 50 75 100CTCF [% allele 1]
Exo
n [%
alle
le 1
]
�
�
�
�
� �
�
�
�
�
�
�
�
�
�
�
�
�
�
�
�
�
�
�
�
�
�
�
�
�
�
�
�
�
�
�
�
�
�
cor = 0.3
0
25
50
75
100
0 25 50 75 100
37
50
pval=5e−4
0
25
50
75
100
0 25 50 75 100
Exon
[% a
llele
1]
17 22
N.S.
0
25
50
75
100
0 25 50 75 100
���
�
���
�
�� ��
�
��
�
� ��
�
��
�
������
���
����
��
���
��
�
���
�
��
�
�
��
���
�
��
�
���
��
��
���
cor = 0.5= 0 5c
C
B
SNP
x
CTCF
SNP
exon
HiC
Convergent Non looping
Alle
le 2
D
�
��
�
���
�
��
��
�
��
�� ��
�
��
�
�
�
��
�
��
�
��
�
���������
�
�����������
��
��� �
��
��
���
�
���
��������������������������
�
�
��
��
�
��� ��
��
��
��
��
�
Stratified by HiC
HiC allelic fractionallele1 < allele2allele1 > allele2
Chr1
36.69 mb
36.7 mb
36.71 mb
36.72 mb
36.73 mb
36.74 mb
36.75 mb
36.76 mb
36.77 mb
GE
NE
S
THRAP3
CTC
F4C
NO
RM
ALI
ZED
SIG
NA
L
V.P.
14 45
pval=1e-2 N.S.
17
33
0
25
50
75
100
conv
ergen
t
non_
loopin
gE
xon
[% a
llele
1]
CTCF positions
4C-s
eq a
t spe
cific
CTC
F si
te
Alle
le 1
Stratified by CTCF
0
25
50
75
100
conv
ergen
t
non_
loopin
g
Exo
n [%
alle
le 1
]
pval=1e-3 4e-2
5 32
3
47
�
*
0
2000
4000
6000 Stratified byexon 5
less included
more included
�
Exon 5
Upstream Downstream
CTCF allelicfraction
allele1 < allele2allele1 > allele2
1]25 50 75 1
���
�
��
��
�
���
�
��
�
��
��
�
�
�
�
��
��
.33cor = 0=cor 0c .
��
�
�
��
�
��
��
��
�
��
���
��
��
�
��
��
�
�������������
�
��
��
� x
Figure 3. Genetic Variants Jointly Affect CTCF Binding and Exon Inclusion
(A) Pearson correlations of allelic fraction estimates of exon expression levels (RNA-seq) and CTCF signal (ChIP-seq) for heterozygous SNPs contained within the
CTCF peaks are shown (n = 14 individuals). The schematic shows the window used for identifying allele-specific CTCF peaks. Plots show the percentage of reads
mapping to allele 1.
(legend continued on next page)
6 Cell Systems 5, 1–10, December 27, 2017
Please cite this article in press as: Ruiz-Velasco et al., CTCF-Mediated Chromatin Loops between Promoter and Gene Body Regulate AlternativeSplicing across Individuals, Cell Systems (2017), https://doi.org/10.1016/j.cels.2017.10.018

Please cite this article in press as: Ruiz-Velasco et al., CTCF-Mediated Chromatin Loops between Promoter and Gene Body Regulate AlternativeSplicing across Individuals, Cell Systems (2017), https://doi.org/10.1016/j.cels.2017.10.018
and colleagues, whereby CTCF bound downstream of the exon
was proposed to slow down RNA polymerase II (Pol II) by
creating a ‘‘roadblock,’’ consequently allowing weak splicing
sites to be recognized by the spliceosome (Shukla et al., 2011).
However, the roadblock model does not take into account the
major role of CTCF in chromatin 3D organization. Our data sug-
gest an additional role for CTCF bound upstream of an exon to
regulate its inclusion (Figure 4F), thus encompassing 3D chro-
matin organization by CTCF as a novel mechanism for splicing
regulation in addition to the previously proposed roadblock
model. Thus our study provides a functional link between intra-
genic chromatin 3D organization and splicing regulation.
We speculate that this mechanismworks via: (1) slowing down
RNA Pol II elongation, a well-established mechanism in splicing
regulation (Fong et al., 2014; Jonkers et al., 2014; Oesterreich
et al., 2016; Shukla et al., 2011), and (2) increasing the local con-
centration of splicing-promoting factors at the exon. Since
CTCF-binding sites represent boundary elements for the cohe-
sin-mediated loop extrusion process (Haarhuis et al., 2017), it
is possible that such cohesin-CTCF loop boundary acts as a
roadblock for slowing down RNA Pol II elongation, hence
affecting splicing. Furthermore, splicing factors are known to
localize at promoters (Huang et al., 2012; Kornblihtt et al.,
2013; Mikula et al., 2013) and could therefore regulate splicing
at distal exons when brought into close proximity by chromatin
looping. In support of this, it has been shown that the chromatin
environment upstream of alternative exons can affect exon
inclusion through splicing factor recruitment (Agirre et al.,
2015; Curado et al., 2015; Mercer et al., 2013). Indeed, we found
a correlation between signal strengths of histone marks that
characterize gene promoter activities (H3K4me3, H3K27ac)
and exon inclusion only in loop-regulated exons (Figure S2F).
Altogether, the results here demonstrate the intricate relation-
ship between chromatin structure, promoter state, and splicing
regulation.
However, while there is clear evidence that CTCF looping
affects alternative exon usage, our study faces several limita-
tions: the identification of novel splicing mechanisms at the
chromatin level is limited by both the resolution and coverage
of the datasets used in our analyses, and incomplete gene
and protein isoform annotations. It should also be noted that
various other mechanisms are likely to function in parallel or
in addition to the one proposed here, as reflected by the overall
moderate effect sizes reported in this study. For example,
CTCF-RNA interactions (Kung et al., 2015; Saldana-Meyer
et al., 2014) and/or the competition between intragenic
enhancer RNA expression could form additional levels of
splicing regulation, even though we did our best to avoid
masking the effects of CTCF looping on splicing by alternative
(B) Schematic summarizing the results of the allele-specific analysis. When the e
promoter, we observe a positive correlation between CTCF, exon usage, and H
promoter orientation (Figures S3A and S3B).
(C) Exon allelic fraction stratified by binned CTCF allelic fraction (n = 14 individuals
vice versa) are shown grouped by the configuration of the exon-promoter motif
(D) 4C-seq signals in 6 individuals stratified by amount of inclusion (‘‘more’’ or ‘‘less
CTCF peaks predicted to form a loop with the promoter (according to their highe
highlighted in red (V.P., viewpoint; *p < 0.05).
See also Figure S3.
transcription initiation events (i.e., using our CAGE filter; STAR
Methods: Annotation of Intragenic Loops). Finally, despite the
strong evidence obtained from genetic variation and the valida-
tion using 4C-seq, we have not tested the mechanism bio-
chemically by perturbing a CTCF-binding site.
This study provides a framework for further investigating alter-
native isoform usage in the context of diseases and develop-
ment. For instance, since CTCF binding is DNA-methylation sen-
sitive, DNA-methylation status in cancer or across development
could regulate alternative exon usage via CTCF-binding sites.
Thus, our model opens up the possibility that epigenomic
changes that affect chromatin 3D structures may play roles in
fine-tuning alternative splicing.
STAR+METHODS
Detailed methods are provided in the online version of this paper
and include the following:
d KEY RESOURCES TABLE
d CONTACT FOR REAGENT AND RESOURCE SHARING
d EXPERIMENTAL MODEL AND SUBJECT DETAILS
xon
iC
; left
pair.
’’) o
st s
B Lymphoblastoid Cell Lines
d METHOD DETAILS
B Annotation of Intragenic Loops
B Overlap with Chromatin Conformation Data
B Overlapping of CTCF Motifs with Splicing QTLs
B Identification of Differentially Used Exons
B CTCF Correlation with DUEs
B Allele Specific Analysis of CTCF Binding
B 4C-Seq Experiments
B 4C-Seq Data Analysis
B Functional Analyses
d QUANTIFICATION AND STATISTICAL ANALYSIS
d DATA AND SOFTWARE AVAILABILITY
SUPPLEMENTAL INFORMATION
Supplemental Information includes four figures and can be found with this
article online at https://doi.org/10.1016/j.cels.2017.10.018.
AUTHOR CONTRIBUTIONS
Conceptualization, J.B.Z. and M.R.-V.; Software and Formal Analysis, M.R.-V.
(genomic analyses), M.K. (functional protein analyses), P.B., A.B.S.-P., A.R.,
and S.K. (contributed to the analyses); Methodology, M.R.-V., J.B.Z., M.C.L.,
and K.M.N.; Validation, M.C.L. and M.R.-V.; Writing – Original Draft, J.B.Z.,
M.R.-V., and M.K.; Writing – Review and Editing, J.B.Z., M.R.-V., M.K., and
M.C.L.; Visualization, M.R.V., M.K., M.C.L., and J.B.Z.; Supervision, J.B.Z.,
K.-M.N., and T.J.G.
has an exon-upstream CTCF motif in a convergent configuration with its
signal. No such correlation is observed for any other (non-looping) exon-
) and binned HiC allelic fraction (n = 1 individual; right) (allele 1 > allele 2 and
f exon 5 for THRAP3 are shown for each CTCF site along the transcript. The
coring motif) are shown in blue for sense and red for antisense. Exon 5 is
Cell Systems 5, 1–10, December 27, 2017 7
A
C
D
mye
loid
cel
l ho
meo
stas
is
regulation of biological process
cellular response response to endogenous
stimulus
single organism signaling
single-organism cellular process
esta
blis
hmen
t of
loca
lizat
ion
sing
le−o
rgan
ism
deve
lopm
enta
l pr
oces
s
regu
latio
n of
m
olec
ular
func
tion
sing
le o
rgan
ism
sig
nalin
g
regulation of molecular function
response toendogenous stimulus
Ank-2 Ank-2 Pre-SET SETAnk-4
900100 200 300 400 500 600 700 800 1000 1100 1200
2 3 4 5 6 7 8 9 10 11 12 13 14 15 16 17 18 19 20 21 22 23 24 25 26 271
Histone-lysine N-methyltransferase (EHMT1)
loop exon loop exon
Lys
B
F
E
to stimulus
# of Exons
Mis
sing
isof
orm
regi
on
over
lap
with
loop
exo
n (%
)
Unb
iase
d se
tLC
L se
t
cell motility
establishment of localization
regulation of biological
quality
regulation of molecular function
single organism signaling
single−organism cellular process
cellularcomponent organization
cellular response to stimulus
developmental process
single organism signaling
regulation of molecular function
50 100 150 200 250 300 350 400 450 500 550 6600
1 2 3 4 5 6 7 8 9 10 11 12 13loop exon
Kinase domain
Human Clk3 kinase
Translation frame shifts due to exon exclusion
50 100 150 200 250 300 350 400 450 500
1 32 4 5 6 7 8 9 10 11 12 13loop exon
Kinase domain
Serine/threonine-protein kinase Chk2
single-organism
CTCF
Differentiallyused exon
PolII SNPSplicing factors
mRNA
Protein
X
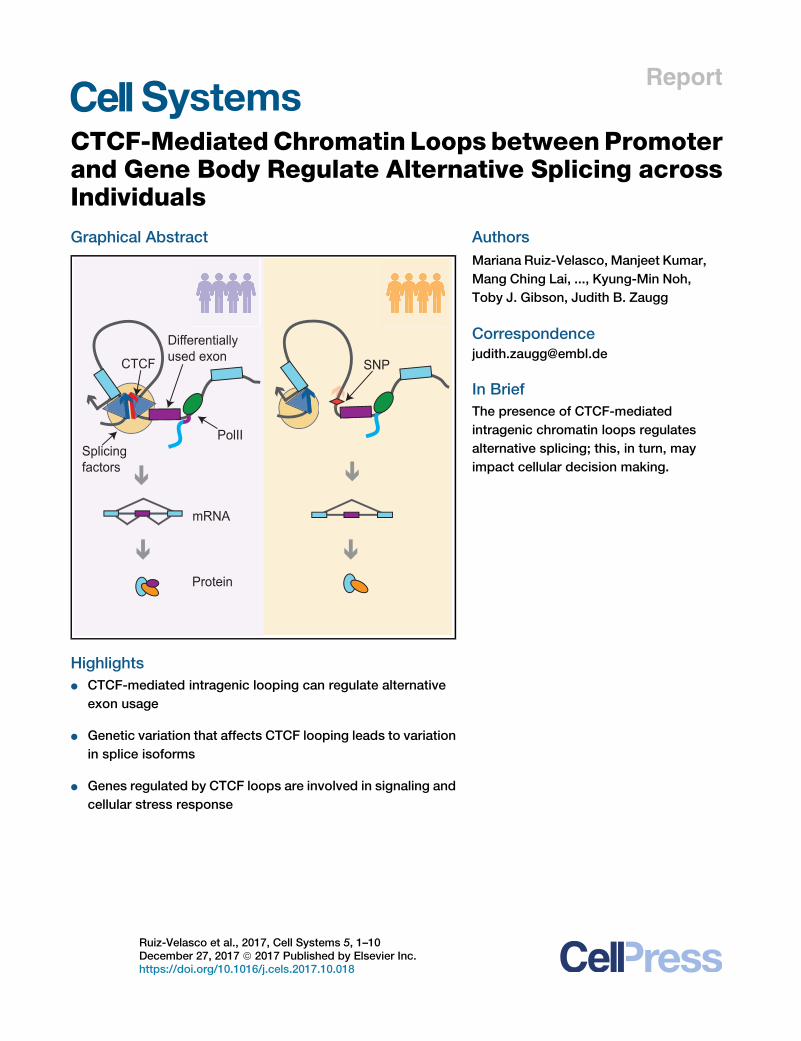
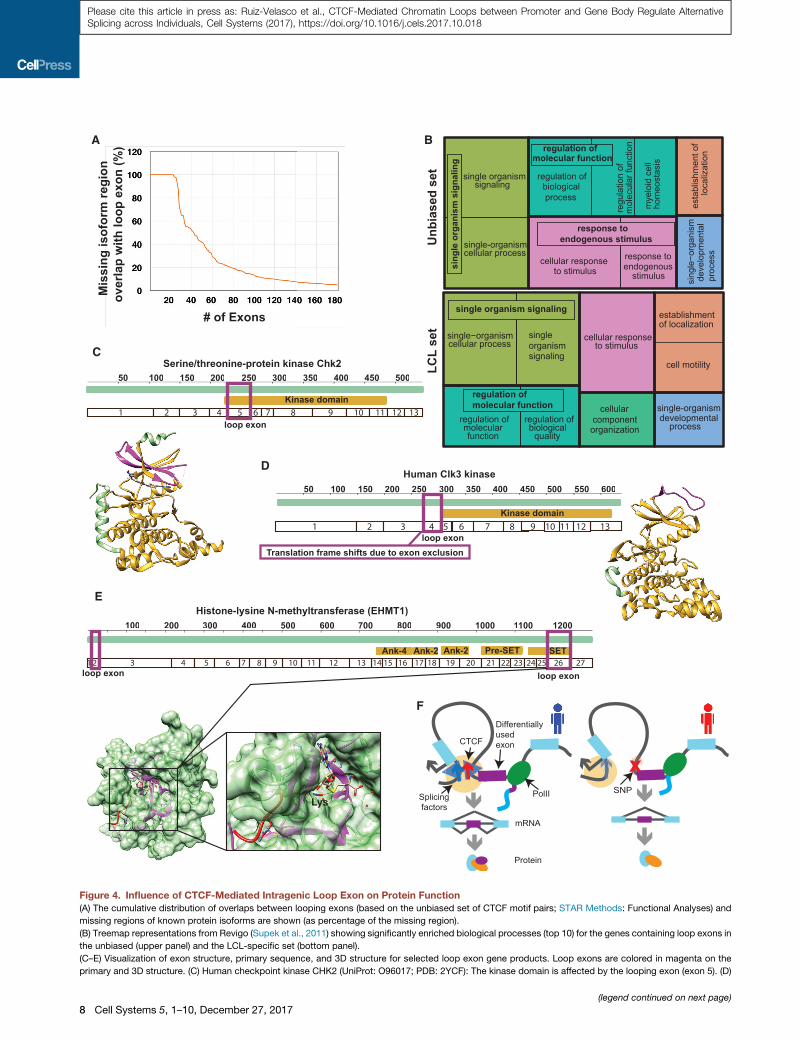
Figure 4. Influence of CTCF-Mediated Intragenic Loop Exon on Protein Function
(A) The cumulative distribution of overlaps between looping exons (based on the unbiased set of CTCF motif pairs; STAR Methods: Functional Analyses) and
missing regions of known protein isoforms are shown (as percentage of the missing region).
(B) Treemap representations from Revigo (Supek et al., 2011) showing significantly enriched biological processes (top 10) for the genes containing loop exons in
the unbiased (upper panel) and the LCL-specific set (bottom panel).
(C–E) Visualization of exon structure, primary sequence, and 3D structure for selected loop exon gene products. Loop exons are colored in magenta on the
primary and 3D structure. (C) Human checkpoint kinase CHK2 (UniProt: O96017; PDB: 2YCF): The kinase domain is affected by the looping exon (exon 5). (D)
(legend continued on next page)
8 Cell Systems 5, 1–10, December 27, 2017
Please cite this article in press as: Ruiz-Velasco et al., CTCF-Mediated Chromatin Loops between Promoter and Gene Body Regulate AlternativeSplicing across Individuals, Cell Systems (2017), https://doi.org/10.1016/j.cels.2017.10.018
Please cite this article in press as: Ruiz-Velasco et al., CTCF-Mediated Chromatin Loops between Promoter and Gene Body Regulate AlternativeSplicing across Individuals, Cell Systems (2017), https://doi.org/10.1016/j.cels.2017.10.018
ACKNOWLEDGMENTS
We thank Christian Arnold for help with using SNPhood, and Christian Valdes-
Quezada for advice on 4C-seq. We are thankful for the discussions and critical
comments from Erez Lieberman-Aiden, Suhas Rao, Job Dekker, Esa Pitkanen,
and Ricardo Saldana-Meyer. We acknowledge the Genecore facility and fund-
ing by EMBL. M.K. is funded by the Humboldt Foundation.
Received: July 29, 2016
Revised: August 2, 2017
Accepted: October 27, 2017
Published: November 29, 2017
REFERENCES
Agirre, E., Bellora, N., Allo, M., Pages, A., Bertucci, P., Kornblihtt, A.R., and
Eyras, E. (2015). A chromatin code for alternative splicing involving a putative
association between CTCF and HP1a proteins. BMC Biol. 13, 31.
Anders, S., Reyes, A., and Huber, W. (2012). Detecting differential usage of
exons from RNA-seq data. Genome Res. 22, 2008–2017.
Arnold, C., Bhat, P., and Zaugg, J.B. (2016). SNPhood: investigate, quantify
and visualise the epigenomic neighbourhood of SNPs using NGS data.
Bioinformatics 32, 2359–2360.
Bateman, A., Coin, L., Durbin, R., Finn, R.D., Hollich, V., Griffiths-Jones, S.,
Khanna, A., Marshall, M., Moxon, S., Sonnhammer, E.L.L., et al. (2004). The
Pfam protein families database. Nucleic Acids Res. 32, D138–D141.
Berman, H.M., Westbrook, J., Feng, Z., Gilliland, G., Bhat, T.N., Weissig, H.,
Shindyalov, I.N., and Bourne, P.E. (2000). The Protein Data Bank. Nucleic
Acids Res. 28, 235–242.
Bray, N.L., Pimentel, H., Melsted, P., and Pachter, L. (2016). Near-optimal
probabilistic RNA-seq quantification. Nat. Biotechnol. 34, 525–527.
Cunningham, F., Amode, M.R., Barrell, D., Beal, K., Billis, K., Brent, S.,
Carvalho-Silva, D., Clapham, P., Coates, G., Fitzgerald, S., et al. (2015).
Ensembl 2015. Nucleic Acids Res. 43, D662–D669.
Curado, J., Iannone, C., Tilgner, H., Valcarcel, J., and Guigo, R. (2015).
Promoter-like epigenetic signatures in exons displaying cell type-specific
splicing. Genome Biol. 16, 236.
Derrien, T., Johnson, R., Bussotti, G., Tanzer, A., Djebali, S., Tilgner, H.,
Guernec, G., Martin, D., Merkel, A., Knowles, D.G., et al. (2012). The
GENCODE v7 catalog of human long noncoding RNAs: analysis of their
gene structure, evolution, and expression. Genome Res. 22, 1775–1789.
Duncan, P.I., Howell, B.W., Marius, R.M., Drmanic, S., Douville, E.M., and Bell,
J.C. (1995). Alternative splicing of STY, a nuclear dual specificity kinase.
J. Biol. Chem. 270, 21524–21531.
Fang, H. (2014). dcGOR: an R package for analysing ontologies and protein
domain annotations. PLoS Comput. Biol. 10, e1003929.
FANTOM Consortium and the RIKEN PMI and CLST (DGT), Forrest, A.R.R.,
Kawaji, H., Rehli, M., Baillie, J.K., de Hoon, M.J.L., Haberle, V., Lassmann,
T., Kulakovskiy, I.V., Lizio, M., et al. (2014). A promoter-level mammalian
expression atlas. Nature 507, 462–470.
Fong, N., Kim, H., Zhou, Y., Ji, X., Qiu, J., Saldi, T., Diener, K., Jones, K., Fu,
X.-D., and Bentley, D.L. (2014). Pre-mRNA splicing is facilitated by an optimal
RNA polymerase II elongation rate. Genes Dev. 28, 2663–2676.
Garcıa-Sacristan, A., Fernandez-Nestosa, M.J., Hernandez, P., Schvartzman,
J.B., and Krimer, D.B. (2005). Protein kinase clk/STY is differentially regulated
during erythroleukemia cell differentiation: a bias toward the skipped splice
variant characterizes postcommitment stages. Cell Res. 15, 495–503.
Grubert, F., Zaugg, J.B., Kasowski, M., Ursu, O., Spacek, D.V., Martin, A.R.,
Greenside, P., Srivas, R., Phanstiel, D.H., Pekowska, A., et al. (2015).
Human CLK3 kinase (UniProt: P49761; PDB: 2EU9): The loop exon (exon 4) is alt
Euchromatic histone-lysine N-methyltransferase (EHMT1) (UniProt: Q9H9B1; PD
(F) Schematic of the proposed mechanism.
See also Figure S4.
Genetic control of chromatin states in humans involves local and distal chro-
mosomal interactions. Cell 162, 1051–1065.
Guo, Y., Xu, Q., Canzio, D., Shou, J., Li, J., Gorkin, D.U., Jung, I., Wu, H., Zhai,
Y., Tang, Y., et al. (2015). CRISPR inversion of CTCF sites alters genome topol-
ogy and enhancer/promoter function. Cell 162, 900–910.
Haarhuis, J.H.I., van der Weide, R.H., Blomen, V.A., Yanez-Cuna, J.O.,
Amendola, M., van Ruiten, M.S., Krijger, P.H.L., Teunissen, H., Medema,
R.H., van Steensel, B., et al. (2017). The cohesin release factor WAPL restricts
chromatin loop extension. Cell 169, 693–707.e14.
Hanes, J., von der Kammer, H., Klaudiny, J., and Scheit, K.H. (1994).
Characterization by cDNA cloning of two new human protein kinases.
Evidence by sequence comparison of a new family of mammalian protein ki-
nases. J. Mol. Biol. 244, 665–672.
Huang, Y., Li, W., Yao, X., Lin, Q.-J., Yin, J.-W., Liang, Y., Heiner, M., Tian, B.,
Hui, J., and Wang, G. (2012). Mediator complex regulates alternative mRNA
processing via the MED23 subunit. Mol. Cell 45, 459–469.
Ji, X., Dadon, D.B., Powell, B.E., Fan, Z.P., Borges-Rivera, D., Shachar, S.,
Weintraub, A.S., Hnisz, D., Pegoraro, G., Lee, T.I., et al. (2016). 3D chromo-
some regulatory landscape of human pluripotent cells. Cell Stem Cell 18,
262–275.
Jonkers, I., Kwak, H., and Lis, J.T. (2014). Genome-wide dynamics of Pol II
elongation and its interplay with promoter proximal pausing, chromatin, and
exons. Elife 3, e02407.
Kamburov, A., Stelzl, U., Lehrach, H., and Herwig, R. (2013). The
ConsensusPathDB interaction database: 2013 update. Nucleic Acids Res.
41, D793–D800.
Kasowski, M., Kyriazopoulou-Panagiotopoulou, S., Grubert, F., Zaugg, J.B.,
Kundaje, A., Liu, Y., Boyle, A.P., Zhang, Q.C., Zakharia, F., Spacek, D.V.,
et al. (2013). Extensive variation in chromatin states across humans. Science
342, 750–752.
Kornblihtt, A.R., Schor, I.E., Allo, M., Dujardin, G., Petrillo, E., and Munoz, M.J.
(2013). Alternative splicing: a pivotal step between eukaryotic transcription
and translation. Nat. Rev. Mol. Cell Biol. 14, 153–165.
Kung, J.T., Kesner, B., An, J.Y., Ahn, J.Y., Cifuentes-Rojas, C., Colognori, D.,
Jeon, Y., Szanto, A., del Rosario, B.C., Pinter, S.F., et al. (2015). Locus-specific
targeting to the X chromosome revealed by the RNA interactome of CTCF.
Mol. Cell 57, 361–375.
Langmead, B., and Salzberg, S.L. (2012). Fast gapped-read alignment with
Bowtie 2. Nat. Methods 9, 357–359.
Lawrence, M., Huber, W., Pages, H., Aboyoun, P., Carlson, M., Gentleman, R.,
Morgan, M.T., and Carey, V.J. (2013). Software for computing and annotating
genomic ranges. PLoS Comput. Biol. 9, e1003118.
Li, Y., Huang, W., Niu, L., Umbach, D.M., Covo, S., and Li, L. (2013).
Characterization of constitutive CTCF/cohesin loci: a possible role in estab-
lishing topological domains in mammalian genomes. BMC Genomics 14, 553.
Li, Y.I., van de Geijn, B., Raj, A., Knowles, D.A., Petti, A.A., Golan, D., Gilad, Y.,
and Pritchard, J.K. (2016). RNA splicing is a primary link between genetic vari-
ation and disease. Science 352, 600–604.
Mercer, T.R., Edwards, S.L., Clark, M.B., Neph, S.J., Wang, H., Stergachis,
A.B., John, S., Sandstrom, R., Li, G., Sandhu, K.S., et al. (2013). DNase I-hy-
persensitive exons colocalize with promoters and distal regulatory elements.
Nat. Genet. 45, 852–859.
Mifsud, B., Tavares-Cadete, F., Young, A.N., Sugar, R., Schoenfelder, S.,
Ferreira, L., Wingett, S.W., Andrews, S., Grey, W., Ewels, P.A., et al. (2015).
Mapping long-range promoter contacts in human cells with high-resolution
capture Hi-C. Nat. Genet. 47, 598–606.
Mikula, M., Bomsztyk, K., Goryca, K., Chojnowski, K., and Ostrowski, J.
(2013). Heterogeneous nuclear ribonucleoprotein (HnRNP) K genome-wide
ernatively used in protein isoforms that then lack the entire kinase domain. (E)
B: 3HNA): loop exons 2 and 26 produce isoforms that affect protein function.
Cell Systems 5, 1–10, December 27, 2017 9
Please cite this article in press as: Ruiz-Velasco et al., CTCF-Mediated Chromatin Loops between Promoter and Gene Body Regulate AlternativeSplicing across Individuals, Cell Systems (2017), https://doi.org/10.1016/j.cels.2017.10.018
binding survey reveals its role in regulating 30-end RNA processing and tran-
scription termination at the early growth response 1 (EGR1) gene through
XRN2 exonuclease. J. Biol. Chem. 288, 24788–24798.
Neems, D.S., Garza-Gongora, A.G., Smith, E.D., and Kosak, S.T. (2016).
Topologically associated domains enriched for lineage-specific genes reveal
expression-dependent nuclear topologies during myogenesis. Proc. Natl.
Acad. Sci. USA 113, E1691–E1700.
Nora, E.P., Lajoie, B.R., Schulz, E.G., Giorgetti, L., Okamoto, I., Servant, N.,
Piolot, T., van Berkum, N.L., Meisig, J., Sedat, J., et al. (2012). Spatial partition-
ing of the regulatory landscape of the X-inactivation centre. Nature 485,
381–385.
Oesterreich, F.C., Herzel, L., Straube, K., Hujer, K., Howard, J., and
Neugebauer, K.M. (2016). Splicing of nascent RNA coincides with intron exit
from RNA polymerase II. Cell 165, 372–381.
Quinlan, A.R., and Hall, I.M. (2010). BEDTools: a flexible suite of utilities for
comparing genomic features. Bioinformatics 26, 841–842.
Rao, S.S.P., Huntley, M.H., Durand, N.C., Stamenova, E.K., Bochkov, I.D.,
Robinson, J.T., Sanborn, A.L., Machol, I., Omer, A.D., Lander, E.S., et al.
(2014). A 3D map of the human genome at kilobase resolution reveals princi-
ples of chromatin looping. Cell 159, 1665–1680.
Ruiz-Velasco, M., and Zaugg, J.B. (2017). Structuremeets function: how chro-
matin organisation conveys functionality. Curr. Opin. Syst. Biol. 1, 129–136.
Saldana-Meyer, R., Gonzalez-Buendıa, E., Guerrero, G., Narendra, V.,
Bonasio, R., Recillas-Targa, F., and Reinberg, D. (2014). CTCF regulates the
human p53 gene through direct interaction with its natural antisense transcript,
Wrap53. Genes Dev. 28, 723–734.
Shukla, S., Kavak, E., Gregory,M., Imashimizu,M., Shutinoski, B., Kashlev,M.,
Oberdoerffer, P., Sandberg, R., and Oberdoerffer, S. (2011). CTCF-promoted
RNA polymerase II pausing links DNA methylation to splicing. Nature
479, 74–79.
Soneson, C., Matthes, K.L., Nowicka, M., Law, C.W., and Robinson, M.D.
(2016). Isoform prefiltering improves performance of count-based methods
for analysis of differential transcript usage. Genome Biol. 17, 12.
10 Cell Systems 5, 1–10, December 27, 2017
Splinter, E., Heath, H., Kooren, J., Palstra, R.-J., Klous, P., Grosveld, F.,
Galjart, N., and de Laat, W. (2006). CTCFmediates long-range chromatin loop-
ing and local histone modification in the beta-globin locus. Genes Dev. 20,
2349–2354.
Splinter, E., de Wit, E., van de Werken, H.J.G., Klous, P., and de Laat, W.
(2012). Determining long-range chromatin interactions for selected genomic
sites using 4C-seq technology: from fixation to computation. Methods 58,
221–230.
Supek, F., Bo�snjak, M., �Skunca, N., and �Smuc, T. (2011). REVIGO summarizes
and visualizes long lists of gene ontology terms. PLoS One 6, e21800.
Tang, Z., Luo, O.J., Li, X., Zheng, M., Zhu, J.J., Szalaj, P., Trzaskoma, P.,
Magalska, A., Wlodarczyk, J., Ruszczycki, B., et al. (2015). CTCF-mediated
human 3D genome architecture reveals chromatin topology for transcription.
Cell 163, 1611–1627.
UniProt Consortium (2015). UniProt: a hub for protein information. Nucleic
Acids Res. 43, D204–D212.
Walter,C.,Schuetzmann,D.,Rosenbauer, F., andDugas,M. (2014).Basic4Cseq:
an R/Bioconductor package for analyzing 4C-seq data. Bioinformatics 30,
3268–3269.
van de Werken, H.J.G., Landan, G., Holwerda, S.J.B., Hoichman, M., Klous,
P., Chachik, R., Splinter, E., Valdes-Quezada, C., Oz, Y., Bouwman, B.A.M.,
et al. (2012). Robust 4C-seq data analysis to screen for regulatory DNA inter-
actions. Nat. Methods 9, 969–972.
de Wit, E., Vos, E.S.M., Holwerda, S.J.B., Valdes-Quezada, C., Verstegen,
M.J.A.M., Teunissen, H., Splinter, E., Wijchers, P.J., Krijger, P.H.L., and de
Laat, W. (2015). CTCF binding polarity determines chromatin looping. Mol.
Cell 60, 676–684.
Yates, A., Beal, K., Keenan, S., McLaren, W., Pignatelli, M., Ritchie, G.R.S.,
Ruffier, M., Taylor, K., Vullo, A., and Flicek, P. (2015). The Ensembl REST
API: Ensembl data for any language. Bioinformatics 31, 143–145.
Yusufzai, T.M., Tagami, H., Nakatani, Y., and Felsenfeld, G. (2004). CTCF
tethers an insulator to subnuclear sites, suggesting shared insulator mecha-
nisms across species. Mol. Cell 13, 291–298.

Please cite this article in press as: Ruiz-Velasco et al., CTCF-Mediated Chromatin Loops between Promoter and Gene Body Regulate AlternativeSplicing across Individuals, Cell Systems (2017), https://doi.org/10.1016/j.cels.2017.10.018
STAR+METHODS
KEY RESOURCES TABLE
REAGENT or RESOURCE SOURCE IDENTIFIER
Chemicals, Peptides, and Recombinant Proteins
Dpn II enzyme (50,000 U/mL) New England Biolabs R0543M
Phusion High-Fidelity DNA polymerase New England Biolabs M0530S
Q5 High-Fidelity DNA polymerase New England Biolabs M0491S
QiaQuick PCR purification kit Qiagen 28104
T4 DNA ligase HC 30 U / mL ThermoFisher EL0013
Nla III enzyme (10,000 U/mL) New England Biolabs R0125L
Deposited Data
CTCF ChIP-seq 18 LCLs Kasowski et al., 2013 GEO: GSE50893
RNA-seq 18 LCLs Kasowski et al., 2013 GEO: GSE50893
PolII ChIP-seq 18 LCLs Kasowski et al., 2013 GEO: GSE50893
H3K27ac ChIP-seq 18 LCLs Kasowski et al., 2013 GEO: GSE50893
H3K4me1 ChIP-seq 18 LCLs Kasowski et al., 2013 GEO: GSE50893
H3K4me3 ChIP-seq 18 LCLs Kasowski et al., 2013 GEO: GSE50893
H3K36me3 ChIP-seq 18 LCLs Kasowski et al., 2013 GEO: GSE50893
SA1 ChIP-seq 18 LCLs Kasowski et al., 2013 GEO: GSE50893
Genotype 14 LCLs 1000 Genomes project http://www.internationalgenome.org/data
Rad21 ChIA-PET GM12878 Grubert et al., 2015 GEO: GSE62742
H3K4me3 ChIA-PET GM12878 Grubert et al., 2015 GEO: GSE62742
CTCF ChIA-PET GM12878 Tang et al., 2015 GEO: GSE72816
HiC GM12878 Rao et al., 2014 GEO: GSE63525
CHiC GM12878 Mifsud et al., 2015 E-MTAB-2323
4C-seq 6 LCLs This study ENA: PRJEB22940
CAGE peaks human FANTOM Consortium http://fantom.gsc.riken.jp/5/datafiles/latest/extra/
CAGE_peaks/
Splicing QTLs LCLs Li et al., 2016 http://eqtl.uchicago.edu/jointLCL/
Experimental Models: Cell Lines
Lymphoblastoid Cell Lines Coriell Biorepository cat.ID: GM12878; RRID: CVCL_7526, GM12891;
RRID: CVCL_9633, GM12892; RRID: CVCL_9631,
GM19238; RRID: CVCL_9633, GM19239;
RRID: CVCL_9634 and GM19240; RRID: CVCL_9635
Oligonucleotides
Primer: THRAP3 Forward:
AATGATACGGCGACCACCGAGATCT
ctaacttccatcagaggcgctcac
This study, Eurofins Genomics N/A
Primer: THRAP3_i2 Reverse:
CAAGCAGAAGACGGCATACGAGATACATCG
attggcctggttcggtcttctc
This study, Eurofins Genomics N/A
Primer: THRAP3_i4 Reverse:
CAAGCAGAAGACGGCATACGAGATTGGTCA
attggcctggttcggtcttctc
This study, Eurofins Genomics N/A
Primer: THRAP3_i5 Reverse:
CAAGCAGAAGACGGCATACGAGATCACTGT
attggcctggttcggtcttctc
This study, Eurofins Genomics N/A
Primer: THRAP3_i6 Reverse:
CAAGCAGAAGACGGCATACGAGATATTGGC
attggcctggttcggtcttctc
This study, Eurofins Genomics N/A
(Continued on next page)
Cell Systems 5, 1–10.e1–e6, December 27, 2017 e1

Continued
REAGENT or RESOURCE SOURCE IDENTIFIER
Primer THRAP3_i7 Reverse:
CAAGCAGAAGACGGCATACGAGATGATCTG
attggcctggttcggtcttctc
This study, Eurofins Genomics N/A
Primer THRAP3_i12 Reverse:
CAAGCAGAAGACGGCATACGAGATTACAAG
attggcctggttcggtcttctc
This study, Eurofins Genomics N/A
Software and Algorithms
R The R Project http://www.R-project.org/
Bioconductor Bioconductor https://www.bioconductor.org/
SNPhood Arnold et al., 2016 https://bioconductor.org/packages/SNPhood
PWMScan PWMTools http://ccg.vital-it.ch/pwmtools/pwmscan.php
Kallisto Bray et al., 2016 https://pachterlab.github.io/kallisto/
DEXSeq Anders et al., 2012 https://bioconductor.org/packages/DEXSeq
intersectBed (Bedtools) Quinlan and Hall, 2010 http://bedtools.readthedocs.io/en/latest/content/
tools/intersect.html
GenomicRanges Lawrence et al., 2013 https://bioconductor.org/packages/GenomicRanges
FastQC Babraham bioinformatics https://www.bioinformatics.babraham.ac.uk/projects/
fastqc/
Bowtie2 Langmead and Salzberg, 2012 http://bowtie-bio.sourceforge.net/bowtie2/index.shtml
ConsensusPathDB Kamburov et al., 2013 http://cpdb.molgen.mpg.de/
Perl Cunningham et al., 2015;
Yates et al., 2015
https://www.perl.org/
UNIPROT UniProt Consortium http://www.uniprot.org/
Pfam Bateman et al., 2004 http://pfam.xfam.org/
Revigo Supek et al., 2011 http://revigo.irb.hr/
Chimera Berman et al., 2000 https://www.cgl.ucsf.edu/chimera/
RCSB-PDB RCSB-PDB www.rcsb.org
dcGOR Fang, 2014 https://github.com/hfang-bristol/dcGOR
Basic4CSeq Walter et al., 2014 https://bioconductor.org/packages/Basic4CSeq
Other
GENCODE v19 GENCODE https://www.gencodegenes.org/releases/19.html
Please cite this article in press as: Ruiz-Velasco et al., CTCF-Mediated Chromatin Loops between Promoter and Gene Body Regulate AlternativeSplicing across Individuals, Cell Systems (2017), https://doi.org/10.1016/j.cels.2017.10.018
CONTACT FOR REAGENT AND RESOURCE SHARING
Further information and requests for resources, reagents, and code should be directed to and will be fulfilled by the Lead Contact,
Judith B. Zaugg ([email protected]).
EXPERIMENTAL MODEL AND SUBJECT DETAILS
Lymphoblastoid Cell LinesHuman lymphoblastoid cell lines obtained from B-lymphocytes were purchased from Coriell Biorepository, cat. ID: GM12878
(Female (F)), GM12891 (Male (M)), GM12892 (F), GM19238 (F), GM19239 (M) and GM19240 (F). Cells were cultured in RPMI 1640
medium with 30% Fetal Bovine Serum, 1 % penicillin and streptomycin (ThermoFisher) at 37�C 5% CO2.
METHOD DETAILS
Annotation of Intragenic LoopsFor the identification of CTCF peaks binding along transcripts, we defined four genic regions: promoter (+/- 1kb from transcription
start site (TSS)), end of transcript (+/- 1kb of transcription termination site (TTS)), upstream, and downstream regions of exons (either
2 kb from outside the exon boundaries - when the intron was longer than 2kb - or the actual size of the intron in case it was shorter).
We expect all promoters to fall within the TSS region and to avoid any overlaps between the promoter and exon regions, we removed
e2 Cell Systems 5, 1–10.e1–e6, December 27, 2017
Please cite this article in press as: Ruiz-Velasco et al., CTCF-Mediated Chromatin Loops between Promoter and Gene Body Regulate AlternativeSplicing across Individuals, Cell Systems (2017), https://doi.org/10.1016/j.cels.2017.10.018
any region associated with first exons, first introns and anything within 5kb from the TSS from the set of exonic regions. Additionally,
we filtered out exons intersecting with CAGE peaks (FANTOMConsortium and the RIKENPMI andCLST (DGT) et al., 2014) to prevent
mis-classifying non-annotated promoters as exons.
To minimize the number of non-functional CTCF binding sites, we only considered sites that overlap with a CTCF peak in LCLs
obtained from our previous study (Kasowski et al., 2013). We then intersected the CTCF peaks with each of these windows and as-
signed the highest scoring motif (MA0139.1) to each peak by using the PWMScan tool (http://ccg.vital-it.ch/pwmtools/pwmscan.
php) (cut-off of 93.13% with non-overlapping matches). Motifs having a score of >= 500 (LCL-specific set) or >= 1000 were further
used.
Given that CTCF binds to an asymmetric motif, it is possible to assign a directionality. We did so by defining directionality relative to
the gene strand thus rendering sense CTCF motifs if both the motif and the gene lie in the same strand and antisense vice versa. We
grouped the CTCF motif-pairs according to their genic region into: promoter:exon-upstream, promoter:exon-downstream, pro-
moter-TTS, exon-upstream:TTS, and exon-downstream:TTS (schematic in Figure 1).We next classified themotif pairs based on their
relative orientation to each other as ‘‘convergent’’, ‘‘divergent’’, ‘‘both sense’’, and ‘‘both antisense’’. For this analysis, we excluded
any pair of motifs with a distance smaller than 5kb to allow for potential chromatin looping, and we only kept unique pairs.
Overlap with Chromatin Conformation DataFor validation we overlapped the predicted loops with existing chromatin conformation data requiring that each motif of a CTCF
motif-pair overlapped one side of the same interaction. We used cohesin subunit Rad21 and histone mark H3K4me3 ChIA-PET
(Grubert et al., 2015), and CTCF (Tang et al., 2015) ChIA-PET and Capture Hi-C (CHiC) data (Mifsud et al., 2015). Briefly, CHiC
uses oligonucleotides close to several promoters to amplify the reads obtained close to the TSS.
Overlapping of CTCF Motifs with Splicing QTLsBased on earlier studies suggesting that CTCF is capable of binding to sequences as long as 40-60bp (Li et al., 2013), we intersected
a 40bpCTCFmotif (+/-20bp from center of the canonical motif) with the list of splicing QTLs (sQTLs) (Li et al., 2016).We considered all
sQTLs above an FDR of 10% as described in their methods.
Identification of Differentially Used ExonsWe obtained RNA-seq data (strand-specific and paired-end reads) for lymphoblastoid cell lines of 18 individuals from (Kasowski
et al., 2013). We selected protein coding genes using the genome annotation provided in Gencode v19. We first filtered out lowly
expressed isoforms as described in (Soneson et al., 2016) by applying the kallisto tool to all RNA-seq files (Bray et al., 2016), only
keeping transcripts which were expressed in at least 10 out of the 18 individuals. We used custom scripts to generate a set of
non-overlapping exon boundaries. This involved first splitting exons into individual parts (since some exons can be part of multiple
transcripts and can have several annotated 5’ and 3’ boundaries) and thenmerging them again into units that contain themost 5’ and
the most 3’ annotated boundary for each exon. Chromosomes X, Y and mitochondrial DNA were filtered out.
Based on current knowledge about exon length distribution (Derrien et al., 2012), we further removed exons that were less than 20
or more than 5,000bp long. These annotation and filtering steps resulted in a set of 109,960 exons. We then used DEXSeq (Anders
et al., 2012) to count the reads falling into each of these exons for each of the replicates of the 18 individuals. As an additional filtering
step, we excluded exons with less than 10 counts on average, leaving 86,285 exons for further processing (for a total of 9,198 genes)
of which 62,663 (73%) were middle exons.
DifferentiallyUsed Exons (DUEs) as described in (Anders et al., 2012), are defined as a change in exon usage whereby exon usage
is defined as the ratio of reads mapping to a particular exon vs reads mapping anywhere else in a gene. To obtain the DUEs we used
DEXSeq and compared the exon usage for each individual against the median across all the 18 individuals (Figure 2A). The such ob-
tained log2 fold-change valueswere used for the correlation between exon andCTCF usage (see CTCF correlationwith DUEs below).
We considered exons to be differentially used when their adjusted p-value was below 0.1 (Benjamini Hochberg correction), leaving a
total of 3,844 DUEs. In order to keep only the middle DUEs, exons were intersected with the TSS and TTS from the Gencode v19
annotation and respectively labelled as first, middle, and last exons. For further analysis, we excluded the first and last exons, consid-
ering only the 2,081 middle DUEs.
These DUEs cover 14% (1148) of expressed genes with multiple exons. From these 1148 genes, most have less than 10 DUEs
(Figure S2A), and no strong correlation between the number of middle exons per gene and number of differentially used exons
was observed (Figure S2B). The size distribution of DUEs is similar to the overall size distribution of exons and consistent with pre-
vious observations (Derrien et al., 2012) (Figure S2C).
CTCF Correlation with DUEsTo calculate the log2 fold-change per exon in each of the individuals against the median expression based on their DEXSeq
counts, we estimated the exon fold-changes as described above and in (Anders et al., 2012). As a quality control, we checked
the distribution of fold-changes with respect to the median for each individual and found that it shows similar patterns for all of
them (Figure S2D).
For the quantification of the ChIP-seq read counts of CTCF and RNA PolII binding around the exons, we used SNPhood
(Arnold et al., 2016). We extracted the reads of CTCF falling within 2kb downstream or upstream of the 5’ and 3’ boundaries of exons
Cell Systems 5, 1–10.e1–e6, December 27, 2017 e3
Please cite this article in press as: Ruiz-Velasco et al., CTCF-Mediated Chromatin Loops between Promoter and Gene Body Regulate AlternativeSplicing across Individuals, Cell Systems (2017), https://doi.org/10.1016/j.cels.2017.10.018
respectively. We then calculated the log2 fold-change of CTCF counts between each individual and the median individual, similar as
described for the RNA-seq data. These fold-changes were then correlated with the fold-changes of the exon.
The same procedure was applied to other genomic features (PolII, SA1, H3K4ME1, H3K4ME3, H3K36ME3, H3K27AC) from paired
data (Figure S2F). Note that only cases where the median factor read counts were 10 or more were considered. For each exon,
we generated 100 sets of permutations for fold-changes in exon usage between individuals, keeping the number of individuals
with positive and negative fold-change constant at each exon. This empirical distribution was then used to assess the significance
of the correlations by applying Wilcoxon tests.
Allele Specific Analysis of CTCF BindingWe first extracted all heterozygous SNPs from the genotypes of the 14 individuals (1000 Genomes project), for which genotypes were
available, and intersected them with the CTCF peaks from the ChIP-seq data. 80% of all the peaks (158,455) contained 1 or more
heterozygous SNPs in at least one individual. We then kept the SNPs closest to the midpoint of the motif that was predicted to
form an intragenic interaction.
UsingSNPhood, we analysedwhether therewas an allelic bias for the read counts extracted in the region of +/- 250 bp surrounding
the SNP. Briefly, SNPhood performs a binomial test to assess whether the allelic fractions are deviating from the expected 0.5. We
selected all CTCF peaks within 2kb upstream or downstream of an exon boundary that overlapped with a heterozygous SNP in at
least one individual, calculated the allelic bias and filtered the peaks based on a nominal p-value cutoff of 0.05, which resulted in
a set of 9,434 upstream and 7,689 downstream allele-specific bound CTCF peaks. This set of peaks served as a basis for the cor-
relation with exon allelic bias.
To calculate the allelic bias for exons, we split the RNA-seq alignment files by allele to which they map (allele information was ob-
tained from (Kasowski et al., 2013)) using samtools split and then used bedtools (intersectBed) (Quinlan and Hall, 2010) to extract the
counts. To assess exon allelic bias we performed a binomial test that resulted in 1,327 and 664 events upstream and downstream
respectively (at nominal p-value < 0.05). To avoid low-count artefacts, we only kept SNPs that had at least 5 mean read counts.
To verify whether there was an enrichment of allele specific CTCF binding in the 2kb upstream or downstream of the exons, we
identified middle exons that overlap with CTCF peaks using GenomicRanges. Only those cases where the individual was heterozy-
gous for the SNP and both CTCF and exon were allele specific were taken into account. As described in the main text, to obtain a
more robust quantification we classified the exons according to the directionality of the allelic bias in CTCF binding and assessed
differences in exon allelic fractions between the two groups by a t-test (bottom panel Figures 3A and S3A). This revealed a significant
association only for the CTCF sites upstream of the exon.
For the genome-wide correlation of HiC signal with CTCF binding in an allele specific manner, we used the GM12878 diploid HiC
maps at 5kb resolution (Rao et al., 2014) and the CTCF and exon counts as mentioned above. We calculated normalised interaction
frequencies with Knight-Ruiz normalisation vectors and we followed the same procedure described by the authors in their supple-
mental methods. We obtained the allelic fraction by calculating the ratio of maternal counts with respect to the total counts. Next, we
selected the CTCF peaks binding in +/-2kb from all middle exons that contained SNPs for which GM12878 was heterozygous. We
finally stratified either the CTCF or the exon allelic fraction based on the HiC allelic fraction as described above (Figure S3B).
4C-Seq Experiments4C-seq was performed using 6 human LCLs (see Experimental Model and Subject Details). The protocol was modified from (van de
Werken et al., 2012). All chemicals and reagents were purchased from Sigma Aldrich unless otherwise stated in brackets. To perform
crosslinking of chromatin, 10million cells per cell line were fixed in 5mL 2% formaldehyde (VWR) at room temperature for 10minutes.
250 mL of 2.5M glycine was added to quench the crosslinking reaction for 3minutes at room temperature. Cells were washed twice in
ice cold PBS and were snap frozen using liquid nitrogen prior to 4C experiments.
To perform in nucleus Dpn II restriction digest of crosslinked genomic DNA, 10million cells per cell line were first lysed in 5 mL lysis
buffer [10 mM pH 7.5 Tris-HCl, 10 mM NaCl, 0.2% NP-40, 1X complete EDTA-free protease inhibitor (Roche)] for 30 minutes on ice.
Nuclei were centrifuged at 600 rcf for 6 minutes at 4�C. Supernatant was discarded and the nuclei were then resuspended in 1 mL
residual supernatant. The samples were then centrifuged again at 600 rcf for 6 minutes at 4�C and the supernatant was discarded.
The nuclei pellets were washed in 200 mL of 1.25X Dpn II Buffer (NEB) without resuspension at 600 rcf for 1 minute at 4�C. The nuclei
pellets were then resuspended gently in 492.5 mL of 1.25XDpn II Buffer with 0.3%sodiumdodecyl sulfate. Themixturewas incubated
at 37�C and 950 rpm in a thermomixer (Eppendorf) with heated lid for 1 hour. 50 mL 20% Triton X-100 was then added to the mixture
and was further incubated for 1 hour at 37�C and 950 rpm. Dpn II restriction digest was then performed by the addition of 45 mL
nuclease free water (Ambion) and 10 mL DpnII enzyme (NEB), and the reaction was incubated at 37�C and 950 rpm for 3 - 5 hours
with heated lid in the thermomixer. An addition 10 mL of DpnII was added to themixture and was further incubated in the thermomixer
overnight.
To ligate digested DNA for generating a 3C template, the mixture was heat inactivated for 20 minutes at 65�C, followed by centri-
fugation at 600 rcf for 6 minutes at 4�C. Supernatant was removed, leaving 50 mL. Ligation reaction mixture of 950 mL [50 mM pH 7.5
Tris-HCl, 10 mM MgCl2, 1 mM ATP (NEB) and 5 mM dithiolthreitol, 0.1 mg/mL bovine serum albumin (NEB) and 150 U/mL T4 DNase
ligase HC (ThermoFisher)] was added to the samples and was incubated overnight at 16�C and 600 rpm in the thermomixer.
To reverse crosslink, the samples were incubated with 200mg proteinase K (ThermoFisher) and 50 mL 20%sodium dodecyl sulfate
at 65�C for 1 hour. The samples were then incubated with 100 mg RNase A (Qiagen) for 45 minutes at 37�C.
e4 Cell Systems 5, 1–10.e1–e6, December 27, 2017

Please cite this article in press as: Ruiz-Velasco et al., CTCF-Mediated Chromatin Loops between Promoter and Gene Body Regulate AlternativeSplicing across Individuals, Cell Systems (2017), https://doi.org/10.1016/j.cels.2017.10.018
To purify the 3C template, a phenol chloroform extraction method was performed where 1 volume of phenol:chloroform:isoamyl
alcohol 25:24:1 saturated with 10 mM Tris pH 8.0, 1 mM EDTA was added to the samples and were mixed thoroughly by vortexing.
The mixture was transferred to a 2 mL heavy phase lock gel tube (5-Prime) and was centrifuged at 16,000 rcf for 5 minutes at room
temperature. The top clear aqueous phase containing DNA was transferred to a clean eppendorf. NaCl of a final concentration of
200 mM, together with 1 mL of 20 mg/mL glycogen was added to the aqueous DNA solution, followed by the addition of 2 volume
of -20�C 100% ethanol. The mixture was incubated at -80�C for at least 1 hour and was centrifuged at 15,000 rpm for 1 hour at
4�C. The supernatant was removed and 500 mL -20�C 80% ethanol was added to wash the DNA pellet at 15,000 rpm for 60 minutes
at 4�C. The supernatant was then removed and the tubes were centrifuged again for 30 minutes at 15,000 rpm at 4�C. The residual
supernatant was then removed and the DNA pellet was allowed to be air dried for 5minutes at room temperature. To resuspend DNA,
50 mL 65�C 10 mM pH 7.5 Tris-HCl was added to the DNA pellet and the solution was incubated at 65�C for 5 minutes to dissolve the
pellet. Digestion and ligation efficiencies were determined by agarose gel electrophoresis.
To perform the 2nd round of restriction digestion with NlaIII enzyme (NEB), 5 mL 10 U/mL NlaIII and 6 mL 10X NlaIII buffer (NEB) was
added to 50 mL 3C template, and the reaction was incubated at 37�C overnight. NlaIII was heat inactivated at 65�C for 20 minutes.
To generate 4C template, 5X ligation buffer [250 mM Tris-HCl, 50 mM MgCl2, 5 mM ATP, 25 mM dithiolthreitol], 5 mL 10 mg/mL
bovine serum albumin (NEB) and 2.5 mL 150 U/mL T4 DNase ligase HC (ThermoFisher) were added to 50 mL NlaIII digested 3C tem-
plate and the reaction was incubated overnight at 16�C.To purify 4C DNA template, DNA purification was performed as described above. The final 4C template was further purified using
the QIAquick PCR purification kit (Qiagen) according to the manufacturer’s instruction. Digestion and ligation efficiencies were as-
sessed by agarose gel electrophoresis.
To design primers for performing 4C-PCR, the viewpoint sequence of the THRAP3 gene was first chosen using THRAP3 sequence
obtained from the UCSC genome browser (https://genome.ucsc.edu/index.html) on the humanGRCh37/hg19 assembly. Restriction
site identification and THRAP3 sequence were processed using ApE-A plasmid editor (http://biologylabs.utah.edu/jorgensen/
wayned/ape/). 4C-PCR primers were designed using primer3 v. 0.4.0 (http://bioinfo.ut.ee/primer3-0.4.0/). Viewpoint and primer
sequences were chosen and designed, respectively, according to the guidelines as previously published (Splinter et al., 2012.).
Viewpoint coordinate correspond to the human GRCh37/hg19 assembly chr1:36690087-36690526. The forward and reverse primer
sequences are 5’ ctaacttccatcagaggcgctcac 3’ and 5’ attggcctggttcggtcttctc 3’ respectively. Illumina adapters and indexing
sequences were incorporated into the PCR primers. High-performance liquid chromatography purification was used in the produc-
tion of primers (Eurofins Genomics). The primer sequences (5’ to 3’) can be found in the Key Resources Table. Oligonucleotide
sequences copyright 2016 Illumina. All rights reserved. Derivative works created by Illumina customers are authorized for use
with Illumina instruments and products only. All other uses are strictly prohibited.
To perform 4C-PCR, 4C template from each of the 6 individuals were amplified using primers above, with each index assigned to 1
individual. 4C-PCR was performed with the following condition:
Temperature (�C) Time (sec) Cycle
98 30 1
98 10 30
68 30
72 180
4 30 1
For each individual, two 4C-PCRs were pooled together and the PCR products were purified using Agencourt AMPure XP beads
(Beckman Coulter) according to the manufacturer’s instruction. 4C-seq library was prepared by pooling equimolar amounts of the
barcoded 4C templates. Sequencing was performed on the MiSeq platform with 75 bp read length for single end reads. Custom
sequencing [5’ actcacctgggcctaccacagagatc 3’] and indexing [5’ gagaagaccgaaccaggccaat 3’] primers were used. Two technical
replicates were performed for all individuals.
4C-Seq Data AnalysisTo process raw 4C-seq data, FastQC was used to verify that all libraries passed the quality controls (https://www.bioinformatics.
babraham.ac.uk/projects/fastqc/). Adapter trimming was not required as sequencing began at the first base after the DpnII site.
Sequencing reads were aligned to hg19 using Bowtie2 (Langmead and Salzberg, 2012) with parameters: -p 8, –very-sensitive,
–time. Only reads with a MAPQ score >= 10 were used.
The processed data were then analysed using the bioconductor package Basic4CSeq according to the author’s instructions
(Walter, C., 2015). Briefly, the restriction fragments were simulated in silico and aligned sequencing reads were mapped to the
restriction fragments. Fragment read count was normalised to reads per million (RPM), and 4C interaction was subsequently visual-
ised. We observed a cis (0.2 Mb region adjacent to the viewpoint) to overall reads ratio of about 40% in all of the 4C-seq experiments
performed. A cis to overall ratio of 40% or above is considered as a quality control point for 4C experiments (van de Werken et al.,
Cell Systems 5, 1–10.e1–e6, December 27, 2017 e5

Please cite this article in press as: Ruiz-Velasco et al., CTCF-Mediated Chromatin Loops between Promoter and Gene Body Regulate AlternativeSplicing across Individuals, Cell Systems (2017), https://doi.org/10.1016/j.cels.2017.10.018
2012), indicating our 4C experiments achieved the recommended quality. 4C interactions were then visualised as a plot of normalised
read count versus genomic coordinates.
To study the relation between 4C signals and differential exon usage of the 6 individuals, the bioconductor package Genomi-
cRanges (Lawrence et al., 2013) was used to overlap normalised 4C read counts and CTCF peak signals. 4C reads mapped to frag-
ment ends that overlap a plus and minus +/- 1kb region of the mid point of the CTCF peaks were considered to be a readout for the
CTCF peak’s interaction with the viewpoint CTCF. The 4C readout signals was representing CTCF interactions were then stratified by
the relative inclusion and exclusion of the exon usage to generate the box plot.
Functional AnalysesAsmentioned in the text, two sets of exons were considered for the analyses: the unbiased and the LCL-specific set of looped exons.
For the unbiased set the intragenic loops were annotated for cases where the CTCF motif score was >= 1000; this set reflects the
potential of genes to form promoter- exon loops in any given tissue - as the identified loops were based only in the motifs. The
LCL-specific set is defined above (Annotation of intragenic loops) and represents a subset of the unbiased set, showingCTCF binding
and exon expression in LCLs, along with >= 500 score for the motifs and +/- 1kb for the TSS window.
All exon coordinates were used to retrieve the protein information from Ensembl with the assistance of Perl APIs (Cunningham
et al., 2015; Yates et al., 2015). Different features on the retrieved protein regions were mapped using the Uniprot features of the cor-
responding protein (UniProt Consortium, 2015). Protein domains on the sequence were mapped using a local installation of Pfam
(Bateman et al., 2004).
Gene Ontology (GO) term analysis for looping genes was performed using ConsensusPathDB webserver (CPDB) (http://
consensuspathdb.org/) (Kamburov et al., 2013). The top 10 GO terms were visualized using Revigo (Supek et al., 2011) and repre-
sented as treemaps. All the statistical tests were done in R. The Pfam domain-to-GO term analysis was performed with the dcGOR R
package (Fang, 2014). Location of exons on the primary sequence is based on the protein feature view from RCSB-PDB (www.rcsb.
org). Domain definitions are based on the Pfam. The structure visualization and rendering was done with the help of the UCSF
Chimera package (Berman et al., 2000).
QUANTIFICATION AND STATISTICAL ANALYSIS
Most of the analyses were done using R (http://www.R-project.org/) and Bioconductor (https://www.bioconductor.org/), in particular
using the SNPhood (Arnold et al., 2016) DEXSeq (Anders et al., 2012), and GenomicRanges (Lawrence et al., 2013) packages. Sig-
nificance of the statistical analyses was calculated either with Fisher’s exact test, Wilcoxon test, Binomial test, or t-test. For corre-
lations, Pearson’s R and Spearman rho were used as indicated. The choice of test, the p value thresholds, and the value of n are
described for each analysis within the main manuscript, the method details, and in the figure legends. Permutations were obtained
by randomly assigning the sample labels.
DATA AND SOFTWARE AVAILABILITY
Raw and processed data for the 4C-seq libraries has been deposited in the European Nucleotide Archive under the accession-
number PRJEB22940. Scripts are available upon request.
e6 Cell Systems 5, 1–10.e1–e6, December 27, 2017