CTC Workshop Caltrans Project Cost Development Process...Modified version of Project Management...
86
CTC Workshop Caltrans Project Cost Development Process by Mike Keever and Tim Sobelman December 5, 2018
Transcript of CTC Workshop Caltrans Project Cost Development Process...Modified version of Project Management...

CTC Workshop
Caltrans Project Cost Development Process
by Mike Keever and Tim Sobelman
December 5, 2018

Phases of Project Development
Planning Capital Outlay Support (COS) COS Closeout
PA&ED PID
PS&E (Design) Construction
Right of Way
Programming & Allocation
Allocation
Allocation Need & Priority
Identified
Program TAMP
Programming PA&ED End Complete Project
DEFINITIONS TAMP Transportation Asset Management Plan PID Project Initiation Document PA&ED Project Approval and Environmental Document PS&E Plans, Specifications and Estimate RTL Ready to List for Advertising
Des
ign
Com
plet
e, R
TL a
nd
Righ
t of
Way
Cer
tific
atio
n
Begi
n C
onst
ruct
ion
End
Con
stru
ctio
n

Risk and Uncertainty During Project Phases
Ris
k an
d U
ncer
tain
ty
20% Known 80% Unknown
80% Known 20% Unknown
Low
High
Proj
ect I
nitia
tion
Doc
umen
t Pr
ogra
mm
ed
PA&
ED
Com
plet
e
Des
ign
Com
plet
e
Con
stru
ctio
n C
ompl
ete
Project Lifecycle
Modified version of Project Management Institute, A Guide to the Project Management Body of Knowledge, (PMBOK® Guide) – Fifth Edition, Project Management Institute Inc., 2013 Page 40 Figure 2-9

Phases of Project Development
Capital Outlay Support (COS) COS Closeout Program Planning
PA&ED PID
PS&E (Design) Construction
Right of Way
Programming & Allocation
Allocation
Allocatio nNeed &
Priority Identified
Prog
ram
me
d
PA&
ED
Com
plet
e
Con
stru
ctio
n C
ompl
ete
Des
ign
Com
plet
e
Ris
k an
d U
ncer
tain
ty
20% Known 80% Unknown
80% Known 20% Unknown
Clo
seou
t Com
plet
e
Preliminary Engineering (15¢) Construction (85¢)
Hig h
Low

What is a cost estimate?

Cost Estimate Definition
1. Forecasting the expense of building a project
2. An approximate prediction of how much money is needed to complete a project
3. The art of assigning value combined with the science of making use of techniques to predict the cost of activities and assets.

Project Management Forum
Risk Register


How Caltrans Develops Cost
Estimates


Bid Summaries/Raw Data

Bid Summaries/Raw Data

Probabilistic Cost Estimate using Monte Carlo simulation
Certainty (confidence level)
Probability-based Range of Values
Sensitivity Analysis
Independent Review

Cost E stimating Uncertainty
PID
PA&
ED
RTL
CC
A

The Challenge of a Dynamic Bidding
Environment

2006
2018?
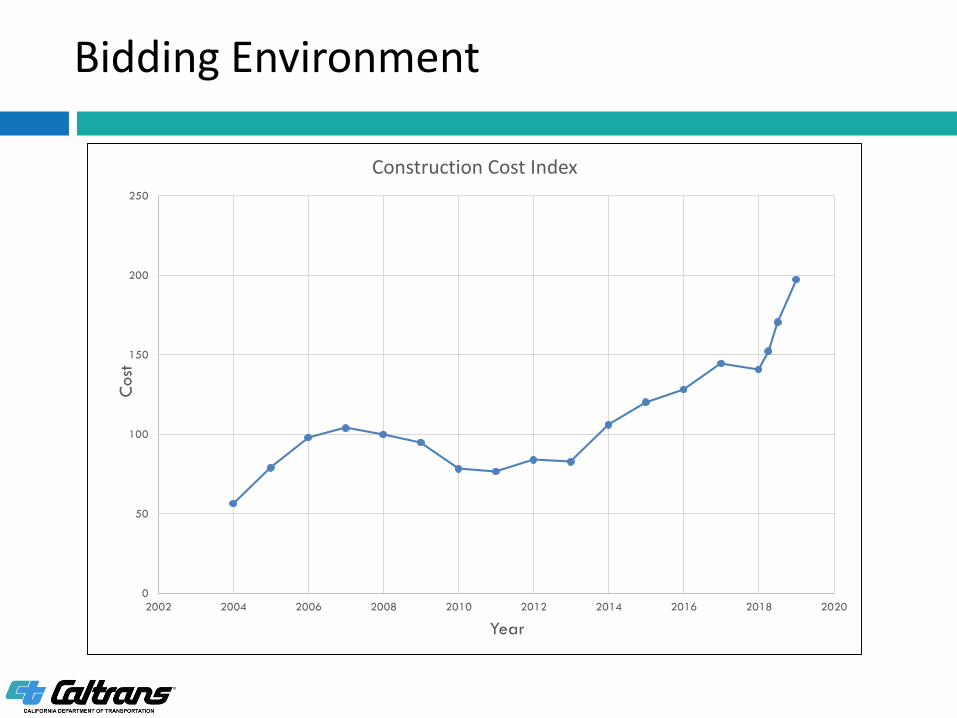
Construction Costs can be Volatile and Difficult to Predict

Cos
t
What’s Next?
Construction Cost Index 250
200
150
100
50
0 2002 2004 2006 2008 2010 2012 2014 2016 2018 2020
Year

Low Bidder Above or Below Estimate vs. Number of Bidders
-70%
-60%
-50%
-40%
-30%
-20%
-10%
0%
10%
20%
0 2 4 6 8 10 12 14 16 A
vera
ge P
erce
ntag
e Lo
w B
idde
r was
Abo
ve o
rBe
low
Eng
inee
r’s E
stim
ate
Low Bid equals
Average Number of Bidders per
Project is 5.8
Number of Bidders per Project (Projects Bid Opened from July 2004 to December 2017)
Ave
rage
Num
ber
of B
idde
rs p
er P
roje
ct
Average Number of Bidders per Project
9.0
8.0
7.0
6.0
5.0
4.0
3.0
2.0
1.0
0.0 2007 2008 2009 2010 2011 2012 2013 2014 2015 2016 2017
Year
More Bidders Equals Lower Costs
18

What Can Happen in 6 Months?

$100 Oil Becomes $50 Oil
May 10, 2018
CNBC: “Oil prices risk spiking to $100 next year, Bank of America analysts say.”
October 3, 2018
Reuters: “Oil traders have piled into wagers that U.S. crude oil could surge to $100 a barrel by next year.”
November 29, 2018
CNN: “US crude fell below $50 a barrel Thursday….”

Crude Oil Prices
Macrotrends

The Results

Data set is 476 projects awarded in the FY 17/18 FY


Project Change Management Hierarchy
CTC
Watch List
Caltrans District - Project Change Management
Caltrans HQ - Project Change Management
PROJECT COST RISK MANAGEMENT

PROJECT COST RISK MANAGEMENT
Caltrans District - Project Change Management
Caltrans Identifies Changes: during all project phases through: • Studies – Environmental, Engineering • Surveys • Geotechnical Analysis • Field Reviews • Coordination with Local Partners and
the public • Permit Negotiations
Caltrans Manages Changes through: • Project Development Teams • District Status Meetings
• Executive Review • Task Management • Qualitative and Quantitative Risk
Management

PROJECT COST RISK MANAGEMENT
Watch List
Caltrans HQ – Project Change Management
Districts Coordinate with Headquarters to Identify, Evaluate, Manage and Mitigate Change: • Quarterly Status Meetings • HQ Functional Coordinators • HQ Executive Meetings
Considerations • Amendments- Cost or Schedule • Split or Combine Projects • Time Extensions • Greater than 20% Allocations • Supplemental Fund Requests

PROJECT COST RISK MANAGEMENT
CTC
Before project changes (>20 percent or Supplemental allocations) are presented to the Commission for action:
• Caltrans - Office of CTC Liaison Coordination
• Pre-meetings with CTC Staff

PROJECT COST RISK MANAGEMENT
Approvals • Supplemental Funding • Greater Than 20% Allocation
Watch List
CTC
Decisions
Caltrans HQ - Project Change Management
• Amendments • Splits/Combines
Caltrans District - Project Change Management
• Accelerate/Delay • Time Extensions
Actions • Alternatives • Scope Changes • Staff Redirection • Brokering

Supplemental and “Greater than 20%” Allocations
Supplemental to Award Greater than 20%
Supplemental to Complete Construction
Greater than 20% - Initial Allocation
Supplemental - Secondary Allocation
(Tab 68-69) (Tab 70-76)
(Tab 78)
Supplemental to Construction Closeout (Tab 77)

Five-Year Greater Than 120% vs Awarded FYs 13/14 to 17/18
0.60% 1.60%

Five-Year Supplementals to Award vs Awarded FYs 13/14 to 17/18
< 1% 2.60%

Five-Year Supplementals to Complete Construction vs Construction Contracts Completed-FYs 13/14-17/18
0.63% 1.40%

PROJECT COST RISK MANAGEMENT
Supplemental Funding and Greater Than 20% Allocation Requests
95-99% of Projects
Watch List
Caltrans District - Project Change Management
CTC
Caltrans HQ - Project Change Management

What We are Doing to Improve

Cost Estimating Improvement Initiative
Improved Estimating Tools Identification of Best Practices Quantification of Risk Training Business Intelligence Economist

Construction Cost Escalation Study
Research and assess Caltrans’ construction cost escalation practices and existing forecast methodology
Generate risk-adjusted forecasts for the California Highway Construction Cost index (CHCCI)
Develop regional factors to account for different price dynamics across the State
37

700
650
600
550
500
450
400
350
300
250
200
150
100
50
0
% o
f 198
7 Ba
se
Price Trends Forecast
QUARTERLY PRICE TRENDS AND FORECAST
FOR HIGHWAY CONSTRUCTION
Structural Concrete (Iowa)
50th percentile forecast
80 percent confidence interval
2000
/1st
2nd
3rd
4th
2001
/1st
2nd
3rd
4th
2002
/1st
2nd
3 rd
4th
2003
/1st
2nd
3rd
4th
2004
/1st
2nd
3rd
4th
2005
/1st
2nd
3rd
4th
2006
/1st
2nd
3rd
4th
2007
/1st
2nd
3rd
4th
2008
/1st
2nd
3rd
4th
2009
/1st
2nd
3rd
4th
2010
/1st
2nd
3rd
4th
2011
/1st
2nd
3rd
4th
2012
/1st
2nd
3rd
4th
2013
/1st
2nd
3rd
4th
2014
/1st
2nd
3rd
4th
2015
/1st
2nd
3rd
4th
2016
/1st
2nd
3rd
4th
2017
/1st
2nd
3rd
4th
2018
/1st
2nd
3rd
4th
2019
/1st
2nd
3rd
4th
2020
/1st
2nd
Year/Quarter
38

Delivery Results

FY 17-18 4th Quarter Project Delivery Performance Measures
Project Costs at End of Construction1
Measure Expended Budget Savings % Annual
Goal (%) On Target
Costs for 29 Completed STIP Projects
$1.37 B $1.59 B $218 M 86% < 100%
Costs for 388 Completed $2.11 B $2.34 B $228 M 90% < 100% SHOPP Projects
1 Construction costs are calculated 6 months after the end of construction

Questions?

CTC Workshop
Bidding Environment
by Rachel Falsetti
December 5, 2018

Bidding Environment
5.0
5.5
6.0
Aver
age
Num
ber o
f Bid
ders
per
Pro
ject
Average Number of Bidders 6.5
4.5
4.0 11/12 12/13 13/14 14/15 15/16 16/17 17/18 18/19
Fiscal Year

Perc
enta
ge o
f Low
Bid
Abo
ve/B
elow
Eng
inee
r's E
stim
ate
Low Bid vs. Engineer's Estimate 10%
5%
0% 11/12 12/13 13/14 14/15 15/16 16/17 17/18 18/19
-5%
-10%
-15%
-20% Fiscal Year
Bidding Environment
Bidding Environment
Construction Cost Index
Cos
t
250
200
150
100
50
0 2002 2004 2006 2008 2010 2012 2014 2016 2018 2020
Year
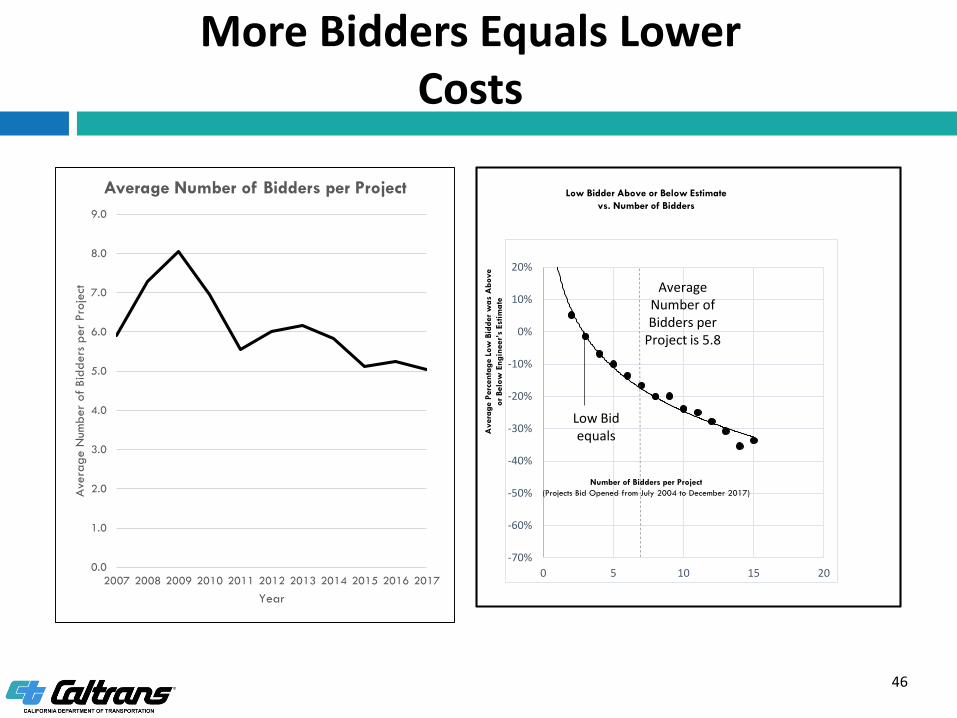
Low Bid equals
Average Number of Bidders per
Project is 5.8
Low Bidder Above or Below Estimate vs. Number of Bidders
-70%
-60%
-50%
-40%
-30%
-20%
-10%
0%
10%
20%
0 5 10 15 20
Number of Bidders per Project (Projects Bid Opened from July 2004 to December 2017)
Ave
rage
Per
cent
age
Low
Bid
der
was
Abo
veor
Bel
ow E
ngin
eer’
s Es
timat
e
Average Number of Bidders per Project 9.0
8.0
7.0
6.0
5.0
4.0
3.0
2.0
1.0
0.0 2007 2008 2009 2010 2011 2012 2013 2014 2015 2016 2017
Year
Ave
rage
Num
ber
of B
idde
rs p
er P
roje
ct
More Bidders Equals Lower Costs
46

Bidding Environment
NUMBER OF CONTRACTS AWARDED TO BIDDERS
8 New Bidders Awarded 14 of 659 Contracts
170 Previous Bidders Awarded 645 of 659 Contracts
April 2017 – November 2018

501 bidders submitted less than 50% of the bids
Bidding Environment
Bids Received for Advertised Projects
43 bidders submitted more 50% of the bids
• 1852 Projects advertised • 9575 bids submitted
January 2015 - November 2018

Awarded Projects (17/18)
698 Projects Awarded
89% less than $10m
78% less that $5m
38% less that $1m

Factors Potentially Influencing Construction Costs
General inflation Market conditions
Material shortage Labor costs
Highway construction spending
Unforeseen events Insufficient bid competition

Questions?

CTC Workshop
Resource Agency Influence on Project Delivery
by Jeff Wiley and Phil Stolarski
December 5, 2018

Environmental Laws
CA Coastal Act
Resource Conservation and Recovery Act
Section 4(f) Fish and Game Code

N
umbe
r of
Law
s
Increasing Project Delivery Requirements (Pre- 1940 to Present)
200 70 81 91 102 108
54100 25 0
To 1970 To 1980 To 1990 To 2000 To 2010 To 2015 To Present
=Environmental Laws, Regulations and Orders
Agencies and Requirements

Environmental Documents
SHOPP Projects Categorical Exemptions – Over 90% Initial Studies/Negative Declarations – Almost 9%
Environmental Impact Reports – 0.5%
STIP Projects Categorical Exemptions – 33% Initial Studies/Negative Declarations – 41% Environmental Impact Reports – 26%

Environmental Costs
Support
Capital expenses
Right-of-way

Costs Related to Permits
57

Costs for Project with Permitting Fees
Projects With Mitigation or Permitting Fees that achieved CCA within the 14/15, 15/16 or 16/17 FY
Number Avg. Total Env Cost
Avg. Mitigation and Permitting
Cost
Max Mitigation and Permit Cost
(% of Total Cost)
SHOPP
STIP
222
72
$ 167,606
$ 908,442
$ 41,801
$ 463,080
13.38%
9.92%
Data set = 745 SHOPP and 166 STIP Projects that achieved Construction Completion in FYs 14/15, 15/16, or 16/17

SHOPP: Environmental Cost vs Total Cost
Environmental Cost vs Total Cost SHOPP with Mitigation or Permit Fees
Remaining Project Costs
98.60%
Env. Support Costs
1.05%
Mitigation and Permit Fees
0.35%
Data set = 222 SHOPP Projects that achieved Construction Completion in FYs 14/15, 15/16, or 16/17, and had specific permitting or mitigation expenditures

Environmental Cost vs Total Cost STIP with Mitigation or Permit Fees
STIP: Environmental vs Total Cost
Env. Support Costs
0.65%
Mitigation and Permit Fees
0.68% Remaining
Project Costs 98.67%
Data set = 72 STIP Projects that achieved Construction Completion in FYs 14/15, 15/16, or 16/17, and had specific permitting or mitigation expenditures

Efficiencies
NEPA Assignment
Advance Mitigation Program
AB 1282 – Transportation Permitting Task Force

NEPA Assignment
Reduces reviews
Time-savings for projects
Requires waiver of immunity

Advance Mitigation
Accelerate transportation
project delivery
Improve environmental
outcomes
Enhance communication
with stakeholders
Ensure the Program
account is self-sustaining
Advance Mitigation Projects Purchase or Create Mitigation

AB 1282
Establishes the Transportation Permitting Task Force Statutory Goals: Early engagement Reasonable deadlines Greater certainty of permit approval requirements

Questions?

CTC Workshop
Engaging the Industry by Janice Salias and Ramon Hopkins
December 5, 2018

Small Business
(SB)
25% Overall Goal
State-Funded Contracts and Procurements
California Code of Regulations
Disabled Veteran Business Enterprise
(DVBE)
Disadvantaged Business Enterprise
(DBE)
3% Overall Goal
State-Funded Contracts and Procurements
California Code of Regulations
17.6% Overall Goal
FHWA-Assisted Contracts and Procurements
Code of Federal Regulations
Caltrans’ Small Business Program

Caltrans’ SB, DVBE, and DBE Participation
SB Participation - 25% Goal DVBE Participation –
3% Goal DBE Participation Overall Goal
FY SB Dollars % DVBE Dollars % DBE Dollars % at
Commitment %
14/15 $349,378,944 28.4% $47,149,004 3.83% $275,730,549 12.40% 12.5%
15/16 $519,879,000 46.05% $57,190,818 5.07% $314,950,430 13.15% 12.5%
16/17 $408,919,922 28.86% $46,800,099 3.30% $264,592,759 12.08% 12.5%
17/18 $509,017,424 28.51% $87,857,147 4.92% $359,506,554 14.88% 12.5%
18/19 1st Qtr
$95,056,771 28.40% $11,010,727 3.3% $24,980,875
(1st month of FY) 16.98% 17.6%

OBEO’s Training and Outreach to Support Business
Training, technical assistance, and advocacy services Training to help prepare small businesses to compete
for Caltrans’ contracting and procurement opportunities Certification workshops Prime contractor training Subcontractor training “Doing Business with Caltrans: Getting Started”

OBEO’s Training and Outreach Objectives
Organize and participate in outreach events
Promote awareness of Caltrans’ contracting and procurement opportunities Pre-bid meetings/pre-proposal conferences Business matchmaking events Procurement fair
Develop comprehensive Senate Bill 1 and Senate Bill 103 outreach plans

District Efforts to Increase Participation
District Small Business Liaisons (DSBLs) Develop partnerships with local and regional
entities Market Caltrans’ contracting and procurement
opportunities One District is testing a Contractor Boot Camp Provide assistance in Certification Bidding Marketing/Building Relationships Contractor Compliance

Industry Involvement
Statewide Small Business Council Standing committees Ad hoc committees
DBE Participation Committee Task groups
Meetings with Industry Organizations
Caltrans internal stakeholders

OBEO Certifies Disadvantaged Business Enterprises (DBE)
Currently no backlog in processing new applications
Increase the pool of certified DBEs
DBE Certification Workshops to be held throughout the state and specific workshops with small business organizations

OBEO Provides Supportive Services to Disadvantaged Business Enterprises (DBE/SS)
DBE program is guided by USDOT regulations (49 CFR Part 26)
The first in the nation pay-for-performance model with established metrics the consultant is expected to achieve

DBE/SS Totals to Date
Program launched in August of 2018: 130 certified DBEs enrolled into the Business
Development Program (BDP)
7 firms have graduated from the BDP
18 bids for contracts have been submitted
2 contracts have been reported as awarded

DBE/SS Program Providers
Northern Region - Humboldt State University-Sponsored Programs Foundation
(Districts 1, 2, 3, and 4)
Central Region - CSU Fresno Foundation (Districts 5, 6, 9, and 10)
Southern Region - MiraCosta Community College District (Districts 7, 8, 11, and 12)

On-The-Job Training Supportive Services (OJT/SS)
Provides training to increase the participation of women, minorities, and other disadvantaged individuals in skilled crafts on federal-aid highway construction contracts
Current OJT/SS contracts include: Field Ironworkers Apprenticeship Program Including a nationwide women-only boot camp
South Bay Workforce Investment Board – Southern California - Pre-Apprentice training
Ladders of Opportunity – Pre-Apprenticeship training
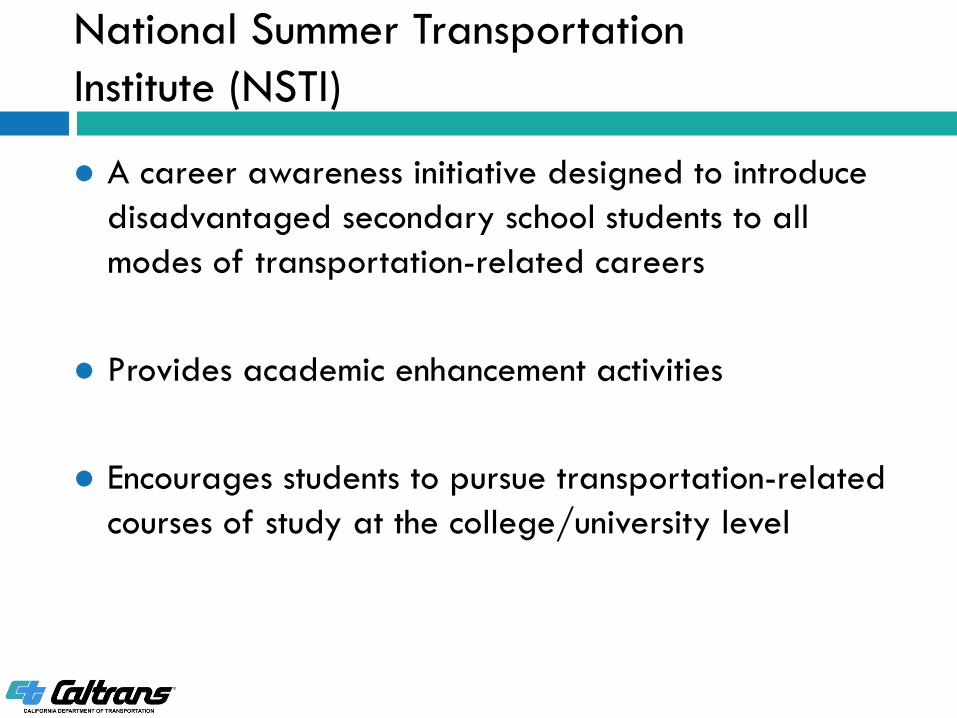
National Summer Transportation Institute (NSTI)
A career awareness initiative designed to introduce disadvantaged secondary school students to all modes of transportation-related careers
Provides academic enhancement activities
Encourages students to pursue transportation-related courses of study at the college/university level

Increasing Construction Costs
• Changing Market Conditions
• Labor Shortage
• Industry Engagement

Changing Market Conditions
• Increased Demand
• Local Roads and Private Development
• Market Volatility
• Tariffs
• Oil Price Fluctuations
• Foreign Economies

Completed Initiatives
• 12 Month Look Ahead
• Materials on Hand
• Aggregate Resource Policy Statement
• Increase use of Recycled Material

Completed Initiatives
• Hot Mix Asphalt Formula Approval
• Collaborative Payment Policy
• DBE Certification Process Review
• Newly Certified DBE Reporting
• DBE Supportive Services

Ongoing Initiatives
• Designated Storage Areas
• Automated Technology
• Renewable Diesel Pilot
• Small Business “Bootcamp”

Labor Shortage
• Need for additional labor
• Competition with other States
• Increase Salary

Attracting New Workforce
• Caltrans
• Hiring Centers
• Recruitment
• Industry
• Helmets to Hardhats
• Community College Outreach
• Apprentice Programs

Questions?


![PMBOK - PMI - Project Management Practitioner's Handbook [EarthWeb]](https://static.fdocuments.us/doc/165x107/55cf993c550346d0339c532b/pmbok-pmi-project-management-practitioners-handbook-earthweb.jpg)


