CTA / ALMA synergies - obspm.fraramis.obspm.fr/~salome/alma/Atelier14/CTA_ALMA_Boisson.pdf ·...
55
CTA / ALMA synergies C. Boisson LUTh, Observatoire de Paris thanks to H. Sol & A. Zech
Transcript of CTA / ALMA synergies - obspm.fraramis.obspm.fr/~salome/alma/Atelier14/CTA_ALMA_Boisson.pdf ·...

CTA / ALMA synergies
C. Boisson LUTh, Observatoire de Paris thanks to H. Sol & A. Zech

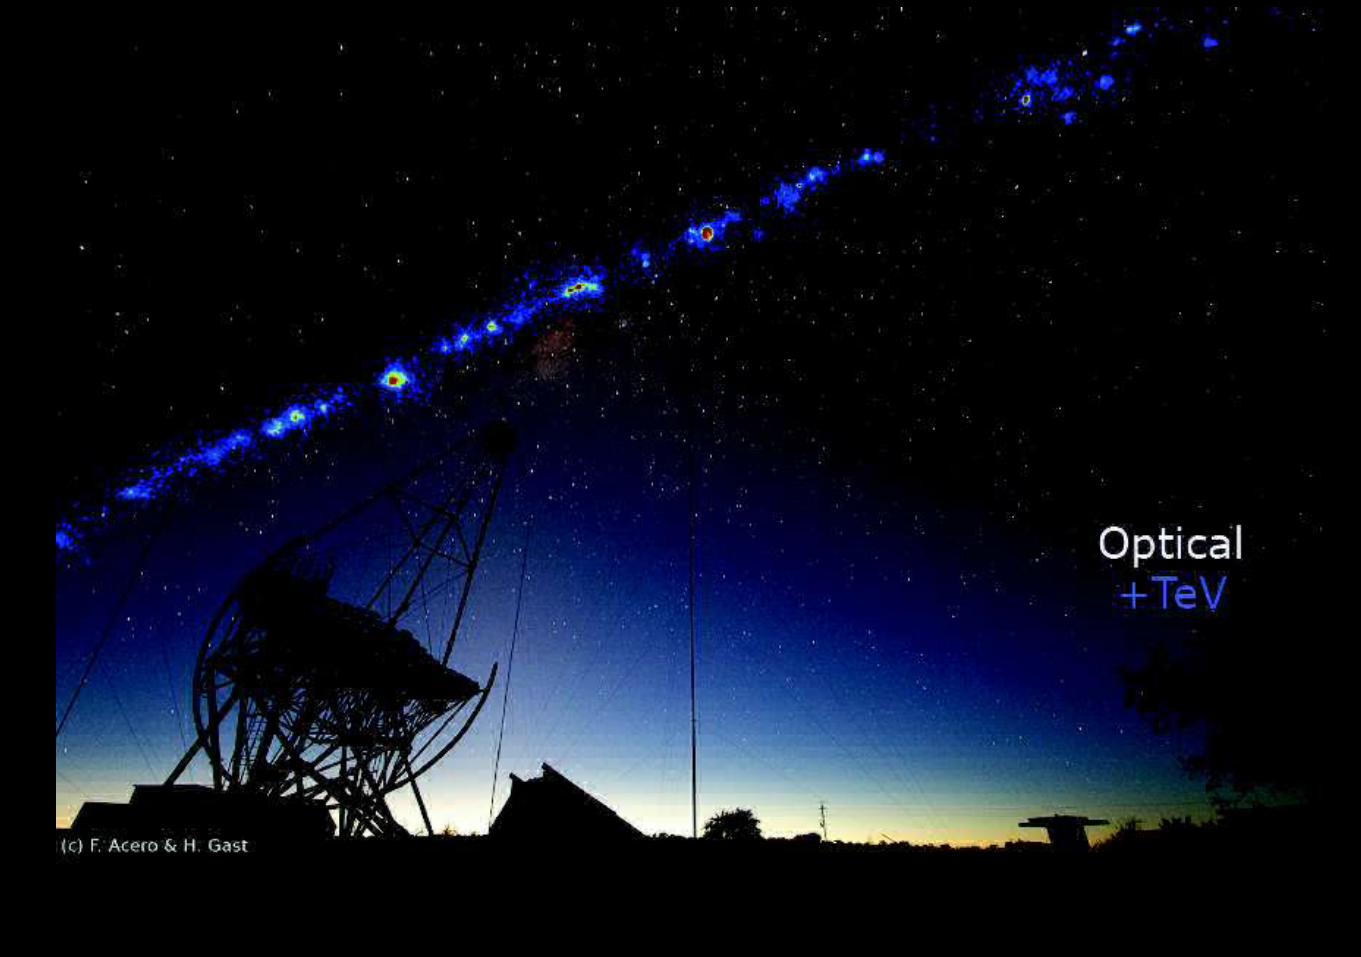
Particle acceleration is a wide-spread phenomena in the Universe

Atelier CTA 2014 (J. Knödlseder) 3
CTA Key Science
Cosmic Rays Black Holes Fundamentalphysics
Origin of cosmic raysAcceleration physics
Impact on environment
Role as particle acceleratorsAcceleration physics
Probes of the Universe
Nature of dark matterTest Lorentz invariance


Why Cherenkov Telescopes?
Gamma-ray astronomy– In general big advantages over other methods of probing high energy particles (probes hadrons +
leptons, photon cross-section, ….)
Advantages to satellite– Only way to build sensitive > TeV instruments
– High statistics / short timescale
– Large collection areas O(km2)
Advatages to ground particle detectors– Superior energy/angular resolution
– Superior background rejection
Limitations– Smaller duty cycle, smaller field of view

2 - 5 Telescopes• 500-2000 pixel cameras• 3.5 - 5.0° FoV• ~0.1° angular res.• ~15% energy res.• Sensitivity <1% Crab• ~30 GeV < E < ~50 TeV

High Energy Sky > 100 GeV
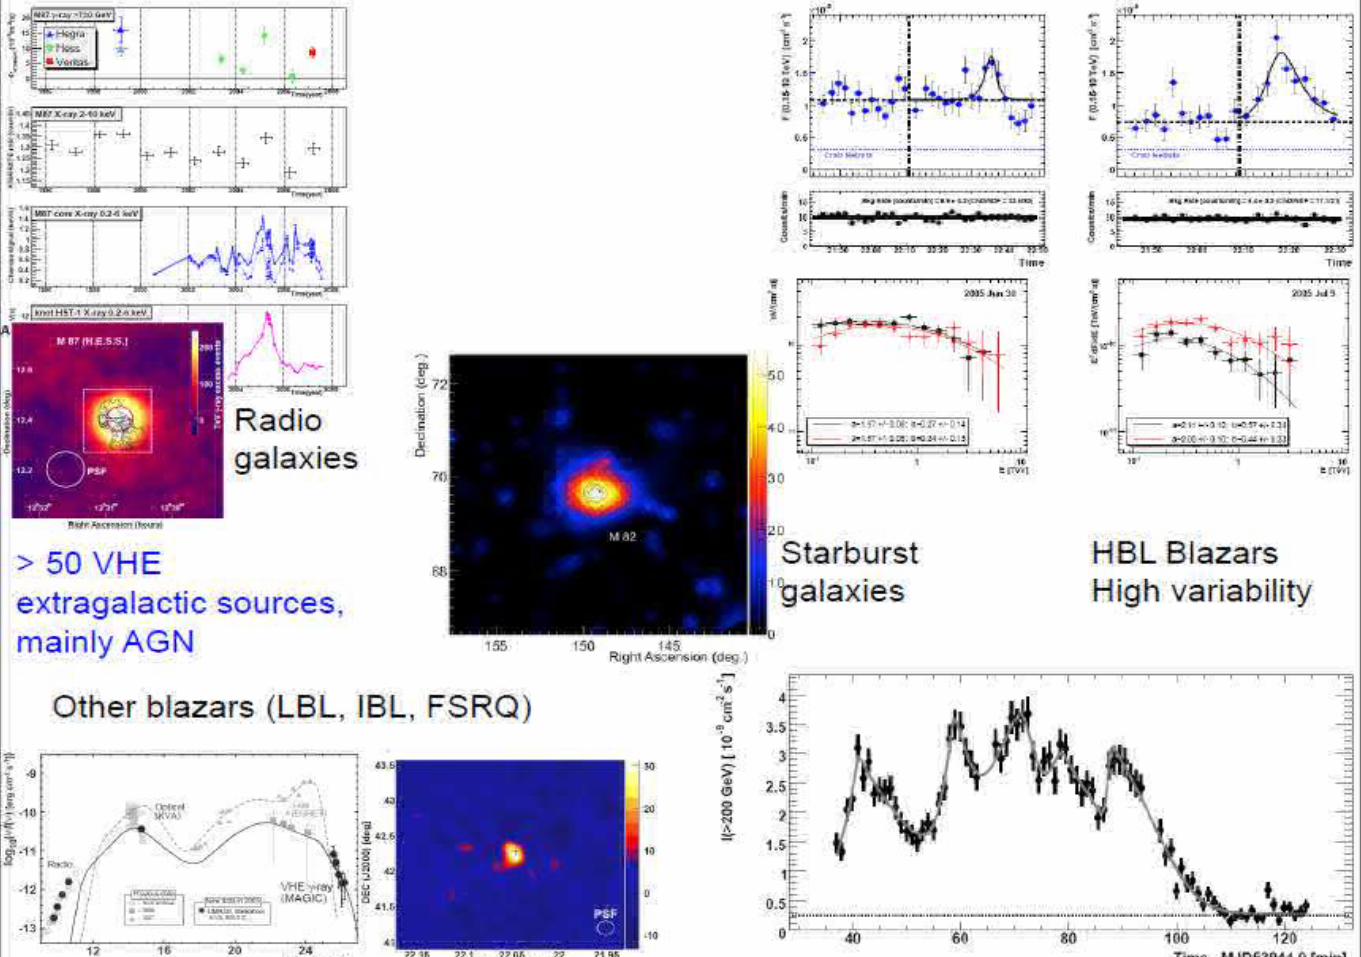
55 blazars, 2 starburst150 sources
The extragalactic TeV sky is dominated by blazars (mainly BL Lacs)
@ TevCat
H.E.S.S., MAGIC, VERITAS
H.E.S.S.MAGICVERITAS


@ J. Hinton 2013


How to do better with IACT arrays?
More events→ more photons = better spectra, images, fainter sources
> Larger collection area for gamma-rays
Better events→ more precise measurements of atmospheric cascades and hence primary gammas > Improved angularresolution
> Improved background rejection power
More telecopes

CTA Consortium
ALMA

Cherenkov Telescope Array facts
● High sensitivity
> 4 orders of magnitude dynamic range in flux between strongest and faintest sources; a
factor of 10 more sensitive than current IACT
● Wide spectral range
> 4 orders of magnitude coverage in energy from 10 GeV to above 100 TeV;
10-15% energy resolution; overlap with FERMI bridging the gap
● Well-resolved light curves
Minute-scale variability of many AGN
● Resolved source morphology
Up to 0.02 deg. angular resolution; 10-20” source localization
● Large field of view (5 to 10 deg)
serendipitous AGN discoveries
● Surveying capabilities
full-sky survey at 1% Crab in about 1 year ; sub-array observing mode

CTA facts
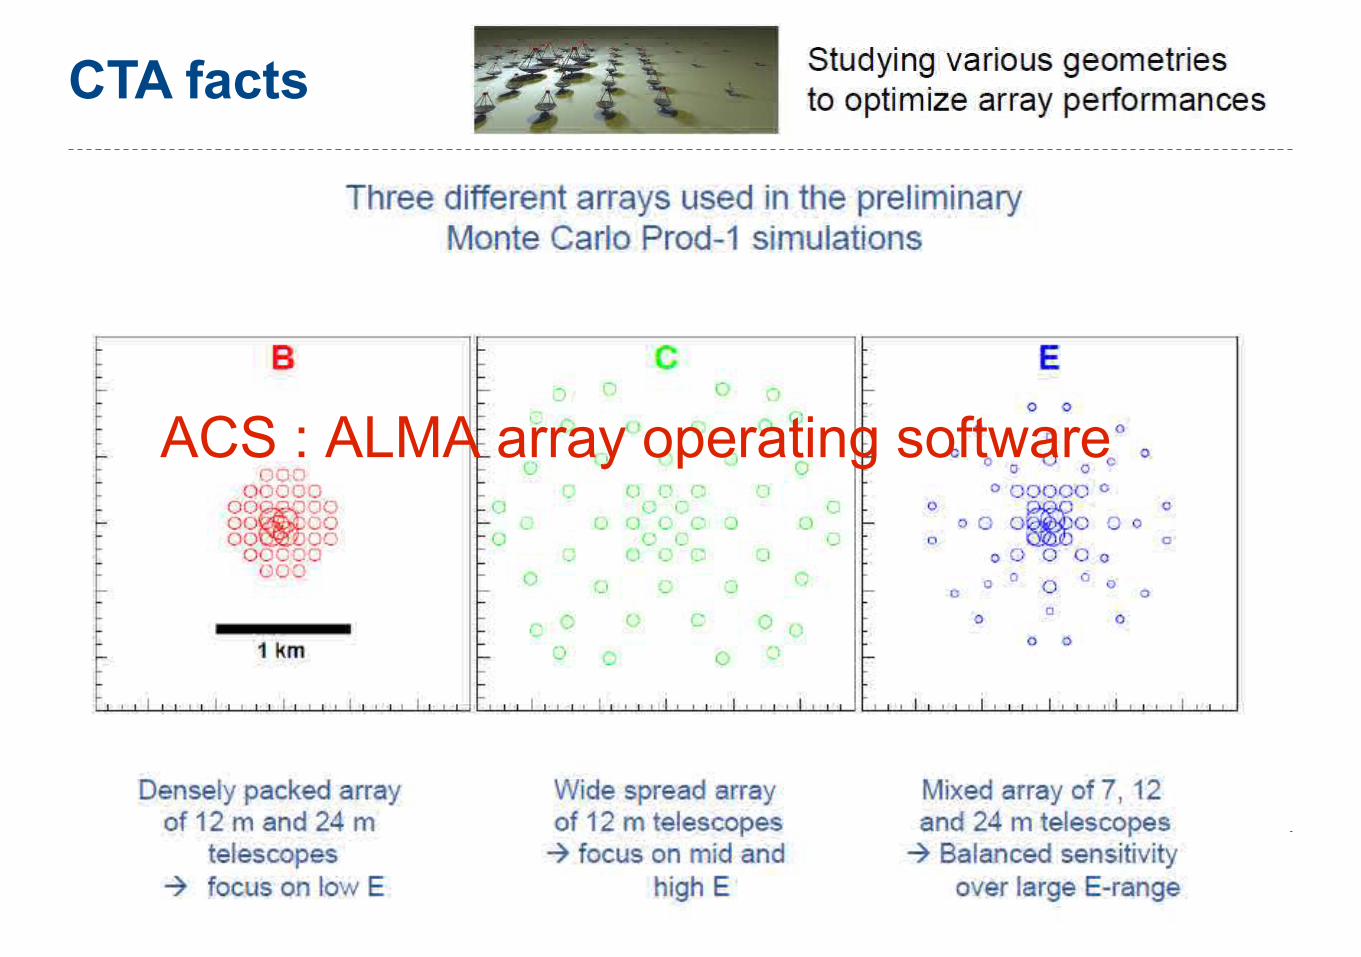
CTA facts
ACS : ALMA array operating software

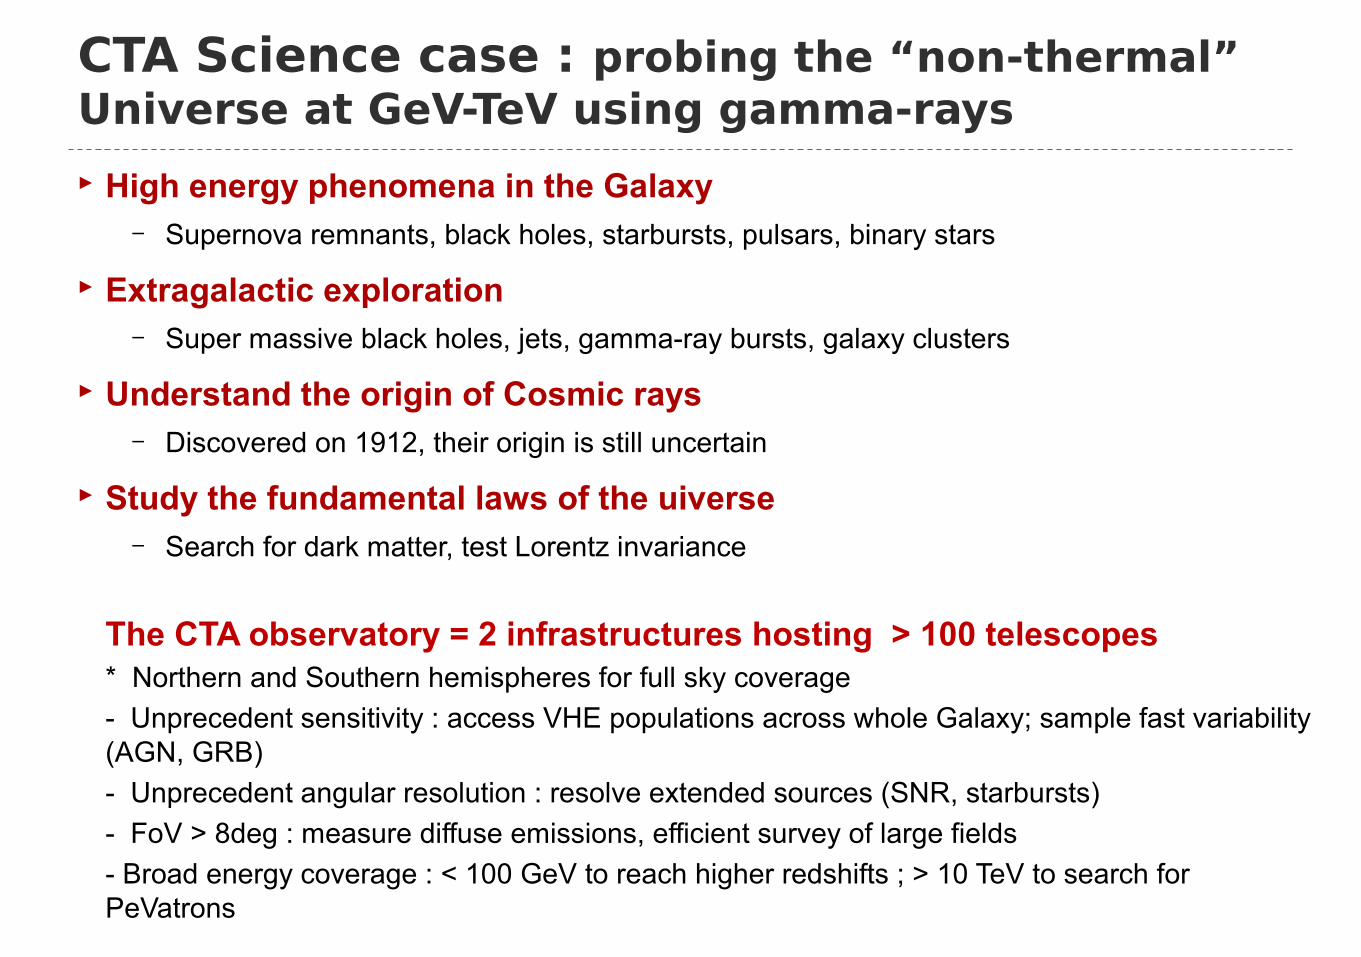
CTA Science case : probing the “non-thermal” Universe at GeV-TeV using gamma-rays
High energy phenomena in the Galaxy– Supernova remnants, black holes, starbursts, pulsars, binary stars
Extragalactic exploration– Super massive black holes, jets, gamma-ray bursts, galaxy clusters
Understand the origin of Cosmic rays– Discovered on 1912, their origin is still uncertain
Study the fundamental laws of the uiverse– Search for dark matter, test Lorentz invariance
The CTA observatory = 2 infrastructures hosting > 100 telescopes * Northern and Southern hemispheres for full sky coverage
- Unprecedent sensitivity : access VHE populations across whole Galaxy; sample fast variability (AGN, GRB)
- Unprecedent angular resolution : resolve extended sources (SNR, starbursts)
- FoV > 8deg : measure diffuse emissions, efficient survey of large fields
- Broad energy coverage : < 100 GeV to reach higher redshifts ; > 10 TeV to search for PeVatrons

High Energy Sky > 1 GeV
2FGL (2 years): 1873 sources (Nolan et al 2012) Upcoming 3FGL (4 years): ≈3000 sources

High Energy Sky > 10 GeV
1FHL (3 years) Ackermann et al 2013514 sources

High Energy Sky > 100 GeV
55 blazars, 2 starburst150 sources
The extragalactic TeV sky is dominated by blazars (mainly BL Lacs)
@ TevCat
H.E.S.S., MAGIC, VERITAS
H.E.S.S.MAGICVERITAS
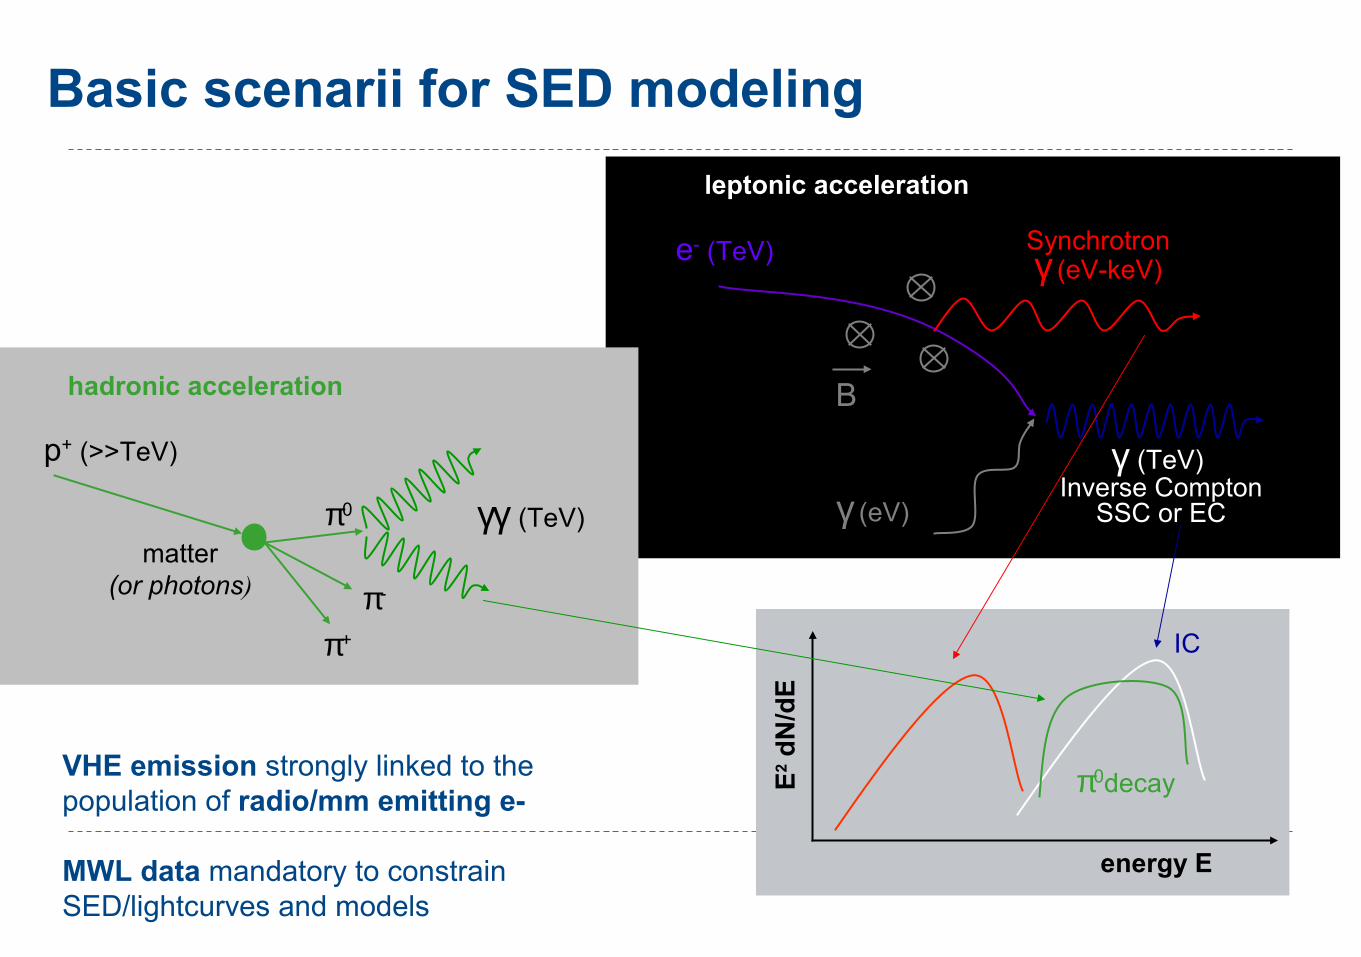
energy E
π0decay
IC
e- (TeV) Synchrotronγ (eV-keV)
γ (TeV) Inverse Compton
SSC or ECγ (eV)
B
leptonic acceleration
π-
π0
π+
γγ (TeV)
p+ (>>TeV)
matter(or photons)
hadronic acceleration
Basic scenarii for SED modeling
(adapted from De Lotto, 2009)
VHE emission strongly linked to the population of radio/mm emitting e-
MWL data mandatory to constrainSED/lightcurves and models
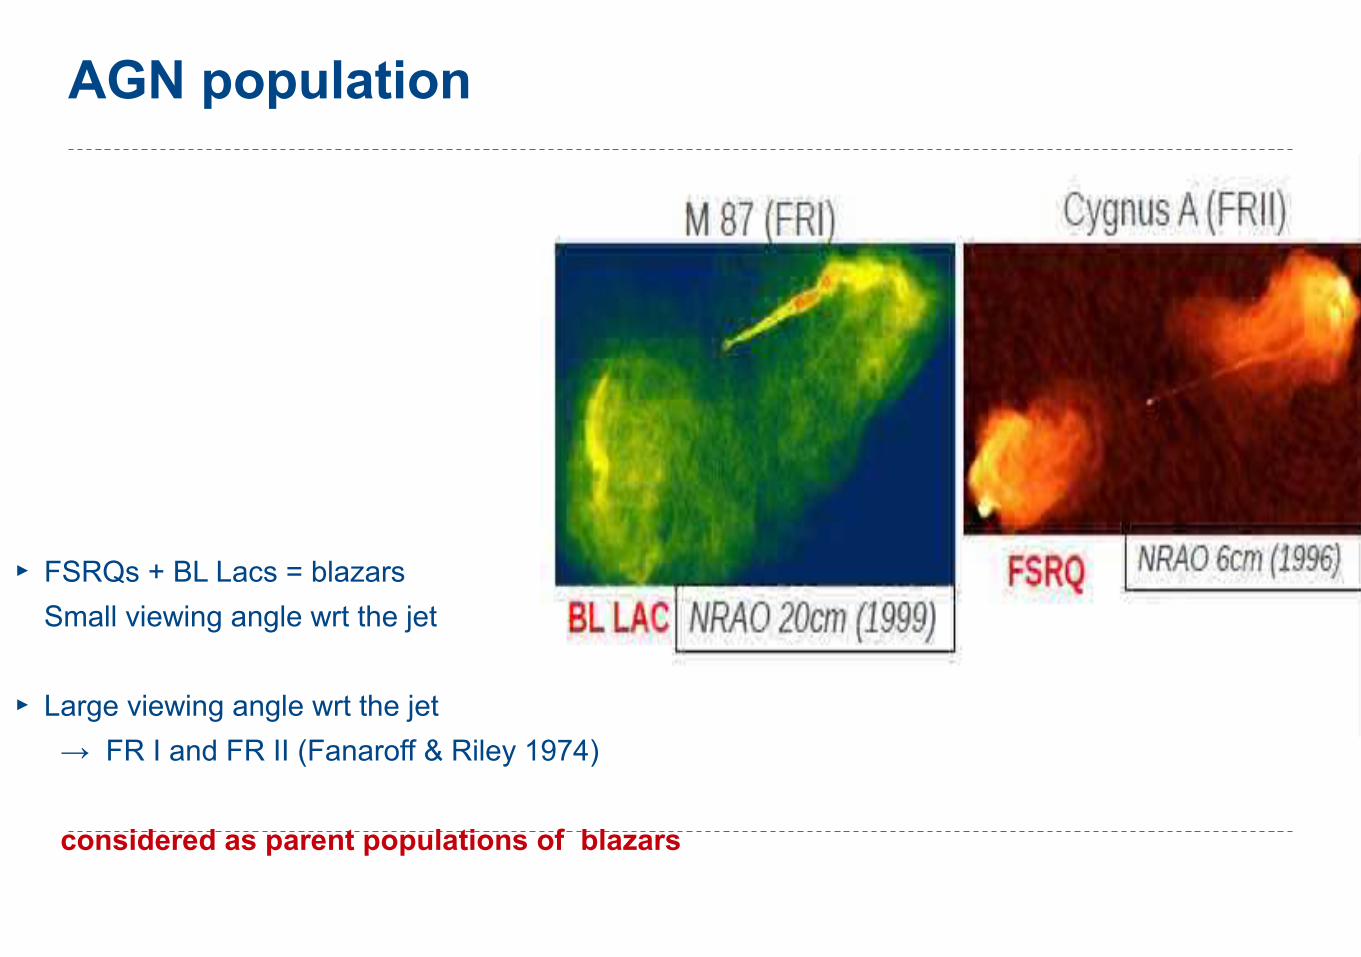
AGN population
FSRQs + BL Lacs = blazars
Small viewing angle wrt the jet
Large viewing angle wrt the jet
→ FR I and FR II (Fanaroff & Riley 1974)
considered as parent populations of blazars

Blazar sequence(s)
@ J. Ballet
Characteristic SED is double peaked
Anti-correlation between bolometric luminosity and E peak → blazar sequence (Fossati et al 1998)
FSRQs to BL Lacs
Low synchrotron peak (LBL or LSP) to high synchrotron peak (HBL or HSP) BL Lacs
+ BBB

Blazar sequence(s)
Characteristic SED is double peaked
Strong anti-correlation between bolometric luminosity and E peak → blazar sequence (Fossati et al 1998)
Cooling model with external radiation for FSRQs (Ghisellini et al.1998)
Physical models → galaxy evolution through reduction of fuel from surrounding gas and dust (Böttcher & Dermer, 2002)
The NLS1 (PMN J0948+0022,z=0.585) detected by Fermi does not fit in the picture.
Foschini et al. (2009)

Blazar sequence(s)
Giommi et al, 2012
Indeed, varying mix of
- Doppler boosted, radiation from the jet emission- radiation from the accretion disk- from the BLR - the host galaxy
Anti-correlation most likely due to selection effect :
bright radio sources drawn from high end luminosity function while BL Lac in flux limited samples are mostly high synchrotron peaked.
FSRQs BL Lacs
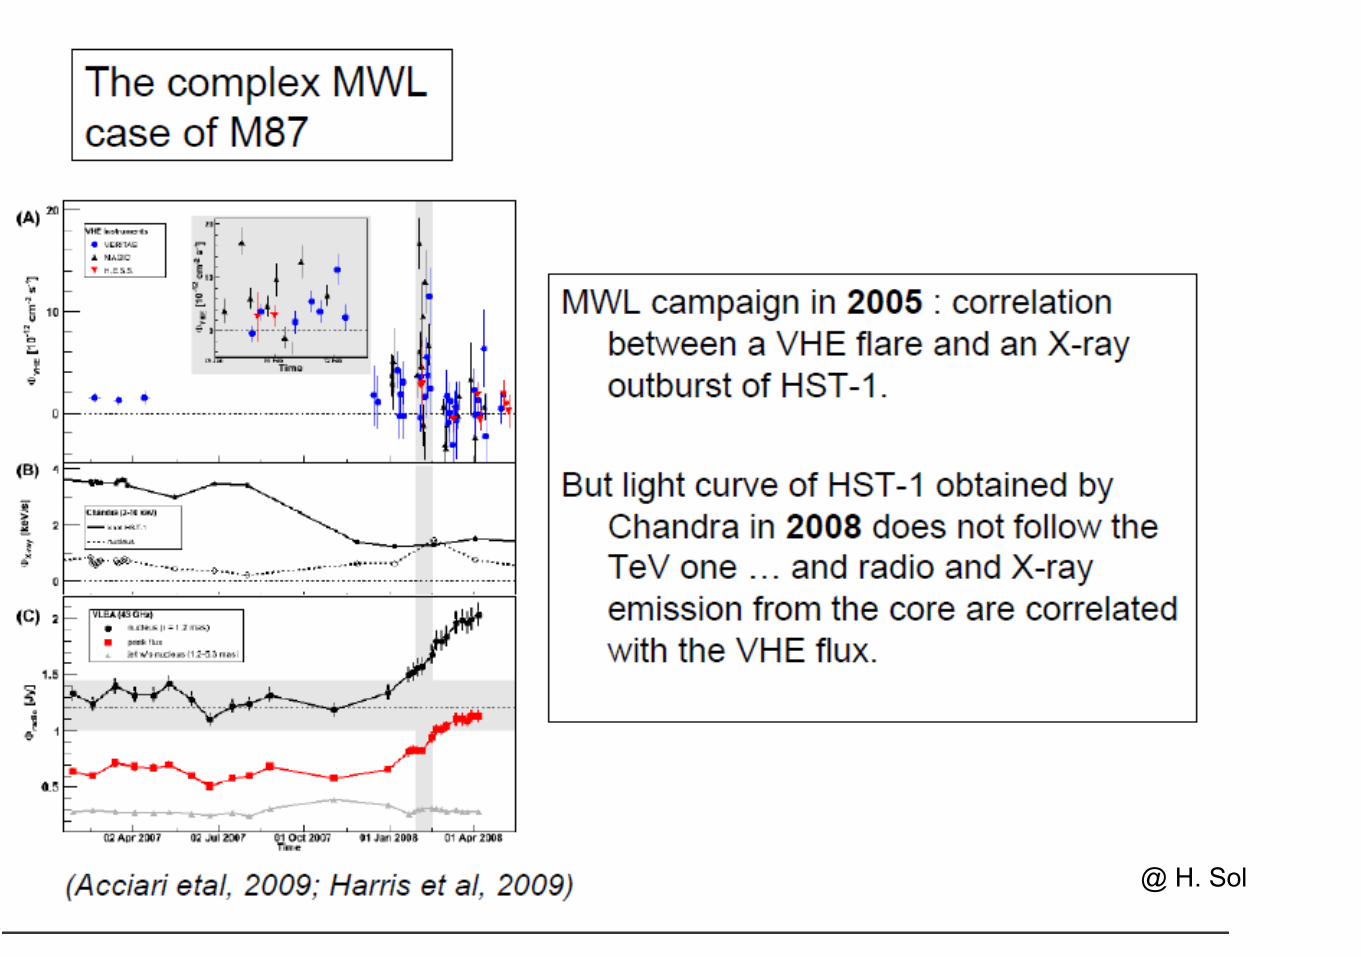
a @ H. Sol

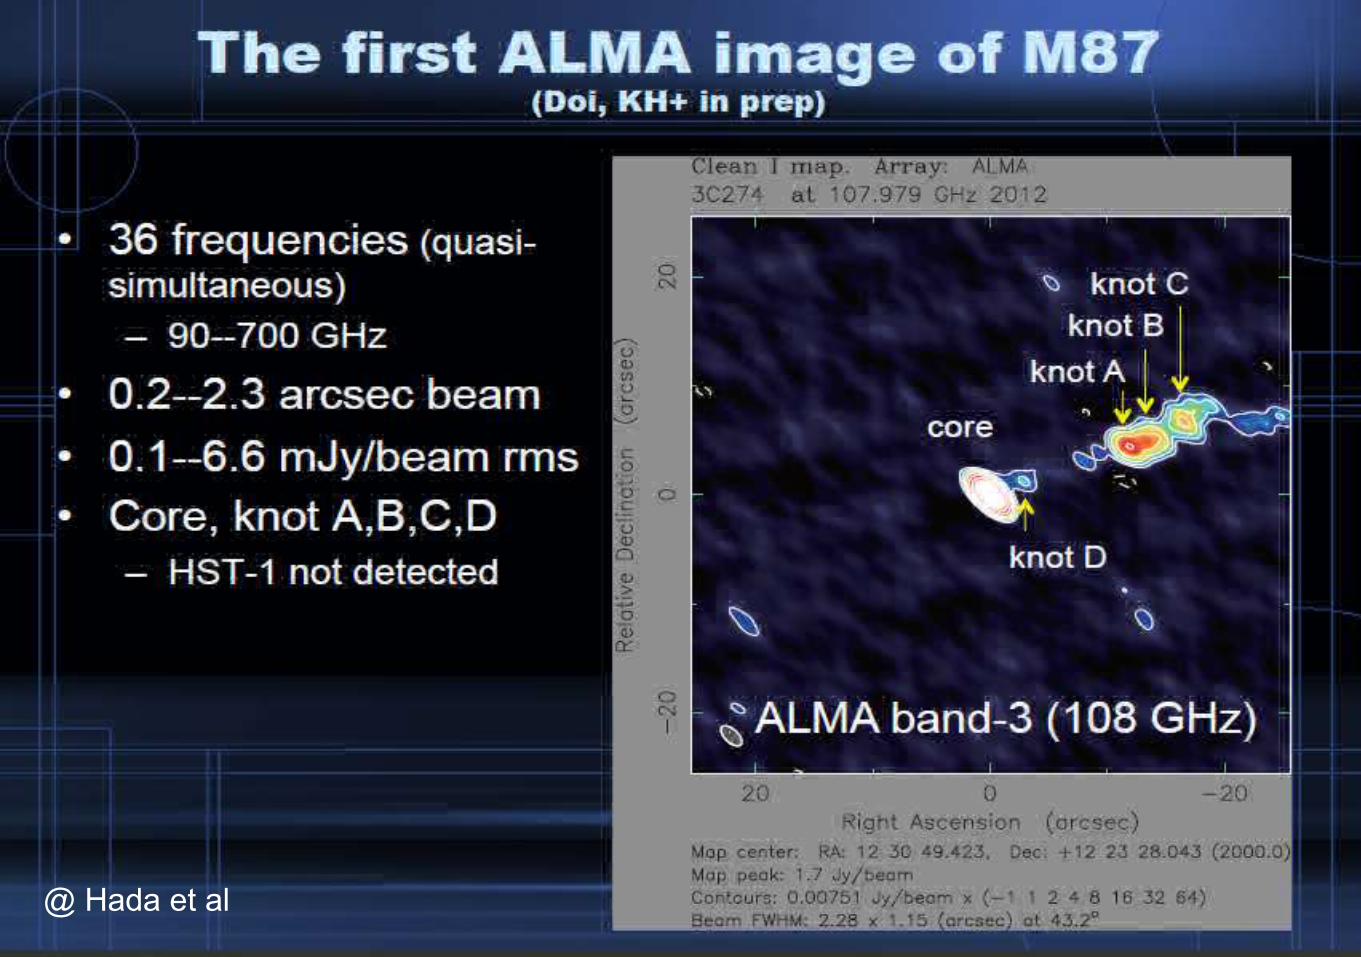
@ Hada et al

Emergence of a new VLBI superluminal componentfrom the core, at the time of a TeV flare in BL Lac


Nuclei of radio loud AGN
mm and sub-mm observations can probe– closer to the base of the jet than any other waveband except X-ray– much closer than cm observations because synchrotron
self-absorption opacities are lower
Monitoring of variability and polarization of blazarsstudy correlation between mm and -ray flaresderive time lagslinear/quadratic, SSC/IC
mm and sub-mm observations can probe– closer to the base of the jet than any other waveband except X-ray– much closer than cm observations because synchrotron
self-absorption opacities are lower
Monitoring of variability and polarization of blazarsstudy correlation between mm and gamma-ray derive time lagslinear/quadratic, SSC/IC
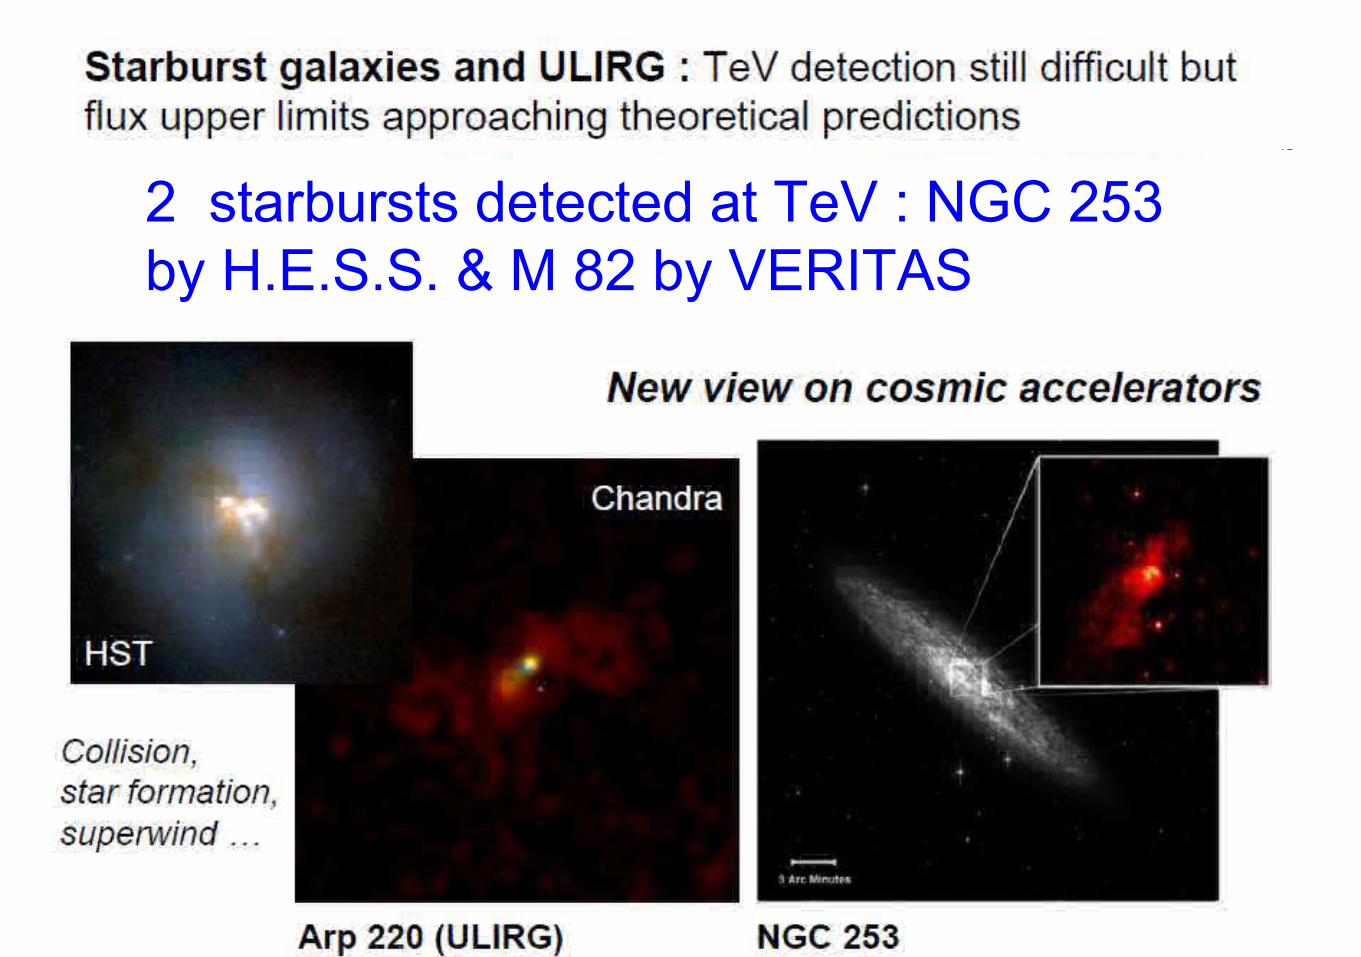
2 starbursts detected at TeV : NGC 253 by H.E.S.S. & M 82 by VERITAS

ALMA CO map
Full convection–diffusion model for energetic electronand proton propagation
solely on the spectral description of the electron and proton distribution

@ H. Sol

The central engine of AGN
ALMA:– Study jet physical properties and production mechanisms– Discover new classes of AGN– Observations of the galactic center – Structure of the torus and ISM in the vicinity of the AGN
– most sensitive element of a mm-VLBI array
– Monitor the total flux and polarization variability of blazars
Real synergy with CTA science

@ P. Martin

.
p+p → pi0→ 2γ
GAS CLOUD
Gamma-Rays (+ neutrinos)
CRs deflected by magnetic fields
Observational Signature→ Gamma-rays & gas are spatially correlated
→ mm-radio astronomy traces the gas
.......we expect gamma-ray flux Fγ ~ kCR Mgas
γ-rays from TeV cosmic rays (p, He, etc)

γ-Rays from multi-TeV electrons
.
Accelerated TeV Electrons
e + (soft) → e´ + (TeV) inverse-Compton (IC) scattering
e + G → e´ + (GHz) Radio synchrotron (+ X-rays, optical, IR)
Observational Signature
→ May be differences in TeV & radio morphologies → B-field estimates possible
Inverse-Compton (IC) TeV Gamma-Rays
Synchrotron radio to X-Rays


SNR W49B & Starburst region W49A

SNR G347.3-0.5 (Age < 104)
years)
SNR mapped in radio continuum (ATCA) and X-rays (ROSAT)Diffusive shock acceleration at forward shock(Lazendic et al. 2004; Ellison et al. 2001)
TeV image from H.E.S.S.

Mature SNR – W28 & HII region
Image: VLA, ATCABrogan et al. (2006)
SNR – shock interaction with molecular cloud – CRs source of grays
Southern g-ray sources a mystery?From SNR or HII regions?
Nanten2 12CO(J=2-1) image -10 to 25km/s (Nakashima et al 2008)

Passive source
• Unidentified HESS source J1626-490• Associated with CO cloud – maybe passive target for CR protons
accelerated by nearby SNR?? • Suggests hadronic process.• Need for magnetic fields & turbulence estimates, detailed CO, HI
Eger et al. (2011)


SNRs / Molecular clouds
The study of SNRs/ MC interactions at intermediate angular resolution is an invaluable tool to understand several issues of great interest at present:
– Star birth induced by dying stars
– Origin of galactic cosmic rays
– Nature of gamma-ray sources
– Properties of the cold ISM
Great synergy with CTA project

What ALMA can do for us
• Snapshot observations add points to the SED of southern AGN in a key part of the spectrum to help differentiate between models
• Snapshot observations will identify sources with structure on ALMA baselines for detailed imaging follow-up
• High spectral resolution observations could use these bright sources to probe the intervening material • Polarisation variations also valuable
• VLBI (bands 1 and 2) challenging but importantes

What ALMA can do for us
• Most efficient use of these sources relies on knowing their current flux density, which a flux density monitoring program like this can contribute to
• Detailed mapping of molecular material surrounding high energy sources toconstrain the broad non thermal SED and allow resolution of non-thermal emission in nearby sources that cannot be acheived in X-rays

ALMA → SKA staff

astroph 1407.0205 Vaupré et al.


The CTA conceptE < 100 GeV
4 LST (Ø23m)4.5o FoV
2500 pixels0,1o
0,1 – 10 TeV25 MST (Ø12 m)
8o FoV1500 pixels
0,18o
E > 10 TeV70 SST (Ø4 m)
8…10o FoV~1500…2000 pixels
~ 0,2o…0,3o
Southern site onlyE < 100 GeV
• High intensity flux• Faint showers
→ Large telescope
• GRB alerts
0.1 – 10 TeV
• Precision→ Shower sampling→ Dense network
E > 10 TeVSST-GATE/GCT
• Low fluxes→ Wide area network• Bright showers→ Small telescopes
@ Stolarczick