
CT DC 2Q14 Snapshot
2
WASHINGTON, DC OFFICE After posting job losses in the first quarter of 2014, the District of Columbia economy showed signs of life in the second quarter and has added 1,900 jobs since the beginning of the year. The District of Columbia’s unemployment rate stands at 7.5%, down from 8.5% one year ago and at its lowest level since the financial crisis. While many of the job gains have been in the non-office-using Leisure & Hospitality sectors, the Professional & Business Services sectors have added 1,700 jobs since the start of 2014. This bodes well for the District of Columbia’s office market. However, the Federal Government, a significant occupier of office space, has shed 2,100 jobs during the same time period. With a new budget in place and reductions in discretionary spending projected to come to an end, the contraction of the Federal Government workforce should be close to over. As consumer confidence continues to improve, expect more positive job gains through the second half of 2014. The District of Columbia office market was bifurcated in the second quarter of 2014. While transaction volume was above average, a few large tenant vacancies caused absorption to continue the negative trajectory that began in the first quarter. Net absorption registered a negative 321,500 square feet (sf) in the second quarter, bringing the year to date total to a negative 431,800 sf. The downturn was due primarily to three significant move-outs in the emerging and peripheral submarkets of West End/Georgetown, Uptown and Southwest. At the same time, the core submarkets – the Central Business District (CBD) and East End - performed quite well in the second quarter, together registering over 400,000 sf of absorption. Because of the core versus non-core submarket divergence, the overall District of Columbia vacancy rate was essentially flat, increasing only 0.2 percentage points over the quarter to 11.2%. As expected, asking rents also remained flat over the quarter, decreasing $0.31 to $50.35 per square foot (psf), full service. Office construction activity continues to be below average. As of the second quarter of 2014, 1.5 million square feet (msf) of office space is either under construction or complete renovation in the District of Columbia, with a preleased rate of 54%. This is well below the District’s ten-year average of 4.6 msf under construction with 2.5 msf delivered annually. However, the District appears to be ramping up for another wave of construction. Despite lackluster leasing in the emerging markets, several developers are considering breaking ground on a speculative basis in a play to attract federal agencies and law firms, both of which have a surge of lease expirations in 2017. Setting aside the dismal absorption totals through the first half of 2014, it should be noted that transaction volume in the District of Columbia is up 16% from the past four-quarter’s average. With most of the anticipated large move-outs already completed, a continued increase in transaction volume in the second half of 2014 could bring the growth needed to balance out the first half of the year. Overall Vacancy Net Absorption/Asking Rent 4Q TRAILING AVERAGE WASHINGTON, DC Office Market Snapshot Second Quarter • 2014 Market Indicators 2Q 13 2Q 14 12-Month Forecast Overall Vacancy 10.3% 11.2% Net Absorption 123K (321K) Under Construction 1.6M 1.5M Average Asking Rent $49.29 $50.35 Economic Indicators Q2 14 Q2 13 12-Month Forecast DC Metro Employment 3.08M 3.08M DC Metro Unemployment 4.8% 5.5% U.S. Unemployment 6.3% 7.5% $47 $48 $49 $50 $51 -0.5 0 0.5 1 1.5 2 2.5 3 3.5 4 2010 2011 2012 2013 2014 Net Absorption, MSF Asking Rent, $ PSF 9.0% 9.5% 10.0% 10.5% 11.0% 11.5% 12.0% 2010 2011 2012 2013 2014 Historical Average = 10.6% Economy Market Overview
-
Upload
anonymous-lc9dgg -
Category
Documents
-
view
36 -
download
4
description
a
Transcript of CT DC 2Q14 Snapshot
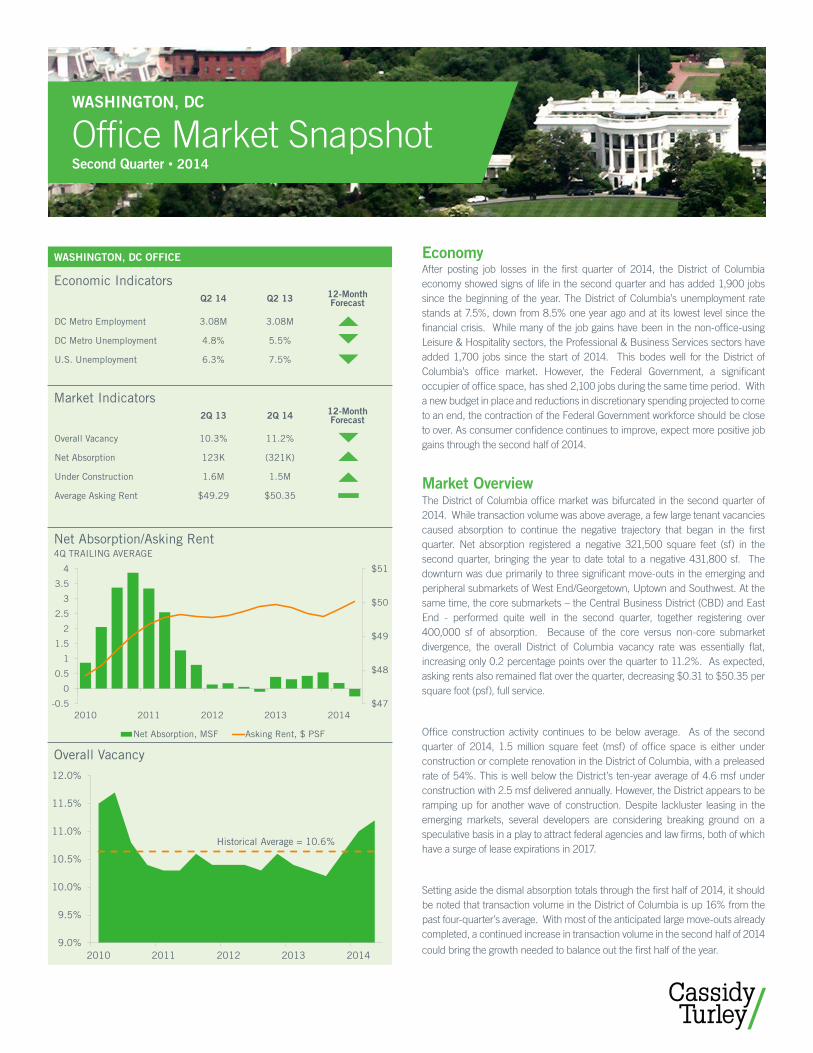
WASHINGTON, DC OFFICE After posting job losses in the first quarter of 2014, the District of Columbia economy showed signs of life in the second quarter and has added 1,900 jobs since the beginning of the year. The District of Columbia’s unemployment rate stands at 7.5%, down from 8.5% one year ago and at its lowest level since the financial crisis. While many of the job gains have been in the non-office-using Leisure & Hospitality sectors, the Professional & Business Services sectors have added 1,700 jobs since the start of 2014. This bodes well for the District of Columbia’s office market. However, the Federal Government, a significant occupier of office space, has shed 2,100 jobs during the same time period. With a new budget in place and reductions in discretionary spending projected to come to an end, the contraction of the Federal Government workforce should be close to over. As consumer confidence continues to improve, expect more positive job gains through the second half of 2014.
The District of Columbia office market was bifurcated in the second quarter of 2014. While transaction volume was above average, a few large tenant vacancies caused absorption to continue the negative trajectory that began in the first quarter. Net absorption registered a negative 321,500 square feet (sf) in the second quarter, bringing the year to date total to a negative 431,800 sf. The downturn was due primarily to three significant move-outs in the emerging and peripheral submarkets of West End/Georgetown, Uptown and Southwest. At the same time, the core submarkets – the Central Business District (CBD) and East End - performed quite well in the second quarter, together registering over 400,000 sf of absorption. Because of the core versus non-core submarket divergence, the overall District of Columbia vacancy rate was essentially flat, increasing only 0.2 percentage points over the quarter to 11.2%. As expected, asking rents also remained flat over the quarter, decreasing $0.31 to $50.35 per square foot (psf), full service.
Office construction activity continues to be below average. As of the second quarter of 2014, 1.5 million square feet (msf) of office space is either under construction or complete renovation in the District of Columbia, with a preleased rate of 54%. This is well below the District’s ten-year average of 4.6 msf under construction with 2.5 msf delivered annually. However, the District appears to be ramping up for another wave of construction. Despite lackluster leasing in the emerging markets, several developers are considering breaking ground on a speculative basis in a play to attract federal agencies and law firms, both of which have a surge of lease expirations in 2017.
Setting aside the dismal absorption totals through the first half of 2014, it should be noted that transaction volume in the District of Columbia is up 16% from the past four-quarter’s average. With most of the anticipated large move-outs already completed, a continued increase in transaction volume in the second half of 2014
could bring the growth needed to balance out the first half of the year.
Overall Vacancy
Net Absorption/Asking Rent 4Q TRAILING AVERAGE
WASHINGTON, DC
Office Market SnapshotSecond Quarter • 2014
Market Indicators2Q 13 2Q 14 12-Month
Forecast
Overall Vacancy 10.3% 11.2%
Net Absorption 123K (321K)
Under Construction 1.6M 1.5M
Average Asking Rent $49.29 $50.35
Economic IndicatorsQ2 14 Q2 13 12-Month
Forecast
DC Metro Employment 3.08M 3.08M
DC Metro Unemployment 4.8% 5.5%
U.S. Unemployment 6.3% 7.5%
$47
$48
$49
$50
$51
-0.5
0
0.5
1
1.5
2
2.5
3
3.5
4
2010 2011 2012 2013 2014
Net Absorption, MSF Asking Rent, $ PSF
9.0%
9.5%
10.0%
10.5%
11.0%
11.5%
12.0%
2010 2011 2012 2013 2014
Historical Average = 10.6%
Economy
Market Overview

www.cassidyturley.com | 2
Key Sales Transactions 2Q 14
TOTAL
BLDGSINVENTORY
SUBLET
VACANT
TOTAL
VACANT
VACANCY
RATE
AVAILABILITY
RATE
CURRENT
ABSORPTION
YTD
ABSORPTION
UNDER
CONSTRUCTION
AVERAGE
ASKING RENT
Submarket
CBD 251 38,705,167 298,228 4,347,282 11.2% 15.3% 250,489 189,503 296,594 $49.60
East End 201 39,506,894 247,924 4,180,680 10.6% 18.4% 154,930 92,424 794,373 $54.18
West End/Georgetown 59 6,019,052 21,986 689,824 11.5% 17.9% (228,624) (360,523) 0 $48.14
Capitol Hill 44 4,642,579 31,798 308,439 6.6% 17.4% 29,186 (13,618) 0 $55.47
NoMa 39 10,289,374 8,756 1,544,934 15.0% 16.4% 4,452 45,689 0 $47.11
Southwest 34 13,382,559 23,382 1,365,318 10.2% 14.7% (130,380) (176,379) 342,000 $48.17
Capitol Riverfront/Southeast 11 3,736,758 13,679 480,567 12.9% 17.1% 61,715 216,038 0 $42.23
Uptown 97 6,489,940 11,449 847,466 13.1% 21.0% (463,223) (424,902) 74,349 $40.24
WASHINGTON, DC MARKET TOTALS
TOTAL 736 122,772,323 657,202 13,764,510 11.2% 16.9% (321,455) (431,768) 1,507,316 $50.35
PROPERTY SF SELLER/BUYER PRICE SUBMARKET
Tech World Plaza: 800 K and 801 Eye Streets, NW 758,338 The JBG Companies / Meridian Group $325,000,000 East End
1775 Eye Street, NW 184,918 AEW Capital Management / Washington Real Estate Investment Trust $104,500,000 CBD
999 E Street, NW 174,072 UrbanAmerica LP / Princeton Holdings LLC $95,163,966 East End
Tower Building: 1401 K Street, NW 124,706 Guardian Realty Investors / First Potomac Realty Trust $58,000,000 East End
Key Lease Transactions 2Q 14
PROPERTY SF TENANT TRANSACTION TYPE SUBMARKET
555 13th Street, NW 384,700 Hogan Lovells Renewal East End
1301 K Street, NW 248,300 Washington Post Relet East End
1201 Eye Street, NW 219,800 GSA- U.S. National Park Service Renewal East End
1800 G Street, NW 164,000 GSA- U.S. Department of Veterans Affairs Renewal CBD
1301 K Street, NW 79,500 Reed Smith Renewal East End
1625 Eye Street, NW 71,300 Laborers' International Union of North America Relet CBD
5301 Wisconsin Avenue, NW 63,200 Boies, Schiller & Flexner Renewal Uptown
1310 G Street, NW 60,300 GSA- Alcohol and Tobacco Tax and Trade Bureau Renewal East End
1722 Eye Street, NW 54,800 GSA- U.S. Department of the Treasury Relet CBD
1025 F Street, NW 48,400 GSA- U.S. Environmental Protection Agency Renewal East End
WASHINGTON, DC
Office Market SnapshotSecond Quarter • 2014
Bethany Schneider
Research Analyst
2101 L Street, NW, Suite 700
Washington, DC 20037
Tel: 202.463.2100
Fax: 202.223.2989
Email: [email protected]
The information contained within this report is gathered from multiple sources considered to be reliable. The information may contain errors or omissions and is presented without any warranty or representations as to its accuracy.
Copyright © 2014 Cassidy Turley. All rights reserved.
About Cassidy TurleyCassidy Turley is a leading commercial real estate services provider with more than 4,000 professionals in more than 60 offices
nationwide. With headquarters in Washington, DC, the company represents a wide range of clients—from small businesses to
Fortune 500 companies, from local non-profits to major institutions. The firm completed transactions valued at $25.8 billion in 2013,
manages approximately 400 million square feet on behalf of institutional, corporate and private clients and supports more than
24,000 domestic corporate services locations. Cassidy Turley serves owners, investors and tenants with a full spectrum of integrated
commercial real estate services—including capital markets, tenant representation, corporate services, project leasing, property
management, project and development services, and research and consulting. Cassidy Turley enhances its global service delivery
outside North America through a partnership with GVA, giving clients access to commercial real estate professionals in 65 international
markets. Please visit www.cassidyturley.com for more information about Cassidy Turley.
preliminary