csx Dahlman Rose Conference 09.11.08
22
Dahlman Rose Global Transportation Conference September 2008 Dahlman Rose Global Transportation Conference September 2008
-
Upload
finance27 -
Category
Economy & Finance
-
view
103 -
download
2
Transcript of csx Dahlman Rose Conference 09.11.08

11
Dahlman Rose Global Transportation Conference
September 2008
Dahlman Rose Global Transportation Conference
September 2008
22
Forward-Looking DisclosureForward-Looking Disclosure
This information and other statements by the company contain forward-looking statements within the meaning of the Private Securities Litigation Reform Act with respect to, among other items: projections and estimates of earnings, revenues, cost-savings, expenses, or other financial items; statements of management’s plans, strategies and objectives for future operation, and management’s expectations as to future performance and operations and the time by which objectives will be achieved; statements concerning proposed new products and services; and statements regarding future economic, industry or market conditions or performance. Forward-looking statements are typically identified by words or phrases such as “believe,” “expect,” “anticipate,” “project,” “estimate” and similar expressions.
Forward-looking statements speak only as of the date they are made, and the company undertakes no obligation to update or revise any forward-looking statement. If the company does update any forward-looking statement, no inference should be drawn that the company will make additional updates with respect to that statement or any other forward-looking statements.
Forward-looking statements are subject to a number of risks and uncertainties, and actual performance or results could differ materially from that anticipated by these forward-looking statements. Factors that may cause actual results to differ materially from those contemplated by these forward-looking statements include, among others: (i) the company’s success in implementing its financial and operational initiatives; (ii) changes in domestic or international economic or business conditions, including those affecting the rail industry (such as the impact of industry competition, conditions, performance and consolidation); (iii) legislative or regulatory changes; (iv) the inherent business risks associated with safety and security; and (v) the outcome of claims and litigation involving or affecting the company.
Other important assumptions and factors that could cause actual results to differ materially from those in the forward- looking statements are specified in the company’s SEC reports, accessible on the SEC’s website at www.sec.gov and the company’s website at: www.investors.csx.com
33
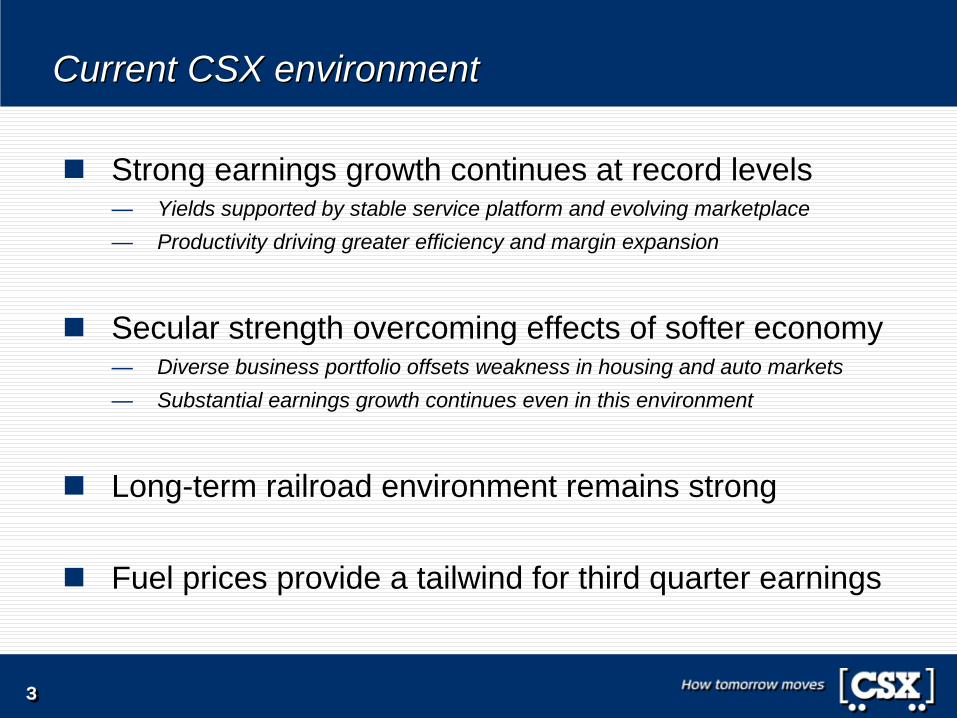
Current CSX environmentCurrent CSX environment
Strong earnings growth continues at record levels— Yields supported by stable service platform and evolving marketplace— Productivity driving greater efficiency and margin expansion
Secular strength overcoming effects of softer economy— Diverse business portfolio offsets weakness in housing and auto markets— Substantial earnings growth continues even in this environment
Long-term railroad environment remains strong
Fuel prices provide a tailwind for third quarter earnings

44
Earnings and margin growth remains significantEarnings and margin growth remains significant
Comparable Operating Income in Millions
$1,981
$2,233
$2,495
2006 2007 LTM
ComparableOperating Margin
20.7%
22.3%
23.3%
2006 2007 LTM
Note: See GAAP reconciliation; peer group includes BNI, CNI, CP, NSC and UNP
CSX Peer Group (indexed)

55
Management actions driving margin expansionManagement actions driving margin expansion
Comparable Operating Margin
11.6%13.3%
18.1%
20.7%22.3% 23.3%
2003 2004 2005 2006 2007 LTM
Realigned network with disciplined investment
Focused on process excellence teams and value pricing
Restructured management Developed a culture of accountability
Rolled out ONE Plan Aligned resources with ONE Plan
Rolled out TSI initiative
Note: See GAAP reconciliation

66
+ EvolvingEvolvingMarketplaceMarketplace
CSX Territory
Increasing HighwayCongestion
Strong service and market environment driving priceStrong service and market environment driving price
On-timeOriginations
StrongStrongServiceService
51%
76% 79% 79%
2005 2006 2007 LTM
PricingPricingOpportunityOpportunity
“Same Store Sales”Price Increase
5.7%
6.6% 6.7% 6.6%
2005 2006 2007 LTM
Pricing environment favorable through 2008+
Pricing environment Pricing environment favorable through 2008+favorable through 2008+

77
$82 billion ofvalue created$82 billion ofvalue created
Big-6 CapitalizationDollars in Billions
$75
$157
2004 2008
Rail pricing is still in the early stages of recoveryRail pricing is still in the early stages of recovery
Source: Association of American Railroads; Big-6 Capitalization reflects market performance through September 5, 2008
Inflation-Adjusted PricingIndexed: 1981 = 100
100
4051
1981 2004 2008

88
Housing and automotive sectors remain weak . . .Housing and automotive sectors remain weak . . .
Housing Starts
5.2% 6.3%
(12.6%)
(26.0%)
(15.8%)
2004 2005 2006 2007 LTM
Auto Production
(0.7%)
(0.0%)
(3.1%)(1.5%)
(18.5%)
2004 2005 2006 2007 LTMSource: Global Insight, August 2008

99
. . . although ton miles and operations remain stable. . . although ton miles and operations remain stable
Velocity (mph)
19.2 19.9 20.8 20.9
2005 2006 2007 LTM
Dwell Time (hours)29.7
25.1 23.2 22.7
2005 2006 2007 LTM
Revenue Ton Milesand Volume
247.4253.0 247.9 249.0
7,350 7,358
7,1167,026
2005 2006 2007 LTM
RTM's (billions) Volume (000)

1010
.
.
.
Diversity of business is key to secular strengthDiversity of business is key to secular strength
2008 Year-to-Date Revenue
Note: Year-to-date data through June 2008
Coal29%
Food & Consumer4%
Forest7% Emerging Mkts
6%
Automotive7%
Intermodal13%
Chemicals13%
Agriculture9%
Phosphates5%
Metals7%
1111
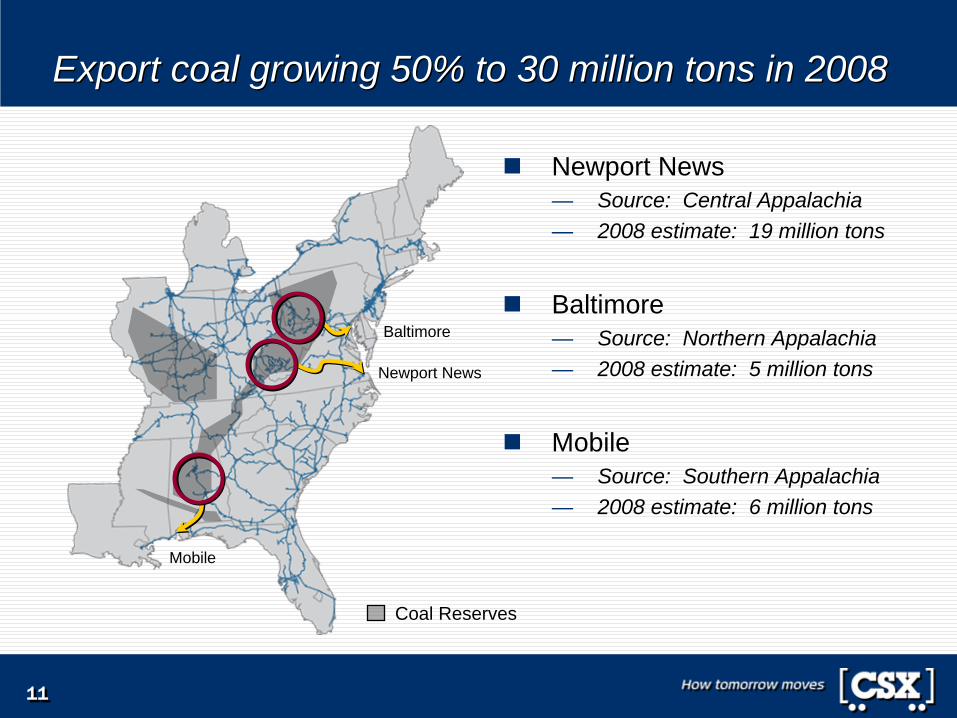
Export coal growing 50% to 30 million tons in 2008Export coal growing 50% to 30 million tons in 2008
Newport News— Source: Central Appalachia— 2008 estimate: 19 million tons
Baltimore— Source: Northern Appalachia— 2008 estimate: 5 million tons
Mobile— Source: Southern Appalachia— 2008 estimate: 6 million tons
Baltimore
Newport News
Mobile
Coal Reserves
1212
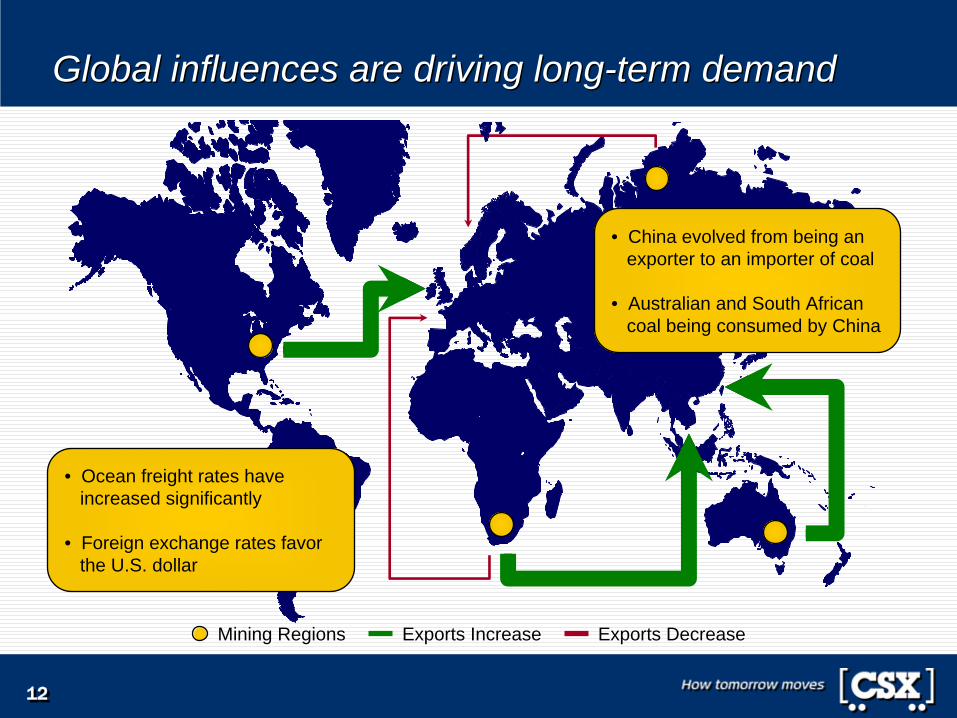
Global influences are driving long-term demandGlobal influences are driving long-term demand
• China evolved from being an exporter to an importer of coal
• Australian and South African coal being consumed by China
• Ocean freight rates have increased significantly
• Foreign exchange rates favor the U.S. dollar
Mining Regions Exports Increase Exports Decrease

1313
Reinvestment Profile
Returns by Car Type
Stra
tegi
c O
wne
rshi
p V
alue
Long-term drivers support coal car investmentLong-term drivers support coal car investment
Coal fleet continually exceeds reinvestment hurdle rates
Strategic ownership value is high for this business
Investing in additional coal car capacity— $70 million in 2008— $60 million in 2009
Projected IRR21%Bottom Dump Coal Cars
Bathtub Gondola Coal Cars

1414
Macro trends drive long-term opportunity for CSXMacro trends drive long-term opportunity for CSX
Trucking industry is challengedHighway congestion worsening; fuel costs and environmental advantages favor rail
Global consumption is risingPopulation, globalization drive demand for energy, food and other goods
Rail is valued by the publicPublic funding increasing for expanded and improved service products
East Coast ports are growingPanama Canal expansion and increased Suez Canal trade flows create opportunity
TodayToday
CSX Territory
2020 2020
Source: USDOT FHWA Freight Analysis Framework
1515
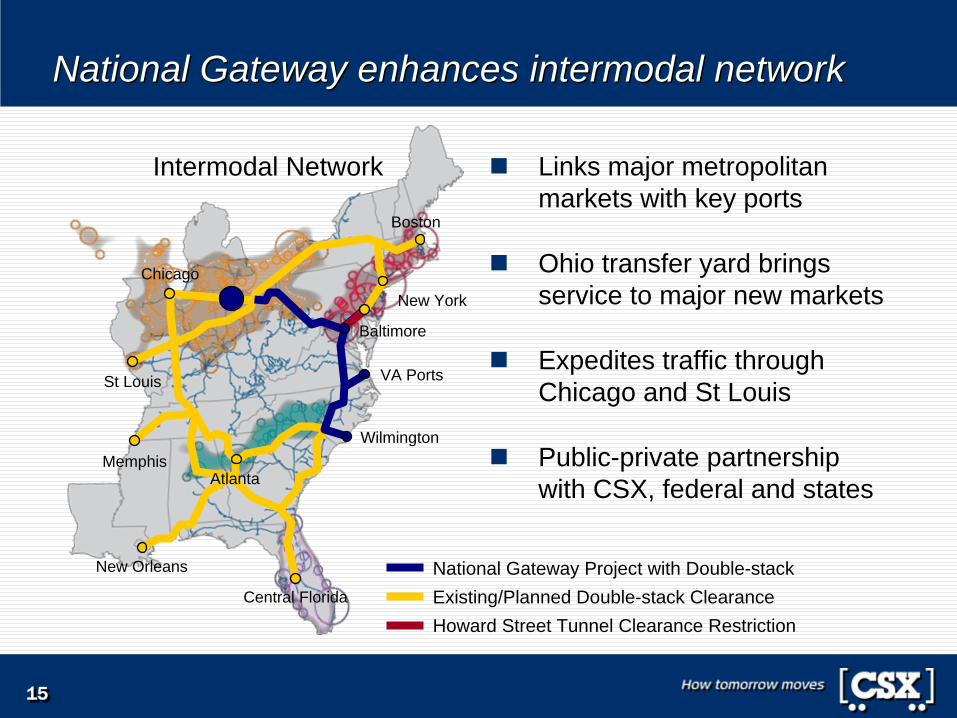
National Gateway enhances intermodal networkNational Gateway enhances intermodal network
Links major metropolitan markets with key ports
Ohio transfer yard brings service to major new markets
Expedites traffic through Chicago and St Louis
Public-private partnership with CSX, federal and states
New Orleans
St Louis
Memphis
National Gateway Project with Double-stackExisting/Planned Double-stack ClearanceHoward Street Tunnel Clearance Restriction
Intermodal Network
Central Florida
Chicago
New York
VA Ports
Wilmington
Baltimore
Boston
Atlanta

1616
FCF Before DividendsDollars in Millions
$376
$1,000
2007 Actual 2008 Forecast
2008 Financial Update . . . 2008 Financial Update . . .
FCF before dividends increases to about $1.0 billion
Capital spending increases to $1.75 billion; includes coal cars
Raising EPS guidance to$3.65 – $3.75, driven by:— Pricing gains of 6%+
— Productivity and efficiency gains
— Diverse business portfolio
— Moderating fuel prices
Note: Free Cash Flow and capital spending include the impact of recent storm related damages

Highway Diesel Prices versus Two Month Lag
1717
Q3 07
Positive Lag Impact
Negative Lag Impact
Q4 07 Q1 08 Q2 08 Q3 08 Q4 08
Moderating fuel prices will benefit third quarterModerating fuel prices will benefit third quarter
Weekly HDF Monthly HDF (two-month lag)
Source: Energy Information Administration and NYMEX; HDF actual data through August 2008

Raising long-term targets on higher 2008 base . . .Raising long-term targets on higher 2008 base . . .
Note: New earnings per share targets include impact of current share repurchase program
New2009–2010
Targets
New2009–2010
Targets
Low 70’sBy 2010
OperatingRatio
18%–21%CAGR
Earnings Per Share
13%–15%CAGR
OperatingIncome
Previous2008–2010
Targets
Builds off 2008’s results
1818
High 60’sBy 2010
High 60’sBy 2010
20%–25%CAGR
20%–25%CAGR
15%–20%CAGR
15%–20%CAGR
Built off 2007’s results
1919
Dahlman Rose Global Transportation Conference
September 2008
Dahlman Rose Global Transportation Conference
September 2008
Appendix: GAAP ReconciliationAppendix: GAAP Reconciliation
2121
GAAP Reconciliation DisclosureGAAP Reconciliation Disclosure
CSX reports its financial results in accordance with generally accepted accounting principles (“GAAP”). However, management believes that certain non-GAAP financial measures used to manage the company’s business that fall within the meaning of Regulation G (Disclosure of Non-GAAP Financial Measures) by the SEC may provide users of the financial information with additional meaningful comparisons to prior reported results.
CSX has provided financial information for certain items, which are non-GAAP financial measures. The company’s management evaluates its business and makes certain operating decisions (e.g., budgeting, forecasting, employee compensation, asset management and resource allocation) using these adjusted numbers
Likewise, this information facilitates comparisons to financial results that are directly associated with ongoing business operations as well as provides comparable historical information. Lastly, earnings forecasts prepared by stock analysts and other third parties generally exclude the effects of items that are difficult to predict or measure in advance and are not directly related to CSX’s ongoing operations. A reconciliation between GAAP and the non-GAAP measure is provided. These non-GAAP measures should not be considered a substitute for GAAP measures.

GAAP reconciliation to comparable resultsGAAP reconciliation to comparable results
Dollars in millions 2003 2004 2005 2006 2007 LTM
Operating Revenue $ 7,573 $ 8,040 $ 8,618 $ 9,566 $ 10,030 $ 10,698
Operating Expense 7,058 7,043 7,062 7,417 7,770 8,192
Operating Income $ 515 $ 997 $ 1,556 $ 2,149 $ 2,260 $ 2,506
Less Pretax Gain on Insurance Recoveries - - - (168) (27) (11)
Plus Restructuring Charge 22 71 - - - -
Plus Provision for Casualty Claims 232 - - - - -
Plus Additional Loss on Sale 108 - - - - -
Comparable Operating Income $ 877 $ 1,068 $ 1,556 $ 1,981 $ 2,233 $ 2,495
Comparable Operating Margin 11.6% 13.3% 18.1% 20.7% 22.3% 23.3%
Note: LTM is July 2007 through June 2008
2222