CSOD Investor Deck
31
Investor Presentation First Quarter 2015
-
Upload
ircornerstone -
Category
Investor Relations
-
view
5.340 -
download
2
Transcript of CSOD Investor Deck
Investor Presentation
First Quarter 2015
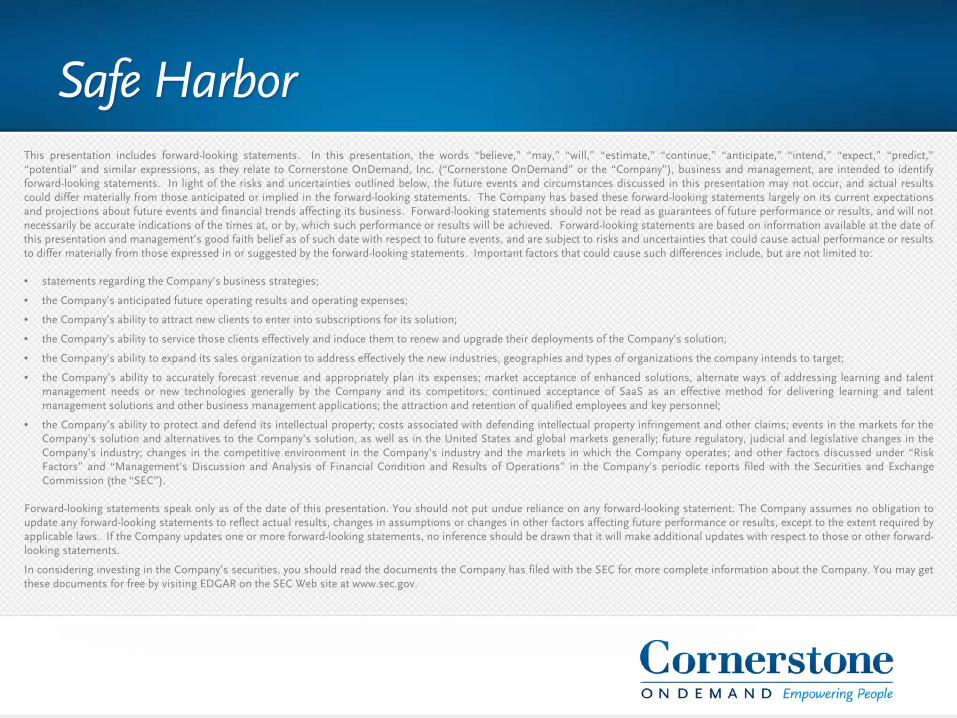
This presentation includes forward-looking statements. In this presentation, the words “believe,” “may,” “will,” “estimate,” “continue,” “anticipate,” “intend,” “expect,” “predict,” “potential” and similar expressions, as they relate to Cornerstone OnDemand, Inc. (“Cornerstone OnDemand” or the “Company”), business and management, are intended to identify forward-looking statements. In light of the risks and uncertainties outlined below, the future events and circumstances discussed in this presentation may not occur, and actual results could differ materially from those anticipated or implied in the forward-looking statements. The Company has based these forward-looking statements largely on its current expectations and projections about future events and financial trends affecting its business. Forward-looking statements should not be read as guarantees of future performance or results, and will not necessarily be accurate indications of the times at, or by, which such performance or results will be achieved. Forward-looking statements are based on information available at the date of this presentation and management’s good faith belief as of such date with respect to future events, and are subject to risks and uncertainties that could cause actual performance or results to differ materially from those expressed in or suggested by the forward-looking statements. Important factors that could cause such differences include, but are not limited to:
• statements regarding the Company’s business strategies;
• the Company’s anticipated future operating results and operating expenses;
• the Company’s ability to attract new clients to enter into subscriptions for its solution;
• the Company’s ability to service those clients effectively and induce them to renew and upgrade their deployments of the Company’s solution;
• the Company’s ability to expand its sales organization to address effectively the new industries, geographies and types of organizations the company intends to target;
• the Company’s ability to accurately forecast revenue and appropriately plan its expenses; market acceptance of enhanced solutions, alternate ways of addressing learning and talent management needs or new technologies generally by the Company and its competitors; continued acceptance of SaaS as an effective method for delivering learning and talent management solutions and other business management applications; the attraction and retention of qualified employees and key personnel;
• the Company’s ability to protect and defend its intellectual property; costs associated with defending intellectual property infringement and other claims; events in the markets for the Company’s solution and alternatives to the Company’s solution, as well as in the United States and global markets generally; future regulatory, judicial and legislative changes in the Company’s industry; changes in the competitive environment in the Company’s industry and the markets in which the Company operates; and other factors discussed under “Risk Factors” and “Management’s Discussion and Analysis of Financial Condition and Results of Operations” in the Company’s periodic reports filed with the Securities and Exchange Commission (the “SEC”).
Forward-looking statements speak only as of the date of this presentation. You should not put undue reliance on any forward-looking statement. The Company assumes no obligation to update any forward-looking statements to reflect actual results, changes in assumptions or changes in other factors affecting future performance or results, except to the extent required by applicable laws. If the Company updates one or more forward-looking statements, no inference should be drawn that it will make additional updates with respect to those or other forward-looking statements.
In considering investing in the Company’s securities, you should read the documents the Company has filed with the SEC for more complete information about the Company. You may get these documents for free by visiting EDGAR on the SEC Web site at www.sec.gov.
Safe Harbor
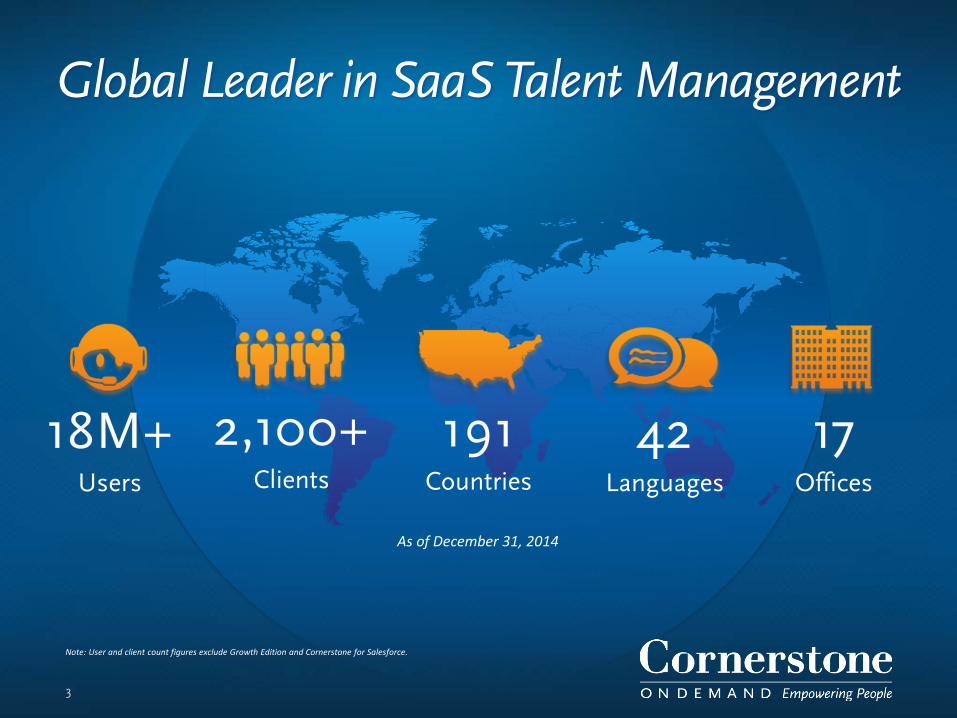
Global Leader in SaaS Talent Management
191 Countries
42 Languages
17 Offices
2,100+ Clients
18M+ Users
As of December 31, 2014
3
Note: User and client count figures exclude Growth Edition and Cornerstone for Salesforce.
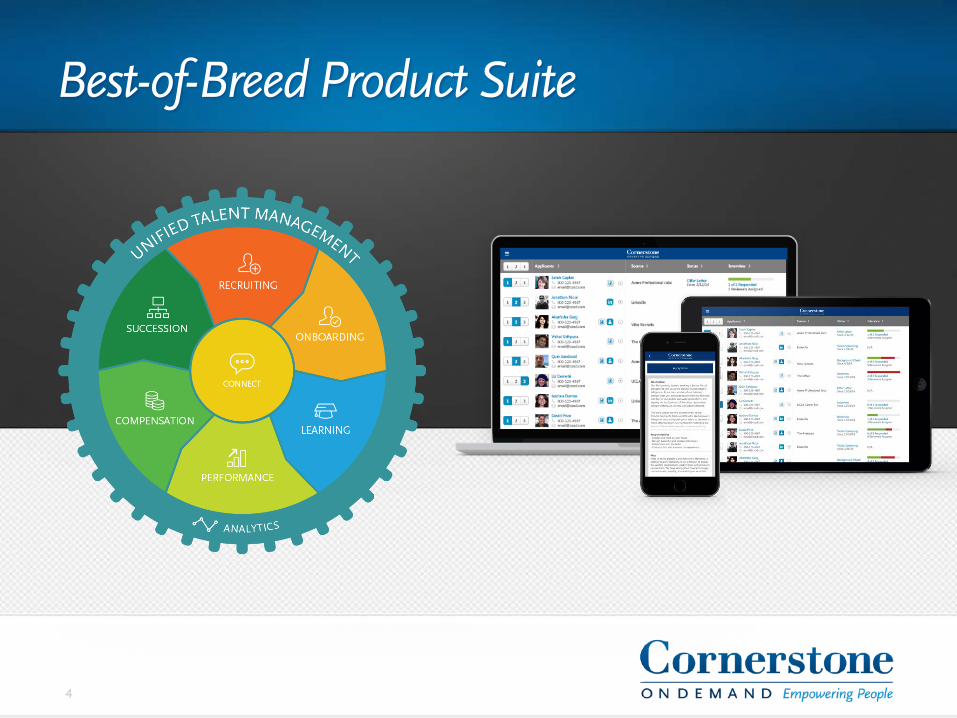
Best-of-Breed Product Suite
4
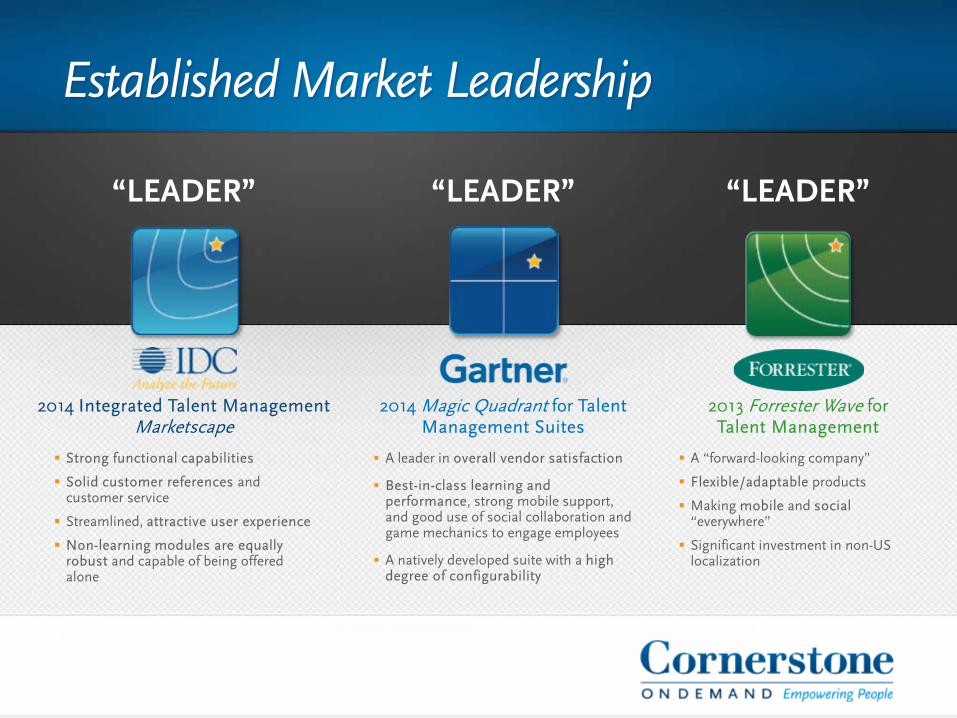
Established Market Leadership
“LEADER”
2013 Forrester Wave for Talent Management
A “forward-looking company”
Flexible/adaptable products
Making mobile and social “everywhere”
Significant investment in non-US localization
“LEADER”
2014 Integrated Talent Management Marketscape
Strong functional capabilities
Solid customer references and customer service
Streamlined, attractive user experience
Non-learning modules are equally robust and capable of being offered alone
“LEADER”
2014 Magic Quadrant for Talent Management Suites
A leader in overall vendor satisfaction
Best-in-class learning and performance, strong mobile support, and good use of social collaboration and game mechanics to engage employees
A natively developed suite with a high degree of configurability
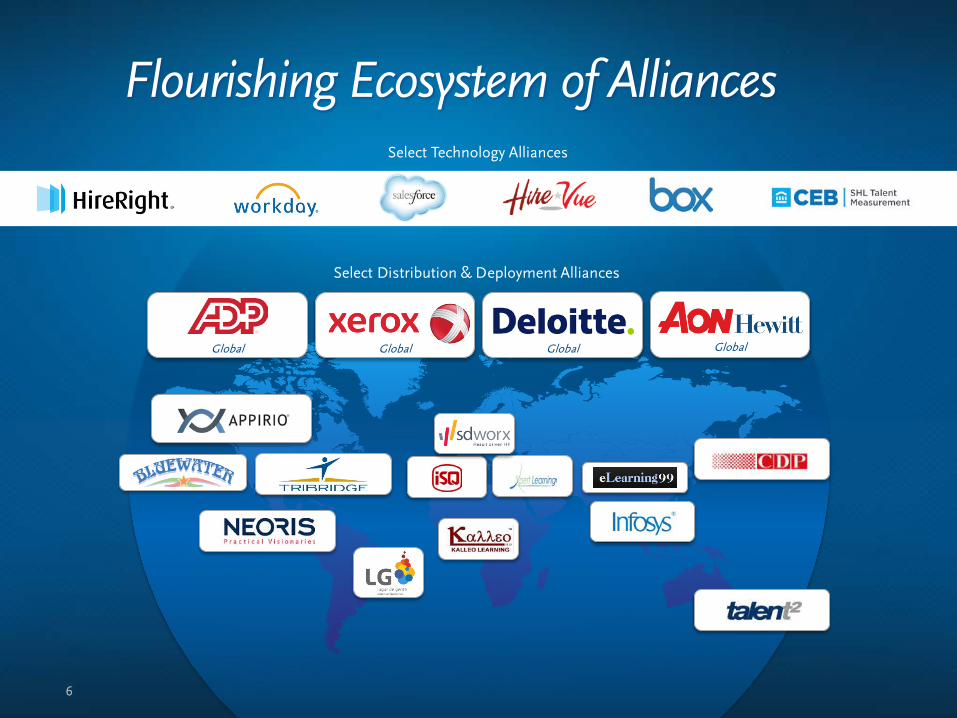
Flourishing Ecosystem of Alliances
Select Distribution & Deployment Alliances
Select Technology Alliances
6
Global Global Global Global
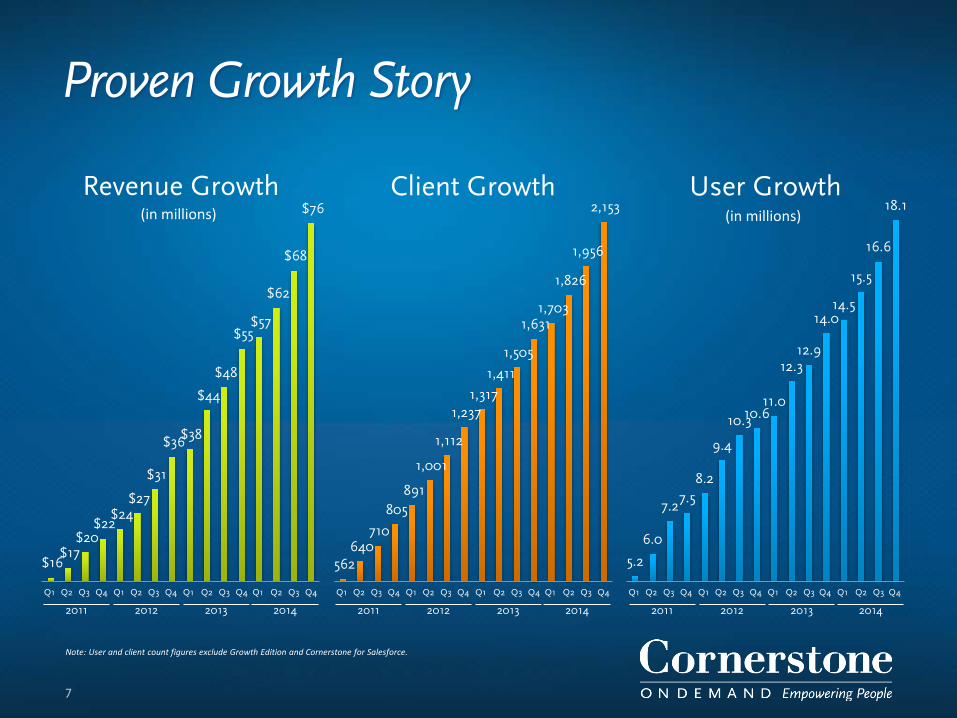
Proven Growth Story
$16 $17
$20 $22
$24 $27
$31
$36 $38
$44
$48
$55 $57
$62
$68
$76
Q1 Q2 Q3 Q4 Q1 Q2 Q3 Q4 Q1 Q2 Q3 Q4 Q1 Q2 Q3 Q4
Revenue Growth
562 640
710
805 891
1,001
1,112
1,237 1,317
1,411
1,505
1,631 1,703
1,826
1,956
2,153
Q1 Q2 Q3 Q4 Q1 Q2 Q3 Q4 Q1 Q2 Q3 Q4 Q1 Q2 Q3 Q4
Client Growth
5.2
6.0
7.2 7.5
8.2
9.4
10.3 10.6 11.0
12.3 12.9
14.0 14.5
15.5
16.6
18.1
Q1 Q2 Q3 Q4 Q1 Q2 Q3 Q4 Q1 Q2 Q3 Q4 Q1 Q2 Q3 Q4
User Growth (in millions) (in millions)
7
Note: User and client count figures exclude Growth Edition and Cornerstone for Salesforce.
2011 2013 2012 2014 2011 2013 2012 2014 2011 2013 2012 2014
Competitive Differentiation
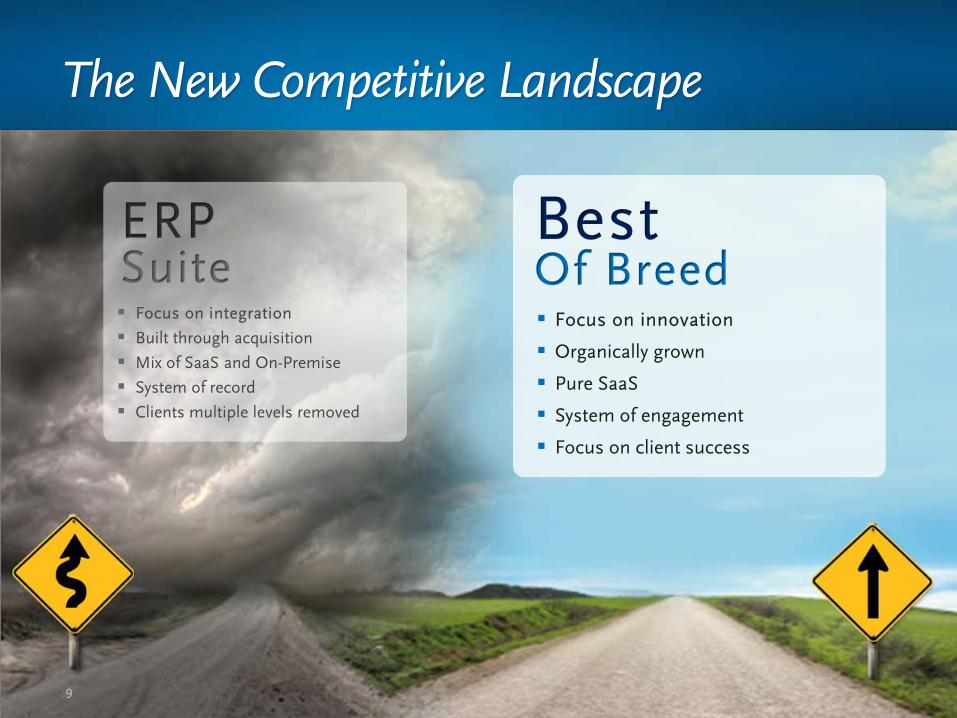
The New Competitive Landscape
Focus on innovation
Organically grown
Pure SaaS
System of engagement
Focus on client success
Focus on integration
Built through acquisition
Mix of SaaS and On-Premise
System of record
Clients multiple levels removed
ERP Suite
Best Of Breed
9
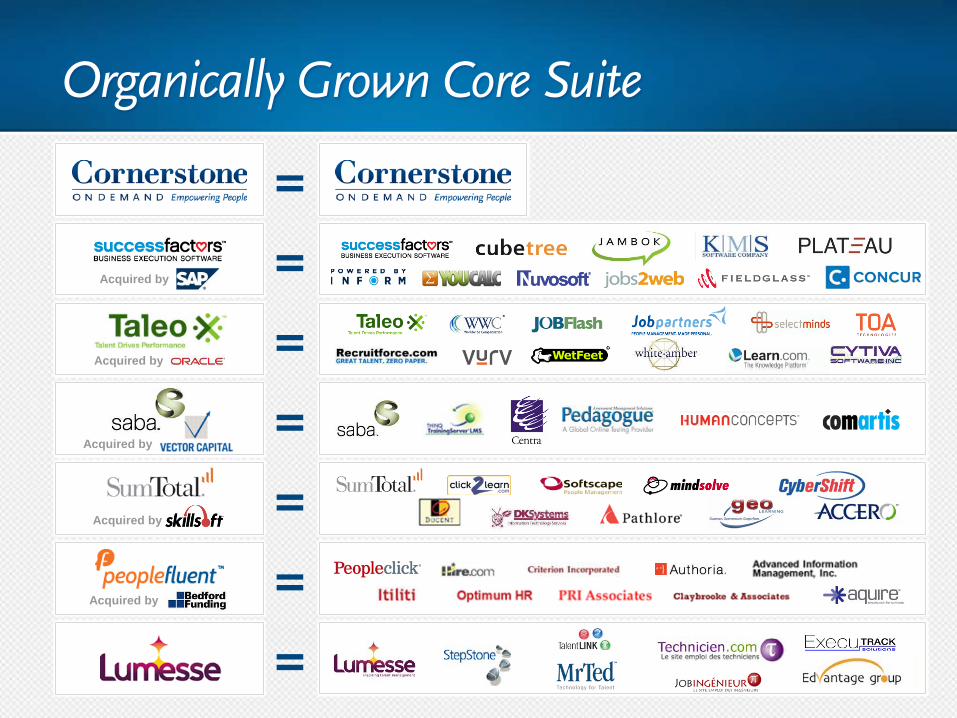
Organically Grown Core Suite
Acquired by
Acquired by
Acquired by
Acquired by
Acquired by
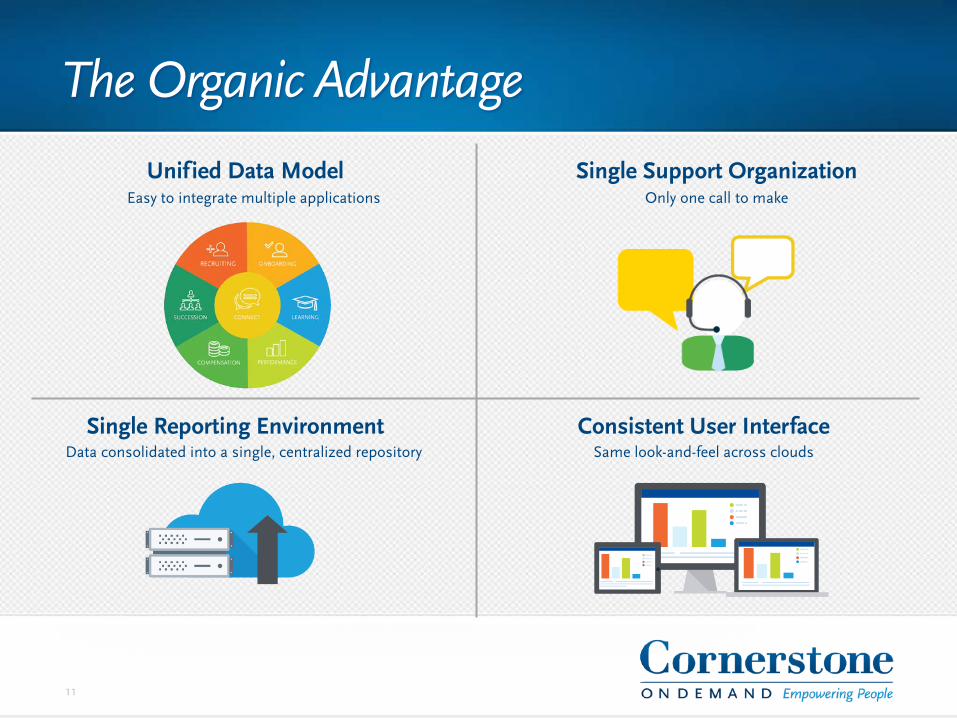
Unif ied Data Model Single Support Organization
Consistent User Interface Single Reporting Environment Data consolidated into a single, centralized repository Same look-and-feel across clouds
Easy to integrate multiple applications Only one call to make
11
The Organic Advantage
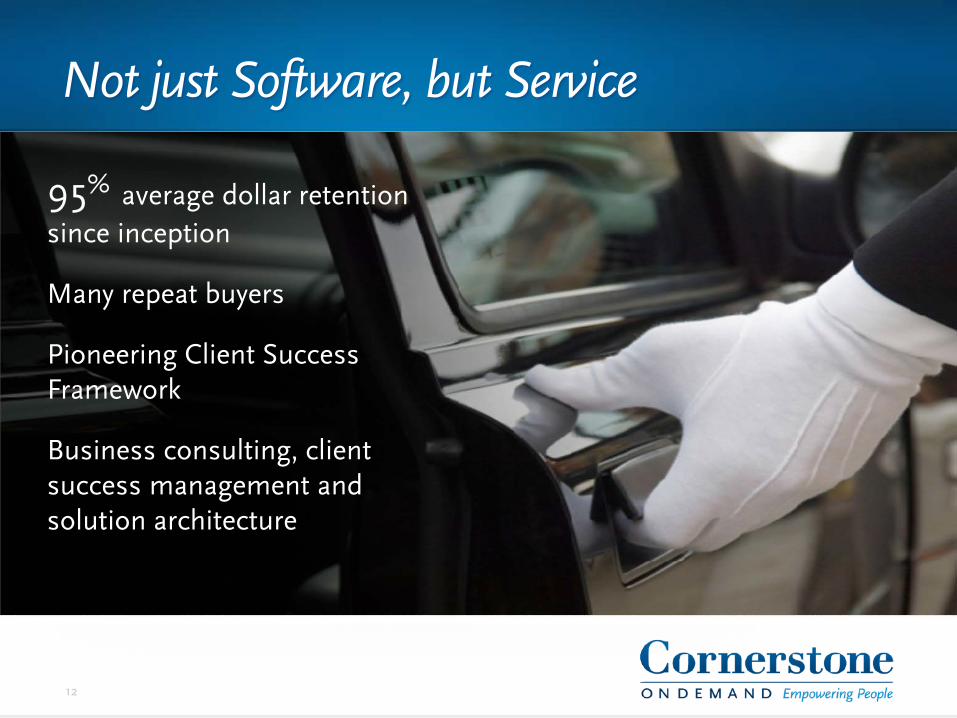
Not just Software, but Service
12
95% average dollar retention since inception
Many repeat buyers
Pioneering Client Success Framework
Business consulting, client success management and solution architecture
Financial Results
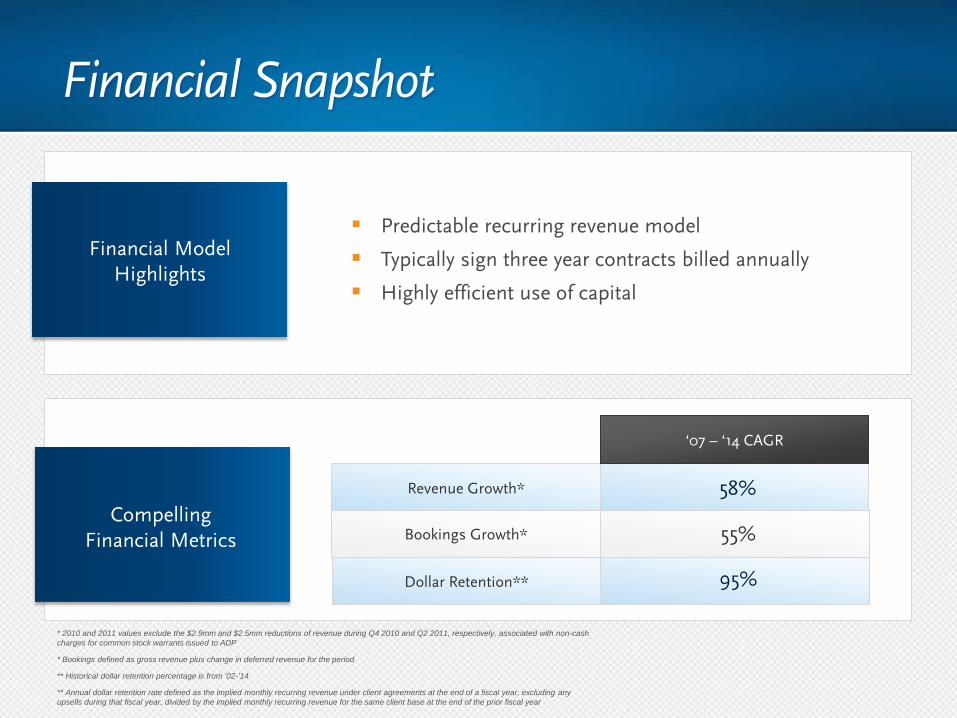
Financial Snapshot
Predictable recurring revenue model
Typically sign three year contracts billed annually
Highly efficient use of capital
* 2010 and 2011 values exclude the $2.9mm and $2.5mm reductions of revenue during Q4 2010 and Q2 2011, respectively, associated with non-cash charges for common stock warrants issued to ADP
** Annual dollar retention rate defined as the implied monthly recurring revenue under client agreements at the end of a fiscal year, excluding any upsells during that fiscal year, divided by the implied monthly recurring revenue for the same client base at the end of the prior fiscal year
** Historical dollar retention percentage is from ’02-’14
55% Bookings Growth*
‘07 – ‘14 CAGR
58% Revenue Growth*
95% Dollar Retention**
Financial Model Highlights
Compelling Financial Metrics
* Bookings defined as gross revenue plus change in deferred revenue for the period
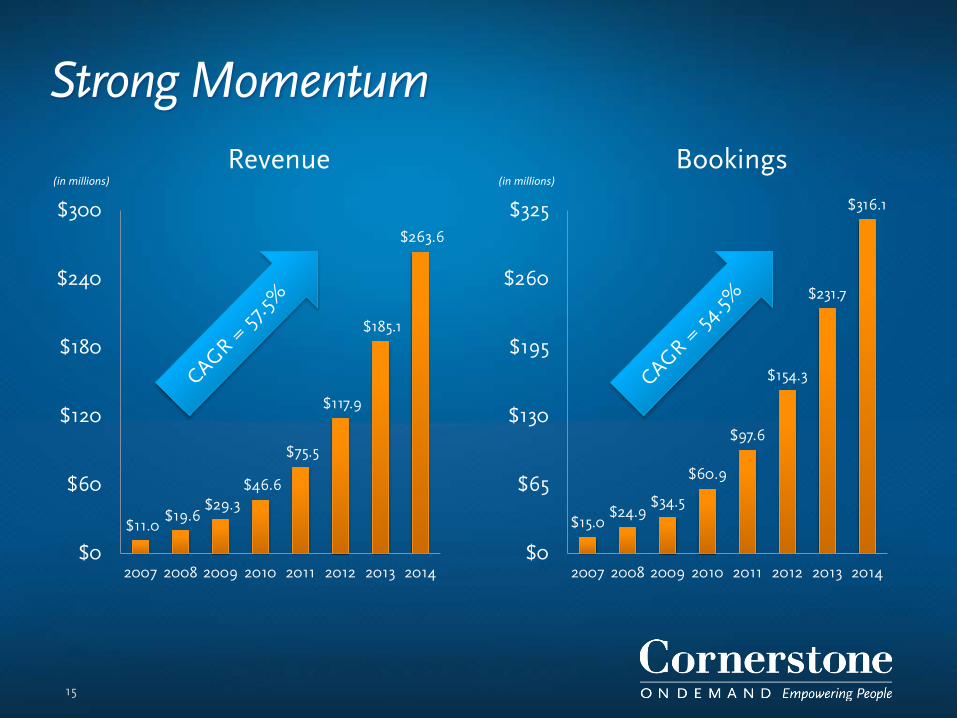
Strong Momentum
$11.0 $19.6
$29.3 $46.6
$75.5
$117.9
$185.1
$263.6
$0
$60
$120
$180
$240
$300
2007 2008 2009 2010 2011 2012 2013 2014
$15.0 $24.9
$34.5
$60.9
$97.6
$154.3
$231.7
$316.1
$0
$65
$130
$195
$260
$325
2007 2008 2009 2010 2011 2012 2013 2014
(in millions)
15
(in millions) Revenue Bookings
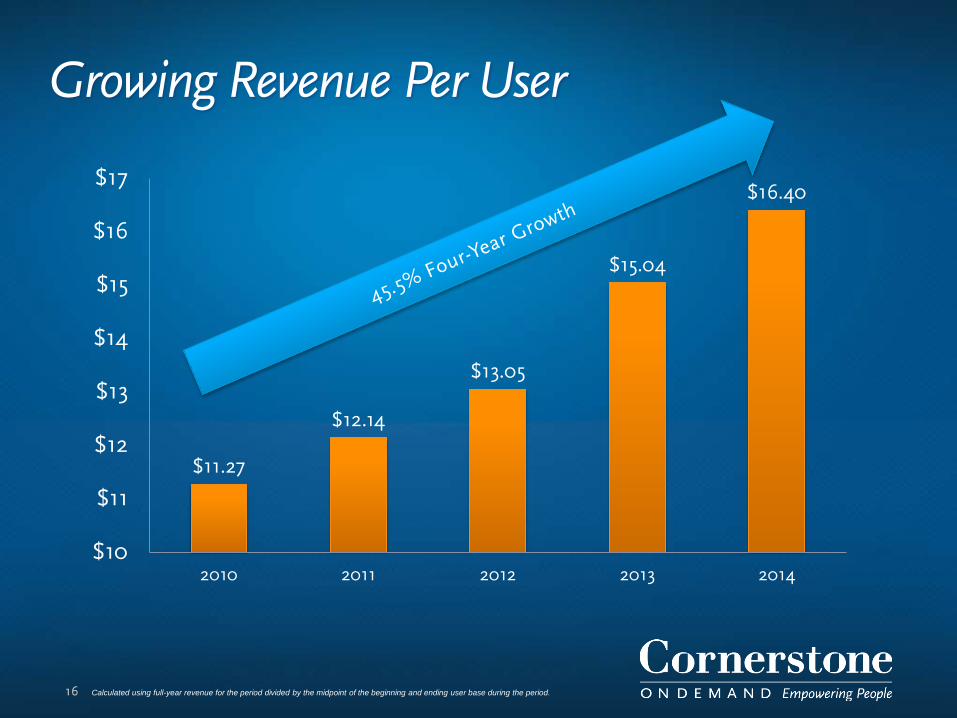
Growing Revenue Per User
16
$11.27
$12.14
$13.05
$15.04
$16.40
$10
$11
$12
$13
$14
$15
$16
$17
2010 2011 2012 2013 2014
Calculated using full-year revenue for the period divided by the midpoint of the beginning and ending user base during the period.
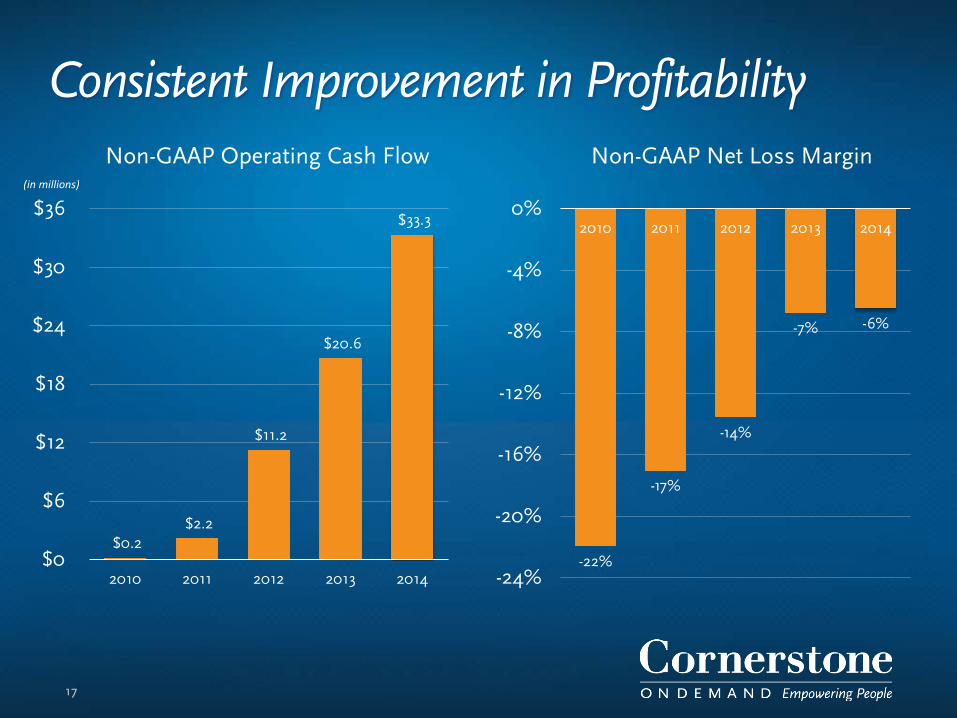
Consistent Improvement in Profitability
$0.2 $2.2
$11.2
$20.6
$33.3
$0
$6
$12
$18
$24
$30
$36
2010 2011 2012 2013 2014
(in millions)
17
-22%
-17%
-14%
-7% -6%
-24%
-20%
-16%
-12%
-8%
-4%
0%2010 2011 2012 2013 2014
Non-GAAP Operating Cash Flow Non-GAAP Net Loss Margin

Getting to $1 Billion
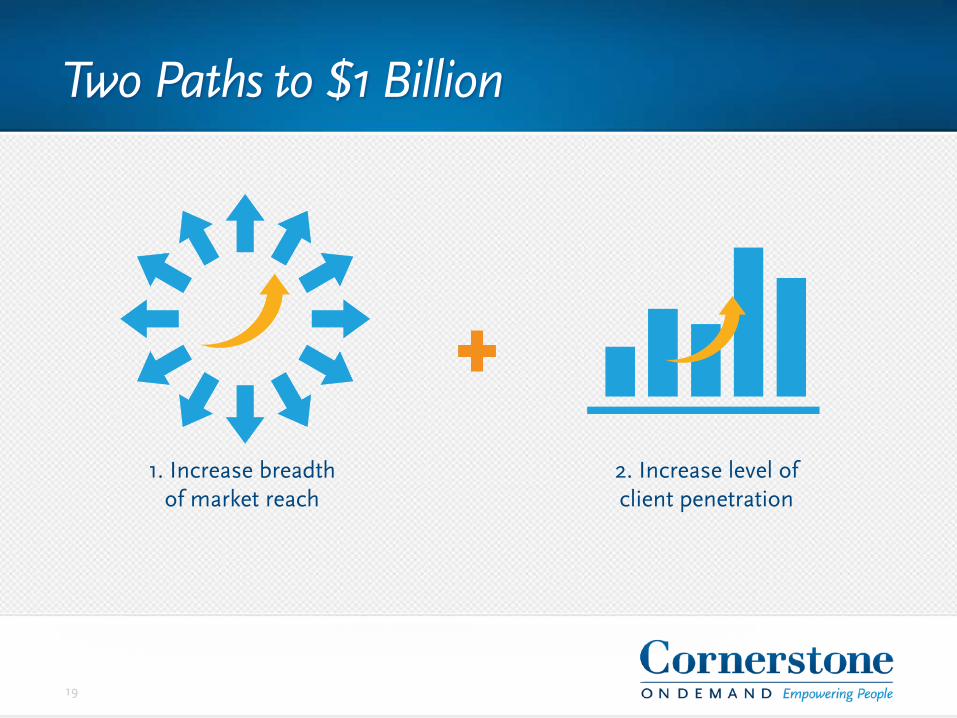
Two Paths to $1 Billion
19
1. Increase breadth of market reach
2. Increase level of client penetration

Getting to $1 Billion – Increase Breadth
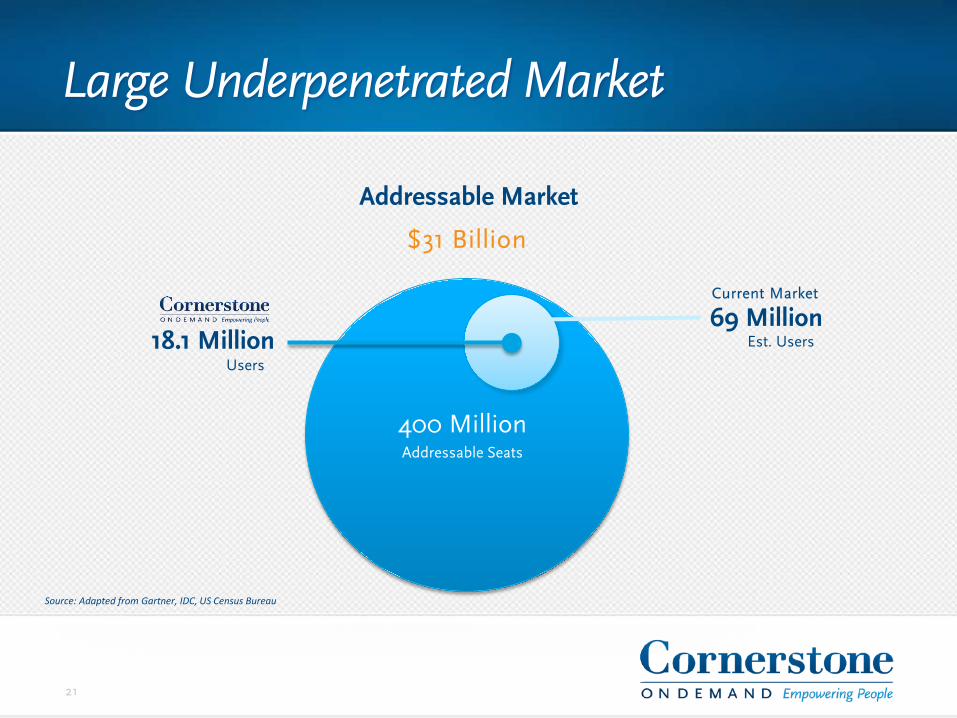
Large Underpenetrated Market
Source: Adapted from Gartner, IDC, US Census Bureau
Addressable Market
18.1 Million Users
$31 Billion
400 Million Addressable Seats
69 Million Est. Users
Current Market
21
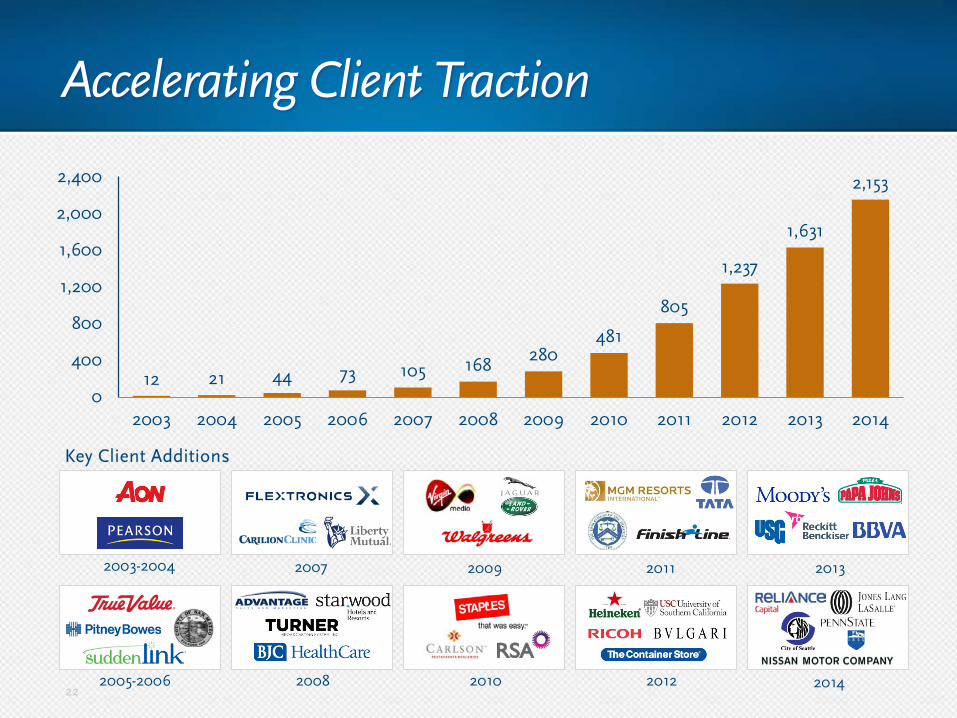
Accelerating Client Traction
2003-2004 2009 2011 2013 2007
2008 2010 2012 2014 2005-2006
Key Client Additions
12 21 44 73 105 168 280 481
805
1,237
1,631
2,153
0
400
800
1,200
1,600
2,000
2,400
2003 2004 2005 2006 2007 2008 2009 2010 2011 2012 2013 2014
22
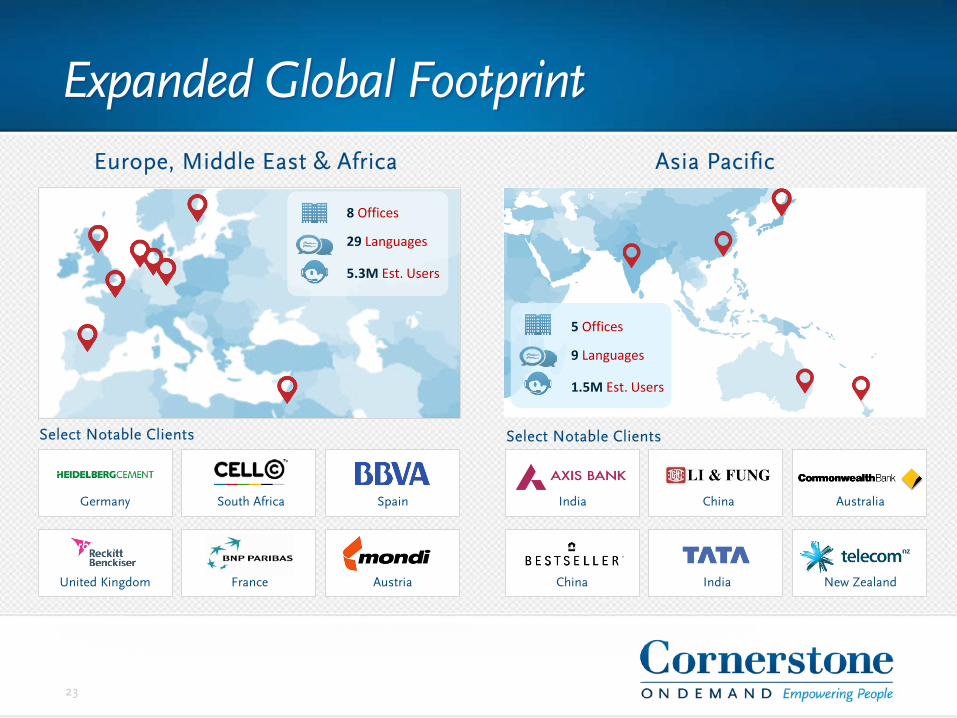
Expanded Global Footprint Europe, Middle East & Africa Asia Pacific
Select Notable Clients Select Notable Clients
Germany South Africa Spain
Austria France United Kingdom
India China Australia
New Zealand India China
8 Offices
29 Languages
5.3M Est. Users
5 Offices
9 Languages
1.5M Est. Users
23
x
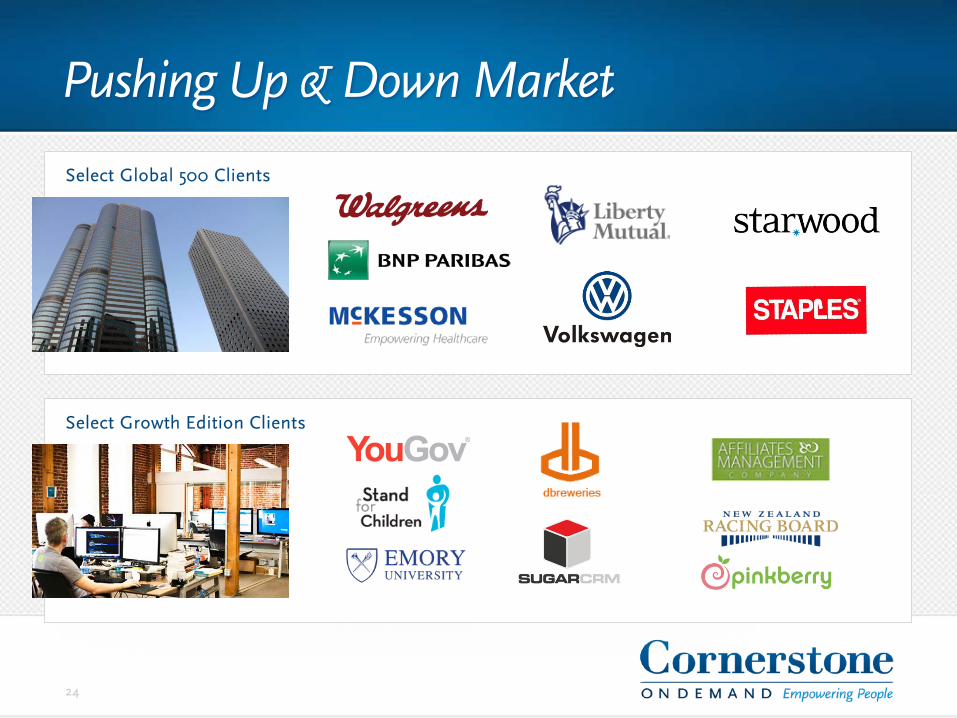
Pushing Up & Down Market
24
Select Global 500 Clients
Select Growth Edition Clients
25
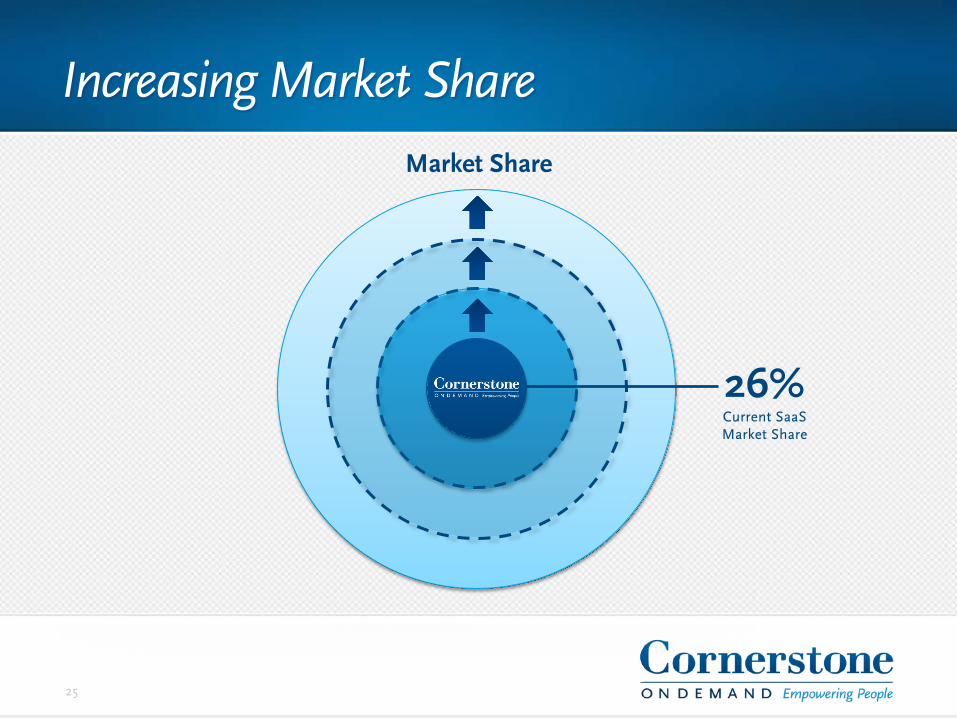
26%
Market Share
Increasing Market Share
Current SaaS Market Share

Getting to $1 Billion – Increase Depth
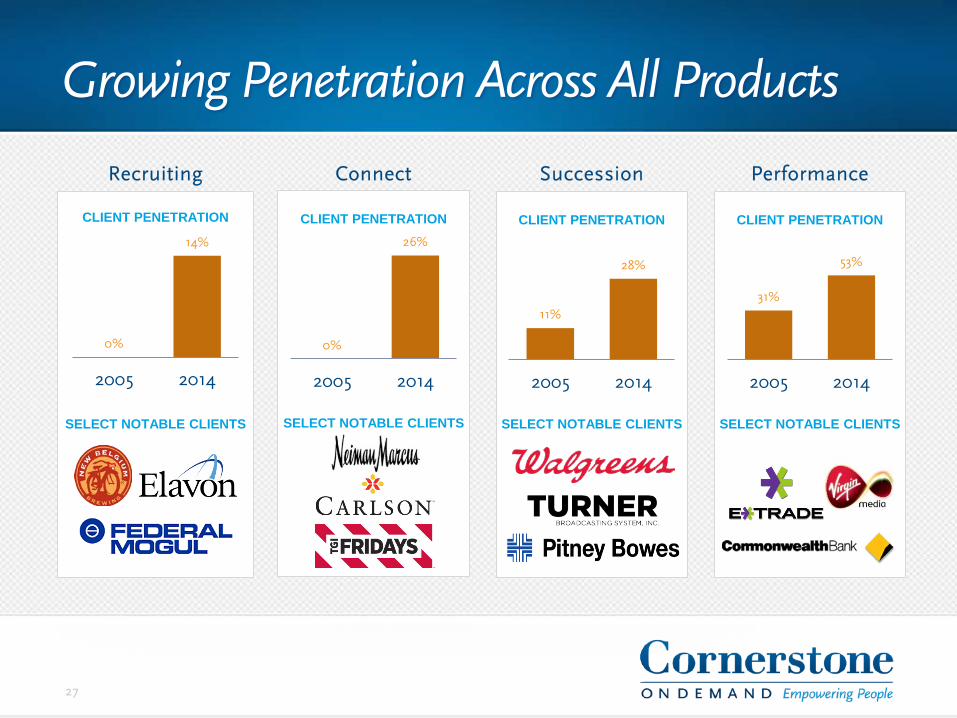
Growing Penetration Across All Products
27
Succession
11%
28%
2005 2014
CLIENT PENETRATION
SELECT NOTABLE CLIENTS
Recruiting
0%
14%
2005 2014
CLIENT PENETRATION
SELECT NOTABLE CLIENTS
Connect
0%
26%
2005 2014
CLIENT PENETRATION
SELECT NOTABLE CLIENTS
31%
53%
2005 2014
Performance
CLIENT PENETRATION
SELECT NOTABLE CLIENTS
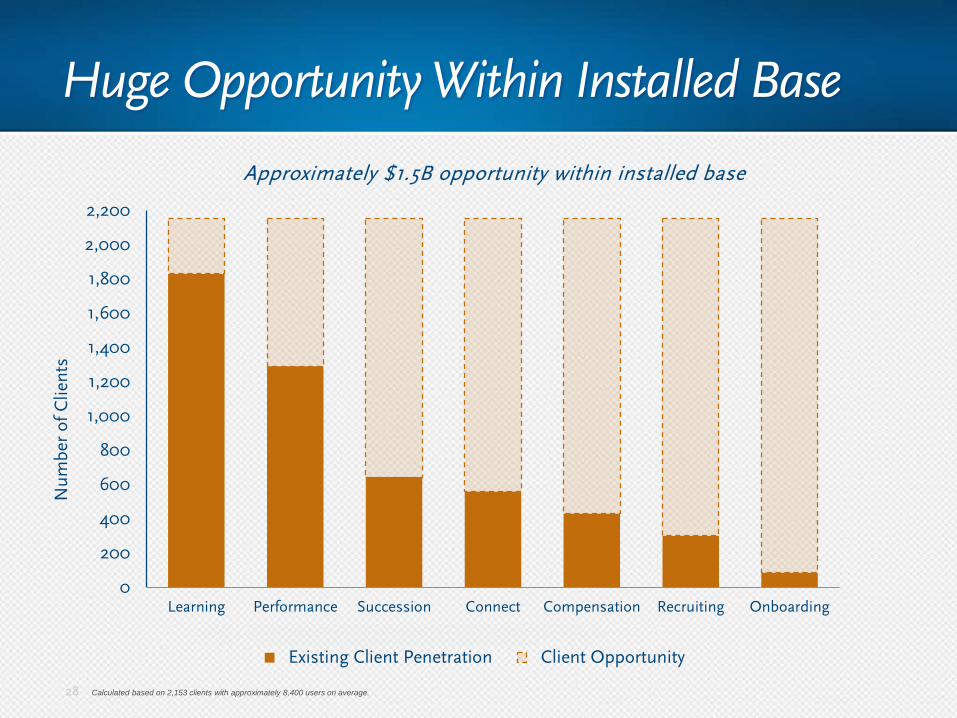
0
200
400
600
800
1,000
1,200
1,400
1,600
1,800
2,000
2,200
Learning Performance Succession Connect Compensation Recruiting Onboarding
Existing Client Penetration Client Opportunity
Num
ber
of C
lient
s
Huge Opportunity Within Installed Base
28 Calculated based on 2,153 clients with approximately 8,400 users on average.
Approximately $1.5B opportunity within installed base
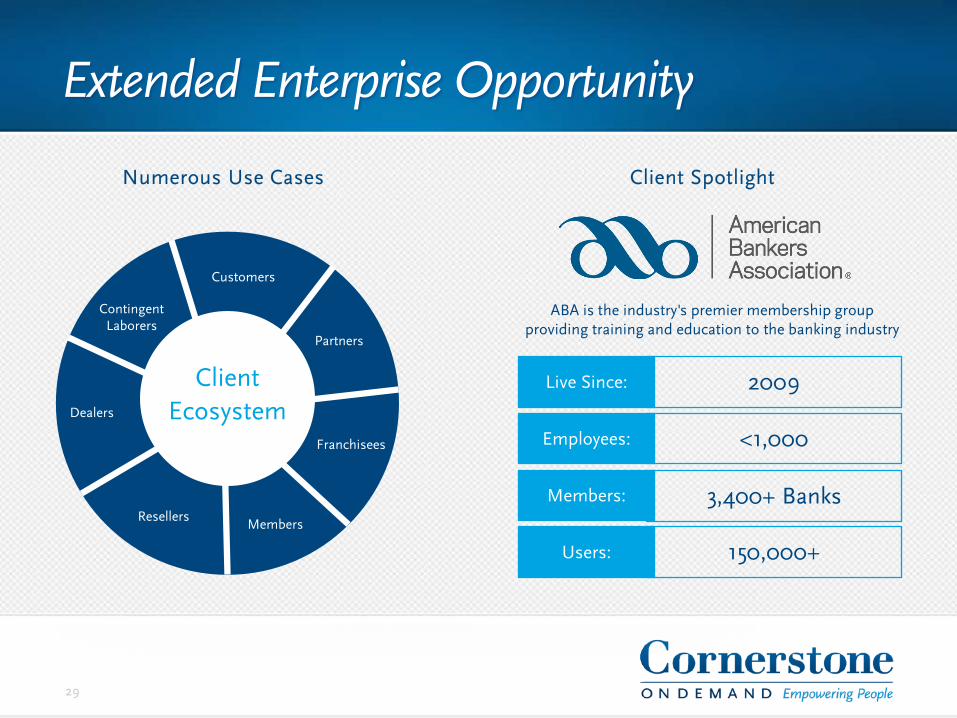
2009
<1,000
3,400+ Banks
150,000+
29
Numerous Use Cases Client Spotlight
Client Ecosystem
Customers
Partners
Contingent Laborers
Live Since:
Members:
Users:
Members Resellers
Franchisees
Dealers
ABA is the industry's premier membership group providing training and education to the banking industry
Employees:
Extended Enterprise Opportunity
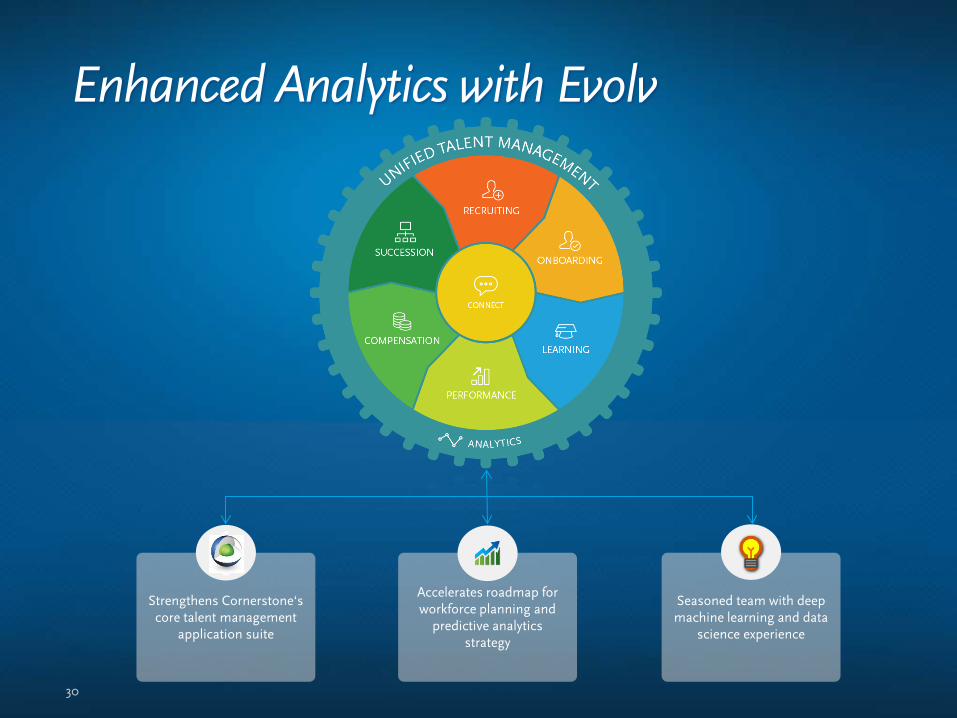
30
Strengthens Cornerstone‘s core talent management
application suite
Accelerates roadmap for workforce planning and
predictive analytics strategy
Seasoned team with deep machine learning and data
science experience
16
Enhanced Analytics with Evolv
Thank You!