CSF GROUP PLC. Annual Report...In CSF, our core values define us and shape the frame for all aspects...
77
Transcript of CSF GROUP PLC. Annual Report...In CSF, our core values define us and shape the frame for all aspects...


CSF GROUP PLC
Contents
Chairman‟s Statement 1 Chief Financial Officer‟s Review 3 Board of Directors 9 Directors‟ Report 10 Corporate Governance Statement 13 Directors‟ Remuneration Report 17 Statement of Directors‟ Responsibilities 19 Independent Auditor‟s Report 20 Consolidated Statement of Comprehensive Income 22 Consolidated Statement of Financial Position 23 Consolidated Statement of Changes In Equity 25 Consolidated Statement of Cash Flow 27 Notes to the Financial Statements 28 Company Statement of Comprehensive Income 67 Company Statement of Financial Position 68 Company Statement of Changes In Equity 69 Company Statement of Cash Flow 70 Notes to the Financial Statements 71 Company Information 73
CSF GROUP PLC
Vision and Mission Statement
Who We Are CSF Group is principally engaged in the business of providing a full range of services associated with data centres, namely the design and development of data centres including project management, fit-out and integration of the equipment within data centre facilities and other computer rooms, and data centre tenancy solutions. Vision Statement To maintain our position as the region’s leading and trusted solution provider in all aspects of data centre infrastructure services. We aim to be the best in delivering the highest level of quality service in data centre design, development and management. Mission Statement Within CSF Group of companies, we strive to deliver our promises to our customers through service excellence with quality, reliability and timeliness. Core Values In CSF, our core values define us and shape the frame for all aspects of our business operations. They serve as a guide in upholding our commitment to our customers, our organization, our shareholders and the social well being amongst us.
We believe that we should operate with integrity and bring value and integrity to our customers
We believe that we should always give back to the societies in which we operate
CSF GROUP PLC CHAIRMAN’S STATEMENT
1
Overview of the Year The Group incurred a loss for the financial year ended 31 March 2016 as both the CX2 and CX5 data centres have not yet attained the optimum level of occupancy. However, the Group achieved a significant improvement in reducing the gross loss from RM28.6m (£5.1m*) in FY2015 to RM1.5m (£0.3m*) in the current financial year. Notwithstanding the significant reduction in the gross loss, the Group reported a higher net loss of RM36.3m (£6.5m*) for the current year as compared to a net loss of RM31.2m (£5.6m*) in FY2015, which was mainly attributable to a general provision for doubtful debts to cover the inherent risks associated with trade receivables that are expected to be collected over a longer period of time, mitigated by a net decrease in the provision of onerous leases due to revisions in the outlook of the data centre rental business. The reduction in gross loss in the current year is mainly attributable to the management‟s commendable effort in completing the restructuring of the lease rental payments on CX1, CX2 and CX5, with the revised lease rental rates having commenced on 1 January 2016. In addition, additional rental revenues were contributed by a new customer at Block A of CX5 and an existing customer taking additional capacity at Block B of CX5. The Group had a closing cash position of RM43.6m (£7.8m*) at the year end and approximately RM32.3m (£5.8m*) tied up as working capital relating to the development of CX5, which is expected to be collected progressively in line with the expiry of the warranty period of certain components of the fit-out works, up to the second quarter of calendar year 2017. The reasonably healthy cash reserve was mainly attributable to the repayment during the financial year of RM27.9m (£5.0m*) of the cash advances initially given by the Group to the developer of CX5. As reported in the half year announcement, the Group has completed its negotiations with the freeholder of CX1, CX2 and CX5 data centres to restructure the lease rental payments in December 2015. The Group is in process of finalising the debt settlement agreement and the supplemental lease agreement. With the revised lease rental payment, operating cash flow is expected to improve significantly. Current Trading The Group‟s immediate focus is to fill the available capacity of the CX2 and CX5 data centres. The Board and management team continue to follow-up on a number of key strategic initiatives and pursue the pipeline of potential customers and business alliances. The Board believes that the key strategic initiatives that are being undertaken have positioned the business in the right direction and seen some positive development in the Group. The Board remains focused on these plans going forward. The Board and management are working tirelessly to reduce the burn rate of our cash reserves. The Board will continue to ensure that there is no significant cash outlay other than the sums required to cover the committed lease rentals and other necessary operating overheads, subject to any further capital or operating expenditure that may be required in relation to tenancy contracts. In view of the accumulated losses of the Group, the Board is not recommending the payment of a dividend.

CSF GROUP PLC CHAIRMAN’S STATEMENT (Continued)
2
Data Centre Rental The Group now has 406,000 sq ft of data centre space and more than 20 MW of IT power capacity in Malaysia. During the year, a new tenancy contract was secured for Block A of CX5 and an existing customer commissioned additional capacity at Block B of CX5. The aforementioned events contributed positively to the Group‟s financial results. The Group is actively pursuing new customers directly and working closely with a network of resellers and business partners to fill in the remaining available capacity at CX2 and CX5 to a sustainable level. The Group commissioned a fibre optic cable linking CX1, CX2 and CX5 during the year, thereby enhancing the connectivity of the Group‟s data centres which is expected to create more opportunities to market the Group‟s data centre capacity. The management is now exploring the formation of business alliances to further enhance and extend the connectivity of the Group‟s data centres. Maintenance, Design and Fit-out of Data Centres The management continues to pursue new contracts to enhance our recurring maintenance revenue streams and other design and fit-out projects revenue. Outlook The Board will continue to support the efforts of the management in implementing its stated business strategies which it believes will place the Group on a solid foundation from which it can return to profitability in the future. The Board believes that the initiative to secure customers for the data centre rental business is absolutely critical to the viability of the Group‟s business. In this regard, the Board will support the management‟s efforts in marketing and securing the remaining space available at the Group‟s data centres. The priority for the Board and management is to conserve the Group‟s cash reserves, secure customers for the data centre rental business, and strive to improve operational efficiency in order to reduce costs. The Board is cautiously optimistic that the Group‟s financial results will improve in the next financial year.
* The translation of the financial statements into pro forma balances in pounds Sterling is included solely for convenience. The pro forma balances in pounds Sterling are stated, as a matter of arithmetical computation only, on the basis of all balances being translated from Ringgit Malaysia into pounds Sterling at the rate prevailing on 31 March 2016 of RM5.613 : £1.00. This translation should not be construed as meaning that the Ringgit Malaysia amounts actually represent, or have been or could be translated into the stated number of pounds Sterling.
CSF GROUP PLC CHIEF FINANCIAL OFFICER’S REVIEW
3
Introduction The Group incurred a net loss of RM36.3m (£6.5m*) for FY2016 as compared to a net loss of RM31.2 (£5.6m*) in FY2015 which translated to basic loss per share (“LPS”) of 22.70 sen (4.04p*) as compared to a basic (“LPS”) of 19.47 sen (3.47p*) in FY2015. The higher net loss for FY2016 included higher bad debt provisions of RM30.0m (£5.4m*) as compared to RM0.8m (£0.2m*) in FY2015 mainly due to a general provision for doubtful debts to cover the inherent risks associated with trade receivables that are expected to be collected over a longer period of time. In addition, there was a decrease in the net provision for onerous leases of RM10.9m (£1.9m*) in FY2016 as compared to a decrease of RM9.1m (£1.6m*) in FY2015 due to revisions in the outlook of the data centre rental business over the longer term. The Group‟s closing cash position increased from RM29.2m (£5.2m*) as at 31 March 2015 to RM43.6m (£7.8m*) as at the year-end, mainly due to the repayment of RM27.9m (£5.0m*) of the cash advances by the developer of CX5 upon the completion of Block C of CX5. Based on the Group‟s unrestricted cash and bank balances at the financial year end of RM43.6m (£7.8m*), the restricted cash of RM14.1m (£2.5m*) and the net current assets balance of RM95.7m (£17.0m*) and taking into consideration the financial projections, including cash flows, for the period up to 31 March 2018, the Board believes that the Group has adequate resources to continue in operational existence for the foreseeable future.
CSF GROUP PLC CHIEF FINANCIAL OFFICER’S REVIEW (Continued)
4
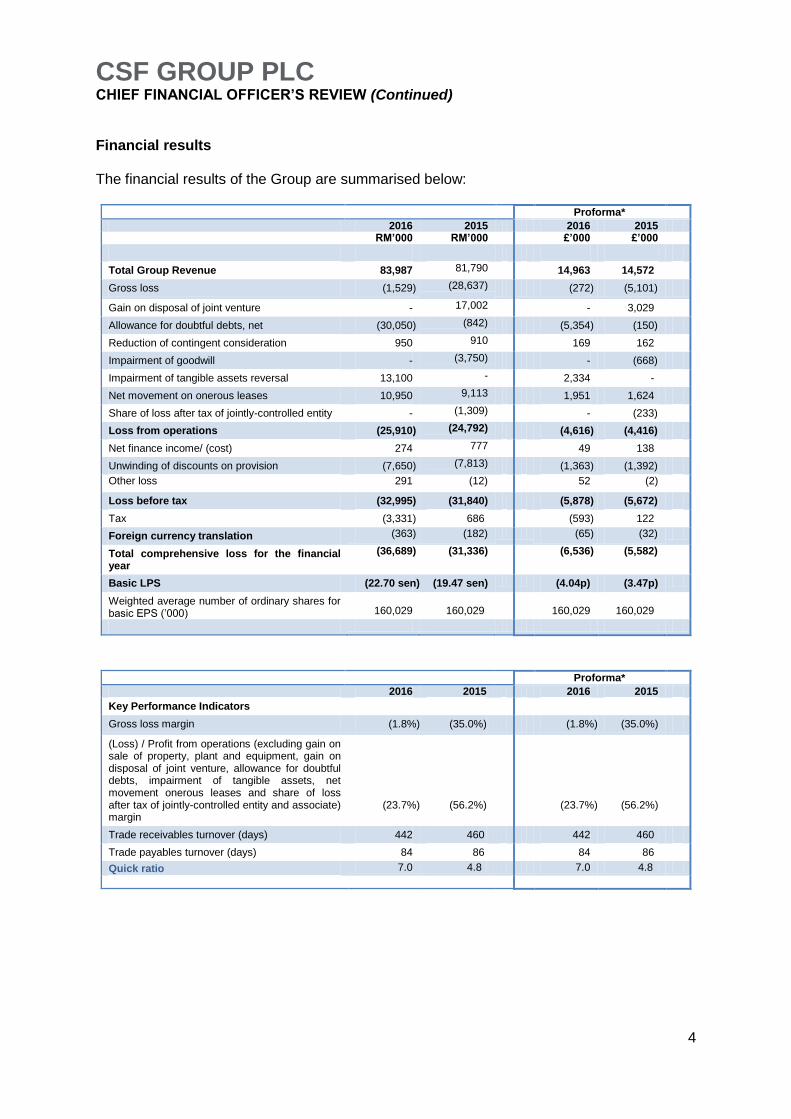
Financial results The financial results of the Group are summarised below:
Proforma*
2016 2015 2016 2015 RM’000 RM’000 £’000 £’000
Total Group Revenue 83,987 81,790 14,963 14,572
Gross loss (1,529) (28,637) (272) (5,101)
Gain on disposal of joint venture - 17,002 - 3,029
Allowance for doubtful debts, net (30,050) (842) (5,354) (150)
Reduction of contingent consideration 950 910 169 162
Impairment of goodwill - (3,750) - (668)
Impairment of tangible assets reversal 13,100 - 2,334 -
Net movement on onerous leases 10,950 9,113 1,951 1,624
Share of loss after tax of jointly-controlled entity - (1,309) - (233)
Loss from operations (25,910) (24,792) (4,616) (4,416)
Net finance income/ (cost) 274 777 49 138
Unwinding of discounts on provision (7,650) (7,813) (1,363) (1,392)
Other loss 291 (12) 52 (2)
Loss before tax (32,995) (31,840) (5,878) (5,672)
Tax (3,331) 686 (593) 122
Foreign currency translation (363) (182) (65) (32)
Total comprehensive loss for the financial year
(36,689) (31,336) (6,536) (5,582)
Basic LPS (22.70 sen) (19.47 sen) (4.04p) (3.47p)
Weighted average number of ordinary shares for basic EPS (‟000)
160,029
160,029
160,029
160,029
Proforma*
2016 2015 2016 2015
Key Performance Indicators
Gross loss margin (1.8%) (35.0%) (1.8%) (35.0%)
(Loss) / Profit from operations (excluding gain on sale of property, plant and equipment, gain on disposal of joint venture, allowance for doubtful debts, impairment of tangible assets, net movement onerous leases and share of loss after tax of jointly-controlled entity and associate) margin
(23.7%)
(56.2%)
(23.7%)
(56.2%)
Trade receivables turnover (days) 442 460 442 460
Trade payables turnover (days) 84 86 84 86
Quick ratio 7.0 4.8 7.0 4.8
CSF GROUP PLC CHIEF FINANCIAL OFFICER’S REVIEW (Continued)
5
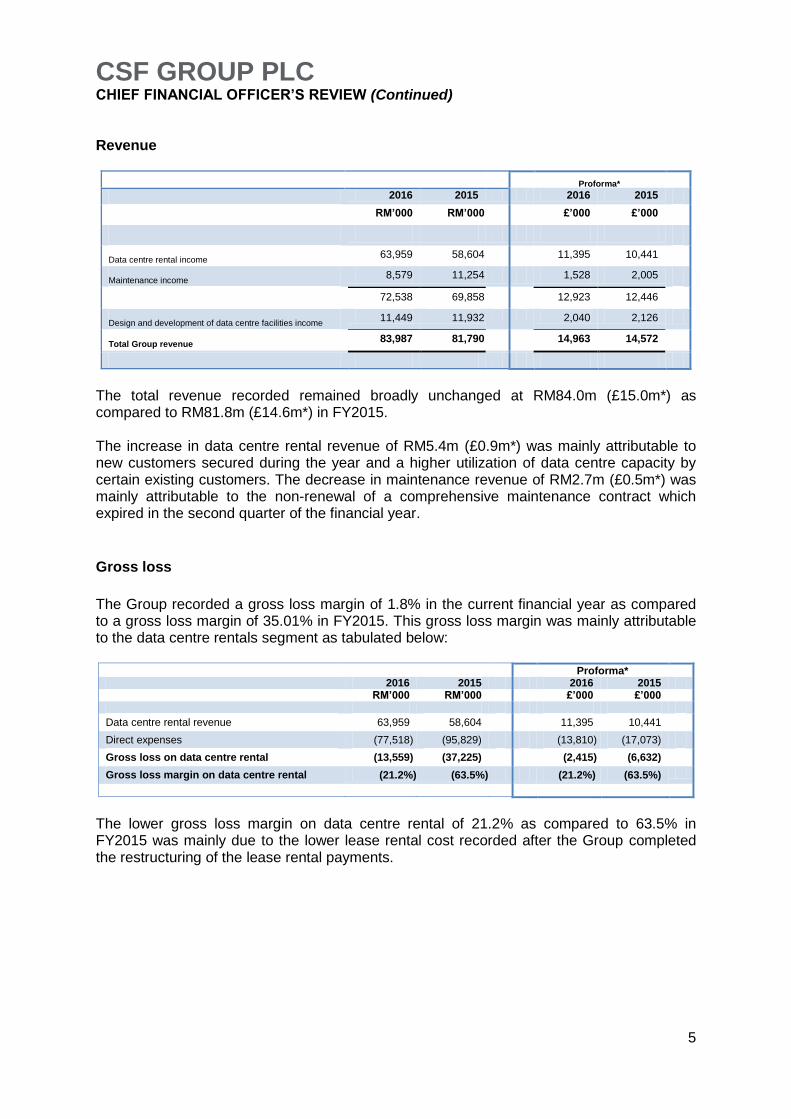
Revenue
Proforma*
2016 2015 2016 2015
RM’000 RM’000 £’000 £’000
Data centre rental income 63,959 58,604 11,395 10,441
Maintenance income 8,579 11,254 1,528 2,005
72,538 69,858 12,923 12,446
Design and development of data centre facilities income 11,449 11,932 2,040 2,126
Total Group revenue 83,987 81,790 14,963 14,572
The total revenue recorded remained broadly unchanged at RM84.0m (£15.0m*) as compared to RM81.8m (£14.6m*) in FY2015. The increase in data centre rental revenue of RM5.4m (£0.9m*) was mainly attributable to new customers secured during the year and a higher utilization of data centre capacity by certain existing customers. The decrease in maintenance revenue of RM2.7m (£0.5m*) was mainly attributable to the non-renewal of a comprehensive maintenance contract which expired in the second quarter of the financial year.
Gross loss
The Group recorded a gross loss margin of 1.8% in the current financial year as compared to a gross loss margin of 35.01% in FY2015. This gross loss margin was mainly attributable to the data centre rentals segment as tabulated below:
Proforma* 2016 2015 2016 2015 RM’000 RM’000 £’000 £’000
Data centre rental revenue 63,959 58,604 11,395 10,441
Direct expenses (77,518) (95,829) (13,810) (17,073)
Gross loss on data centre rental (13,559) (37,225) (2,415) (6,632)
Gross loss margin on data centre rental (21.2%) (63.5%) (21.2%) (63.5%)
The lower gross loss margin on data centre rental of 21.2% as compared to 63.5% in FY2015 was mainly due to the lower lease rental cost recorded after the Group completed the restructuring of the lease rental payments.

CSF GROUP PLC CHIEF FINANCIAL OFFICER’S REVIEW (Continued)
6
Loss from operations
The Group recorded a loss from operations of RM27.8m (£5.0m*) compared to a loss from
operations of RM24.8m (£4.4m*) in 2015 as analysed below:
Proforma*
2016 2015 2016 2015 RM’000 RM’000 £’000 £’000
Operating loss from data centre rental, maintenance, and design and development of data centre facilities
(20,860)
(45,916)
(3,716)
(8,180)
Gain on disposal of joint venture - 17,002 - 3,029
Allowance for doubtful debts, net (30,050) (842) (5,354) (150)
Reduction of contingent consideration 950 910 169 162
Impairment of goodwill - (3,750) - (668)
Impairment of tangible assets reversal 13,100 - 2,334 -
Net movement on onerous leases 10,950 9,113 1,951 1,624
Share of loss after tax of jointly-controlled entity - (1,309) - (233)
Total operating loss (25,910) (24,792) (4,616) (4,416)
Notwithstanding the lower gross loss as explained above, the operating loss was higher mainly due to general provision for doubtful debts of RM30.0m (£5.4m*) to cover the inherent risks associated with trade receivables that are expected to be collected over a longer period and decrease in net provision for onerous leases of RM10.9m (£1.9m*) in FY2016 due to revisions in the longer-term outlook of the data centre rental business. In addition, the Group recorded a reversal of impairment of tangible assets of RM13.1m (£2.3m*) as a consequence of the restructured lease rental terms of CX2. In the prior year, the Group recorded a gain of RM17.0m (£3.0m*) on the disposal of an interest in a jointly-controlled entity.

CSF GROUP PLC CHIEF FINANCIAL OFFICER’S REVIEW (Continued)
7
Net finance cost Net finance cost increased from RM7.0m (£1.3m) to RM7.4m (£1.3m) as a result of the interest incurred to the freeholder for the debt settlement (as described above). Taxation The Group recorded a tax charge for the year in spite of reporting a loss for the year mainly due to tax payable by a profitable subsidiary which was not subject to group tax relief. Earnings per share Basic and diluted loss per share (“LPS”) was 22.70 sen (4.04p*) compared to a LPS of 19.47 sen (3.47p*) in 2017. The weighted average number of shares during the year used for basic and diluted LPS calculation is 160,028,667 (2015: 160,028,667). Dividends The Board does not propose any payment of dividends in respect of the current financial year. Cash and treasury Proforma*
2016 2015 2016 2015 RM’000 RM’000 £’000 £’000 Cash used in operations before working capital movements and net finance income / cost
(23,559)
(49,785)
(4,197)
(8,870)
Working capital movements 7,500 29,417 1,336 5,241
Net finance cost / income 7,376 7,036 1,314 1,254
(8,683) (13,332) (1,547) (2,375)
Repayment of loans by the owner of a development project
27,936
20,000
4,977
3,563
Repayment by the jointly-controlled entity -
8,921
-
1,589
Capital expenditure (4,083) (5,792) (727) (1,032)
Acquisition of a subsidiary - (1,440) - (256)
Net cash from other investing activities 1,484 1,766 264 314
Net cash inflow before financing activities 16,654
10,123
2,967
1,803
Net cash from financing activities (2,264) (780) (403) (139)
Net cash inflow 14,390 9,343 2,564 1,664
CSF GROUP PLC CHIEF FINANCIAL OFFICER’S REVIEW (Continued)
8
Cash and treasury (Cont’d) The Group recorded a lower net cash used by operations before working capital movements and net finance cost of RM23.6m (£4.2m*) and positive movement in working capital of RM7.5m (£1.3m*), which was mainly due to lower lease rental payments on CX1, CX2 and CX5 in line with the restructured lease rental terms, whereby the lease rental payments shall be lower in the earlier years and progressively increasing thereafter. The balance of the trade receivable relating to the CX5 project of RM32.3m (£5.8m*) million is due to be received progressively in line with the expiry of the warranty period of certain components of the fit-out works, which is expected to end in the second quarter of calendar year 2017. The Group provided for an allowance for doubtful debts for all long outstanding receivables exceeding six months based on Group policy. The provision also includes a portion of the receivable outstanding in respect of the CX5 project. The developer of CX5 repaid the final RM27.9m (£5.0m*) of the cash advances provided by CSF in June 2015. Post Balance Sheet Events
The revised lease rental agreement and the debts settlement agreement with the freeholder is in the process of being finalised as at date of this report.
Critical accounting judgement and key sources of estimation uncertainty The areas of critical accounting judgement and key sources of estimation uncertainty are disclosed in Note 4 of the financial statements. Going concern These financial statements have been prepared on a going concern basis. The directors‟ consideration of going concern and the associated uncertainties are provided in Note 1 of the financial statements.
* The translation of the financial statements into pro forma balances in pounds Sterling is included solely for convenience. The pro forma balances in pounds Sterling are stated, as a matter of arithmetical computation only, on the basis of all balances being translated from Ringgit Malaysia into pounds Sterling at the rate prevailing on 31 March 2014 of RM5.4336 : £1.00. This translation should not be construed as meaning that the Ringgit Malaysia amounts actually represent, or have been or could be translated into the stated number of pounds Sterling.
* The translation of the financial statements into pro forma balances in pounds Sterling is included solely for convenience. The pro forma balances in pounds Sterling are stated, as a matter of arithmetical computation only, on the basis of all balances being translated from Ringgit Malaysia into pounds Sterling at the rate prevailing on 31 March 2016 of RM5.613 : £1.00. This translation should not be construed as meaning that the Ringgit Malaysia amounts actually represent, or have been or could be translated into the stated number of pounds Sterling.

CSF GROUP PLC BOARD OF DIRECTORS
9
Phil Cartmell
Chairman, Non-executive Director
Phil was appointed to the board of the Company in February 2010. He was appointed Chief Executive Officer of Vega Group plc (“Vega”) in July 2000. Phil left Vega in May 2008 following the sale of the business to Finmeccanica of Italy, generating significant returns for investors. Prior to Vega, Phil held senior positions with Baan, Origin UK, and KPMG Consulting. Phil is currently the CEO of TP Group plc, a well-diversified company involved in aerospace and defense, energy and process industries listed on AIM. Phil was previously Chairman of Alterian plc.
Lee, King Loon Chief Financial Officer
King Loon was appointed to the board of the Company in February 2010. He has over 20 years of experience in accounting, financial and corporate matters. Prior to joining the Group, he was an Executive Director of Crowe Horwath Corporate Advisory Sdn Bhd and a holder of a Capital Markets Services Licence issued by the Securities Commission of Malaysia. As Chief Financial Officer of CSF Group plc, King Loon spearheads the finance department and is involved in the formulation of financial strategies to improve the Group‟s performance.
Ting, Heng Peng (Dato’) Independent Non-executive Director
Dato‟ Ting was appointed to the board of the Company in February 2010. He has over 20 years of legal practice experience in corporate matters and civil and commercial litigation and presently, he sits on the Board of two companies listed on the Bursa Malaysia, namely Supermax Corporation Berhad and D.B.E Gurney Resources Berhad as an independent non-executive director. Dato‟ Ting is also currently an executive partner at Messrs Ting Asiah & Co, a firm of advocates and solicitors in Malaysia.
Dennis Kian Jin Ow Independent Non-executive Director
Dennis was appointed to the board of the Company in February 2010. He is currently an executive director of Paq International Holdings Limited which is listed on AIM. Dennis has prior experience with capital markets and advisory roles within the London Stock Exchange, Old Park Lane Capital Asia and Blue Oar. He has been involved in bringing eight companies from South East Asia to AIM and two to the Official Main List of the London Stock Exchange.

CSF GROUP PLC DIRECTORS’ REPORT
10
The Directors present their annual report on the affairs of the Group, together with the
audited financial statements and auditor's report, for the year ended 31 March 2016. The
Corporate Governance Statement forms part of this report.
Principal Activities
The principal activities of the Group comprise of the design, construction and installation of data centres on an outsourced basis, ongoing support and maintenance and rental of data centre space. The subsidiary undertakings principally affecting the financial results or net assets of the Group in the year are listed in the financial statements. Results and Dividends
The results of trading of the Group for the year are set out in the consolidated statement of comprehensive income. The Board does not propose any payment of dividends in respect of the financial year ended 31 March 2016.
Directors
The Directors during the year and to the date of this report were as follows: Lee King Loon Dato‟ Ting Heng Peng Phil Cartmell Dennis Kian Jing Ow None of the Directors hold an interest in any material contract with the Company save for their Service Contracts or Letters of Appointment. Directors’ Interests
The Directors‟ interests, including their connected parties were:- Company Shares Company Shares Directors 31 March 2016 31 March 2015 Lee, King Loon Nil Nil Dato‟ Ting Heng Peng Nil Nil Phil Cartmell 30,000 30,000 Dennis Kian Jing Ow Nil Nil Directors’ Indemnities
The Company has made qualifying third party indemnity provisions for the benefit of its directors which were made during the period and remain in force at the date of this report.
Supplier Payment Policy
The Group‟s policy is to set the terms of payment with suppliers when agreeing the terms of each transaction and abide by the terms of payment as long as the Group is satisfied that the supplier has provided goods and services in accordance with the order.
CSF GROUP PLC DIRECTORS’ REPORT (Continued)
11
Environment Matters
Following CX5 being awarded the provisional Green Building Index (GBI) Certified Rating in 2012, the Group continue looking at ways to improve energy savings, water savings, a healthier indoor environment, better connectivity to public transport, the adoption of recycling and greenery projects and reducing impact on the environment. Charitable and Political Contributions
During the year the Group made charitable donations of RM15,000 (£2,700), (2015: RM20,000 (£3,600)) principally to local charities serving the communities in which the Group operates. The Group made no political contributions during the financial year. Substantial Shareholdings
On 19 July 2016, the Company had been notified, in accordance with Chapter 5 of the Disclosure and Transparency Rules of the following investors who held 3% or more of the Company‟s issued share capital. Name of holder % of Ordinary Shares No. of Ordinary Shares Vidacos Nominees Limited 29.36 46,979,747 Huntress (CI) Nominees Limited 25.08 40,139,173 Yong Kwet On 1 24.85 39,769,824
79.29 126,888,744
1 These 39,769,824 shares are held legally and beneficially by Yong Kwet On. The earlier 3,450,676 Ordinary
shares (representing 2.16% of Ordinary Shares in issue) which were held by him in trust and beneficially owned by the employee benefit trust have been transferred to the employee benefit trust account in May 2016
As at the date referred to above, the Company is not aware of any person or entity that, directly or indirectly, jointly or severally, will or could exercise control of the Company. Disabled Employees
Applications for employment by disabled persons are always fully considered, bearing in mind the aptitude of the applicant concerned. In the event of members of staff becoming disabled every effort is made to ensure that their employment with the Group continues and that appropriate training is arranged. It is the policy of the Group that the training, career development and promotion of disabled persons should, as far as possible, be identical to that of other employees. Employee Consultation
The Group places considerable value on the involvement of its employees and has continued to keep them informed on matters affecting them as employees and on the various factors affecting the performance of the Group and consulted and discussed with the employees‟ representatives regularly on a wide range of matters affecting their current and future interests. This is achieved through formal and informal meetings and the Company‟s internal circulars. Post Balance Sheet Events
Details of post balance sheet events are given in the Note 33 of the financial statements.

CSF GROUP PLC DIRECTORS’ REPORT (Continued)
12
Going Concern
The Directors have prepared financial projections, including cash flows, for a period up to 31 March 2018. Based on these projections and taking into account the financial position of the Group, including cash of RM43.6 million (£7.8 million) as at 31 March 2016 the Directors have carried out an assessment of going concern. Additional details are included in Note 1 to the Financial Statements. The Directors have a reasonable expectation that the Group has adequate resources to continue in operational existence for the foreseeable future. Thus, they continue to adopt the going concern basis of accounting in preparing the Financial Statements. Annual General Meeting
The company‟s Annual General Meeting (“AGM”) will be held in October 2016. Further details of the AGM, together with the proposed resolutions, will be sent out in the near future. Disclosure of Information to Auditor
Each of the persons who is a director at the date of approval of this Annual Report confirms that:
so far the Director is aware, there is no relevant audit information of which the
Company‟s auditor is unaware; and
the Director has taken all steps that he ought to have taken as a director in order to
make himself aware of any relevant audit information and to establish that the
Company‟s auditor is aware of that information Auditor
Deloitte LLP has expressed their willingness to continue in office. A resolution to reappoint them will be proposed at the forthcoming Annual General Meeting. By order of the Board, Lee, King Loon Director 22 July 2016
CSF GROUP PLC CORPORATE GOVERNANCE STATEMENT
13
Principles of Good Governance
The Group is committed to high standard of corporate governance. It has adopted procedures to institute good governance insofar as it is practical and appropriate for an organisation of its size and nature, notwithstanding the fact that companies that have securities traded on the Alternative Investment Market of the London Stock Exchange (“AIM”) are not required to comply with Combined Code as appended to the Listing Rules issued by the Financial Services Authority. Whilst not required to comply with the Code, the Group has chosen to give selected disclosures which they believe are necessary or valuable to readers. Board of Directors
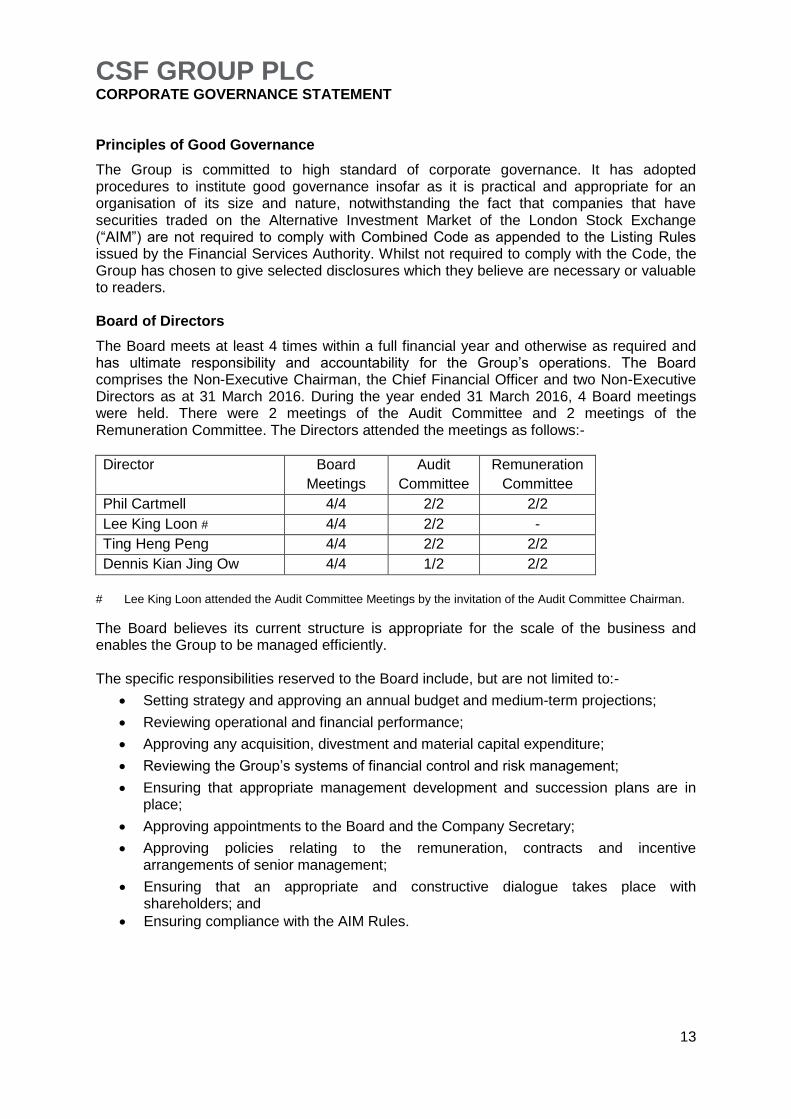
The Board meets at least 4 times within a full financial year and otherwise as required and has ultimate responsibility and accountability for the Group‟s operations. The Board comprises the Non-Executive Chairman, the Chief Financial Officer and two Non-Executive Directors as at 31 March 2016. During the year ended 31 March 2016, 4 Board meetings were held. There were 2 meetings of the Audit Committee and 2 meetings of the Remuneration Committee. The Directors attended the meetings as follows:-
Director Board
Meetings
Audit
Committee
Remuneration
Committee
Phil Cartmell 4/4 2/2 2/2
Lee King Loon # 4/4 2/2 -
Ting Heng Peng 4/4 2/2 2/2
Dennis Kian Jing Ow 4/4 1/2 2/2
# Lee King Loon attended the Audit Committee Meetings by the invitation of the Audit Committee Chairman.
The Board believes its current structure is appropriate for the scale of the business and enables the Group to be managed efficiently. The specific responsibilities reserved to the Board include, but are not limited to:-
Setting strategy and approving an annual budget and medium-term projections;
Reviewing operational and financial performance;
Approving any acquisition, divestment and material capital expenditure;
Reviewing the Group‟s systems of financial control and risk management;
Ensuring that appropriate management development and succession plans are in place;
Approving appointments to the Board and the Company Secretary;
Approving policies relating to the remuneration, contracts and incentive arrangements of senior management;
Ensuring that an appropriate and constructive dialogue takes place with shareholders; and
Ensuring compliance with the AIM Rules.

CSF GROUP PLC CORPORATE GOVERNANCE STATEMENT (Continued)
14
The Board has a procedure through which the Directors are able to take independent advice at the Company‟s expense in the furtherance of their responsibilities. The Directors also have access to the advice and services of the Company Secretary. The Company Secretary is responsible for ensuring that Board procedures are followed and that applicable rules and regulations are complied with. The Group has adopted a share dealing code for Directors and senior employees on the same terms as restricted by statute, by common law and by the AIM Rules. Chairman, Acting Chief Executive Officer and Non-Executive Directors
The Chairman is responsible for leading the Board and ensuring its effectiveness whilst the Acting Chief Executive Officer is responsible for running the business and for ensuring that accurate, timely and clear information is presented at the Board meetings or when otherwise appropriate. The Acting Chief Executive Officer reports directly to the Chairman and the Board of Directors. The role of the Chairman was a non-executive role throughout the year ended 31 March 2016 which is in line with the Code in terms of the independence criteria outlined. The Board is balanced by an appropriate non-executive element with three out of four Directors being non-executive. The Board has determined that it does not believe that the holding of share options by its Non-Executive Directors impacts on their independence in character and judgment. Board Committees
The Board has established three committees to deal with matters in accordance with written terms of reference which are available on request from the Company Secretary. They are the Audit Committee, the Remuneration Committee and the Nomination Committee. The Chairman of the Audit Committee, Nomination Committee and the Remuneration Committee are independent Non-Executive Directors. Audit Committee
Dato‟ Ting Heng Peng is the Chairman of the committee. The Audit Committee also comprises Phil Cartmell and Dennis Kian Jing Ow. No members of the Committee have any link with the Group‟s external auditors. The Audit Committee meets formally at least twice within a full financial year and otherwise as required and is responsible for all matters relating to financial controls and reporting, internal and external audits, the scope and results of the audits, the independence and objectivity of the auditors and also keeps under review the effectiveness of the Group‟s controls and risk management. The ultimate responsibility for reviewing and approving the annual report and financial statements and interim statements remains with the Board. The Chief Financial Officer, and representatives from the finance function may attend the meeting by the invitation of the Audit Committee Chairman. Details of the amounts paid to the external auditors during the year for audit and other services are set out in the financial statements.
CSF GROUP PLC CORPORATE GOVERNANCE STATEMENT (Continued)
15
Remuneration Committee
The Remuneration Committee has been in place since February 2010. As the Company is committed in conducting itself based on best practices, the Remuneration Committee consists only of Non-Executive Directors, namely Phil Cartmell as the Chairman, Dato‟ Ting Heng Peng and Dennis Kian Jing Ow. The Remuneration Committee meets at least once within a full financial year and otherwise as required and is responsible for all material elements of remuneration policy, review of the remuneration and incentives of Executive Directors and senior management with reference to independent remuneration research and professional advice in accordance with the Combined Code. The Remuneration Committee also determines the payment of bonuses to all Executive Directors, makes recommendations to the employee benefit trust and employee share option plan regarding share awards to the employees and sets any performance criteria in relation to the exercise of options granted to the Executive Directors as referred to in the Directors‟ Remuneration Report. No Director is permitted to participate in discussions or decisions concerning his own remuneration and the remuneration of members of the Remuneration Committee shall be determined in accordance with good practice by the remaining Board members. Nomination Committee
The Nomination Committee is chaired by Dato‟ Ting Heng Peng and also comprises Lee King Loon, Phil Cartmell and Dennis Kian Jing Ow. The Nomination Committee meets formally as and when required, is responsible for the size, structure and composition of the Board, the retirement and appointment of Directors, and makes appropriate recommendations to the Board in relation to these matters. Potential candidates to the Board are interviewed either by the Nomination Committee or a panel appointed by that Committee. An appointment requires final approval by the Board prior to an offer being forwarded.
Internal control
The Board has overall responsibility for maintaining the Group‟s system of internal control and reviewing its effectiveness. The system of internal control is designed to manage, rather than eliminate the risk of failure to achieve the Group‟s strategic business objectives and can only provide reasonable assurance against material misstatement or loss. The key elements of the internal control system include but are not limited to the following: Control environment
The Directors continue to review the effectiveness of the Company‟s system of financial and non-financial controls, including operational and compliance controls, risk management and the Company‟s high level internal control arrangements. These reviews include an assessment of internal controls and in particular, internal financial controls.

CSF GROUP PLC CORPORATE GOVERNANCE STATEMENT (Continued)
16
Risk management
The Board views significant business risks as a key management activity. The Board has established a group wide risk management system covering the core business activities to identify, evaluate and manage significant business risks faced by the Group. Managing business risk to deliver opportunities is a key element of all activities. These business risks, may be strategic, operational, reputational, financial or environmental.
Financial Reporting
The Board approves the Group‟s annual budget which is prepared in the context of the Board approved business plan. The Board receives monthly financial reports which assess performance in comparison with the annual budget and in relation to periodic re-forecasts. Key performance indicators are regularly reviewed at Board level and by senior managers responsible for key areas of the business. The Company does not currently have an internal audit function because the Board are of view that the present internal controls are adequate taking into consideration the nature and size of the business operations. However, the Board will consider the need to create one as the business grows. Communications with shareholders
The Chairman and the Chief Financial Officer are the principal points of contact for investors, analysts, fund managers, media and other interested parties. Access is available to the Non-Executive Directors if this is required. Meetings with analysts and institutional investors are held following the interim and preliminary results announcements. The Board are kept appraised about shareholder relations and have full access to reports from the Company‟s stock brokers, Allenby Capital Limited. Approved by the Board and signed on behalf of the Board,
Lee, King Loon Director 22 July 2016

CSF GROUP PLC DIRECTOR’S REMUNERATION REPORT
17
Directors’ Emoluments
The various elements of remuneration received by each director were as follows:-
Name of director Fees/Basic
salary RM
Benefits in kind
RM
Annual bonuses
RM
2016 total RM
2015 total RM
Executive Lee, King Loon 392,175 37,200 - 429,375 415,200 Non-Executive Dato‟ Ting Heng Peng 282,081 - - 282,081 236,648 Phil Cartmell 221,898 - - 221,898 176,648 Dennis Kian Jin Ow 185,067 - - 185,067 147,207
Aggregate emoluments 1,081,221 37,200 - 1,118,421 1,013,692
Directors’ Share Options
Aggregate emoluments disclosed above do not include any amounts for the value of options to acquire ordinary shares in the Company granted to or held by the Directors. There were no options exercised during the financial year. Details of the approved options scheme for Directors who served during the year are as follows:
Name of Director
31 March
2015
Granted
Expired
31 March
2016
Exercise
Price
Date from which
exercisable
Expiry
Date
Lee, King Loon 300,000 - (300,000) - £0.60 10.07.12 – 10.07.14
10.07.15
Total 300,000 - (300,000) -
The share options have a contracted life of 10 years with 33.33% being exercisable on the first anniversary of the grant, 33.33% being exercisable on the second anniversary of the grant and the remaining 33.34% being exercisable on the third anniversary of the grant. The mid-market price of the Company share as of 31 March 2016 was 1.5p (2015: 1.6p).

CSF GROUP PLC DIRECTORS’ REMUNERATION REPORT (Continued)
18
Pension Contributions
As required by Malaysian law, the subsidiaries make contributions to the Employees‟ Provident Fund. The Group pays a fixed contribution based on a set percentage of the employee‟s salary. The Group has no further legal or constructive obligations in respect of the retirement costs. The Executive Director of the Company is member of the aforesaid defined contribution plan. Payments to the Employees‟ Provident Fund are recognised as an expense in the income statement as incurred. Contributions paid by the Company was as follow: Name of director
2016 (RM)
2015 (RM)
Lee, King Loon 52,674 49,824
52,674 49,824
CSF GROUP PLC STATEMENT OF DIRECTORS’ RESPONSIBILITIES
19
The Directors are responsible for preparing the financial statements in accordance with applicable laws and regulations. Company law requires the Directors to prepare financial statements for each financial year. The Directors have elected to prepare the financial statements in accordance with International Financial Reporting Standards (IFRSs) as adopted by the European Union. The financial statements are required by law to be properly prepared in accordance with the Companies (Jersey) Law 1991, as amended. International Accounting Standard 1 requires that financial statements present fairly for each financial year the Company's financial position, financial performance and cash flows. This requires the faithful representation of the effects of transactions, other events and conditions in accordance with the definitions and recognition criteria for assets, liabilities, income and expenses set out in the International Accounting Standards Board's 'Framework for the preparation and presentation of financial statements'. In virtually all circumstances, a fair presentation will be achieved by compliance with all applicable IFRSs. However, Directors are also required to:
properly select and apply accounting policies;
present information, including accounting policies, in a manner that provides relevant, reliable, comparable and understandable information;
provide additional disclosures when compliance with the specific requirements in IFRSs are insufficient to enable users to understand the impact of particular transactions, other events and conditions on the Entity's financial position and financial performance; and
make an assessment of the Company's ability to continue as a going concern. The Directors are responsible for keeping proper accounting records that disclose with reasonable accuracy at any time the financial position of the Company and enable them to ensure that the financial statements comply with the Companies (Jersey) Law 1991. They are also responsible for safeguarding the assets of the Company and hence for taking reasonable steps for the prevention and detection of fraud and other irregularities. The Directors are responsible for the maintenance and integrity of the corporate and financial information included in the Company‟s website. The legislations in Jersey, Channel Islands governing the preparation and dissemination of financial information differs from legislations in other jurisdictions. Under Article 105(11) of the Companies (Jersey) Law 1991 the Directors of a holding company need not prepare separate accounts (i.e. company only accounts) if consolidated accounts for the company are prepared, unless required to do so by the members of the company by ordinary resolution. The members of the Company have not passed a resolution requiring separate accounts and, in the Directors' opinion, the Company meets the definition of a holding company. As permitted by the law, the Directors have elected not to prepare separate accounts.

CSF GROUP PLC INDEPENDENT AUDITOR’S REPORT
20
INDEPENDENT AUDITOR’S REPORT TO THE MEMBERS OF CSF GROUP PLC
We have audited the financial statements of CSF Group plc for the year ended 31 March 2016 which comprise the Consolidated and Company Statements of Comprehensive Income, the Consolidated and Company Statements of Financial Position, the Consolidated and Company Cash Flow Statements, the Consolidated and Company Statements of Changes in Equity and the related notes 1 to 40. The financial reporting framework that has been applied in their preparation is applicable law and International Financial Reporting Standards (IFRSs) as adopted by the European Union. This report is made solely to the company's members, as a body, in accordance with Article 113A of the Companies (Jersey) Law 1991. Our audit work has been undertaken so that we might state to the company's members those matters we are required to state to them in an auditor's report and for no other purpose. To the fullest extent permitted by law, we do not accept or assume responsibility to anyone other than the company and the company's members as a body, for our audit work, for this report, or for the opinions we have formed.
Respective responsibilities of directors and auditor As explained more fully in the Directors' Responsibilities Statement, the directors are responsible for the preparation of the financial statements and for being satisfied that they give a true and fair view. Our responsibility is to audit and express an opinion on the financial statements in accordance with applicable law and International Standards on Auditing (UK and Ireland). Those standards require us to comply with the Auditing Practices Board's Ethical Standards for Auditors. Scope of the audit of the financial statements An audit involves obtaining evidence about the amounts and disclosures in the financial statements sufficient to give reasonable assurance that the financial statements are free from material misstatement, whether caused by fraud or error. This includes an assessment of: whether the accounting policies are appropriate to the group's circumstances and have been consistently applied and adequately disclosed; the reasonableness of significant accounting estimates made by the directors; and the overall presentation of the financial statements. In addition, we read all the financial and non-financial information in the annual report to identify material inconsistencies with the audited financial statements and to identify any information that is apparently materially incorrect based on, or materially inconsistent with, the knowledge acquired by us in the course of performing the audit. If we become aware of any apparent material misstatements or inconsistencies we consider the implications for our report. Opinion on financial statements In our opinion:
give a true and fair view of the state of the group's and of the parent company's affairs as at 31 March 2016 and of the group's and parent company's loss for the year then ended;
have been properly prepared in accordance with IFRSs as issued by the European Union; and
have been properly prepared in accordance with the Companies (Jersey) Law 1991.
CSF GROUP PLC INDEPENDENT AUDITOR’S REPORT (Continued)
21
Matters on which we are required to report by exception We have nothing to report in respect of the following matters where the Companies (Jersey) Law 1991 requires us to report to you if, in our opinion:
proper accounting records have not been kept by the parent company, or proper returns adequate for our audit have not been received from branches not visited by us; or
the financial statements are not in agreement with the accounting records and returns; or
we have not received all the information and explanations we require for our audit. Simon Olsen FCA
for and on behalf of Deloitte LLP
Chartered Accountants
Southampton, UK
22 July 2016
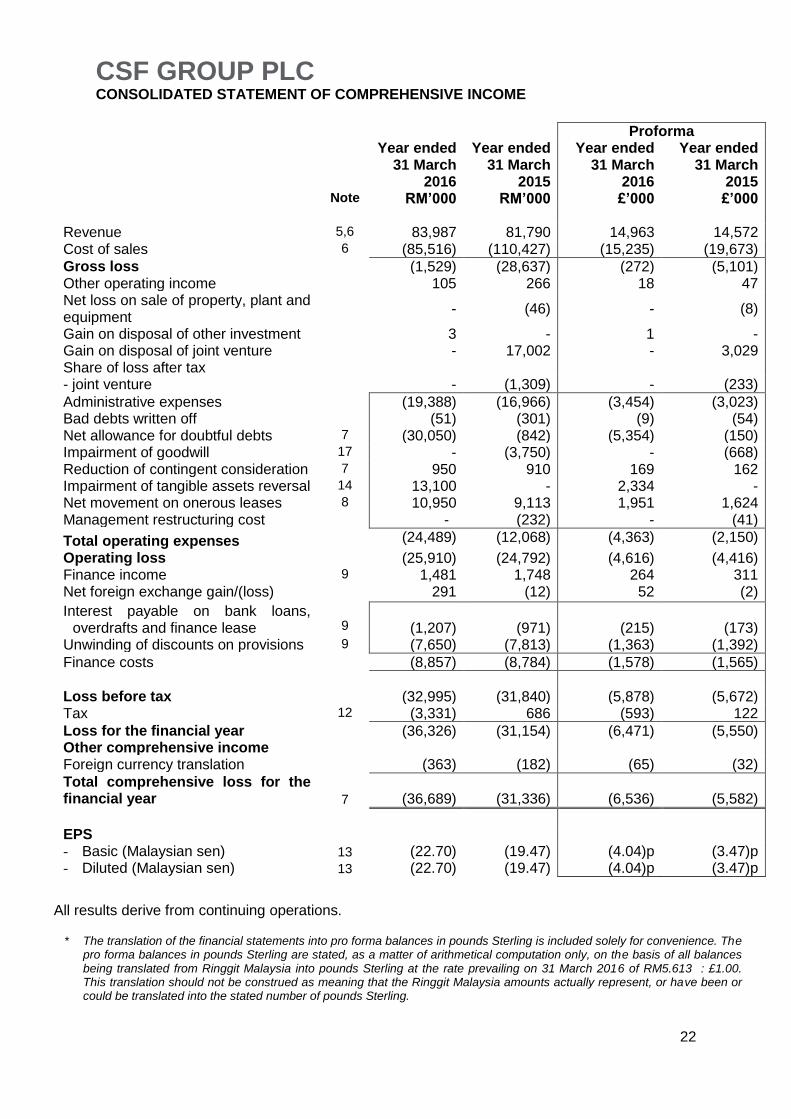
CSF GROUP PLC CONSOLIDATED STATEMENT OF COMPREHENSIVE INCOME
22
Proforma Year ended
31 March 2016
Year ended 31 March
2015
Year ended 31 March
2016
Year ended 31 March
2015 Note RM’000 RM’000 £’000 £’000 Revenue 5,6 83,987 81,790 14,963 14,572 Cost of sales 6 (85,516) (110,427) (15,235) (19,673)
Gross loss (1,529) (28,637) (272) (5,101) Other operating income 105 266 18 47 Net loss on sale of property, plant and equipment
- (46) - (8)
Gain on disposal of other investment 3 - 1 - Gain on disposal of joint venture - 17,002 - 3,029 Share of loss after tax - joint venture - (1,309) - (233)
Administrative expenses (19,388) (16,966) (3,454) (3,023) Bad debts written off (51) (301) (9) (54) Net allowance for doubtful debts 7 (30,050) (842) (5,354) (150) Impairment of goodwill 17 - (3,750) - (668) Reduction of contingent consideration 7 950 910 169 162 Impairment of tangible assets reversal 14 13,100 - 2,334 - Net movement on onerous leases 8 10,950 9,113 1,951 1,624 Management restructuring cost - (232) - (41)
Total operating expenses (24,489) (12,068) (4,363) (2,150)
Operating loss (25,910) (24,792) (4,616) (4,416) Finance income 9 1,481 1,748 264 311 Net foreign exchange gain/(loss) 291 (12) 52 (2)
Interest payable on bank loans, overdrafts and finance lease
9
(1,207)
(971)
(215)
(173)
Unwinding of discounts on provisions 9 (7,650) (7,813) (1,363) (1,392)
Finance costs (8,857) (8,784) (1,578) (1,565)
Loss before tax (32,995) (31,840) (5,878) (5,672) Tax 12 (3,331) 686 (593) 122
Loss for the financial year (36,326) (31,154) (6,471) (5,550) Other comprehensive income Foreign currency translation (363) (182) (65) (32)
Total comprehensive loss for the financial year 7 (36,689) (31,336)
(6,536)
(5,582)
EPS - Basic (Malaysian sen) 13 (22.70) (19.47) (4.04)p (3.47)p - Diluted (Malaysian sen) 13 (22.70) (19.47) (4.04)p (3.47)p
All results derive from continuing operations.
* The translation of the financial statements into pro forma balances in pounds Sterling is included solely for convenience. The pro forma balances in pounds Sterling are stated, as a matter of arithmetical computation only, on the basis of all balances being translated from Ringgit Malaysia into pounds Sterling at the rate prevailing on 31 March 2016 of RM5.613 : £1.00. This translation should not be construed as meaning that the Ringgit Malaysia amounts actually represent, or have been or could be translated into the stated number of pounds Sterling.

CSF GROUP PLC CONSOLIDATED STATEMENT OF FINANCIAL POSITION
23
Proforma
Note
As at 31 March
2016 RM’000
As at 31 March
2015 RM’000
As at 31 March
2016 £’000
As at 31 March
2015 £’000
Non-current assets Property, plant and equipment 14 25,640 13,446 4,568 2,396 Interest in associate 15 - - - - Other Investments 16 155 153 28 27 Goodwill 17 - - - - Trade receivables 19 360 566 64 101 Deferred tax asset 25 - 1,969 - 351
26,155 16,134 4,660 2,875
Current assets Inventories 18 1,781 2,054 317 366 Trade and other receivables 19 64,503 108,925 11,491 19,406 Current tax assets 175 242 31 43 Restricted cash 20 14,055 13,095 2,504 2,333 Cash and cash equivalents 20 45,823 31,379 8,164 5,590
126,337 155,695 22,507 27,738
Total assets 152,492 171,829 27,167 30,613
Current liabilities Trade and other payables 21 44,338 73,130 7,899 13,029 Current tax liabilities 854 - 152 - Bank borrowings 22 1,164 1,164 207 207 Obligations under finance leases 24 140 140 25 25
46,496 74,434 8,283 13,261
Non-current liabilities Obligations under finance leases 24 165 305 29 54 Bank borrowings 22 334 1,498 60 267 Trade and other payables 21 67,492 17,830 12,024 3,177 Deferred tax liabilities 25 232 - 41 - Onerous lease provision 8 57,900 61,200 10,315 10.903
126,123 80,833 22,469 14,401
Total liabilities 172,619 155,267 30,752 27,662
Net (liabilities)/assets (20,127) 16,562 (3,585) 2,951
Equity
Share capital 26 78,936 78,936 14,063 14,063
Share premium account 26 104,499 104,499 18,617 18,617 Shares held under Employee Benefit Trust
26 (2,300) (2,300) (410) (410)
Other reserve 26 (66,153) (66,153) (11,785) (11,785) Share option reserve 26 - 4,117 - 733 Translation reserve 26 (766) (403) (137) (72) Accumulated loss 26 (134,343) (102,134) (23,933) (18,195)
Total (capital deficiency)/equity (20,127) 16,562 (3,585) 2,951
CSF GROUP PLC CONSOLIDATED STATEMENT OF FINANCIAL POSITION (Continued)
24
The financial statements of CSF Group plc registered number 104212 were approved by the Board of Directors and authorised for issue on 22 July 2016. They were signed on its behalf by: Lee, King Loon, Director 22 July 2016
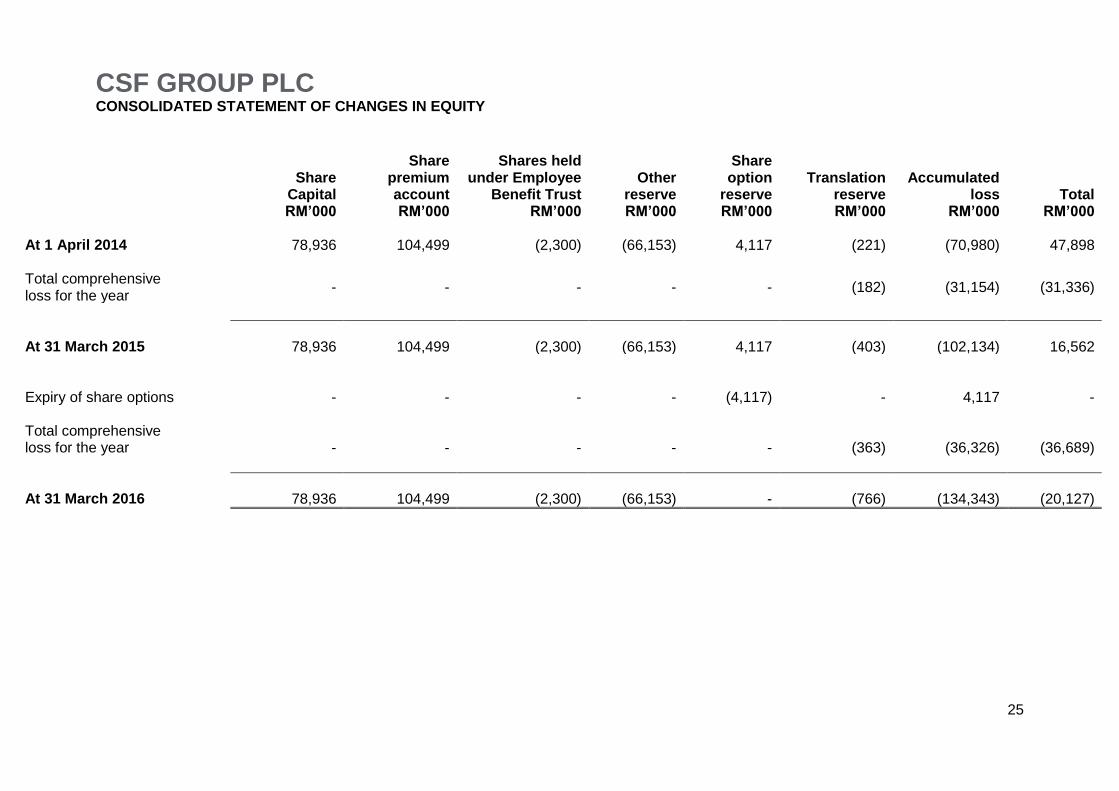
CSF GROUP PLC CONSOLIDATED STATEMENT OF CHANGES IN EQUITY
25
Share
Capital RM’000
Share premium account RM’000
Shares held under Employee
Benefit Trust RM’000
Other
reserve RM’000
Share option
reserve RM’000
Translation
reserve RM’000
Accumulated
loss RM’000
Total RM’000
At 1 April 2014 78,936 104,499 (2,300) (66,153) 4,117 (221) (70,980) 47,898 Total comprehensive loss for the year
- - - - - (182) (31,154) (31,336)
At 31 March 2015 78,936 104,499 (2,300) (66,153) 4,117 (403) (102,134) 16,562 Expiry of share options
-
-
-
-
(4,117)
-
4,117
-
Total comprehensive loss for the year
-
-
-
-
-
(363)
(36,326)
(36,689)
At 31 March 2016 78,936 104,499 (2,300) (66,153) - (766) (134,343) (20,127)
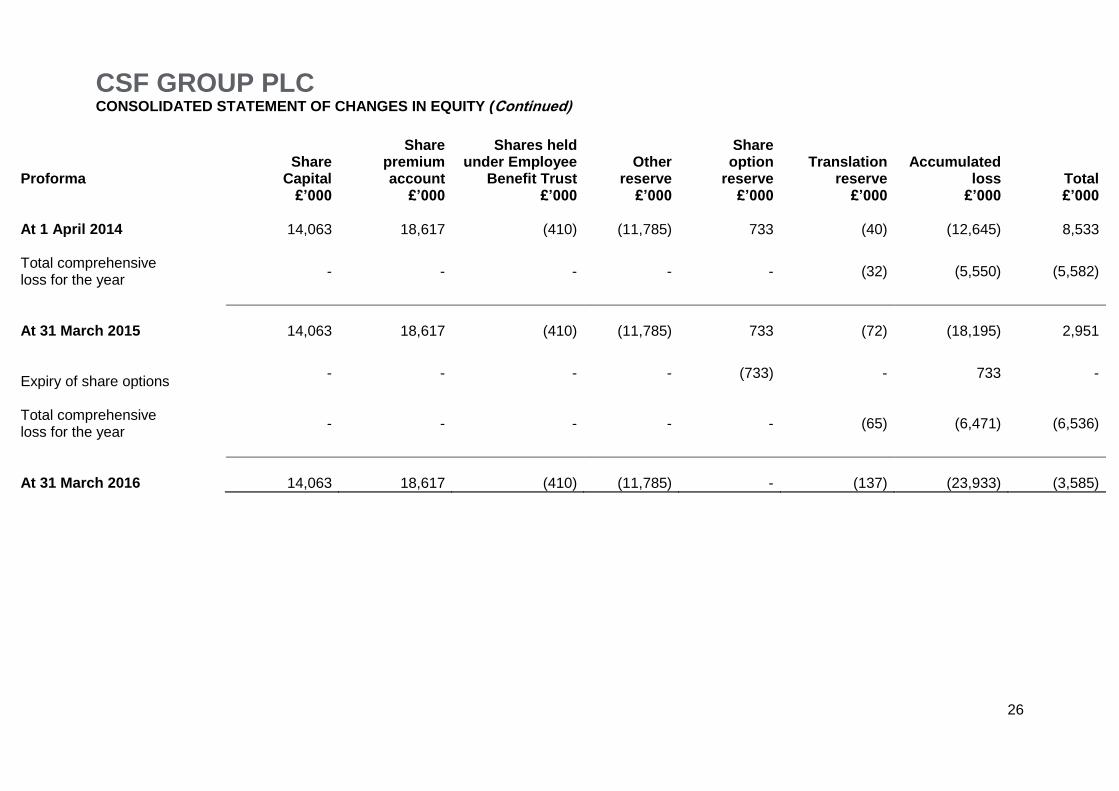
CSF GROUP PLC CONSOLIDATED STATEMENT OF CHANGES IN EQUITY (Continued)
26
Proforma
Share
Capital £’000
Share premium account
£’000
Shares held under Employee
Benefit Trust £’000
Other
reserve £’000
Share option
reserve £’000
Translation
reserve £’000
Accumulated
loss £’000
Total £’000
At 1 April 2014 14,063 18,617 (410) (11,785) 733 (40) (12,645) 8,533 Total comprehensive loss for the year
- - - - - (32) (5,550) (5,582)
At 31 March 2015 14,063 18,617 (410) (11,785) 733 (72) (18,195) 2,951 Expiry of share options
- - - - (733) - 733 -
Total comprehensive loss for the year
- - - - - (65) (6,471) (6,536)
At 31 March 2016 14,063 18,617 (410) (11,785) - (137) (23,933) (3,585)

CSF GROUP PLC CONSOLIDATED STATEMENT OF CASH FLOW
27
Note
Year ended 31 March
2016 RM’000
Year ended 31 March
2015 RM’000
Proforma Year ended
31 March 2016 £’000
Proforma Year ended
31 March 2015 £’000
Net cash used in operating activities
27 (8,683) (13,332) (1,547) (2,375)
Investing activities Interest received 1,481 1,748 264 311 Repayment of advances from joint venture - 8,921 - 1,589 Repayment of advances from the owner of
a development project
27,936 20,000 4,977 3,563 Additions to property, plant and equipment (4,083) (5,792) (727) (1,032) Net proceeds from sale of property, plant and equipment
- 18 - 3
Proceeds from sale of other investment 3 - - - Purchase of new subsidiary, net of cash - (1,440) - (256)
Net cash generated from investing activities
25,337 23,455 4,514 4,178
Financing activities Repayments of obligations under finance leases
(140) (140) (25) (25)
(Increase)/Decrease in restricted cash (960) 136 (171) 24 Repayment of borrowings (1,164) (776) (207) (138)
Net cash used in financing activities (2,264) (780) (403) (139)
Net increase in cash and cash equivalents
14,390 9,343 2,564 1,664
Cash and cash equivalents at beginning of financial year
29,182 19,839 5,199 3,534
Cash and cash equivalents at end of financial year 20 43,572 29,182 7,763 5,198

CSF GROUP PLC NOTES TO THE FINANCIAL STATEMENTS
28
1. GENERAL INFORMATION Basis of accounting
The financial statements have been prepared in accordance with International Financial Reporting Standards (“IFRS”) as adopted by the EU. The financial statements are presented in Malaysian Ringgit which is the currency of the primary economic environment in which the Group operates. The financial statements have been prepared on the historical cost basis, except for the valuation of listed investments. The principal accounting policies adopted are consistent with previous financial year, unless otherwise stated. Pro forma balances
The inclusion of pro forma balances in pounds Sterling is included solely for convenience. The pro forma balances in pounds Sterling are stated, as a matter of arithmetical computation only, on the basis of all balances being translated from Malaysian Ringgits into pounds Sterling at the rate prevailing on 31 March 2016 of RM5.613 : £1.00. This translation should not be construed as meaning that the Malaysian Ringgit amounts actually represent, or have been or could be converted into the stated number of pounds Sterling. Going concern
The Group‟s business activities, together with the factors likely to affect the future development, performance and position are set out in the Chairman‟s Statement. The financial position of the Group, its cash flows and liquidity positions are described in the Chief Financial Officer‟s Review. In addition, the notes to financial statements include foreign currency risk management, interest rate risk management, credit risk management and liquidity risk management.
As at 31 March 2016, the Group‟s cash and cash equivalents excluding deposits held on behalf of the Employee Benefit Trust stand at RM43.6 million.
The Directors have prepared financial projections, including cash flows, for a period up to 31 March 2018. The projections include sensitivity testing to consider a reasonable worst case scenario. Based on these projections and taking into consideration the current financial position of the Group and future capital and lease commitments, the Directors have a reasonable expectation that the Group has adequate resources to continue in operational existence for the foreseeable future. Thus they continue to adopt the going concern basis of accounting in preparing the annual financial statements. In reaching this conclusion the directors have paid particular attention to the following factors:
The positive progress that is already being made in restructuring the business and the heightened focus on cash management;
The existing cash reserves of the business, and the fact that the Group has low levels of bank borrowings with low financial covenants;
The Group‟s business model is to lease its data centres as opposed to outright ownership. As a result, the Group is committed to regular lease rental payments, which constitute a significant proportion of the Group‟s cost base. The Group therefore needs to achieve a certain level of tenant occupancy to cover the minimum lease and other costs of ownership of a given data centre;
CSF GROUP PLC NOTES TO THE FINANCIAL STATEMENTS (Continued)
29
The Group has already secured new tenants for part of CX5 and is in active discussions with a number of other potential tenants to secure an adequate level of occupancy;
Due to changes in the data centre rental market, current market rentals have declined. In this regard the group are monitoring closely its cost and looking at ways to improve the operation and procurement process including working closely with its suppliers to reduce the overall cost;
The Group has completed the restructuring with the freeholder on the lease rental payments on CX1, CX2 and CX5, with the revised lease rental rates commencing on 1 January 2016 whereby the lease rental payments shall be lower in the earlier years and progressively increasing thereafter. The outstanding lease rental accrued up to 31 December 2015 will be settled over an extended period;
The Group received significant cash receipts of RM31.4 million upon the completion of block C of CX5 in June 2015 and progressively received RM6.0 million of amount receivable relating to the CX5 project during the year. The balance of amounts receivable relating to the CX5 project of RM32.3 million is due to be received progressively in line with the expiry of the warranty period of certain components of the fit-out works relating to CX5, which is expected to end in the second quarter of calendar year 2017. The directors note that the receipt of proceeds of the remaining balance of CX5 project is governed by existing contractual arrangements;
The funding requirements of existing and proposed new ventures and/or projects. Given prevailing market conditions and the current levels of occupancy in the Group‟s data centres, the Group is forecast to continue to make operating losses and have operating cash outflows. The Board is continuing to review the Group‟s business model with the aim of establishing sustainable profitable trading. Notwithstanding the above and taking into consideration the current financial position, future capital and lease commitments of the Group, the directors have a reasonable expectation that the Group has adequate resources to continue in operational existence for the foreseeable future. Thus they continue to adopt the going concern basis of accounting in preparing the consolidated financial statements for the year ended 31 March 2016.
CSF GROUP PLC NOTES TO THE FINANCIAL STATEMENTS (Continued)
30
2. NEW AND REVISED STANDARDS
Adoption of new and revised International Financial Accounting Standards
There are no IFRSs or IFRIC interpretations that are effective for the first time for the financial year 31 March 2016 that have a material impact on the group. At the date of the authorisation of the financial statements, the following standards and interpretations, which have not been applied in the financial statements, were issued but not yet effective:
IFRS 9 - Financial Instruments (i) IFRS 15 - Revenue from Contracts with Customers (ii) IFRS 16 Leases (v) Amendments to IAS 16 and IAS 38 - Clarification of Acceptable Methods of Depreciation and Amortisation (iv) Amendments to IAS 27 - Equity Method in Separate Financial Statements (iv) Amendments to IFRS 10 and IAS 28 - Sale or Contribution of Assets between an Investor and its Associate or Joint Venture (iv) Annual Improvements 2012-2014 Cycle (iii) Amendments to IAS 1 - Disclosure Initiative (iv) Amendments to IFRS 10, IFRS 12 and IAS 28 - Investment Entities: Applying the Consolidation Exception (iv) Recognition of Deferred Tax Assets for Unrealised Losses (Amendments to IAS 12) (ii) Disclosure Initiative (Amendments to IAS 7) (ii) Clarifications to IFRS 15 'Revenue from Contracts with Customers' (i) i. Effective for annual periods beginning on or after 1 January 2018, with earlier application permitted
ii. Effective for annual periods beginning on or after 1 January 2017, with earlier application permitted
iii. Effective for annual periods beginning on or after 1 July 2016, with earlier application permitted iv. Effective for annual periods beginning on or after 1 January 2016, with earlier application permitted
v . Effective for annual periods beginning on or after 1 January 2019, with earlier application permitted
The Directors do not anticipate that the adoption of these standards and interpretations in future financial years will have a material impact on the financial statements. However, the application of IFRS 15 and IFRS 16 in the future may have a material impact on the amounts reported and disclosures made in the Group‟s consolidated financial statements. It is not practical to provide a reasonable estimate of the effect of IFRS 15 and IFRS 16 until the Group performs a detailed review. 3. SIGNIFICANT ACCOUNTING POLICIES Basis of consolidation
The consolidated financial statements incorporate the financial statements of the Company and entities controlled by the Company (its subsidiaries) made up to 31 March each year. Control is achieved where the Company has the power to govern the financial and operating policies of an investee entity so as to obtain benefits from its activities.

CSF GROUP PLC NOTES TO THE FINANCIAL STATEMENTS (Continued)
31
The results of subsidiaries acquired or disposed of during the year are included in the consolidated statement of comprehensive income from the effective date of acquisition or up to the effective date of disposal, as appropriate. Where necessary, adjustments are made to the financial statements of subsidiaries to bring the accounting policies used into line with those used by the Group. All intra-group transactions, balances, income and expenses are eliminated on consolidation. Any contingent consideration to be transferred by the group is recognised at fair value at the acquisition date. Subsequent changes in fair value of the contingent consideration that is deemed to be an asset or liability is recognised in accordance with IAS39 either in profit or loss or as a change to other comprehensive income. Contingent consideration that is classified as equity is not re-measured, and its subsequent settlement is accounted for within equity.
Goodwill is initially measured as the excess of the aggregate of the consideration transferred and the fair value on non-controlling interest over the net identifiable assets acquired and liabilities assumed.
Revenue recognition and contract accounting
Revenue represents amounts receivable for work carried out in the rental of data centre space (including reimbursement for electricity consumed by customers), design and development of data centre facilities, the maintenance of data centres and imputed interest on loans to data centre developers. Revenue from contract works is recognised in the Consolidated Statement of Comprehensive Income based on the stage of completion which is determined based on the contract costs incurred for work performed to date in proportion to the estimated total contract costs. Revenue on design and development activity is recognised over the period of the activity and in accordance with the underlying contract. Revenue is measured by reference to the fair value of consideration received or receivable from customers. Cost overspends on design and development are recognised as they arise and cost under-spends recognised when it is known with reasonable certainty, the final position of the relevant contract. Where design and development projects are in progress and where sales invoiced exceed the cost of work completed, the excess is shown as deferred income, within other financial assets. When it is probable that total fit-out costs will exceed contract revenue, the expected loss is recognised as an expense immediately. Income from support and maintenance agreements and the rental of data centre space is recognised on a straight line basis over the period of the related activity. Data centre space is rented out under operating leases. Retirement benefit costs
As required by Malaysian law, the Company makes contributions to the Employees Provident Fund. The Group pays a fixed contribution based on a set percentage of employee‟s salary. The Group has no further legal or constructive obligations in respect of the retirement benefit costs. Payments to the Employee Provident Fund are recognised as an expense in the income statement as incurred.
CSF GROUP PLC NOTES TO THE FINANCIAL STATEMENTS (Continued)
32
Taxation
The tax expense represents the sum of the tax currently payable, and deferred tax. The tax currently payable is based on taxable profit for the financial year. Taxable profit differs from net profit as reported in the consolidated statement of comprehensive income because it excludes items of income or expense that are taxable or deductible in other years and it further excludes items that are never taxable or deductible. The Group‟s liability for current tax is calculated using tax rates that have been enacted or substantively enacted by the balance sheet date. Deferred tax is the tax expected to be payable or recoverable on differences between the carrying amounts of assets and liabilities in the financial statements and the corresponding tax bases used in the computation of taxable profit, and is accounted for using the balance sheet liability method. Deferred tax liabilities are generally recognised for all taxable temporary differences and deferred tax assets are recognised to the extent that it is probable that taxable profits will be available against which deductible temporary differences can be utilised. Such assets and liabilities are not recognised if the temporary difference arises from the initial recognition of goodwill or from the initial recognition (other than in a business combination) of other assets and liabilities in a transaction that affects neither the taxable profit nor the accounting profit. Deferred tax liabilities are recognised for taxable temporary differences arising on investments in subsidiaries and associates and interests in joint ventures, except where the Group is able to control the reversal of the temporary difference and it is probable that the temporary difference will not reverse in the foreseeable future. Property, plant and equipment
Land is held at cost and is not depreciated. Property, plant and equipment is held at cost less accumulated depreciation and any recognised impairment loss. They are depreciated using the straight-line method over their expected useful lives as follows: Buildings - 2% Plant and machinery - 10%-20% Computer equipment - 20% Depreciation is charged in full in the month of acquisition and disposal. Assets held under finance lease are depreciated over their useful lives as set out above, or over the lease term if shorter. The gain or loss arising on the disposal or retirement of an asset is recognised in the Consolidated Statement of Comprehensive Income determined as the difference between the sale proceeds and the carrying amount of the asset.
CSF GROUP PLC NOTES TO THE FINANCIAL STATEMENTS (Continued)
33
Intangible assets – Goodwill
Goodwill arises on the acquisition of subsidiaries and represents the excess of the consideration transferred over the Group‟s interest in net fair value of the net identifiable assets, liabilities and contingent liabilities of the acquiree and the fair value of the non-controlling interest in the acquiree.
Goodwill impairment reviews are undertaken annually or more frequently if events or changes in circumstances indicate a potential impairment. The carrying value of goodwill is compared to the recoverable amount, which is the higher of value in use and the fair value less cost to sell. Any impairment is recognised immediately as an expense and is not subsequently reversed.
Borrowing costs
Borrowing costs that are directly attributable to the acquisition, construction or production of a qualifying asset are capitalised as part of property, plant and equipment. Other borrowing costs are recognised as an expense in the period in which they arise. In accordance with the transitional provisions of IAS 23 „Borrowing Costs‟ (Revised 2007), borrowing costs relating to qualifying assets for which the commencement date of capitalisation is prior to 1 April 2009 have been recognised as an expense in the period in which they arise.
Sale and leaseback transaction
The sale of assets under a sale and leaseback transaction is treated as a disposal of the assets after the transfers of substantially all the risk and rewards incidental to ownership of an asset concerned and any profit or loss arising from the transaction is recognised immediately in the income statement. The corresponding rentals payable are charged to income on a straight-line basis over the term of the relevant lease.
Impairment of tangible assets
At each balance sheet date, the Group reviews the carrying amounts of its tangible assets to determine whether there is any indication that those assets have suffered an impairment loss. If any such indications exist, the recoverable amount of the asset is estimated in order to determine the extent of the impairment loss (if any). Where the asset does not generate cash flows that are independent from other assets, the Group estimates the recoverable amount of the cash-generating unit to which the asset belongs. An intangible asset with an indefinite useful life is tested for impairment annually and whenever there is an indication that the asset may be impaired. Recoverable amount is the higher of fair value less costs to sell and value in use. In assessing value in use, the estimated future cash flows are discounted to their present value using a pre-tax discount rate that reflects current market assessments of the time value of money and the risks specific to the asset for which the estimates of future cash flows have not been adjusted.

CSF GROUP PLC NOTES TO THE FINANCIAL STATEMENTS (Continued)
34
If the recoverable amount of an asset (or cash-generating unit) is estimated to be less than its carrying amount, the carrying amount of the asset (cash-generating unit) is reduced to its recoverable amount. An impairment loss is recognised as an expense immediately, unless the relevant asset is carried at a revalued amount in which case the impairment loss is treated as a revaluation decrease. Where an impairment loss subsequently reverses, the carrying amount of the asset (cash-generating unit) is increased to the revised estimate of its recoverable amount, but so that the increased carrying amount does not exceed the carrying amount that would have been determined had no impairment loss been recognised for the asset (cash-generating unit) in prior years. A reversal of an impairment loss is recognised as income immediately, unless the relevant asset is carried at a revalued amount in which case the reversal of the impairment loss is treated as a revaluation increase.
Interest in Associates An associate is an entity over which the Group has significant influence and that is neither a subsidiary nor an interest in a joint venture. The results and assets and liabilities of associates are incorporated in these consolidated financial statements using the equity method of accounting, except when the investment is classified as held for sale. Under the equity method, an investment in an associate is initially recognised in the consolidated statement of financial position at cost and adjusted thereafter to recognise the Group's share of the profit or loss and other comprehensive income of the associate. When the Group's share of losses of an associate exceeds the Group's interest in that associate (which includes any long-term interests that, in substance, form part of the Group's net investment in the associate), the Group discontinues recognising its share of further losses. Additional losses are recognised only to the extent that the Group has incurred legal or constructive obligations or made payments on behalf of the associate. When a Group entity transacts with its associate, profits and losses resulting from the transactions with the associate are recognised in the Group's consolidated financial statements only to the extent of interests in the associate that are not related to the Group.
Other Investments
The Group has certain investments in listed and private companies. Investments include entities where the Group does not have the ability to exercise significant influence. The financial results of such entities are not included in the financial statements. Investments in listed businesses are quoted on an active market and have been acquired principally for the purpose of investment. They are therefore classified as held for trading and are treated as ‘at fair value through profit and loss’ (FVTPL). Listed investments are measured at each reporting date at fair value, with any gains or losses arising on re-measurement recognised in profit or loss. The net gain or loss recognised in profit or loss incorporates any dividend earned on the investment. Investments in private companies are held as non-current assets and are stated at cost less provision for any impairment. A provision is recognised when there is doubt over the future realisation of value.

CSF GROUP PLC NOTES TO THE FINANCIAL STATEMENTS (Continued)
35
Inventories
Inventories are stated at the lower of cost and net realisable value. Cost comprises direct material costs. Net realisable value represents the estimated selling price less all estimated costs of completion.
Work in progress
Work in progress is valued at cost, plus attributable profits less foreseeable losses and progress billings received and receivable. Contract costs include costs of direct material, sub-contract costs, other related costs and overhead expenses. When the outcome of a contract can be estimated reliably, contract costs are recognised as expenses by reference to the stage of completion of the contract activities at the balance sheet date, when it is probable that total contract costs will exceed total contract value, the expected loss is recognised as an expense immediately.
Liabilities directly associated with assets classified as held for sale
The fair values of liabilities classified as liabilities directly associated with assets classified as held for sale approximate to their carrying amounts.
Financial instruments
Financial assets and financial liabilities are recognised on the Group‟s Balance Sheet when the Group becomes a party to the contractual provision of the instrument. Trade and other receivables Receivables are measured at initial recognition at fair value, and are subsequently measured at amortised cost using the effective interest rate method. Appropriate allowances for estimated irrecoverable amounts are recognised in the Consolidated Statement of Comprehensive Income when there is objective evidence that the asset is impaired. The allowance recognised is measured as the difference between the asset‟s carrying amount and the present value of estimated future cash flows discounted at the effective interest rate computed at initial recognition. Cash and cash equivalents Cash and cash equivalents comprise cash on hand and deposits held with banks with an original maturity date of three months or less.
Restricted cash Restricted cash comprises fixed deposits with licensed banks which are pledged to the banks in guarantee for the bank borrowing. Restricted cash is not included in cash and cash equivalents. Trade payables Trade payables are initially measured at fair value, and are subsequently measured at amortised cost using the effective interest rate method.
CSF GROUP PLC NOTES TO THE FINANCIAL STATEMENTS (Continued)
36
Borrowings
Interest bearing bank loans and overdrafts are recorded at the proceeds received, net of direct issue costs. Finance charges, including premiums payable on settlement or redemption and direct issue costs, are amortised over the period in the Consolidated Statement of Comprehensive Income using the effective interest rate method and are added to the carrying amount of the instrument to the extent that they are not settled in the period in which they arise. Leasing
Leases are classified as finance leases whenever the terms of the lease transfer substantially all the risks and rewards of ownership to the lessee. All other leases are classified as operating leases. Assets held under finance leases are recognised as assets of the Group at their fair value or, if lower, at the present value of the minimum lease payments, each determined at the inception of the lease. The corresponding liability to the lessor is included in the Consolidated Balance Sheet as a finance lease obligation. Lease payments are apportioned between finance charges and reduction of the lease obligation so as to achieve a constant rate of interest on the remaining balance of the liability. Finance charges are charged directly against income, unless they are directly attributable to qualifying assets, in which case they are capitalised in accordance with the Group‟s general policy on borrowing costs. Rentals payable under operating leases are charged to income on a straight-line basis over the term of the relevant lease. Benefits received and receivable as an incentive to enter into an operating lease are also spread on a straight-line basis over the lease term.
Provisions
Provisions are recognised when the Group has a present obligation as a result of a past event and it is probable that the Group will be required to settle that obligation. Provisions are measured at the Directors‟ best estimate of the expenditure required to settle the obligation at the balance sheet date and are discounted to present value where the effect is material.
Foreign currencies
Each of the active individual entities in the Group operates solely in Malaysia and each has a functional currency of Malaysian Ringgit. The presentational currency of the financial statements is also Malaysian Ringgit. Transactions in currencies other than the Group‟s functional currency are recognised at the rates of exchange prevailing on the dates of the transactions. At each balance sheet date, monetary assets and liabilities that are denominated in foreign currencies are retranslated at the rates prevailing at that date. Non-monetary items that are measured in terms of historical cost in a foreign currency are not translated.

CSF GROUP PLC NOTES TO THE FINANCIAL STATEMENTS (Continued)
37
Share-based payments
Equity-settled share-based payments to employees and others providing similar services are measured at the fair value of the equity instruments at the grant date. The fair value excludes the effect of non market-based vesting conditions. The fair value determined at the grant date of the equity-settled share-based payments is expensed on a straight-line basis over the vesting period, based on the Group‟s estimate of equity instruments that will eventually vest. At each balance sheet date, the Group revises its estimate of the number of equity instruments expected to vest as a result of the effect of non market-based vesting conditions. The impact of the revision of the original estimates, if any, is recognised in profit or loss such that the cumulative expense reflects the revised estimate, with a corresponding adjustment to the equity-settled employee benefits reserve. 4. CRITICAL ACCOUNTING JUDGEMENT AND KEY SOURCES OF ESTIMATION UNCERTAINTY Critical judgements in applying the Group’s accounting policies
In the process of applying the Group‟s accounting policies, which are described in Note 3, the Directors must make estimates and assumptions that affect the amounts recognised in the financial statements. Several of these estimates and judgments are related to matters that are inherently uncertain as they pertain to future events. These estimates and judgments are evaluated at each reporting date and are based on historical experience, internal controls, advice from external experts and other factors, including expectations of future events that are believed to be reasonable under the circumstances. The resulting accounting estimates may vary from the actual results. The estimates and assumptions that have a significant risk of causing a material adjustment to the carrying amounts of assets and liabilities within the next financial year are as follows:
Revenue recognition
Revenue from the installation, integration and fit-out of equipment is recognised over the period of the related fit-out activity, which requires the Directors to consider the costs incurred to the balance sheet date and estimate the costs to completion of the contract, as described in note 3. The estimation of costs to complete on contracts is judgemental and requires an estimate of the cost of materials, labour hours and cost, and time to complete. The estimate of the total costs to complete is based on historical experience and status of each project. The estimates are reviewed regularly and revised as necessary. Any significant change in these estimates will result in a change to the revenue recognition and the margin for future periods.

CSF GROUP PLC NOTES TO THE FINANCIAL STATEMENTS (Continued)
38
Provision for bad and doubtful debts
The provision for bad and doubtful debts includes the assessment of amounts receivable on an individual and collective basis. For individual provisions, events and circumstances such as breaching credit terms, evidence of the debtor experiencing financial difficulties, and potentially the probability of the debtor entering bankruptcy or financial reorganisation are considered. Based on these indicators a judgment is made whether a provision is required. In respect of a collective assessment, the estimation of the future settlement profile of trade receivables is judgemental and includes consideration of past experience in collecting payments, an increase in the number of delayed payments past the credit period as well as observable changes in the economic conditions that correlate with default on receivables.
The Group made general allowance for doubtful debts pertaining to trade receivables aged six months and above.
Recoverability of amounts owing from IDCB
Trade receivables includes an aggregate amount of RM32.3m due from IDCB, the developer of the CX5 data centre. Subsequent to the financial year end, the Group received RM3.0 million. The balance of trade receivables of RM29.3 million is due to be received progressively in line with the expiry of the warranty period of certain components of the fit-out works relating to CX5, which is expected to end second quarter of calendar year 2017. The recoverability of the remaining amount due from IDCB is dependent on the completion of certain milestones anticipated in the legal agreements, which contemplates recovery over the next financial year. This represents a significant receivable on the Group‟s balance sheet, there is inherent risk in both the recoverability of the receivables and the timing of associated receipts. The Group has made a general provision for doubtful debts pertaining to trade receivables aged six months and above including IDCB to cover the inherent risks associated with trade receivables that are expected to be collected over a longer period of time.
Onerous lease assessment
The Group‟s business model is to lease data centres, and as such the Group is committed to lease rentals and certain other costs of ownership. As such, the Group needs to achieve a certain level of rental income from tenants over the life of the data centre lease such that revenue received will exceed costs. If this is not the case, then the data centre lease rental contract could be onerous.
In order to calculate onerous lease obligations the directors are required to estimate the future tenancy profile of a data centre, which is inherently judgemental as the unexpired terms of the leases for nine years and the estimate may vary as a result of changes in the utilisation and price of a data centre‟s space.
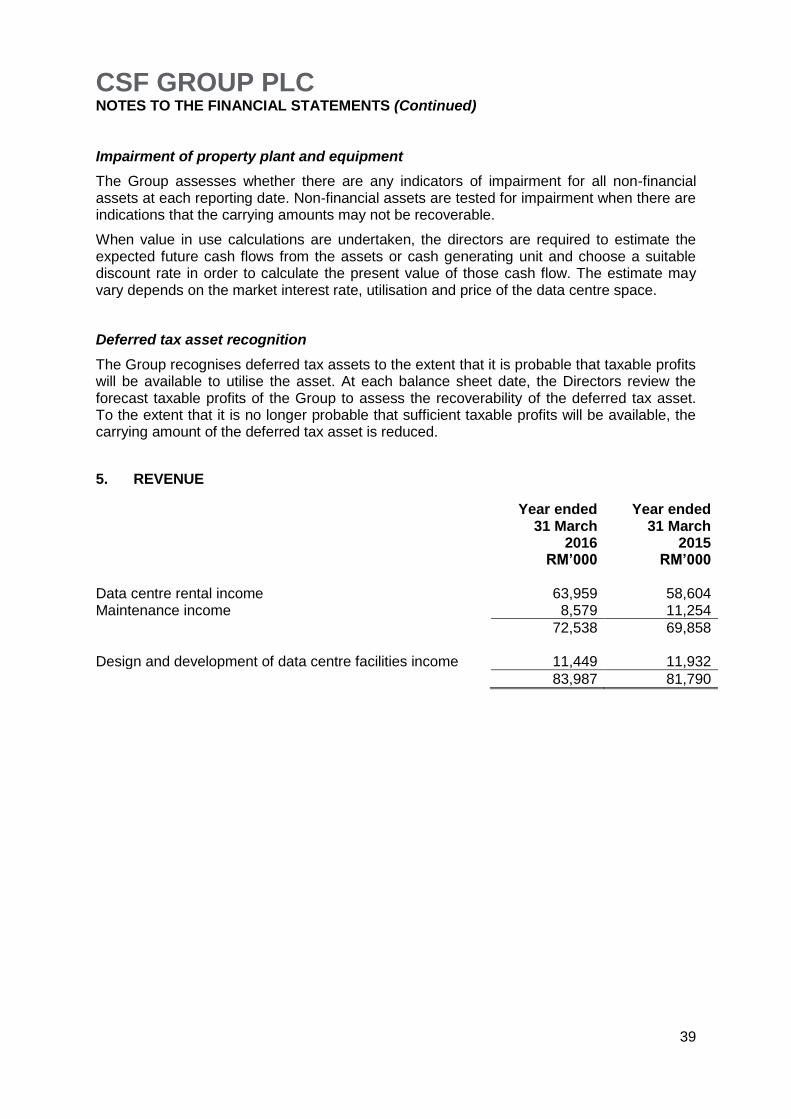
CSF GROUP PLC NOTES TO THE FINANCIAL STATEMENTS (Continued)
39
Impairment of property plant and equipment
The Group assesses whether there are any indicators of impairment for all non-financial assets at each reporting date. Non-financial assets are tested for impairment when there are indications that the carrying amounts may not be recoverable.
When value in use calculations are undertaken, the directors are required to estimate the expected future cash flows from the assets or cash generating unit and choose a suitable discount rate in order to calculate the present value of those cash flow. The estimate may vary depends on the market interest rate, utilisation and price of the data centre space.
Deferred tax asset recognition
The Group recognises deferred tax assets to the extent that it is probable that taxable profits will be available to utilise the asset. At each balance sheet date, the Directors review the forecast taxable profits of the Group to assess the recoverability of the deferred tax asset. To the extent that it is no longer probable that sufficient taxable profits will be available, the carrying amount of the deferred tax asset is reduced.
5. REVENUE
Year ended 31 March
2016 RM’000
Year ended 31 March
2015 RM’000
Data centre rental income 63,959 58,604 Maintenance income 8,579 11,254
72,538 69,858 Design and development of data centre facilities income 11,449 11,932
83,987 81,790

CSF GROUP PLC NOTES TO THE FINANCIAL STATEMENTS (Continued)
40
6. REPORTING SEGMENTS The Management regularly reviews segment information based on the key products and services provided to its customers; rental of data centre space, maintenance (including) support of data centres, and the design and development of data centre facilities.
Year ended 31 March 2016 Data centre rental
RM’000 Maintenance
RM’000
Design and development
of data centre facilities RM’000
Consolidated RM’000
Revenue 63,959 8,579 11,449 83,987 Cost of sales (77,518) (2,733) (5,265) (85,516)
Gross profit / (loss) (13,559) 5,846 6,184 (1,529) Other operating income 65 - 40 105 Administrative cost (5,081) (655) (618) (6,354) Allowance for doubtful debts (571) - (29,479) (30,050) Allowance for slowing stock - - (482) (482) Allowance for diminution of investment
-
-
2
2
Bad debts written off - - (165) (165) Unwinding of discounts on provision
(7,650)
-
-
(7,650)
Net movement on onerous leases 10,950 - - 10,950 Staff costs (4,746) (645) (863) (6,254) Segment depreciation (21) (16) (68) (105)
Segment result (20,613) 4,530 (25,449) (41,532) Non-trade bad debts written back 114 Reduction of contingent consideration
950
Corporate cost (6,195) Finance income 1,481 Gain on disposal of other investment
3
Reversal of impairment loss 13,100 Net foreign exchange loss 291 Finance costs (1,207)
Loss before tax (32,995) Tax (3,331)
Loss for the financial year (36,326) Other comprehensive income Foreign currency translation (363)
Total comprehensive loss for the financial year
(36,689)

CSF GROUP PLC NOTES TO THE FINANCIAL STATEMENTS (Continued)
41
Year ended 31 March 2015 Data centre rental
RM’000 Maintenance
RM’000
Design and development
of data centre facilities RM’000
Consolidated RM’000
Revenue 58,604 11,254 11,932 81,790 Cost of sales (95,829) (5,313) (9,285) (110,427)
Gross profit / (loss) (37,225) 5,941 2,647 (28,637) Other operating income - - 266 266 Administrative cost (3,635) (572) (635) (4,842) Allowance for doubtful debts (655) - (187) (842) Allowance for slowing stock - - (361) (361) Allowance for diminution of investment
-
-
(19)
(19)
Unwinding of discounts on provision
(7,813)
-
-
(7,813)
Net movement on onerous leases 9,113 - - 9,113 Staff costs (4,132) (938) (981) (6,051) Segment depreciation (31) (23) (100) (154)
Segment result (44,378) 4,408 630 (39,340) Non-trade bad debts written off (301) Impairment of goodwill (3,750) Reduction of contingent consideration
910
Management restructuring costs (232) Corporate cost (5,539) Finance income 1,748 Gain on disposal of joint venture 17,002 Net foreign exchange loss (12) Loss on disposal of property, plant and equipment
(46)
Share of loss of jointly controlled entity
(1,309)
Finance costs (971)
Loss before tax (31,840) Tax 686
Loss for the financial year (31,154) Other comprehensive income Foreign currency translation (182)
Total comprehensive loss for the financial year
(31,336)
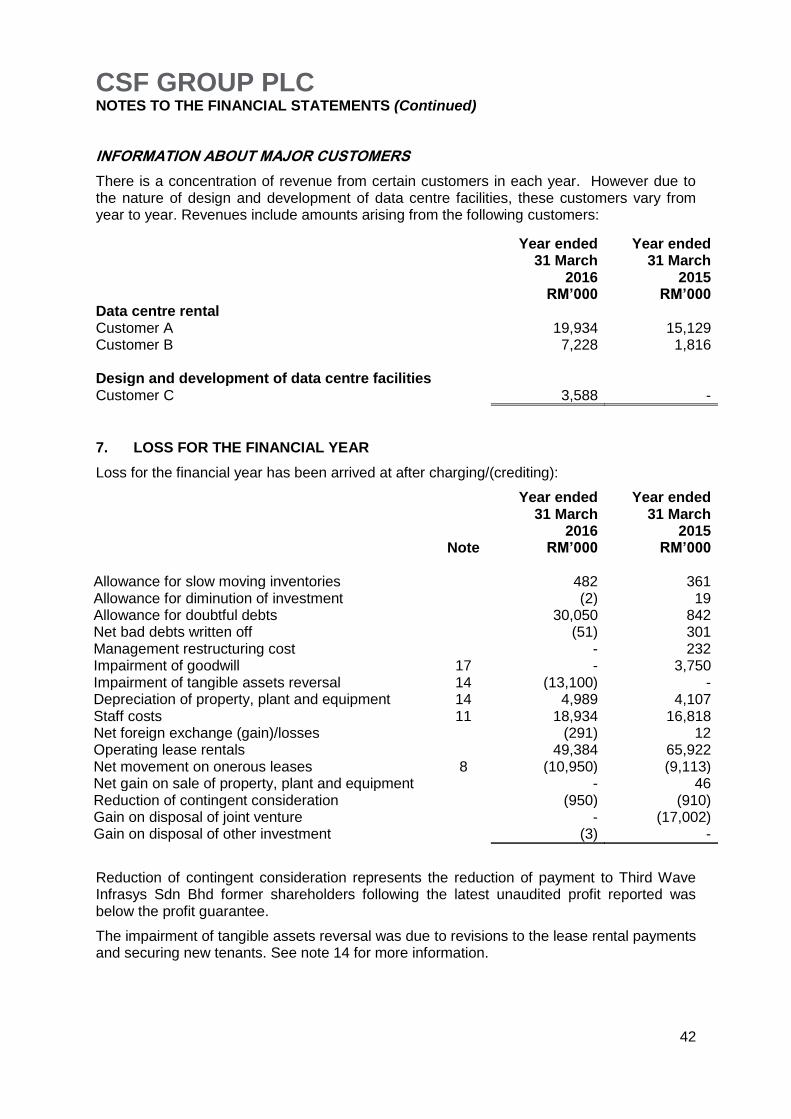
CSF GROUP PLC NOTES TO THE FINANCIAL STATEMENTS (Continued)
42
INFORMATION ABOUT MAJOR CUSTOMERS
There is a concentration of revenue from certain customers in each year. However due to the nature of design and development of data centre facilities, these customers vary from year to year. Revenues include amounts arising from the following customers:
Year ended 31 March
2016 RM’000
Year ended 31 March
2015 RM’000
Data centre rental Customer A 19,934 15,129 Customer B 7,228 1,816 Design and development of data centre facilities Customer C 3,588 -
7. LOSS FOR THE FINANCIAL YEAR
Loss for the financial year has been arrived at after charging/(crediting):
Note
Year ended 31 March
2016 RM’000
Year ended 31 March
2015 RM’000
Allowance for slow moving inventories 482 361 Allowance for diminution of investment (2) 19 Allowance for doubtful debts 30,050 842 Net bad debts written off (51) 301 Management restructuring cost - 232 Impairment of goodwill 17 - 3,750 Impairment of tangible assets reversal 14 (13,100) - Depreciation of property, plant and equipment 14 4,989 4,107 Staff costs 11 18,934 16,818 Net foreign exchange (gain)/losses (291) 12 Operating lease rentals 49,384 65,922 Net movement on onerous leases 8 (10,950) (9,113) Net gain on sale of property, plant and equipment - 46 Reduction of contingent consideration (950) (910) Gain on disposal of joint venture - (17,002) Gain on disposal of other investment (3) -
Reduction of contingent consideration represents the reduction of payment to Third Wave Infrasys Sdn Bhd former shareholders following the latest unaudited profit reported was below the profit guarantee.
The impairment of tangible assets reversal was due to revisions to the lease rental payments and securing new tenants. See note 14 for more information.
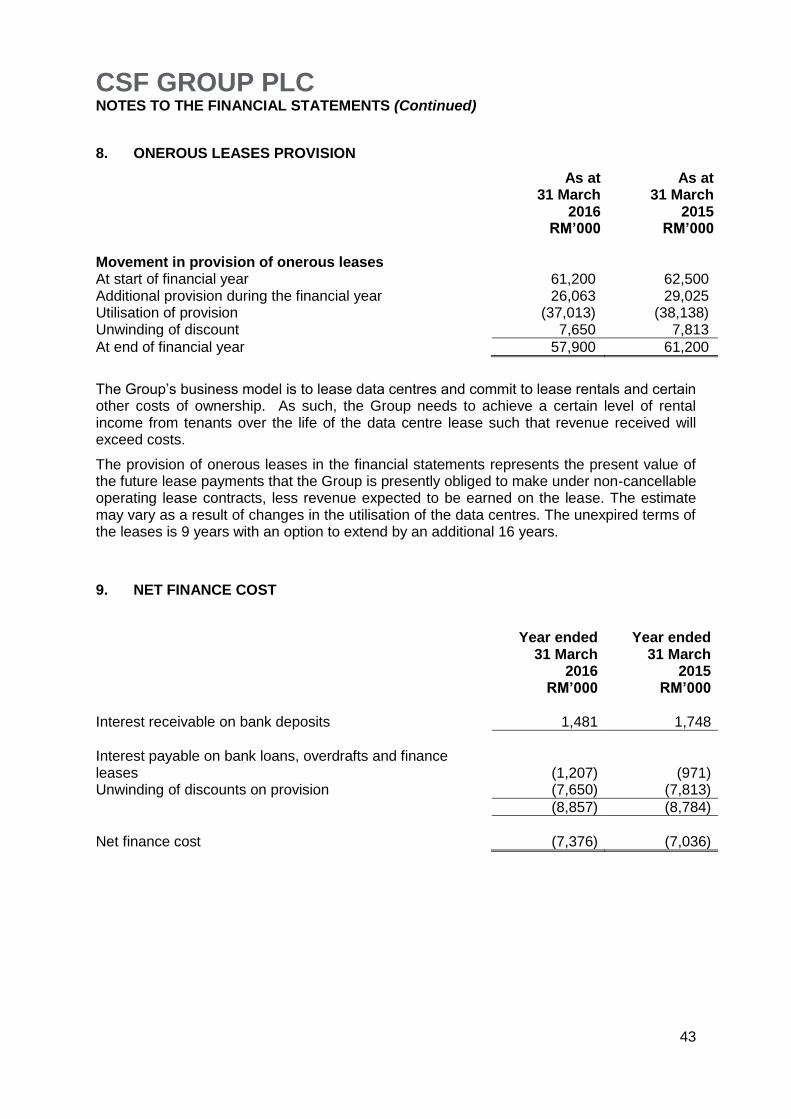
CSF GROUP PLC NOTES TO THE FINANCIAL STATEMENTS (Continued)
43
8. ONEROUS LEASES PROVISION
As at 31 March
2016 RM’000
As at 31 March
2015 RM’000
Movement in provision of onerous leases At start of financial year 61,200 62,500 Additional provision during the financial year 26,063 29,025 Utilisation of provision (37,013) (38,138) Unwinding of discount 7,650 7,813
At end of financial year 57,900 61,200
The Group‟s business model is to lease data centres and commit to lease rentals and certain other costs of ownership. As such, the Group needs to achieve a certain level of rental income from tenants over the life of the data centre lease such that revenue received will exceed costs.
The provision of onerous leases in the financial statements represents the present value of the future lease payments that the Group is presently obliged to make under non-cancellable operating lease contracts, less revenue expected to be earned on the lease. The estimate may vary as a result of changes in the utilisation of the data centres. The unexpired terms of the leases is 9 years with an option to extend by an additional 16 years.
9. NET FINANCE COST
Year ended 31 March
2016 RM’000
Year ended 31 March
2015 RM’000
Interest receivable on bank deposits 1,481 1,748
Interest payable on bank loans, overdrafts and finance leases (1,207) (971) Unwinding of discounts on provision (7,650) (7,813)
(8,857) (8,784)
Net finance cost (7,376) (7,036)
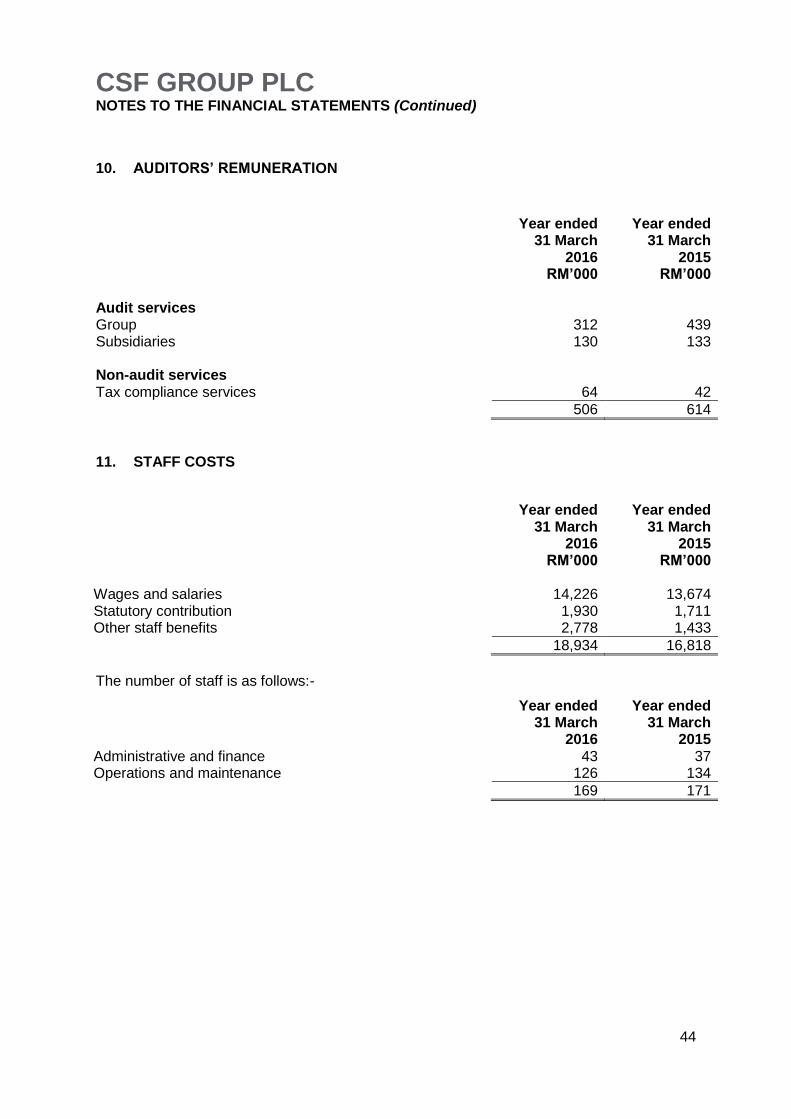
CSF GROUP PLC NOTES TO THE FINANCIAL STATEMENTS (Continued)
44
10. AUDITORS’ REMUNERATION
Year ended 31 March
2016 RM’000
Year ended 31 March
2015 RM’000
Audit services Group 312 439 Subsidiaries 130 133 Non-audit services Tax compliance services 64 42
506 614
11. STAFF COSTS
Year ended 31 March
2016 RM’000
Year ended 31 March
2015 RM’000
Wages and salaries 14,226 13,674 Statutory contribution 1,930 1,711 Other staff benefits 2,778 1,433
18,934 16,818
The number of staff is as follows:-
Year ended 31 March
2016
Year ended 31 March
2015 Administrative and finance 43 37 Operations and maintenance 126 134
169 171
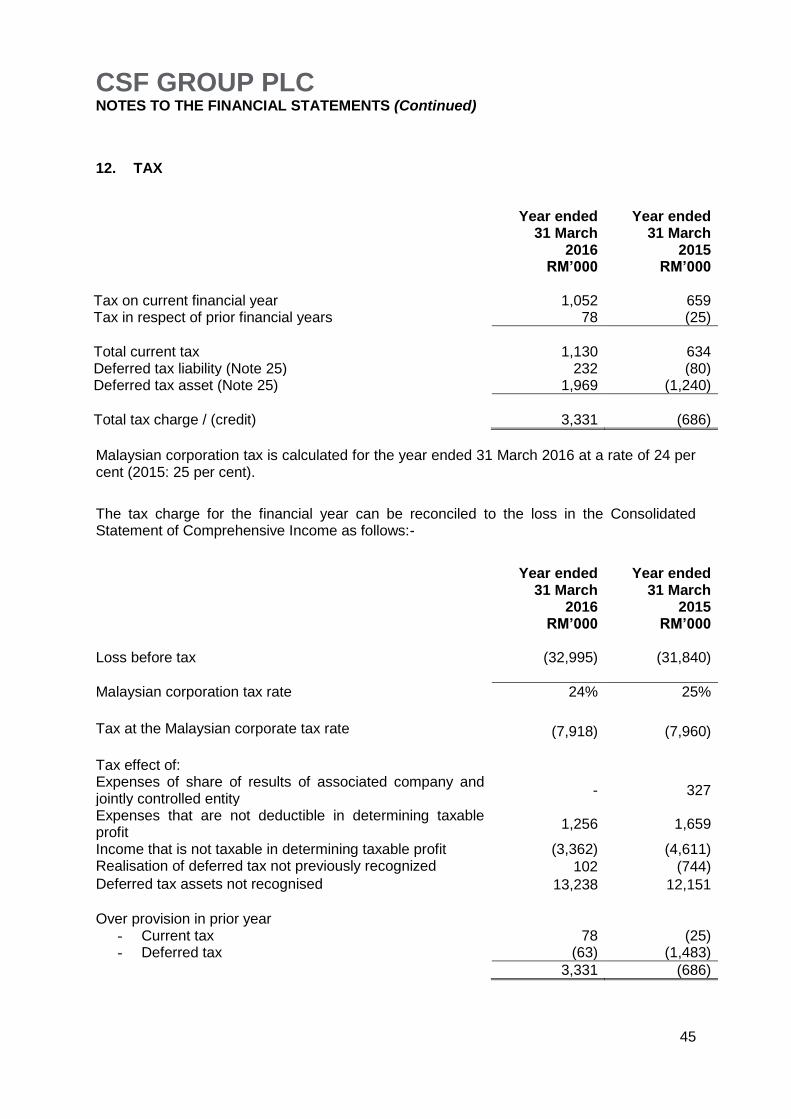
CSF GROUP PLC NOTES TO THE FINANCIAL STATEMENTS (Continued)
45
12. TAX
Year ended 31 March
2016 RM’000
Year ended 31 March
2015 RM’000
Tax on current financial year 1,052 659 Tax in respect of prior financial years 78 (25)
Total current tax 1,130 634 Deferred tax liability (Note 25) 232 (80) Deferred tax asset (Note 25) 1,969 (1,240)
Total tax charge / (credit) 3,331 (686)
Malaysian corporation tax is calculated for the year ended 31 March 2016 at a rate of 24 per cent (2015: 25 per cent).
The tax charge for the financial year can be reconciled to the loss in the Consolidated Statement of Comprehensive Income as follows:-
Year ended 31 March
2016 RM’000
Year ended 31 March
2015 RM’000
Loss before tax (32,995) (31,840)
Malaysian corporation tax rate 24% 25% Tax at the Malaysian corporate tax rate (7,918) (7,960) Tax effect of: Expenses of share of results of associated company and jointly controlled entity
- 327
Expenses that are not deductible in determining taxable profit
1,256 1,659
Income that is not taxable in determining taxable profit (3,362) (4,611) Realisation of deferred tax not previously recognized 102 (744)
Deferred tax assets not recognised 13,238 12,151
Over provision in prior year
- Current tax - Deferred tax
78 (63)
(25) (1,483)
3,331 (686)

CSF GROUP PLC NOTES TO THE FINANCIAL STATEMENTS (Continued)
46
13. EARNINGS PER SHARE
The calculations for earnings per share, based on the weighted average number of shares, are shown in the table below.
Year ended 31 March
2016
Year ended 31 March
2015
Net loss for the financial year after taxation attributable to members (RM‟000) (36,326) (31,154)
Weighted average number of ordinary shares for basic earnings per share („000) 160,029 160,029
Weighted average number of ordinary shares for diluted earnings per share („000) 160,029 160,029
The number of ordinary shares for diluted earnings per share is the weighted average number of ordinary shares of CSF Group plc that would have been in issue. The calculation of the diluted earnings per share does not assume conversion, exercise or other issue of potential ordinary shares that would increase the net profit or decrease the net loss per share. As the Group is currently in a loss making position the inclusion of potential ordinary shares associated with share options in the diluted loss per share calculation would serve to decrease the net loss per share. On that basis, no adjustment has been made for diluted loss per share.
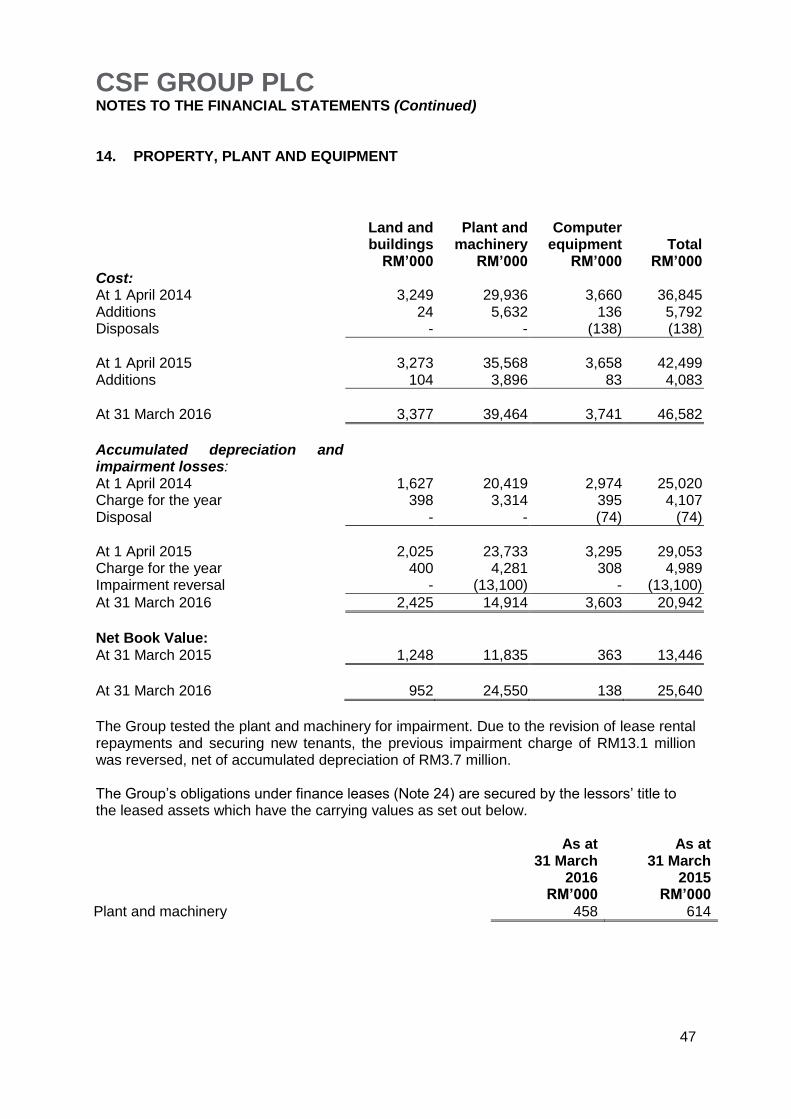
CSF GROUP PLC NOTES TO THE FINANCIAL STATEMENTS (Continued)
47
14. PROPERTY, PLANT AND EQUIPMENT
Land and buildings
RM’000
Plant and machinery
RM’000
Computer equipment
RM’000 Total
RM’000 Cost: At 1 April 2014 3,249 29,936 3,660 36,845 Additions 24 5,632 136 5,792 Disposals - - (138) (138)
At 1 April 2015 3,273 35,568 3,658 42,499 Additions 104 3,896 83 4,083
At 31 March 2016 3,377 39,464 3,741 46,582
Accumulated depreciation and impairment losses:
At 1 April 2014 1,627 20,419 2,974 25,020 Charge for the year 398 3,314 395 4,107 Disposal - - (74) (74)
At 1 April 2015 2,025 23,733 3,295 29,053 Charge for the year 400 4,281 308 4,989 Impairment reversal - (13,100) - (13,100)
At 31 March 2016 2,425 14,914 3,603 20,942
Net Book Value: At 31 March 2015 1,248 11,835 363 13,446
At 31 March 2016 952 24,550 138 25,640
The Group tested the plant and machinery for impairment. Due to the revision of lease rental repayments and securing new tenants, the previous impairment charge of RM13.1 million was reversed, net of accumulated depreciation of RM3.7 million. The Group‟s obligations under finance leases (Note 24) are secured by the lessors‟ title to the leased assets which have the carrying values as set out below.
As at
31 March 2016
RM’000
As at 31 March
2015 RM’000
Plant and machinery 458 614

CSF GROUP PLC NOTES TO THE FINANCIAL STATEMENTS (Continued)
48
15. INTEREST IN ASSOCIATE
As at 31 March
2016 RM’000
As at 31 March
2015 RM’000
Investment, at cost 685 685 Group share of post acquisition loss (685) (685)
- -
Details of the Group‟s associate are as follows:
Name Principal activity Place of incorporation
Proportion of ownership interest
2016 2015
Hanel CSF Co. Ltd. Construction of owned data centres and subsequent rental on a tenancy basis
Vietnam 20% 20%
Summarised financial information of the Group‟s associate is set out below.
As at 31 March
2016 RM’000
As at 31 March
2015 RM’000
Total assets 1,274 1,692 Total liabilities (4,830) (4,121)
Net liabilities (3,556) (2,429) Group‟s share of net assets of associate - - Total revenue 293 386 Total loss for the year (559) (878) Group‟s share of loss of associate - -
On 31 May 2016, the board of Hanel-CSF commenced a process to liquidate the company.

CSF GROUP PLC NOTES TO THE FINANCIAL STATEMENTS (Continued)
49
16. OTHER INVESTMENTS
The Group‟s investments comprise:
As at 31 March
2016 RM’000
As at 31 March
2015 RM’000
Investment in listed entities 12 10 Other investments 143 143
155 153
As at 31 March
2016 RM’000
As at 31 March
2015 RM’000
Brought forward at start of financial year 153 172 Transfer to income statement 2 (19)
Carried forward at end of financial year 155 153
The investments in listed businesses are listed on the Malaysian Stock Exchange. The other investments comprise of investments in businesses incorporated in Vietnam and Thailand. The Group owns 20% (2015: 20%) of a business incorporated in Vietnam which designs, constructs and installs data centres. The Group does not have any influence over the operation or financial decisions of the business. 17. GOODWILL
As at 31 March
2016 RM’000
As at 31 March
2015 RM’000
Cost At start and end of financial year 3,750 3,750
Impairment of goodwill At start and end of financial year (3,750) (3,750)
Carrying value - -
The goodwill related to acquisition of Third Wave Infrasys Sdn Bhd. The Group has fully impaired the balance of goodwill in 2015 after considering the future profit forecast of the entity that held the goodwill.
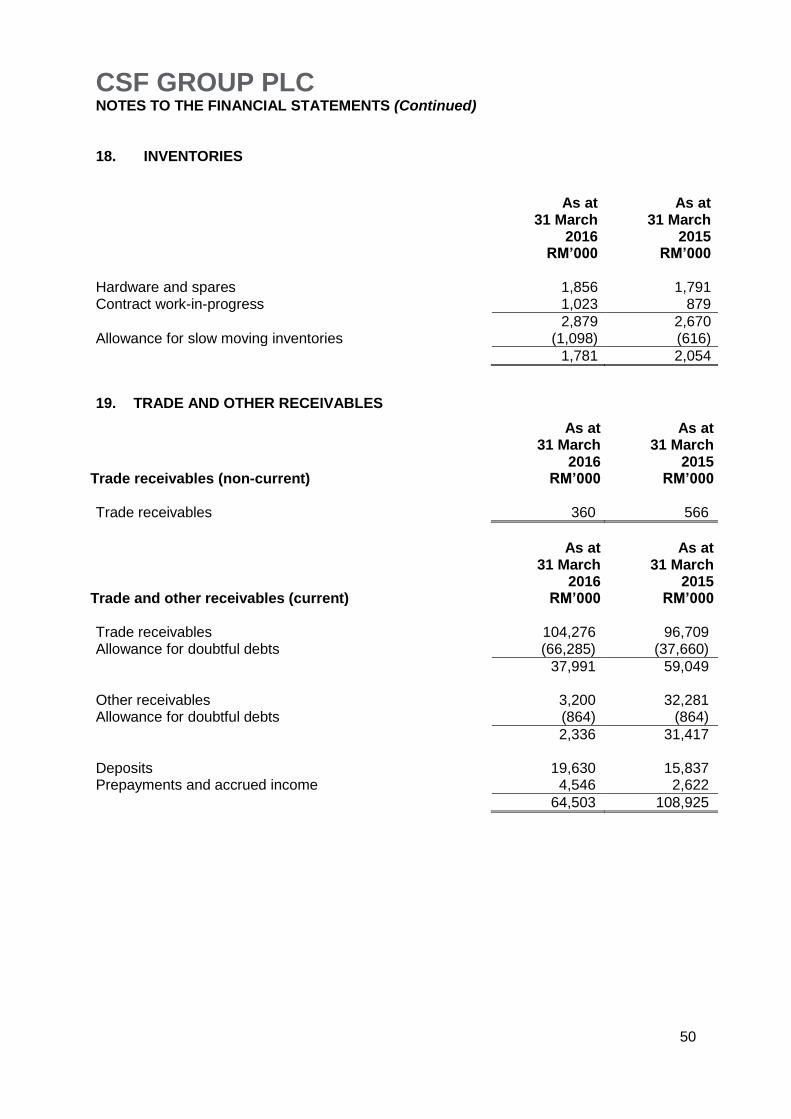
CSF GROUP PLC NOTES TO THE FINANCIAL STATEMENTS (Continued)
50
18. INVENTORIES
As at 31 March
2016 RM’000
As at 31 March
2015 RM’000
Hardware and spares 1,856 1,791 Contract work-in-progress 1,023 879
2,879 2,670 Allowance for slow moving inventories (1,098) (616)
1,781 2,054
19. TRADE AND OTHER RECEIVABLES
Trade receivables (non-current)
As at 31 March
2016 RM’000
As at 31 March
2015 RM’000
Trade receivables 360 566
Trade and other receivables (current)
As at 31 March
2016 RM’000
As at 31 March
2015 RM’000
Trade receivables 104,276 96,709 Allowance for doubtful debts (66,285) (37,660)
37,991 59,049 Other receivables 3,200 32,281 Allowance for doubtful debts (864) (864)
2,336 31,417 Deposits 19,630 15,837 Prepayments and accrued income 4,546 2,622
64,503 108,925
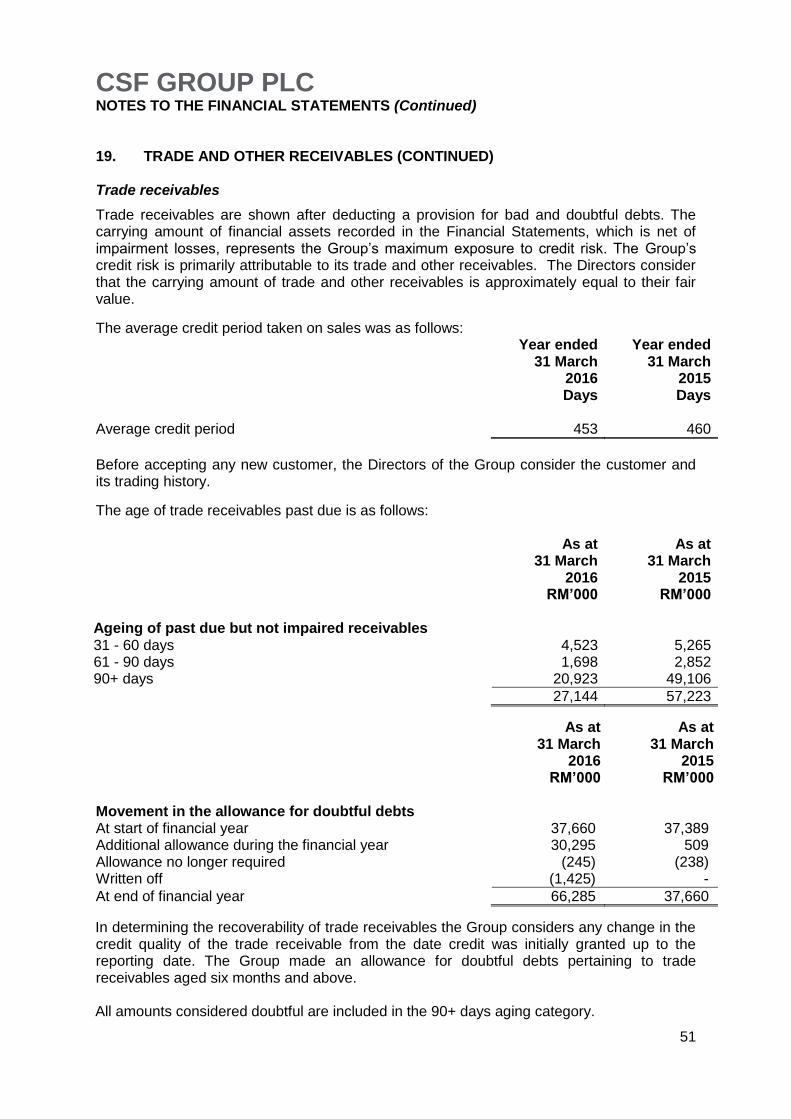
CSF GROUP PLC NOTES TO THE FINANCIAL STATEMENTS (Continued)
51
19. TRADE AND OTHER RECEIVABLES (CONTINUED) Trade receivables
Trade receivables are shown after deducting a provision for bad and doubtful debts. The carrying amount of financial assets recorded in the Financial Statements, which is net of impairment losses, represents the Group‟s maximum exposure to credit risk. The Group‟s credit risk is primarily attributable to its trade and other receivables. The Directors consider that the carrying amount of trade and other receivables is approximately equal to their fair value.
The average credit period taken on sales was as follows:
Year ended 31 March
2016 Days
Year ended 31 March
2015 Days
Average credit period 453 460
Before accepting any new customer, the Directors of the Group consider the customer and its trading history.
The age of trade receivables past due is as follows:
As at 31 March
2016 RM’000
As at 31 March
2015 RM’000
Ageing of past due but not impaired receivables 31 - 60 days 4,523 5,265 61 - 90 days 1,698 2,852 90+ days 20,923 49,106
27,144 57,223
As at 31 March
2016 RM’000
As at 31 March
2015 RM’000
Movement in the allowance for doubtful debts At start of financial year 37,660 37,389 Additional allowance during the financial year 30,295 509 Allowance no longer required (245) (238) Written off (1,425) -
At end of financial year 66,285 37,660
In determining the recoverability of trade receivables the Group considers any change in the credit quality of the trade receivable from the date credit was initially granted up to the reporting date. The Group made an allowance for doubtful debts pertaining to trade receivables aged six months and above. All amounts considered doubtful are included in the 90+ days aging category.
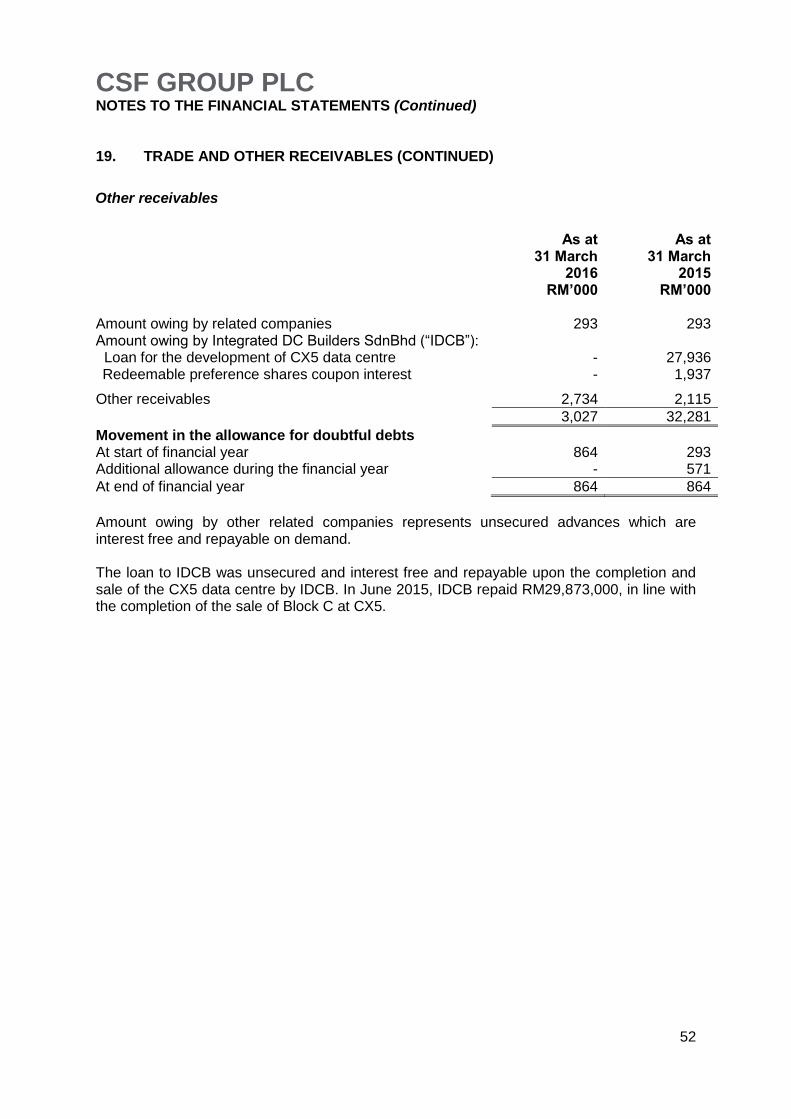
CSF GROUP PLC NOTES TO THE FINANCIAL STATEMENTS (Continued)
52
19. TRADE AND OTHER RECEIVABLES (CONTINUED)
Other receivables
As at 31 March
2016 RM’000
As at 31 March
2015 RM’000
Amount owing by related companies 293 293 Amount owing by Integrated DC Builders SdnBhd (“IDCB”): Loan for the development of CX5 data centre Redeemable preference shares coupon interest
- -
27,936 1,937
Other receivables 2,734 2,115
3,027 32,281
Movement in the allowance for doubtful debts At start of financial year 864 293 Additional allowance during the financial year - 571
At end of financial year 864 864
Amount owing by other related companies represents unsecured advances which are interest free and repayable on demand. The loan to IDCB was unsecured and interest free and repayable upon the completion and sale of the CX5 data centre by IDCB. In June 2015, IDCB repaid RM29,873,000, in line with the completion of the sale of Block C at CX5.
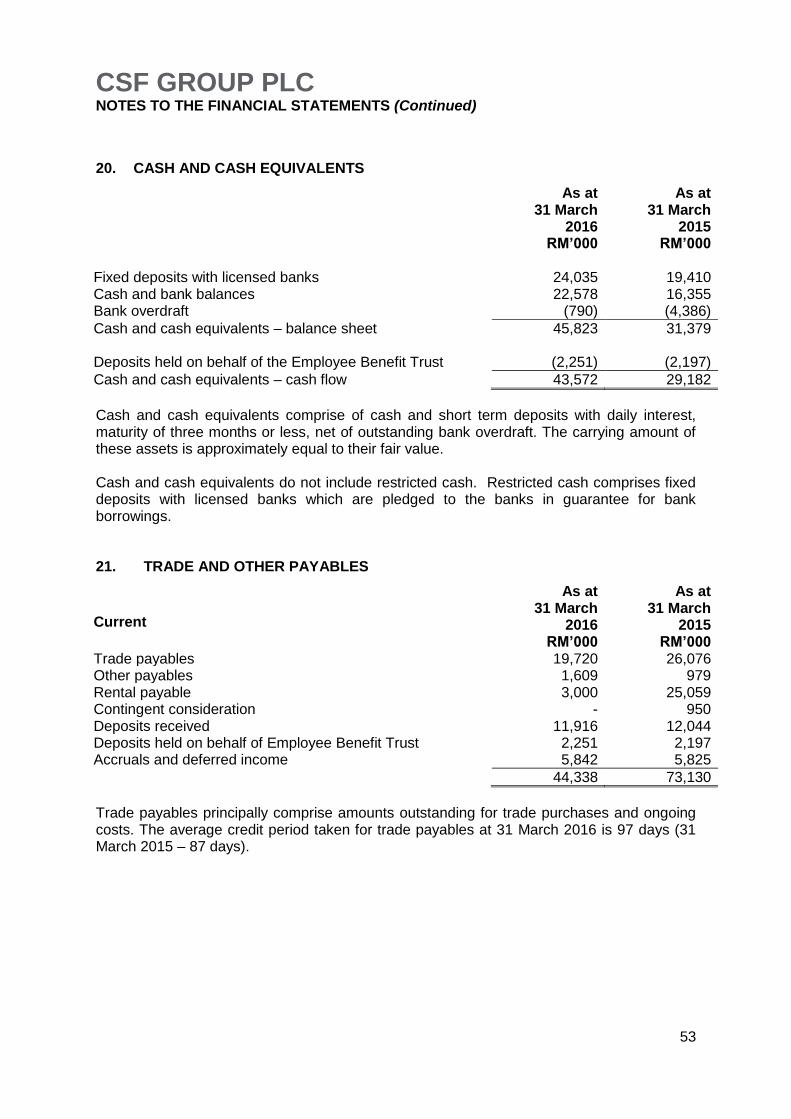
CSF GROUP PLC NOTES TO THE FINANCIAL STATEMENTS (Continued)
53
20. CASH AND CASH EQUIVALENTS
As at 31 March
2016 RM’000
As at 31 March
2015 RM’000
Fixed deposits with licensed banks 24,035 19,410 Cash and bank balances 22,578 16,355 Bank overdraft (790) (4,386)
Cash and cash equivalents – balance sheet 45,823 31,379 Deposits held on behalf of the Employee Benefit Trust (2,251) (2,197)
Cash and cash equivalents – cash flow 43,572 29,182
Cash and cash equivalents comprise of cash and short term deposits with daily interest, maturity of three months or less, net of outstanding bank overdraft. The carrying amount of these assets is approximately equal to their fair value. Cash and cash equivalents do not include restricted cash. Restricted cash comprises fixed deposits with licensed banks which are pledged to the banks in guarantee for bank borrowings. 21. TRADE AND OTHER PAYABLES
Current
As at 31 March
2016 RM’000
As at 31 March
2015 RM’000
Trade payables 19,720 26,076 Other payables 1,609 979 Rental payable 3,000 25,059 Contingent consideration - 950 Deposits received 11,916 12,044 Deposits held on behalf of Employee Benefit Trust 2,251 2,197 Accruals and deferred income 5,842 5,825
44,338 73,130
Trade payables principally comprise amounts outstanding for trade purchases and ongoing costs. The average credit period taken for trade payables at 31 March 2016 is 97 days (31 March 2015 – 87 days).
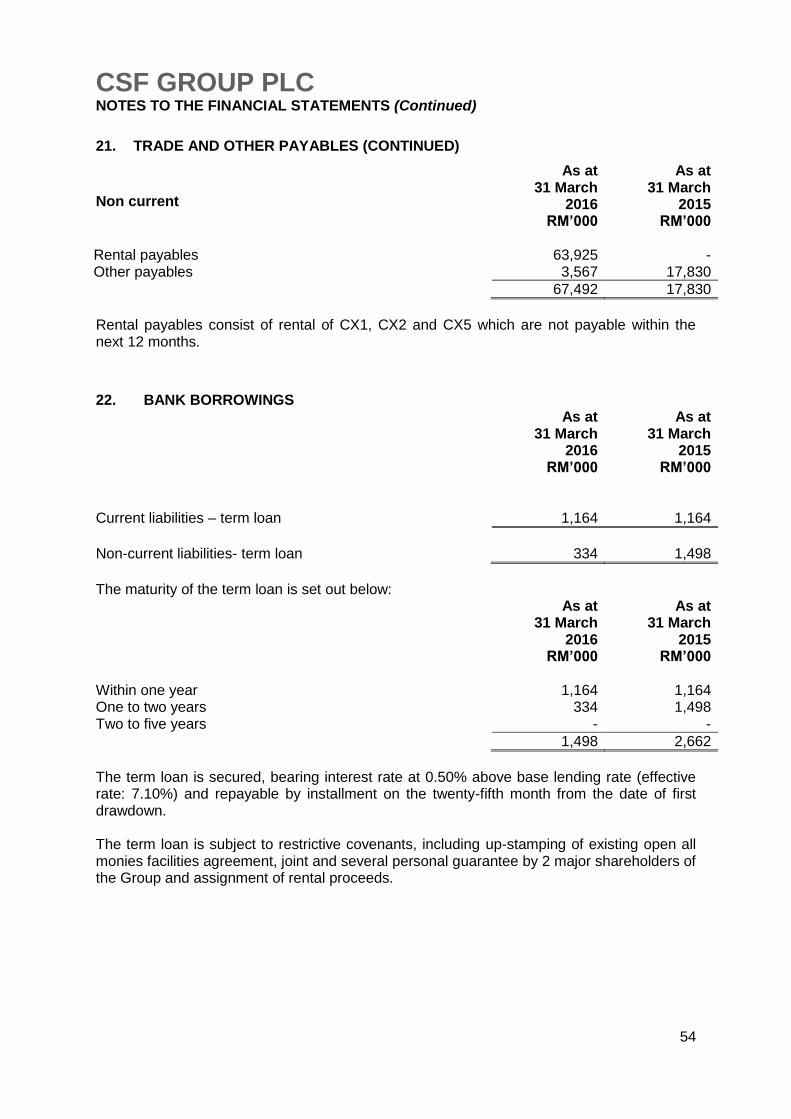
CSF GROUP PLC NOTES TO THE FINANCIAL STATEMENTS (Continued)
54
21. TRADE AND OTHER PAYABLES (CONTINUED)
Non current
As at 31 March
2016 RM’000
As at 31 March
2015 RM’000
Rental payables 63,925 - Other payables 3,567 17,830
67,492 17,830
Rental payables consist of rental of CX1, CX2 and CX5 which are not payable within the next 12 months.
22. BANK BORROWINGS
As at 31 March
2016 RM’000
As at 31 March
2015 RM’000
Current liabilities – term loan 1,164 1,164
Non-current liabilities- term loan 334 1,498
The maturity of the term loan is set out below:
As at 31 March
2016 RM’000
As at 31 March
2015 RM’000
Within one year 1,164 1,164 One to two years 334 1,498 Two to five years - -
1,498 2,662
The term loan is secured, bearing interest rate at 0.50% above base lending rate (effective rate: 7.10%) and repayable by installment on the twenty-fifth month from the date of first drawdown. The term loan is subject to restrictive covenants, including up-stamping of existing open all monies facilities agreement, joint and several personal guarantee by 2 major shareholders of the Group and assignment of rental proceeds.
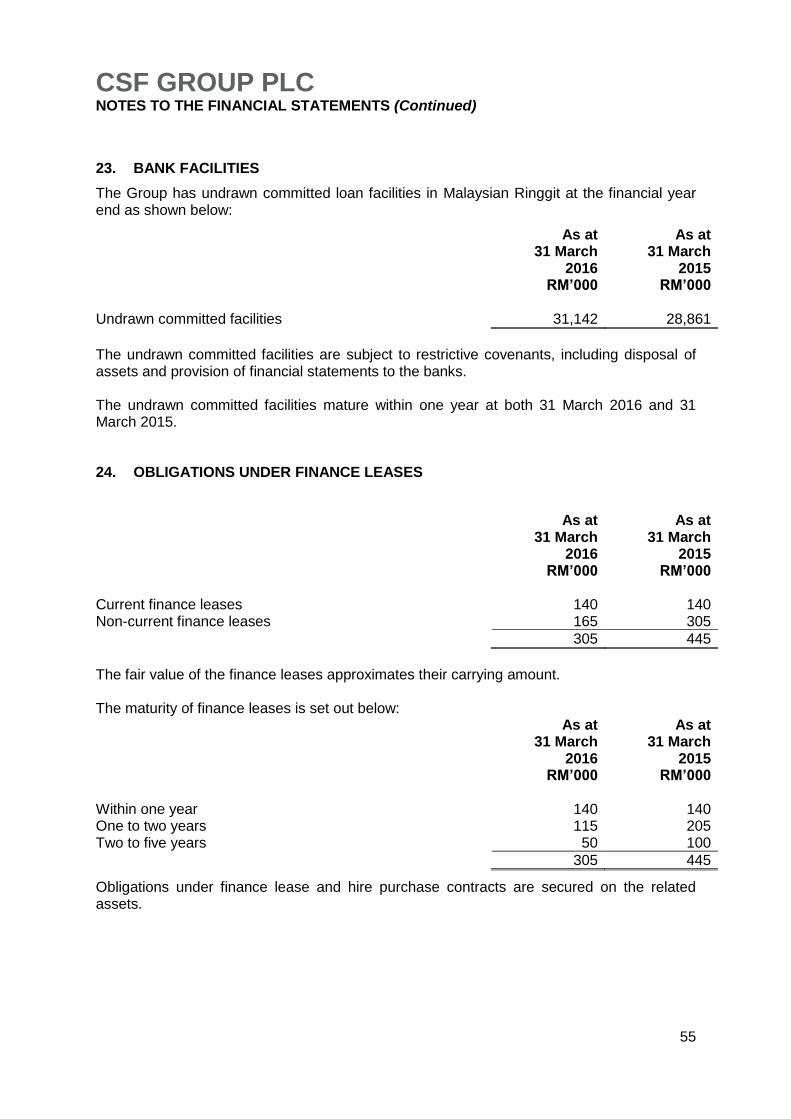
CSF GROUP PLC NOTES TO THE FINANCIAL STATEMENTS (Continued)
55
23. BANK FACILITIES
The Group has undrawn committed loan facilities in Malaysian Ringgit at the financial year end as shown below:
As at 31 March
2016 RM’000
As at 31 March
2015 RM’000
Undrawn committed facilities 31,142 28,861
The undrawn committed facilities are subject to restrictive covenants, including disposal of assets and provision of financial statements to the banks. The undrawn committed facilities mature within one year at both 31 March 2016 and 31 March 2015. 24. OBLIGATIONS UNDER FINANCE LEASES
As at 31 March
2016 RM’000
As at 31 March
2015 RM’000
Current finance leases 140 140 Non-current finance leases 165 305
305 445
The fair value of the finance leases approximates their carrying amount. The maturity of finance leases is set out below:
As at 31 March
2016 RM’000
As at 31 March
2015 RM’000
Within one year 140 140 One to two years 115 205 Two to five years 50 100
305 445
Obligations under finance lease and hire purchase contracts are secured on the related assets.

CSF GROUP PLC NOTES TO THE FINANCIAL STATEMENTS (Continued)
56
24. OBLIGATIONS UNDER FINANCE LEASES (CONTINUED)
As at 31 March
2016 RM’ 000
As at 31 March
2015 RM’ 000
Minimum lease payments Amounts payable under finance leases: Within one year 140 140 In the second to fifth years inclusive 224 396
364 536 Less: future finance charges (59) (91)
Present value of lease obligations 305 445
Present value of lease payments Amounts payable under finance leases: Within one year 140 140 In the second to fifth years inclusive 224 396
364 536 Less: future finance charges (59) (91)
Present value of lease obligations 305 445 Less: amount due for settlement within 12 months (shown under current liabilities) (140) (140)
Amount due for settlement after 12 months 165 305
25. DEFERRED TAX
The following are the major deferred tax assets and liabilities recognised by the Group and movements thereon during the periods shown:
(Liability) Capital
allowances and other
timing differences
RM’000
(Asset) Investment
tax allowance
RM’000
As at 1 April 2014 (80) 729 Charge to income 80 1,240
As at 31 March 2015 - 1,969 Credit to income (232) (1,969)
As at 31 March 2016 (232) -
The deferred tax assets of approximately RM53,781,000 (2015: RM28,355,000) of certain subsidiaries have not been recognised in respect of current financial year as it is not probable that taxable profit of the subsidiaries will be available against which the temporary differences, unused tax losses and unused tax credit can be utilised.

CSF GROUP PLC NOTES TO THE FINANCIAL STATEMENTS (Continued)
57
26. EQUITY AND RESERVES
As at 31 March
2016 RM’000
As at 31 March
2015 RM’000
Share capital Authorised: 1billion ordinary shares of £0.10 each (2015: 1 billion shares of £0.10 each) 5,433,600 5,433,600
Issued and fully paid: 160 million shares of £0.10 each (2015: 160 million shares of £0.10 each) 78,936 78,936
The Company has one class of ordinary shares which carry no right to fixed income.
Share premium account
As at 31 March
2016 RM’000
As at 31 March
2015 RM’000
At start and end of financial year 104,499 104,499
Shares held under Employee Benefit Trust At start and end of financial year (2,300) (2,300)
As at 31 March
2016 RM’000
As at 31 March
2015 RM’000
Other reserve At start and end of financial year (66,153) (66,153)
As at 31 March
2016 RM’000
As at 31 March
2015 RM’000
Share option reserve At start of financial year 4,117 4,117 Expiry of share option (4,117) -
At end of financial year - 4,117

CSF GROUP PLC NOTES TO THE FINANCIAL STATEMENTS (Continued)
58
26. EQUITY AND RESERVES (CONTINUED)
The share option reserve relates to share options granted to employees under the Company‟s Employee Share Option Plan. The share option expired during current year and transfer to retained earning. Further information about the share-based payments to employees is set out in Note 30.
As at 31 March
2016 RM’000
As at 31 March
2015 RM’000
Accumulated loss At start of financial year (102,134) (70.980) Expiry of share option 4,117 - Loss for the financial year (36,326) (31,154)
At end of financial year (134,343) (102,134)
As at 31 March
2016 RM’000
As at 31 March
2015 RM’000
Translation reserve At start of financial year (403) (221) Transactions for the financial year (363) (182)
At end of financial year (766) (403)
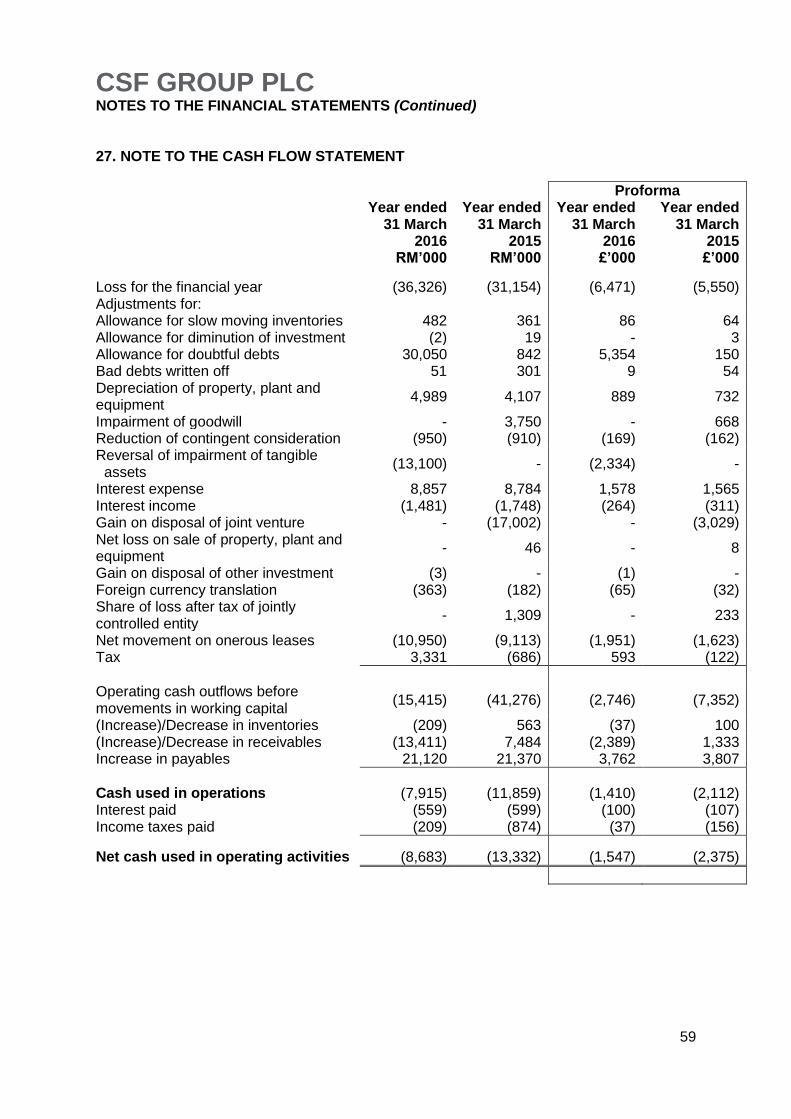
CSF GROUP PLC NOTES TO THE FINANCIAL STATEMENTS (Continued)
59
27. NOTE TO THE CASH FLOW STATEMENT
Proforma Year ended
31 March 2016
RM’000
Year ended 31 March
2015 RM’000
Year ended 31 March
2016 £’000
Year ended 31 March
2015 £’000
Loss for the financial year (36,326) (31,154) (6,471) (5,550) Adjustments for: Allowance for slow moving inventories 482 361 86 64 Allowance for diminution of investment (2) 19 - 3 Allowance for doubtful debts 30,050 842 5,354 150 Bad debts written off 51 301 9 54 Depreciation of property, plant and equipment
4,989 4,107 889 732
Impairment of goodwill - 3,750 - 668 Reduction of contingent consideration (950) (910) (169) (162) Reversal of impairment of tangible assets
(13,100) - (2,334) -
Interest expense 8,857 8,784 1,578 1,565 Interest income (1,481) (1,748) (264) (311) Gain on disposal of joint venture - (17,002) - (3,029) Net loss on sale of property, plant and equipment
- 46 - 8
Gain on disposal of other investment (3) - (1) - Foreign currency translation (363) (182) (65) (32) Share of loss after tax of jointly controlled entity
- 1,309 - 233
Net movement on onerous leases (10,950) (9,113) (1,951) (1,623) Tax 3,331 (686) 593 (122)
Operating cash outflows before movements in working capital
(15,415) (41,276) (2,746) (7,352)
(Increase)/Decrease in inventories (209) 563 (37) 100 (Increase)/Decrease in receivables (13,411) 7,484 (2,389) 1,333 Increase in payables 21,120 21,370 3,762 3,807
Cash used in operations (7,915) (11,859) (1,410) (2,112) Interest paid (559) (599) (100) (107) Income taxes paid (209) (874) (37) (156)
Net cash used in operating activities (8,683) (13,332) (1,547) (2,375)
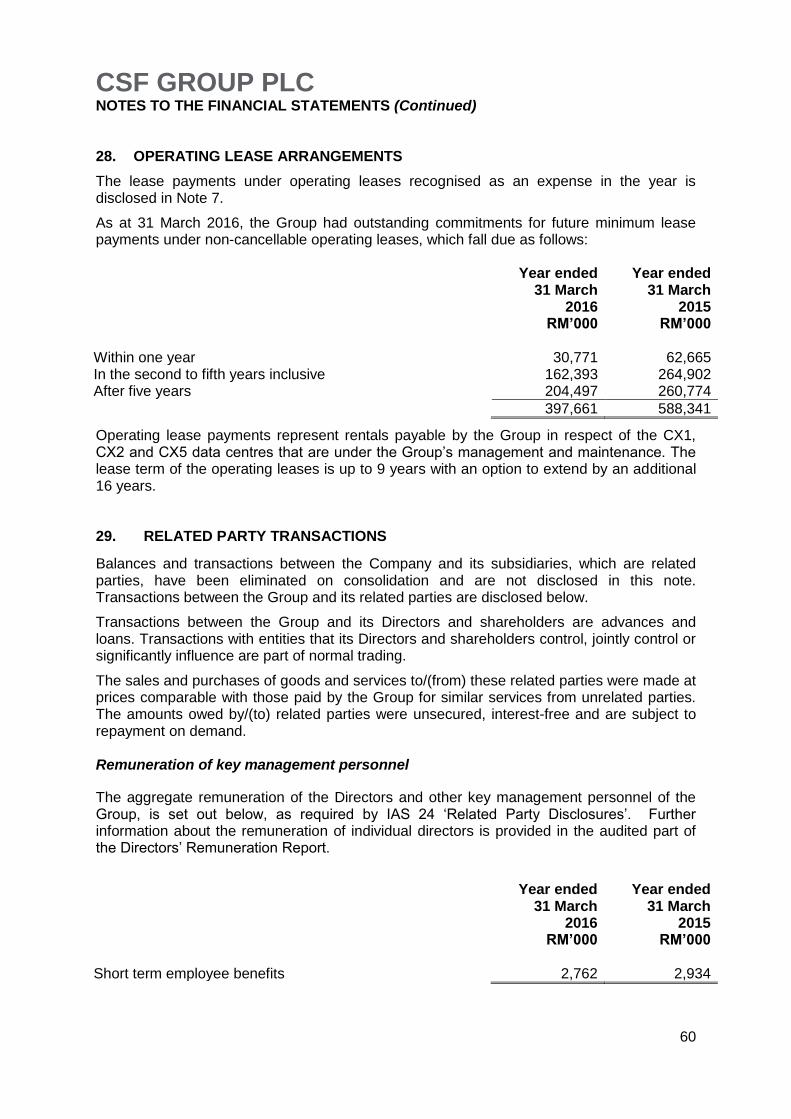
CSF GROUP PLC NOTES TO THE FINANCIAL STATEMENTS (Continued)
60
28. OPERATING LEASE ARRANGEMENTS
The lease payments under operating leases recognised as an expense in the year is disclosed in Note 7.
As at 31 March 2016, the Group had outstanding commitments for future minimum lease payments under non-cancellable operating leases, which fall due as follows:
Year ended 31 March
2016 RM’000
Year ended 31 March
2015 RM’000
Within one year 30,771 62,665 In the second to fifth years inclusive 162,393 264,902 After five years 204,497 260,774
397,661 588,341
Operating lease payments represent rentals payable by the Group in respect of the CX1, CX2 and CX5 data centres that are under the Group‟s management and maintenance. The lease term of the operating leases is up to 9 years with an option to extend by an additional 16 years. 29. RELATED PARTY TRANSACTIONS
Balances and transactions between the Company and its subsidiaries, which are related parties, have been eliminated on consolidation and are not disclosed in this note. Transactions between the Group and its related parties are disclosed below.
Transactions between the Group and its Directors and shareholders are advances and loans. Transactions with entities that its Directors and shareholders control, jointly control or significantly influence are part of normal trading.
The sales and purchases of goods and services to/(from) these related parties were made at prices comparable with those paid by the Group for similar services from unrelated parties. The amounts owed by/(to) related parties were unsecured, interest-free and are subject to repayment on demand. Remuneration of key management personnel
The aggregate remuneration of the Directors and other key management personnel of the Group, is set out below, as required by IAS 24 „Related Party Disclosures‟. Further information about the remuneration of individual directors is provided in the audited part of the Directors‟ Remuneration Report.
Year ended
31 March 2016
RM’000
Year ended 31 March
2015 RM’000
Short term employee benefits 2,762 2,934
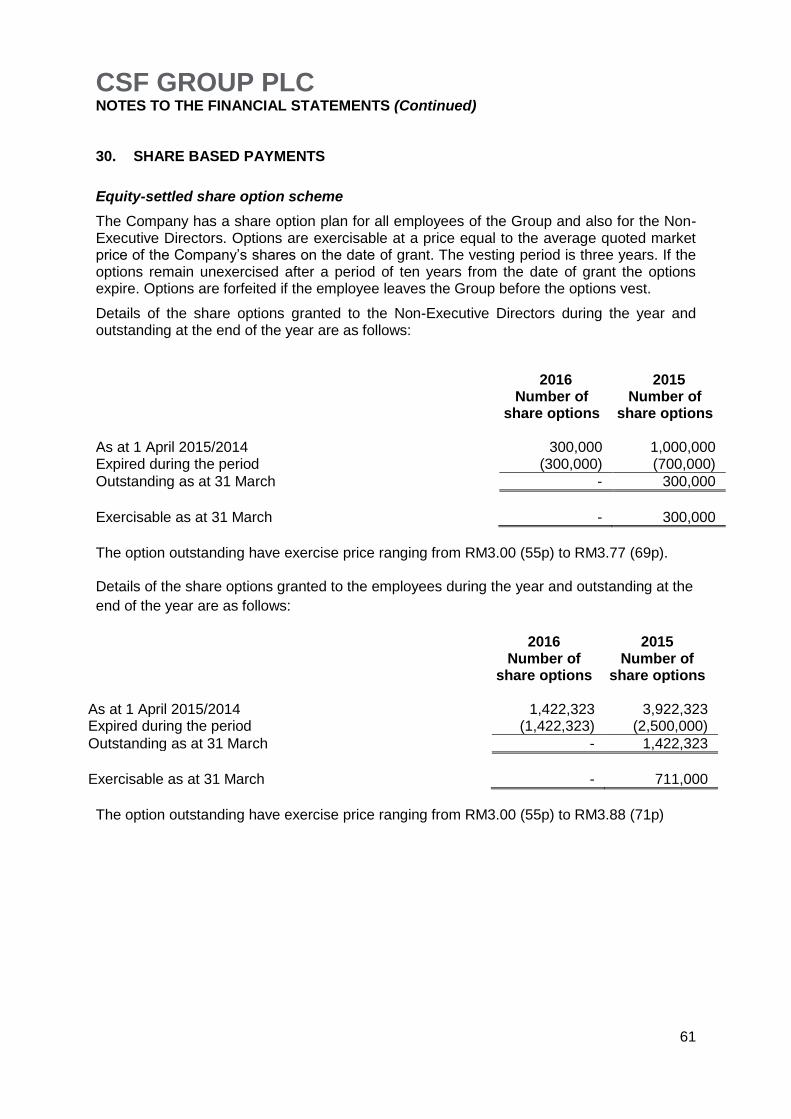
CSF GROUP PLC NOTES TO THE FINANCIAL STATEMENTS (Continued)
61
30. SHARE BASED PAYMENTS
Equity-settled share option scheme
The Company has a share option plan for all employees of the Group and also for the Non-Executive Directors. Options are exercisable at a price equal to the average quoted market price of the Company‟s shares on the date of grant. The vesting period is three years. If the options remain unexercised after a period of ten years from the date of grant the options expire. Options are forfeited if the employee leaves the Group before the options vest.
Details of the share options granted to the Non-Executive Directors during the year and outstanding at the end of the year are as follows:
2016 2015 Number of
share options Number of
share options As at 1 April 2015/2014 300,000 1,000,000 Expired during the period (300,000) (700,000)
Outstanding as at 31 March - 300,000
Exercisable as at 31 March - 300,000
The option outstanding have exercise price ranging from RM3.00 (55p) to RM3.77 (69p). Details of the share options granted to the employees during the year and outstanding at the
end of the year are as follows:
2016 2015
Number of
share options Number of
share options As at 1 April 2015/2014 1,422,323 3,922,323 Expired during the period (1,422,323) (2,500,000)
Outstanding as at 31 March - 1,422,323
Exercisable as at 31 March - 711,000
The option outstanding have exercise price ranging from RM3.00 (55p) to RM3.88 (71p)
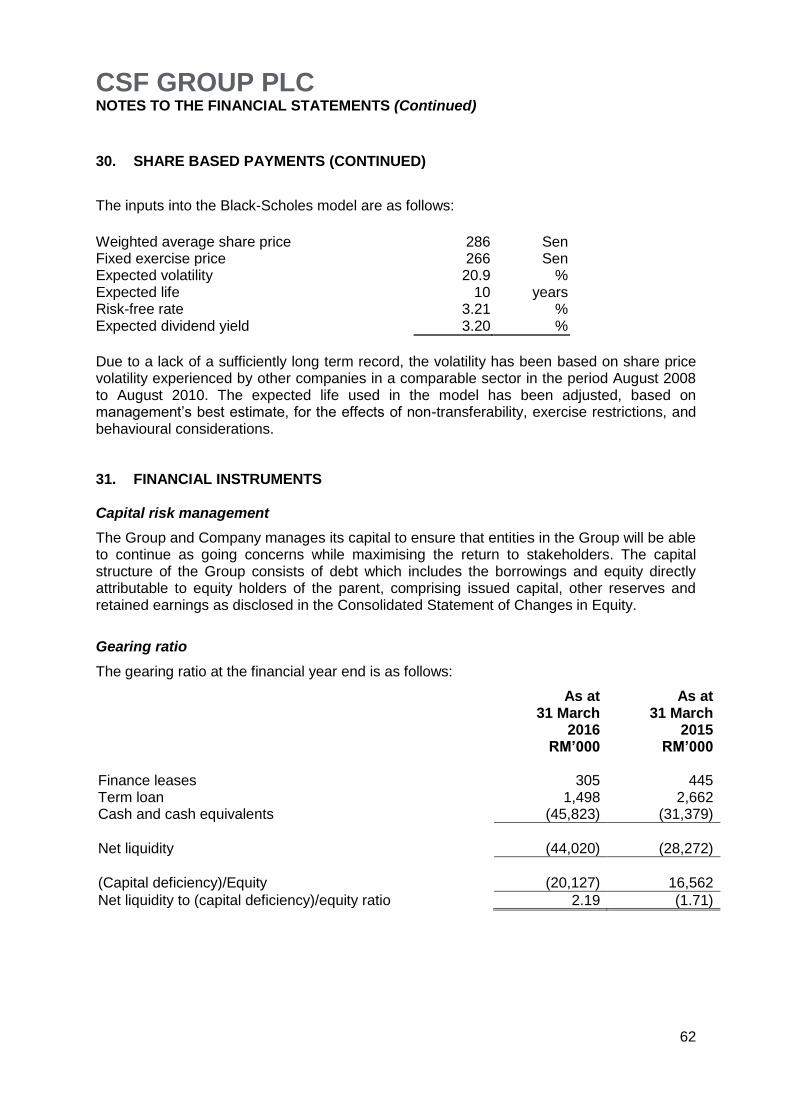
CSF GROUP PLC NOTES TO THE FINANCIAL STATEMENTS (Continued)
62
30. SHARE BASED PAYMENTS (CONTINUED)
The inputs into the Black-Scholes model are as follows:
Weighted average share price 286 Sen Fixed exercise price 266 Sen Expected volatility 20.9 % Expected life 10 years Risk-free rate 3.21 % Expected dividend yield 3.20 %
Due to a lack of a sufficiently long term record, the volatility has been based on share price volatility experienced by other companies in a comparable sector in the period August 2008 to August 2010. The expected life used in the model has been adjusted, based on management‟s best estimate, for the effects of non-transferability, exercise restrictions, and behavioural considerations. 31. FINANCIAL INSTRUMENTS Capital risk management
The Group and Company manages its capital to ensure that entities in the Group will be able to continue as going concerns while maximising the return to stakeholders. The capital structure of the Group consists of debt which includes the borrowings and equity directly attributable to equity holders of the parent, comprising issued capital, other reserves and retained earnings as disclosed in the Consolidated Statement of Changes in Equity.
Gearing ratio
The gearing ratio at the financial year end is as follows:
As at 31 March
2016 RM’000
As at 31 March
2015 RM’000
Finance leases 305 445 Term loan 1,498 2,662 Cash and cash equivalents (45,823) (31,379)
Net liquidity (44,020) (28,272)
(Capital deficiency)/Equity (20,127) 16,562
Net liquidity to (capital deficiency)/equity ratio 2.19 (1.71)

CSF GROUP PLC NOTES TO THE FINANCIAL STATEMENTS (Continued)
63
Significant accounting policies
Details of the significant accounting policies and methods adopted, including the criteria for recognition, the basis of measurement and the basis on which income and expenses are recognised, in respect of each class of financial asset, financial liability and equity instrument are disclosed in Note 3 to the Financial statements. Categories of financial instruments The table below provides an analysis of financial instruments categorised as follows:
(a) Loan and receivables (L&R) (b) Fair value Through profit or loss (FVTPL) (c) Available for sale financial assets (AFS) (d) Held to maturity invesments (HTM) (e) Other liabilities (OL)
As at 31 March
2016 RM’000
As at 31 March
2015 RM’000
Financial assets Other investments (FVTPL) 155 153 Trade and other receivables (L&R) 59,957 106,303 Restricted cash (L&R) 14,055 13,095 Cash and cash equivalents (L&R) 45,823 31,379
119,990 150,930
Financial liabilities Trade and other payables (OL) 169,730 152,160 Obligations under finance leases (OL) 305 445 Term loan (OL) 1,498 2,662
171,533 155,267
Financial risk management objectives
The Group‟s financial instruments comprise bank loans, finance leases, investments, trade receivables and trade payables that arise already from its operations. The purpose of the instruments is to raise finance for Group‟s activities and capital investments. Market risk
The Group‟s activities expose it primarily to the financial risks of changes in foreign currency exchange rates and interest rates.

CSF GROUP PLC NOTES TO THE FINANCIAL STATEMENTS (Continued)
64
Foreign currency risk management
The Group primarily operates in Malaysian Ringgit, however it undertakes certain transactions denominated in foreign currencies. Hence, exposures to exchange rate fluctuations arise. Exchange rate exposures are managed by periodically entering into foreign exchange contracts.
A sensitivity analysis has been performed on the outstanding foreign currency denominated monetary balances of the Group as at 31 March 2016. If the following currencies were to strengthen or weaken by 5% against the Malaysian Ringgit, the credit/(charge) to the Comprehensive Income Statement would be: Year ended 31 March 2016 US Dollars
RM’000
Pounds Sterling RM’000
Strengthen against Malaysian Ringgit by 5% 25 2 Weaken against Malaysian Ringgit by 5% (25) (2)
Year ended 31 March 2015 US Dollars
RM’000
Pounds Sterling RM’000
Strengthen against Malaysian Ringgit by 5% 3 6 Weaken against Malaysian Ringgit by 5% (3) (6)
Interest rate risk management
The Group is exposed to interest rate risk as entities in the Group borrow funds at floating interest rates. The Group manages interest rate risk by:
maintaining an appropriate mix of floating rate borrowings to manage cash flows; and
entering into sale and leaseback transactions of the data centres to reduce the Group‟s borrowings and interest.
The Group‟s exposures to interest rates on financial assets and financial liabilities are detailed in the liquidity risk management section of this Note.
Interest rate sensitivity analysis
The sensitivity analysis below has been determined based on the exposure to interest rates of deposits and borrowings during the financial year. The credit/(charge) to the Comprehensive Income Statement following a 1% increase or decrease in interest rates would be:
Year ended 31 March
2016 RM’000
Year ended 31 March
2015 RM’000
Increase in interest rate by 1% 346 232 Decrease in interest rate by 1% (346) (232)
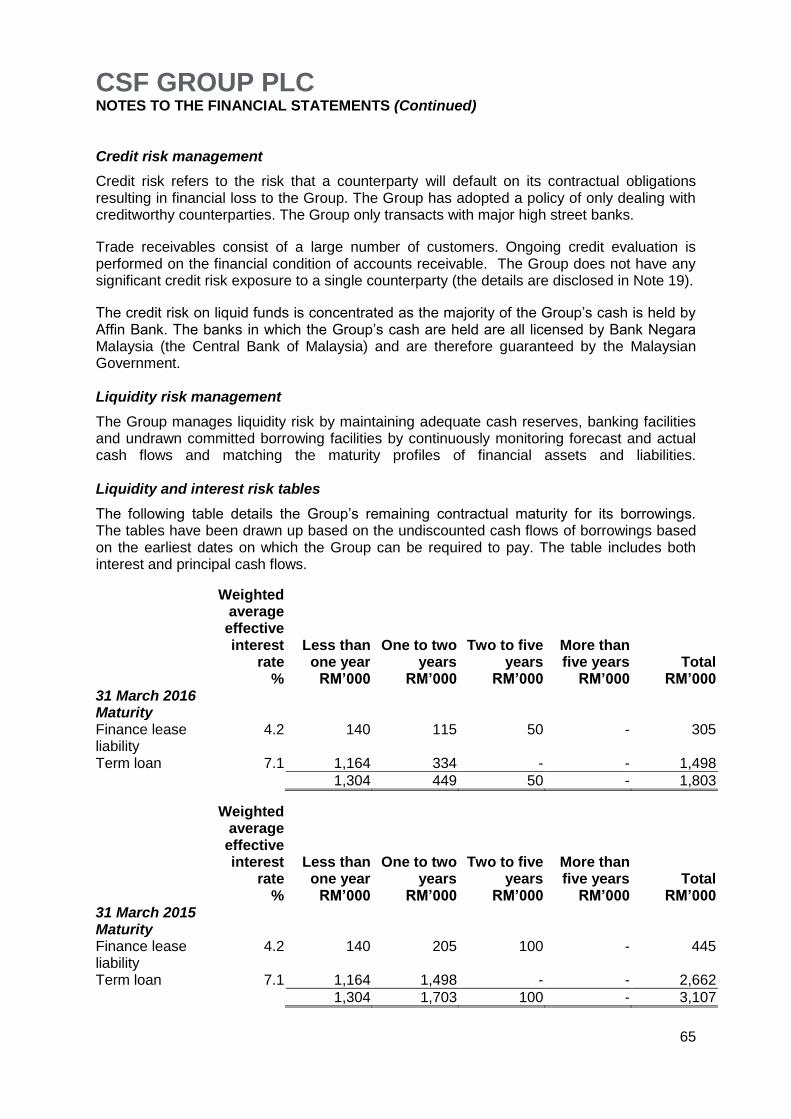
CSF GROUP PLC NOTES TO THE FINANCIAL STATEMENTS (Continued)
65
Credit risk management
Credit risk refers to the risk that a counterparty will default on its contractual obligations resulting in financial loss to the Group. The Group has adopted a policy of only dealing with creditworthy counterparties. The Group only transacts with major high street banks.
Trade receivables consist of a large number of customers. Ongoing credit evaluation is performed on the financial condition of accounts receivable. The Group does not have any significant credit risk exposure to a single counterparty (the details are disclosed in Note 19).
The credit risk on liquid funds is concentrated as the majority of the Group‟s cash is held by Affin Bank. The banks in which the Group‟s cash are held are all licensed by Bank Negara Malaysia (the Central Bank of Malaysia) and are therefore guaranteed by the Malaysian Government. Liquidity risk management
The Group manages liquidity risk by maintaining adequate cash reserves, banking facilities and undrawn committed borrowing facilities by continuously monitoring forecast and actual cash flows and matching the maturity profiles of financial assets and liabilities. Liquidity and interest risk tables
The following table details the Group‟s remaining contractual maturity for its borrowings. The tables have been drawn up based on the undiscounted cash flows of borrowings based on the earliest dates on which the Group can be required to pay. The table includes both interest and principal cash flows.
Weighted average
effective interest
rate %
Less than one year
RM’000
One to two years
RM’000
Two to five years
RM’000
More than five years
RM’000 Total
RM’000 31 March 2016 Maturity
Finance lease liability
4.2 140 115 50 - 305
Term loan 7.1 1,164 334 - - 1,498
1,304 449 50 - 1,803
Weighted average
effective interest
rate %
Less than one year
RM’000
One to two years
RM’000
Two to five years
RM’000
More than five years
RM’000 Total
RM’000 31 March 2015 Maturity
Finance lease liability
4.2 140 205 100 - 445
Term loan 7.1 1,164 1,498 - - 2,662
1,304 1,703 100 - 3,107

CSF GROUP PLC NOTES TO THE FINANCIAL STATEMENTS (Continued)
66
32. CONTINGENCIES
The Group holds a number of guarantees with various banks in respect of banking facilities as follows:
As at 31 March
2016 RM’000
As at 31 March
2015 RM’000
Banking guarantees 25,037 27,549
33. POST BALANCE SHEET EVENTS
The revised lease rental agreement and the debts settlement agreement with the freeholder is in the process of being finalised as at date of this report.
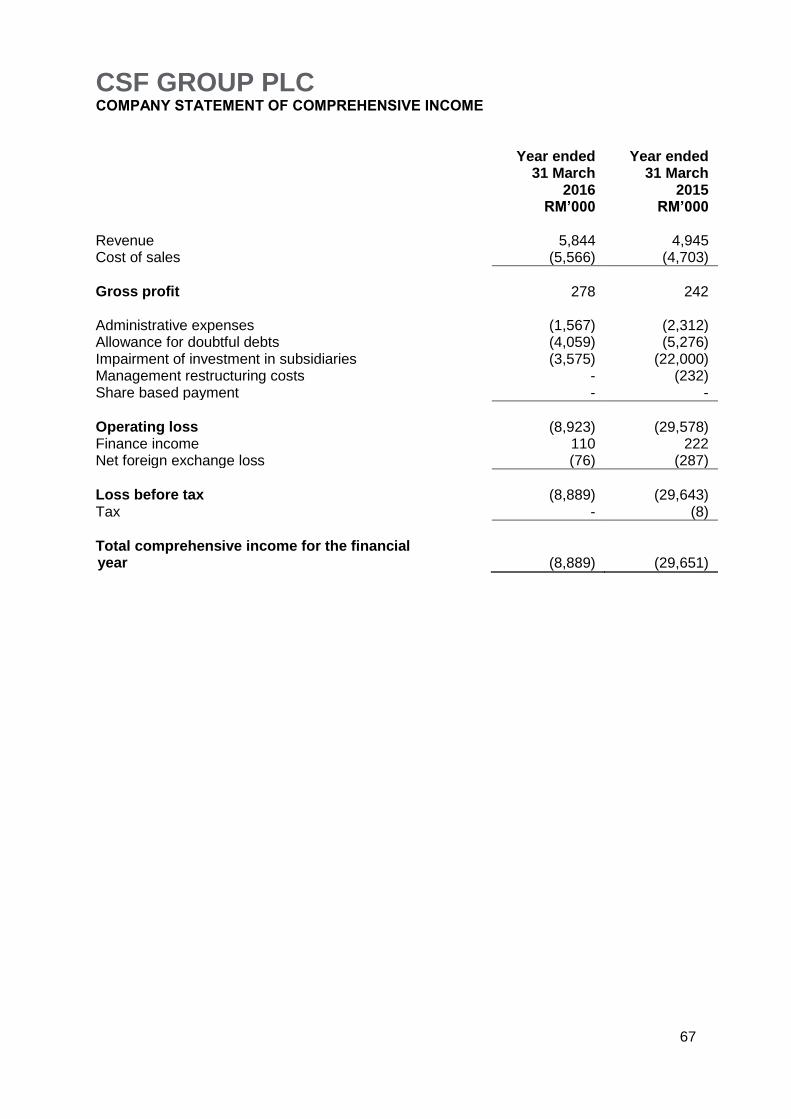
CSF GROUP PLC COMPANY STATEMENT OF COMPREHENSIVE INCOME
67
Year ended 31 March
2016 RM’000
Year ended 31 March
2015 RM’000
Revenue 5,844 4,945 Cost of sales (5,566) (4,703)
Gross profit 278 242 Administrative expenses (1,567) (2,312) Allowance for doubtful debts (4,059) (5,276) Impairment of investment in subsidiaries (3,575) (22,000) Management restructuring costs - (232) Share based payment - -
Operating loss
(8,923) (29,578)
Finance income 110 222 Net foreign exchange loss (76) (287)
Loss before tax
(8,889) (29,643)
Tax - (8)
Total comprehensive income for the financial year
(8,889)
(29,651)
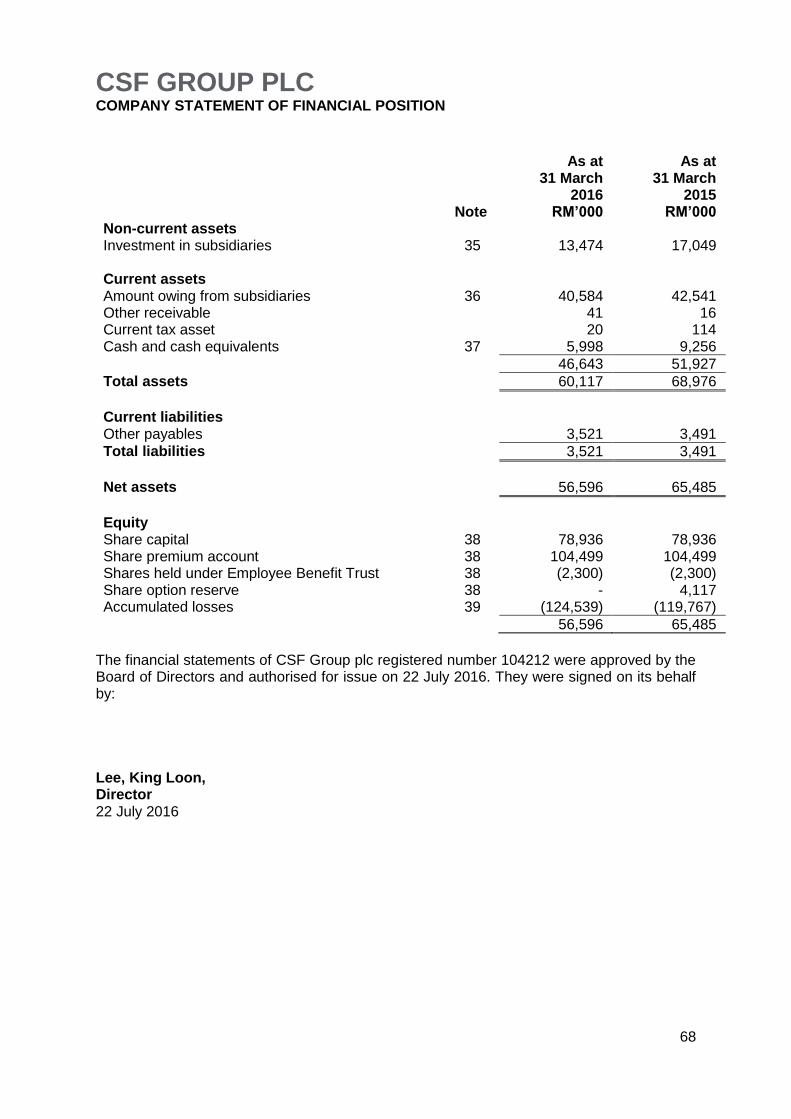
CSF GROUP PLC COMPANY STATEMENT OF FINANCIAL POSITION
68
The financial statements of CSF Group plc registered number 104212 were approved by the Board of Directors and authorised for issue on 22 July 2016. They were signed on its behalf by: Lee, King Loon, Director 22 July 2016
Note
As at 31 March
2016 RM’000
As at 31 March
2015 RM’000
Non-current assets Investment in subsidiaries 35 13,474 17,049 Current assets Amount owing from subsidiaries 36 40,584 42,541 Other receivable 41 16 Current tax asset 20 114 Cash and cash equivalents 37 5,998 9,256
46,643 51,927
Total assets 60,117 68,976
Current liabilities Other payables 3,521 3,491
Total liabilities 3,521 3,491
Net assets 56,596 65,485
Equity Share capital 38 78,936 78,936 Share premium account 38 104,499 104,499 Shares held under Employee Benefit Trust 38 (2,300) (2,300) Share option reserve 38 - 4,117 Accumulated losses 39 (124,539) (119,767)
56,596 65,485
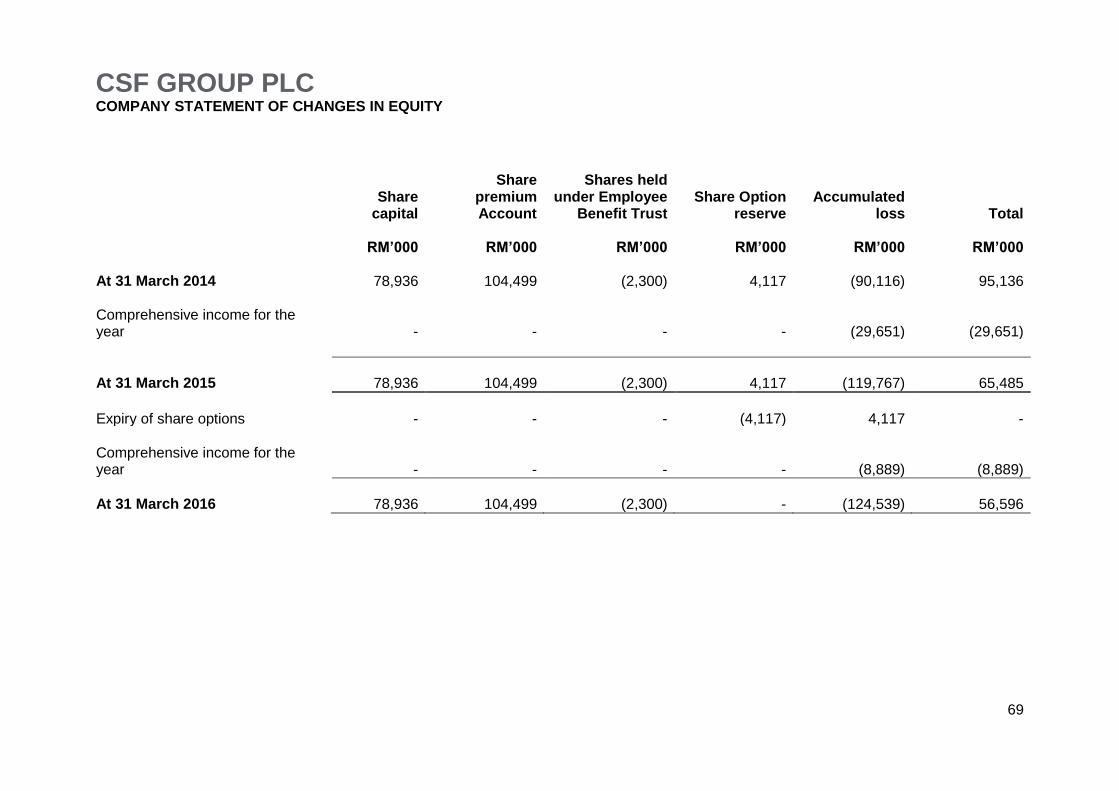
CSF GROUP PLC COMPANY STATEMENT OF CHANGES IN EQUITY
69
Share capital
RM’000
Share premium Account
RM’000
Shares held under Employee
Benefit Trust
RM’000
Share Option reserve
RM’000
Accumulated loss
RM’000
Total
RM’000 At 31 March 2014 78,936 104,499 (2,300) 4,117 (90,116) 95,136 Comprehensive income for the year
-
-
-
-
(29,651)
(29,651)
At 31 March 2015 78,936 104,499 (2,300) 4,117 (119,767) 65,485
Expiry of share options - - - (4,117) 4,117 -
Comprehensive income for the year
-
-
-
-
(8,889)
(8,889)
At 31 March 2016 78,936 104,499 (2,300) - (124,539) 56,596
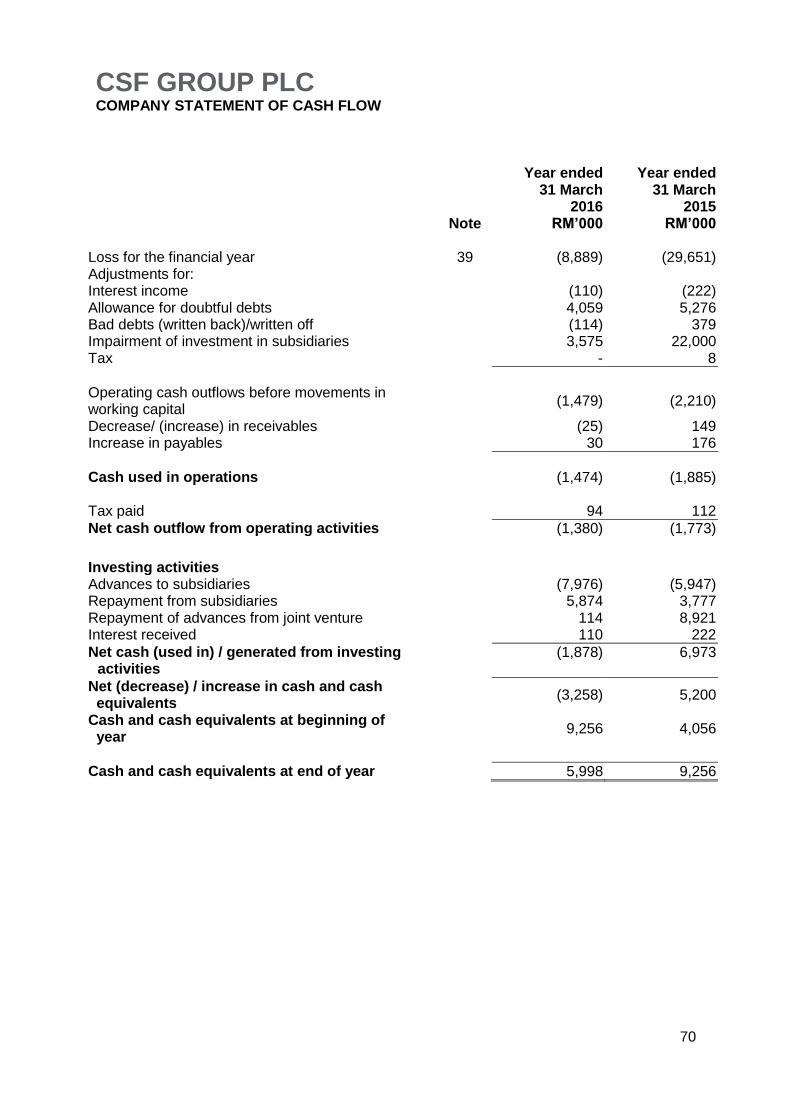
CSF GROUP PLC COMPANY STATEMENT OF CASH FLOW
70
Note
Year ended 31 March
2016 RM’000
Year ended 31 March
2015 RM’000
Loss for the financial year 39 (8,889) (29,651) Adjustments for: Interest income (110) (222) Allowance for doubtful debts 4,059 5,276 Bad debts (written back)/written off (114) 379 Impairment of investment in subsidiaries 3,575 22,000 Tax - 8
Operating cash outflows before movements in working capital
(1,479) (2,210)
Decrease/ (increase) in receivables (25) 149 Increase in payables 30 176
Cash used in operations (1,474) (1,885) Tax paid 94 112
Net cash outflow from operating activities (1,380) (1,773)
Investing activities
Advances to subsidiaries (7,976) (5,947) Repayment from subsidiaries 5,874 3,777 Repayment of advances from joint venture 114 8,921 Interest received 110 222
Net cash (used in) / generated from investing activities
(1,878) 6,973
Net (decrease) / increase in cash and cash equivalents
(3,258) 5,200
Cash and cash equivalents at beginning of year
9,256 4,056
Cash and cash equivalents at end of year 5,998 9,256
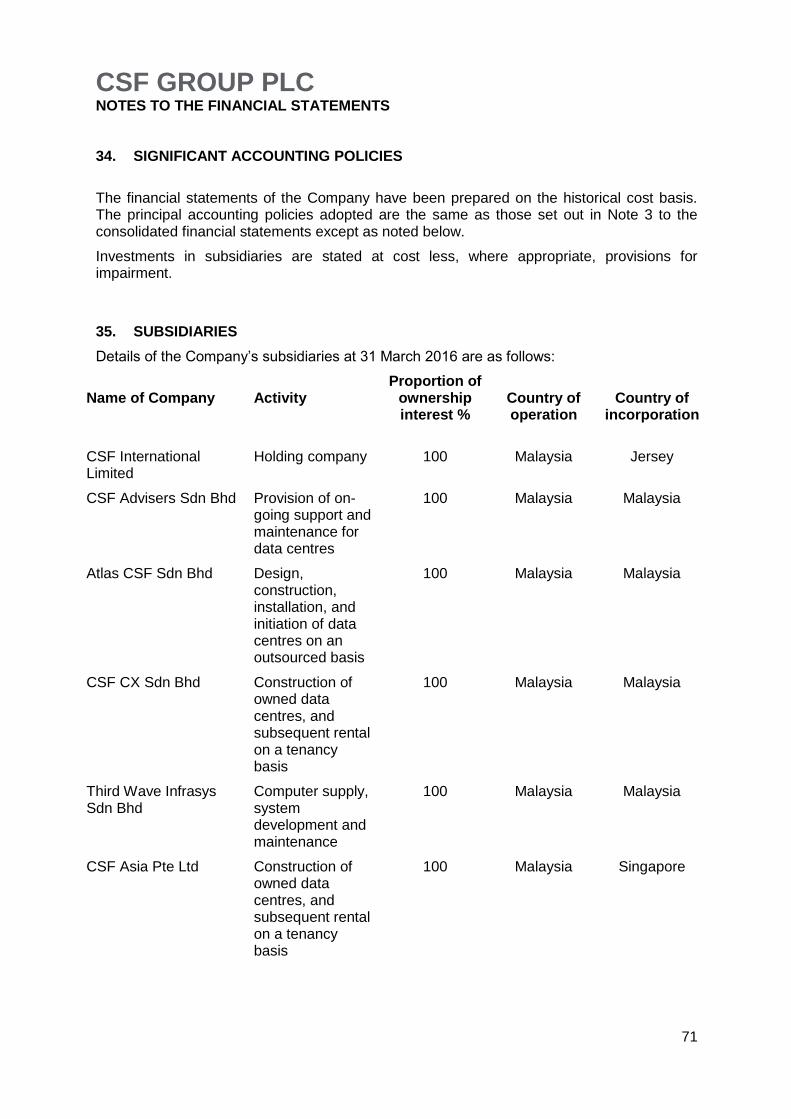
CSF GROUP PLC NOTES TO THE FINANCIAL STATEMENTS
71
34. SIGNIFICANT ACCOUNTING POLICIES
The financial statements of the Company have been prepared on the historical cost basis. The principal accounting policies adopted are the same as those set out in Note 3 to the consolidated financial statements except as noted below.
Investments in subsidiaries are stated at cost less, where appropriate, provisions for impairment.
35. SUBSIDIARIES
Details of the Company‟s subsidiaries at 31 March 2016 are as follows:
Name of Company
Activity
Proportion of ownership interest %
Country of operation
Country of
incorporation
CSF International Limited
Holding company 100 Malaysia Jersey
CSF Advisers Sdn Bhd Provision of on-going support and maintenance for data centres
100 Malaysia Malaysia
Atlas CSF Sdn Bhd Design, construction, installation, and initiation of data centres on an outsourced basis
100 Malaysia Malaysia
CSF CX Sdn Bhd Construction of owned data centres, and subsequent rental on a tenancy basis
100 Malaysia Malaysia
Third Wave Infrasys Sdn Bhd
Computer supply, system development and maintenance
100 Malaysia Malaysia
CSF Asia Pte Ltd Construction of owned data centres, and subsequent rental on a tenancy basis
100 Malaysia Singapore

CSF GROUP PLC NOTES TO THE FINANCIAL STATEMENTS (Continued)
72
36. AMOUNT OWING FROM SUBSIDIARIES
The amount owing from subsidiaries, CSF Advisers Sdn Bhd, CSF CX Sdn Bhd, CSF Asia Pte Ltd, Atlas CSF Sdn Bhd and CSF International Limited approximates its fair value.
37. CASH AND CASH EQUIVALENTS
These comprise cash held by the Company and short-term bank deposits with an original maturity of three months or less. The carrying amount of these assets approximates their fair value.
38. SHARE CAPITAL, SHARE PREMIUM ACCOUNT, SHARE OPTION RESERVE,
SHARES HELD UNDER EMPLOYEE BENEFIT TRUST
The movements on these items are disclosed in Note 26 of the Consolidated Financial Statements.
. 39. RETAINED EARNINGS
RM’000 Balance at 31 March 2014 (90,116) Net loss for the year (29,651)
Balance at 31 March 2015 (119,767) Forfeiture of share options 4,117 Net loss for the year (8,889)
Balance at 31 March 2016 (124,539)
40. RELATED PARTY TRANSACTIONS
Year ended 31 March
2016 RM’000
Year ended 31 March
2015 RM’000
Advances to CSF Advisers Sdn Bhd 13 14 Advances to CSF CX Sdn Bhd 2,016 3,464 Advances to CSF Asia Pte Ltd 12 32 Advances to Atlas CSF Sdn Bhd 12 22 Advances to Third Wave Infrasys Sdn Bhd 47 - Sales to CSF Advisers Sdn Bhd 575 666 Sales to CSF CX Sdn Bhd 2,031 1,774 Sales to Atlas CSF Sdn Bhd 3,238 2,505
The outstanding amount from CSF Advisers Sdn Bhd, CSF CX Sdn Bhd, CSF Asia Pte Ltd, Atlas CSF Sdn Bhd and CSF International Limited are unsecured, interest-free and not subject to fixed repayment term.

CSF GROUP PLC COMPANY INFORMATION
73
CSF Group plc CSF Computer Exchange 5 (CX5) Jalan Cyber Point 2 Cyber 12 63000 Cyberjaya Selangor Darul Ehsan Malaysia T: +603 8318 1313 F: +603 8318 0303 E: [email protected] www.csf-group.com
Company Secretary Norhazlina Hamdan CSF Computer Exchange 5 (CX5) Jalan Cyber Point 2 Cyber 12 63000 Cyberjaya Selangor Darul Ehsan Malaysia
Company Registered Number 104212
Nominated Adviser and Broker Allenby Capital Limited 3 St Helen‟s Place London EC3A 6AB England
Chartered Accountants and Auditor
Deloitte LLP
Mountbatten House
1 Grosvenor Square
Southampton SO15 2BZ
England
United Kingdom
Registrar Computershare Investor Services (Jersey) Limited Queensway House Hilgrove Street St Helier Jersey JE1 1ES Channel Islands

74