CSEC Agricultural Science SBA Teachers' Training …...1 contains the sample crop production...
53
Government of the Republic of Trinidad and Tobago MINISTRY OF EDUCATION CURRICULUM PLANNING AND DEVELOPMENT DIVISION CSEC Agricultural Science SBA Teachers' Training Manual CSEC Agricultural Science Syllabus w.e.f. 2018 by Karen Ramdahin-Nandaram Khalel Mohoyodeen May 2017
Transcript of CSEC Agricultural Science SBA Teachers' Training …...1 contains the sample crop production...

Government of the Republic of Trinidad and Tobago
MINISTRY OF EDUCATION
CURRICULUM PLANNING AND DEVELOPMENT DIVISION
CSEC Agricultural Science SBA Teachers' Training Manual
CSEC Agricultural Science Syllabus w.e.f. 2018
by
Karen Ramdahin-Nandaram
Khalel Mohoyodeen
May 2017

1
© Ministry of Education
Published in 2017 by the
Curriculum Planning & Development Division
Ministry of Education
Rudranath Capildeo Learning Resource Centre
Mc Bean, Couva
Republic of Trinidad & Tobago

2
Table of Contents Foreword ................................................................................................................................................ 0
Acknowledgements .................................................................................................................................. 1
About this book ....................................................................................................................................... 2
SECTION 1: SAMPLE CROP INVESTIGATIVE PROJECT ........................................................ 3
INTRODUCTION .............................................................................................................................. 5
Background ..................................................................................................................................... 5
Problem Statement .......................................................................................................................... 5
Hypothesis....................................................................................................................................... 5
Aim ................................................................................................................................................. 5
METHODOLOGY ............................................................................................................................. 6
Materials, Tools and Equipment ..................................................................................................... 6
Experimental Design ....................................................................................................................... 6
Data Collection ............................................................................................................................... 6
Crop Production Practices ............................................................................................................... 7
RESULTS ......................................................................................................................................... 11
Plant Survival ................................................................................................................................ 11
Average Number of Leaves per Plant ........................................................................................... 11
Yield .............................................................................................................................................. 12
DISCUSSION ................................................................................................................................... 14
Plant Survival ................................................................................................................................ 14
Average Number of Leaves per Plant ........................................................................................... 14
Yield .............................................................................................................................................. 14
CONCLUSION, RECOMMENDATIONS AND LIMITATIONS .................................................. 15
Conclusion .................................................................................................................................... 15
Recommendations ......................................................................................................................... 15
Limitations .................................................................................................................................... 15
REFERENCES ................................................................................................................................. 16
COST ANALYSIS............................................................................................................................ 17
Complete Budget .......................................................................................................................... 17
Actual Income-Expenditure Statement ......................................................................................... 18
Comparison of Projected and Actual Income, Expenditure and Profit/Loss ................................ 19
APPENDIX 1: DATA COLLECTION SHEETS FOR CROP INVESTIGATION ......................... 21
Plant Survivability ........................................................................................................................ 21

3
Number of Leaves per Plant .......................................................................................................... 22
Fresh Weight of Harvested Crop .................................................................................................. 23
APPENDIX 2: DRAFT MARK SCHEME FOR CROP INVESTIGATION................................... 24
PART 2: SAMPLE LIVESTOCK INVESTIGATIVE PROJECT ................................................ 25
INTRODUCTION ............................................................................................................................ 27
Background ................................................................................................................................... 27
Problem Statement ........................................................................................................................ 27
Hypothesis..................................................................................................................................... 27
Aim ............................................................................................................................................... 27
METHODOLOGY ........................................................................................................................... 28
Materials, Tools and Equipment ................................................................................................... 28
Experimental Design ..................................................................................................................... 28
Data Collection ............................................................................................................................. 28
Broiler Production Practices ......................................................................................................... 29
RESULTS ......................................................................................................................................... 31
Broiler Liveability ......................................................................................................................... 31
Feed Consumption ........................................................................................................................ 31
Broiler Live Weight ...................................................................................................................... 32
Feed Conversion Ratio (FCR)....................................................................................................... 33
Other Observations ....................................................................................................................... 34
DISCUSSION ................................................................................................................................... 35
Broiler Liveability ......................................................................................................................... 35
Feed Consumption ........................................................................................................................ 35
Broiler Live Weight ...................................................................................................................... 35
Feed Conversion Ratio (FCR)....................................................................................................... 35
Other Observations ....................................................................................................................... 35
CONCLUSION, LIMITATIONS AND RECOMMENDATIONS .................................................. 37
Conclusion .................................................................................................................................... 37
Recommendation .......................................................................................................................... 37
Limitations .................................................................................................................................... 37
REFERENCES ................................................................................................................................. 38
COST ANALYSIS............................................................................................................................ 39
Complete Budget .......................................................................................................................... 39
Actual Income-Expenditure Statement ......................................................................................... 40
4
Comparison of Projected and Actual Income, Expenditure and Profit/Loss ................................ 41
APPENDIX 1: DATA COLLECTION SHEET FOR BROILER INVESTIGATION ..................... 43
Broiler Feed Consumption ............................................................................................................ 43
Broiler Survival ............................................................................................................................. 44
Broiler Live Weight ...................................................................................................................... 45
APPENDIX 2: DRAFT MARK SCHEME FOR LIVESTOCK INVESTIGATION ....................... 46

Foreword
The Curriculum Planning and Development Division is pleased to develop this document as
instructional material, intended to guide secondary school Agricultural Science teachers in the
CSEC Agricultural Science School-Based Assessment (SBA). From 2018, the SBA portfolio
requirements will be changed to investigative projects in crop and livestock production.
Teachers have been clamouring for assistance in the implementation of the SBA to meet these
new requirements. To this end, the Curriculum Planning and Development Division has been
proactive in producing this document with the hope that it will positively contribute to teachers’
professional development as well as students’ academic success in CSEC Agricultural Science
in Trinidad and Tobago and the wider Caribbean.
John Roopchan
Director Curriculum Development
Curriculum Planning & Development Division

1
Acknowledgements
The authors acknowledge with gratitude the assistance of the Agricultural Science Teachers
and Students of Arima North, Chaguanas South and Cunupia Secondary Schools for many of
the pictures used in this Teachers' Training Manual. Thanks to all the secondary school
Agricultural Science Teachers for your invaluable feedback at the 2017 CSEC Agricultural
Science SBA Training Workshops. Thanks also to Ms. C. Ramsundar and Ms. Sharda Maharaj,
Supervisor, School Broadcasting Unit for assistance in editing this document; Ms. Donelia
Richards, Illustrator for graphic support and Clerk Typists Mrs. Dianne Ramnarace-Singh and
Ms. Nirmala Harry-Bachan, for assistance with the printing of this document.
2
About this book
This book is intended as a guide to assist CSEC Agricultural Science teachers and students
with the changes in the SBA requirements for the crop and animal production investigations in
the revised CSEC Agricultural Science Syllabus which will be examined in 2018.
It contains two sample SBAs, a crop and a livestock investigative project, as well as sample
data collection sheets and a draft mark scheme for marking these investigative reports. Section
1 contains the sample crop production investigative report and Section 2 is the sample livestock
investigative report.
It is hoped that teachers would use the information in this Guide to assist their students in
meeting the requirements for the CSEC Agricultural Science SBA investigative projects.
Furthermore, teachers are encouraged to develop their own investigative projects in
collaboration with their students.
Karen Ramdahin-Nandaram
Curriculum Officer (Agricultural Science)
Khalel Mohoyodeen
Curriculum Coordinator (TVET)
3
SECTION 1 SAMPLE
CROP INVESTIGATIVE
PROJECT

4
FREEPORT HIGH SCHOOL
CSEC Agricultural Science (Single Award) Investigative Report
CROP INVESTIGATIVE PROJECT
Name of Student: KAY MIKE
Student Registration No.: 1234567890
Name of School: FREEPORT HIGH SCHOOL
Title of Project:
The Response of Pakchoi Plants to Fertilizer
Application in a Clayey Loam Soil at Freeport High
School, Trinidad & Tobago
Project Start Date: 1st November 2016
Project End Date: 15th December 2016

5
INTRODUCTION
Background
Pakchoi (Brassica chinensis) also known as Chinese cabbage is a leafy vegetable which is
grown throughout Trinidad and Tobago. This crop can be eaten either cooked or raw. In
Trinidad and Tobago, it is cooked and eaten as a green vegetable. Its leaves are rich in vitamins,
minerals and dietary fibre (Ministry of Food Production, Land and Marine Affairs 2009).
Many varieties of pakchoi are grown in Trinidad and Tobago. Two common varieties grown
are Joi Choi and Spoon Blade (Ministry of Food Production, Land and Marine Affairs 2009).
Pakchoi vary in growth habit, agronomic practices and yield. Yields for pakchoi range from
4,988 to 29,927 kg/ha (Wanitprapha et al. 1992).
A review of the literature on pakchoi reveals a range of agronomic practices for growing this
crop. These practices vary according to the cultivar, soil type and environmental conditions
(Ministry of Food Production, Land and Marine Affairs 2009; Weever et al. 1998; Wanitprapha
et al. 1992).
In Trinidad and Tobago, there are basically two methods of growing pakchoi: (a) growbox
method and (b) field production. Growbox cultivation methods are described in The Growbox
System for Vegetables: A Producer’s Manual (Ministry of Agriculture, Lands and Marine
Resources (2005). Field cultivation for pakchoi is described in Weever et al. (1998).
There are no guidelines for growing pakchoi at our school, and it has become necessary to
develop guidelines for the growing of pakchoi at Freeport High School. This investigation was
done to determine the response of pakchoi to fertilizer application at Freeport High School
which has a clayey loam soil.
Problem Statement
The yield of pakchoi varies widely with crop production practices but the response of pakchoi
to fertilizer application at Freeport High School is not known.
Hypothesis
Fertilizer application increases yield in pakchoi.
OR
The application of fertilizer to pakchoi increases yield.
OR
The yield of pakchoi increases with fertilizer application.
Aim
To determine the response of pakchoi to fertilizer application at Freeport High School.

6
METHODOLOGY
Materials, Tools and Equipment
Materials
30 pakchoi seedlings, 500 g fertilizer (30:10:10 NPK), 100 ml insecticide, 24 perforated plastic
bags, 24 lolly sticks, 24 plant labels, 1 permanent marker
Tools and equipment
41 watering cans, 25 ml measuring cylinder, 2-kg kitchen scale, brushing cutlass, garden fork,
hoe, garden spade, bucket, knife, garden hose, spray can, wheel barrow, plastic tray
Experimental Design
The experiment was conducted on a clayey loam soil at Freeport High School during the period
01 November to 15 December, 2016.
The experimental plot consisted of two beds labelled Bed C and Bed T with each bed measuring
1.8 m by 0.6 m. Bed C was the control bed and Bed T was the treatment bed.
The plants in Bed T were fertilized weekly with 5 g of 30:10:10 NPK fertilizer per plant,
whereas the plants on Bed C were not fertilized.
Data Collection
The plants in the treatment bed (Bed T) were labelled from T1 to T12 and the plants in the
control bed (Bed C) were labelled C1 to C12.
Over the experimental period, the following data were recorded in tables and used to plot
graphs where appropriate:
Plant Survival
The number of surviving plants were counted and recorded each week until the end of the
experiment.
Average Number of Leaves per Plant
The number of fully opened leaves on each plant was counted and recorded each week until
the end of the experiment.
Yield
The yield was measured by obtaining the fresh weight of harvested pakchoi plants after
removal of unwanted leaves.
Other Observations
The plants were closely monitored throughout the experimental period and all other
observations were recorded e.g. colour of leaves, size of leaves and leaf damage.

7
Crop Production Practices
Soil Preparation and Formation of Beds
The land was cleared of existing weeds and bushes. The plant debris was removed from the
land and placed in a compost heap. After the land was cleared, the soil was tilled using a garden
fork, and it was refined using a hoe. Beds and drains were then formed. The beds measured
1.8 m long by 0.6 m wide and the drains measured 30 cm wide by 30 cm deep (Figures 1, 2
and 3).
Figure 1: Bed after land was cleared of weeds
Figure 2: Bed after primary tillage was completed
Figure 3: Formation of beds and drains

8
Planting and Spacing
The crop was established using three-week-old seedlings. The seedlings were planted at a
spacing of 30 cm by 30 cm (Figure 4). A five-cm hole was dug, one seedling was placed in
the hole and the hole was refilled with soil. The soil was firmed around the base of the stem;
care being taken not to crush the plant. Two rows of six seedlings per row were planted in each
bed. After transplanting, the seedlings were watered using a watering can.
x x x x x x
x x x x x x
KEY: “X” denotes position of pakchoi seedling
Figure 4: Diagram showing planting arrangement of seedlings in a bed
Figure 5: Bed of established seedlings
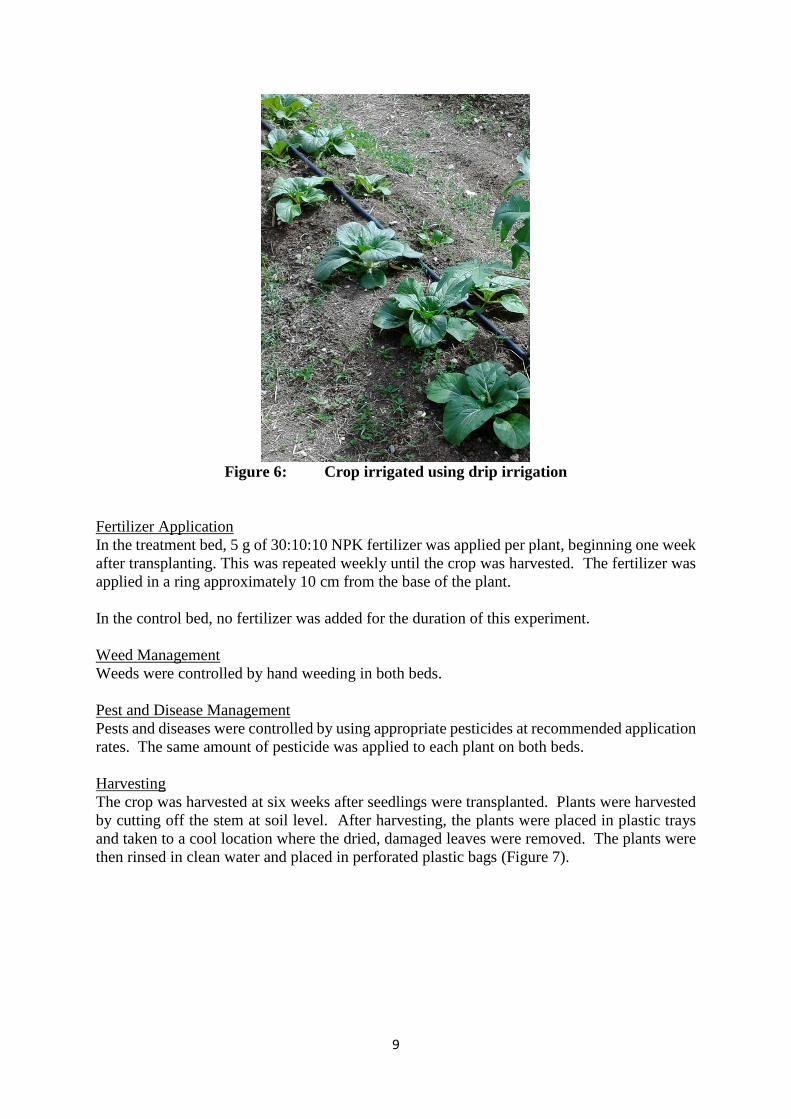
Irrigation
The plants were watered to ensure that the soil was kept evenly moist throughout the
experimental period (Figure 6).
30cm
30cm
9
Figure 6: Crop irrigated using drip irrigation
Fertilizer Application
In the treatment bed, 5 g of 30:10:10 NPK fertilizer was applied per plant, beginning one week
after transplanting. This was repeated weekly until the crop was harvested. The fertilizer was
applied in a ring approximately 10 cm from the base of the plant.
In the control bed, no fertilizer was added for the duration of this experiment.
Weed Management
Weeds were controlled by hand weeding in both beds.
Pest and Disease Management
Pests and diseases were controlled by using appropriate pesticides at recommended application
rates. The same amount of pesticide was applied to each plant on both beds.
Harvesting
The crop was harvested at six weeks after seedlings were transplanted. Plants were harvested
by cutting off the stem at soil level. After harvesting, the plants were placed in plastic trays
and taken to a cool location where the dried, damaged leaves were removed. The plants were
then rinsed in clean water and placed in perforated plastic bags (Figure 7).

10
Figure 7: Cleaning and packaging harvested pakchoi

11
RESULTS
Plant Survival
Table 1 shows the number of plants that survived over the experimental period. In the treatment
bed where the plants were fertilized with 5 g of 30:10:10 NPK fertilizer on a weekly basis, all
12 plants survived until the end of the experiment; whereas in the control bed, which did not
receive any fertilizer, only eight plants survived until the end of the experimental period.
Table 1: Plant Survival over the Experimental Period
Time
(weeks after transplanting)
Number of Plants that Survived
Treatment Bed Control Bed
1 12 12
2 12 10
3 12 8
4 12 8
5 12 8
6 12 8
Average Number of Leaves per Plant
The average number of leaves per plant increased in both the treatment and control beds over
the experimental period (Table 2). In the treatment bed, the average number of leaves per plant
increased from 4 to 15; whereas in the control bed, the increase in the number of leaves per
plant was from 4 to 10.
Table 2: Average number of leaves per plant over the experimental period
Time
(weeks after transplanting)
Average Number of Leaves per Plant
Treatment Bed Control Bed
1 4 4
2 7 5
3 11 7
4 13 8
5 14 9
6 15 10
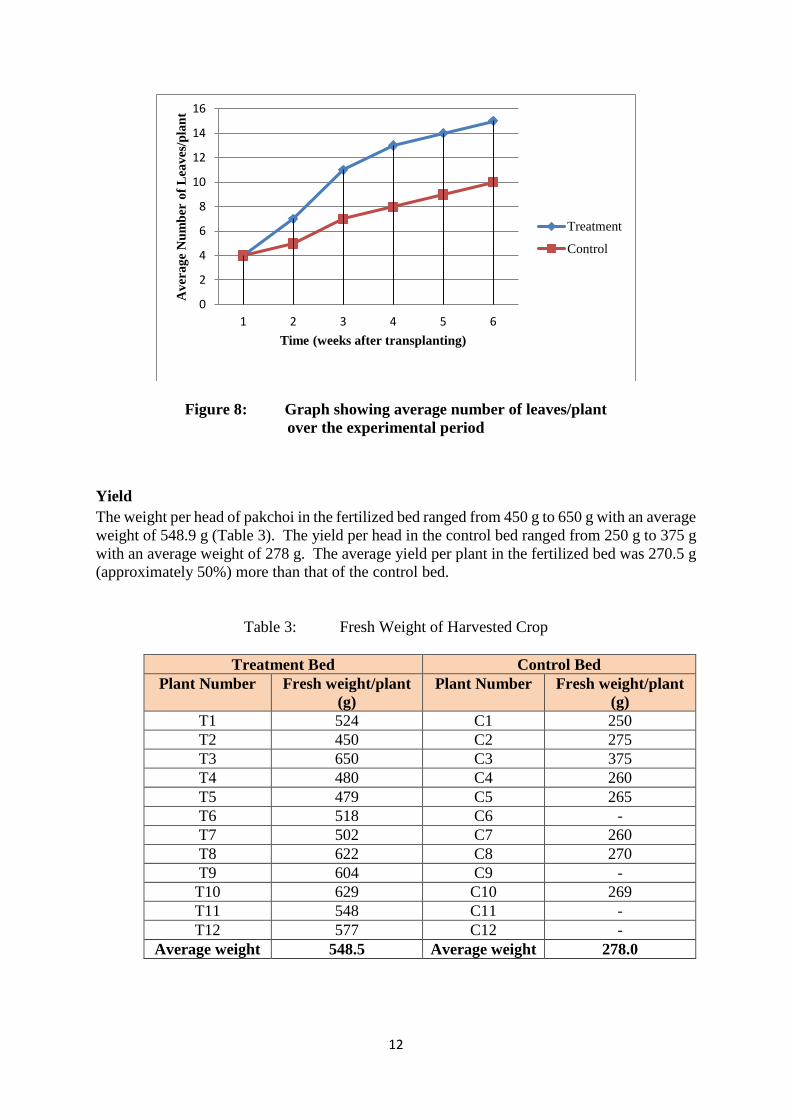
Throughout the experiment, the plants in the treatment bed had a greater average number of
leaves at any point in time when compared with plants in the control bed (Figure 8). In both
the treatment and control beds, the greatest number of leaves was observed six weeks after
transplanting.
12
Figure 8: Graph showing average number of leaves/plant
over the experimental period
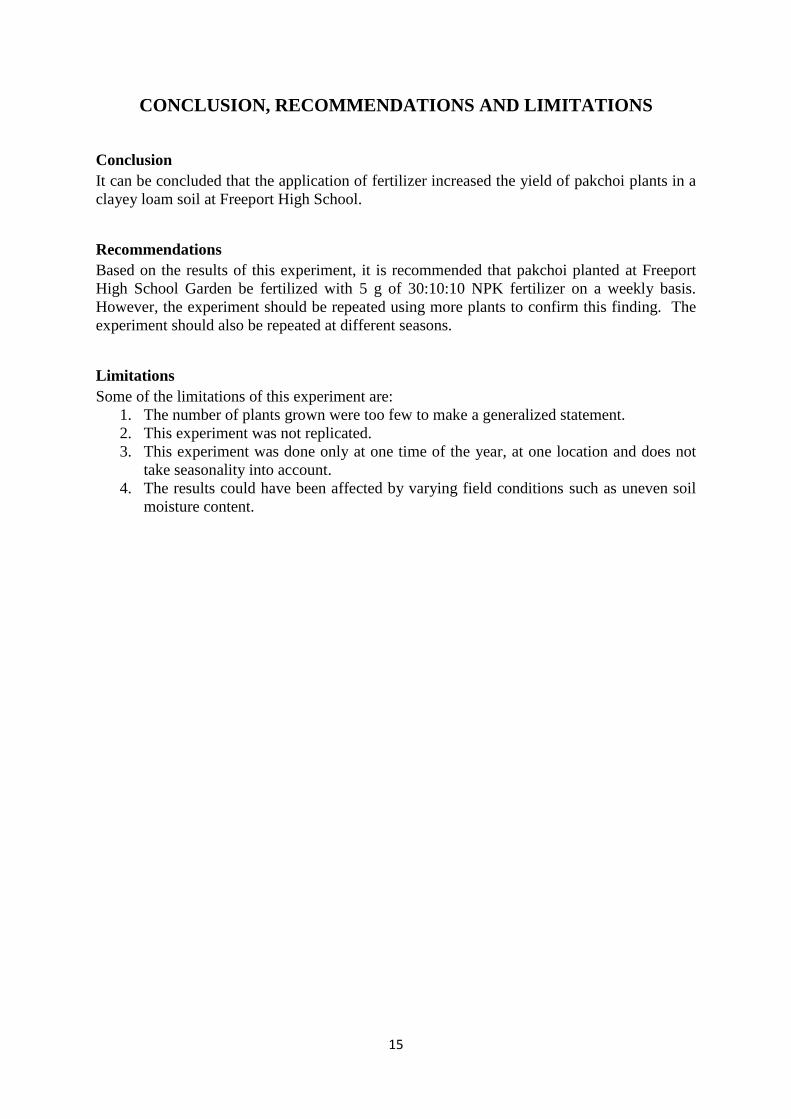
Yield
The weight per head of pakchoi in the fertilized bed ranged from 450 g to 650 g with an average
weight of 548.9 g (Table 3). The yield per head in the control bed ranged from 250 g to 375 g
with an average weight of 278 g. The average yield per plant in the fertilized bed was 270.5 g
(approximately 50%) more than that of the control bed.
Table 3: Fresh Weight of Harvested Crop
Treatment Bed Control Bed
Plant Number Fresh weight/plant
(g)
Plant Number Fresh weight/plant
(g)
T1 524 C1 250
T2 450 C2 275
T3 650 C3 375
T4 480 C4 260
T5 479 C5 265
T6 518 C6 -
T7 502 C7 260
T8 622 C8 270
T9 604 C9 -
T10 629 C10 269
T11 548 C11 -
T12 577 C12 -
Average weight 548.5 Average weight 278.0
0
2
4
6
8
10
12
14
16
1 2 3 4 5 6
Av
era
ge
Nu
mb
er o
f L
eav
es/p
lan
t
Time (weeks after transplanting)
Treatment
Control

13
Other observations
During this experiment it was also observed that the pakchoi leaves in the fertilized bed were
larger and darker green in colour than those in the control bed (Figures 9 and 10).
Figure 9: Plant growing in the treatment bed
Figure 10: Plant growing in the control bed

14
DISCUSSION
Plant Survival
A greater number of plants survived in the fertilized bed. It would appear that the addition of
fertilizer had a positive effect on plant survival in this experiment. This was probably due to
the higher nutrient availability which caused the plants to better withstand environmental
stresses when compared with the unfertilized plants. The compound fertilizer 30:10:10 NPK
has a total nutrient content of 50% of which 30% is nitrogen, 10% is phosphorus and 10% is
potassium. The plants which were fertilized had more phosphorus available and this was
responsible for promoting better root growth and development (Ramharracksingh 2011) which
probably allowed for greater nutrient uptake. In the control bed which received no fertilizer,
there may have been less nutrients available resulting in lower plant growth. Furthermore, this
reduced nutrient availability may have caused lower overall plant nutrient status resulting in
plant death.
Average Number of Leaves per Plant
Plants in the fertilized bed had more leaves. The mean number of leaves at harvest was 15
whereas in the control there were 10. The reason for the increased number of leaves in the
fertilized bed was probably due to higher nitrogen level in the soil which caused the plants to
grow more vigorously, thus producing more leaves (Ramharracksingh 2011).
Yield
Plants in the fertilized beds had a greater yield with 50% greater fresh weight than those in the
control bed. The heavier pakchoi weight found in the fertilized bed was attributed to the greater
number of leaves and the larger leaf size. These results indicated that the addition of fertilizer
had a positive effect on pakchoi yield in this experiment.
The greener leaves in the treatment bed was probably due to the availability of higher levels of
nitrogen. Nitrogen is needed for protein synthesis and this is responsible for promoting plant
growth (Ramharracksingh, 2011) which was higher in the treatment bed and resulted in greener
leaves.
15
CONCLUSION, RECOMMENDATIONS AND LIMITATIONS
Conclusion
It can be concluded that the application of fertilizer increased the yield of pakchoi plants in a
clayey loam soil at Freeport High School.
Recommendations
Based on the results of this experiment, it is recommended that pakchoi planted at Freeport
High School Garden be fertilized with 5 g of 30:10:10 NPK fertilizer on a weekly basis.
However, the experiment should be repeated using more plants to confirm this finding. The
experiment should also be repeated at different seasons.
Limitations
Some of the limitations of this experiment are:
1. The number of plants grown were too few to make a generalized statement.
2. This experiment was not replicated.
3. This experiment was done only at one time of the year, at one location and does not
take seasonality into account.
4. The results could have been affected by varying field conditions such as uneven soil
moisture content.
16
REFERENCES
Ramharracksingh, Ronald. 2011. Agricultural Science for CSEC Examinations. Oxford:
Macmillan Publishers.
Trinidad and Tobago, Ministry of Agriculture, Lands and Marine Resources. 2005. The
Growbox System for Vegetables, A Producer’s Manual. Trinidad: Ministry of Agriculture,
Lands and Marine Resources.
http://www.agriculture.gov.tt/images/tips/Growbox_System_Vegetables_Manual.pdf
(accessed January 13, 2017).
Trinidad and Tobago, Ministry of Food Production, Land and Marine Affairs. 2009. Home
Gardening Series: How to grow Pak-Choi. Ministry of Food Production, Land and Marine
Affairs. HG/TT: Ag Ext 98:16. 2009.
http://www.agriculture.gov.tt/images/tips/how-to-grow-pakchoi.pdf. (accessed January 11,
2017).
Trinidad and Tobago, National Agricultural Market Information System. undated. Historical
Monthly Average Retail Prices 2016. National Agricultural Marketing and Development
Corporation. http://www.namistt.com/ (accessed January 11, 2017).
Wanitprapha, K., C. A. Huggins and S.T. Nakamoto. 1992. “Won Bok and Pak Choi.”
Economic Factsheet #18. Manoa: University of Hawaii.
http://www.ctahr.hawaii.edu/sustainag/extn_pub/veggie%20pubs/Oriental%20Vegetables/W
on%20Bok%20and%20Pak%20Choi.pdf (accessed January 11, 2017).
Weever, F., J. Johnson, L. M. Phillip-Neri, Y. McIntosh, N. Henery, W. Archer, L. Vickerie,
and E. O’D. Williams. 1998. Agricultural Science in Secondary Schools in Guyana Book 1.
Georgetown: Ministry of Education.
17
COST ANALYSIS
The cost analysis was done for the 12 pakchoi plants grown in the control bed. These plants
were not treated with any fertilizers but were managed in the same manner as the plants in the
fertilized bed.
Complete Budget
This section includes the Projected Income, Projected Expenditure and Projected Profit/Loss,
for this activity.
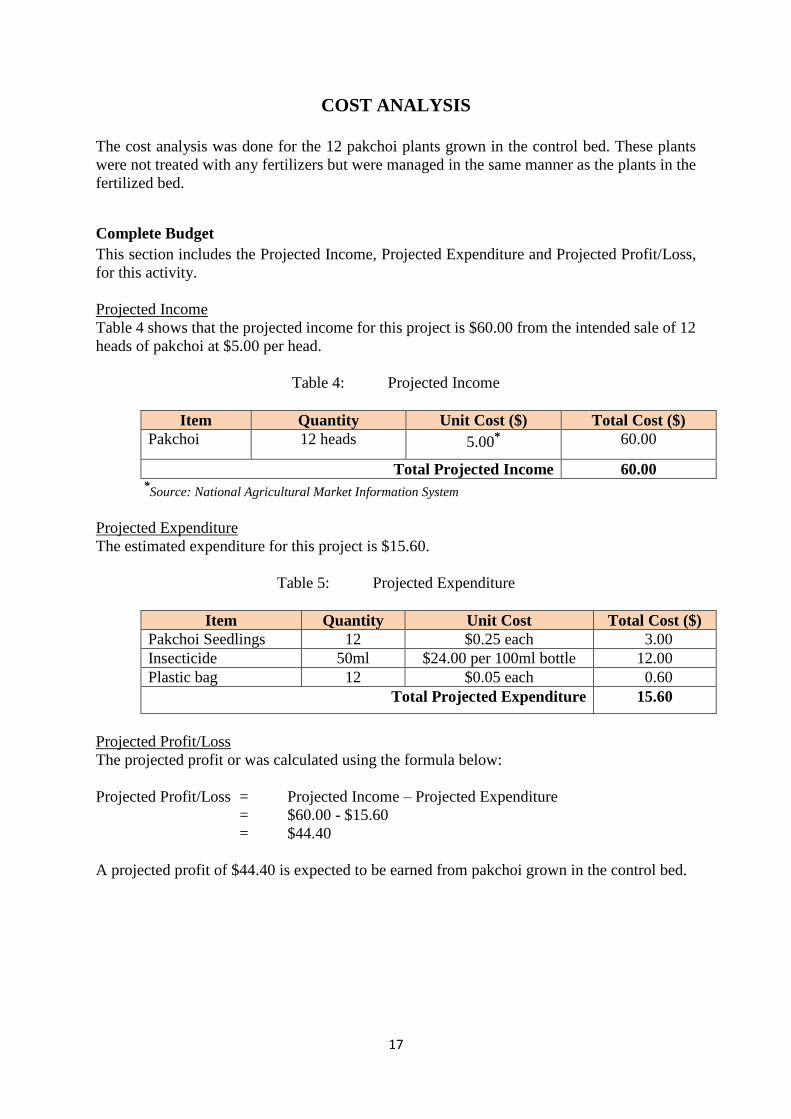
Projected Income
Table 4 shows that the projected income for this project is $60.00 from the intended sale of 12
heads of pakchoi at $5.00 per head.
Table 4: Projected Income
Item Quantity Unit Cost ($) Total Cost ($)
Pakchoi 12 heads 5.00* 60.00
Total Projected Income 60.00 *Source: National Agricultural Market Information System
Projected Expenditure
The estimated expenditure for this project is $15.60.
Table 5: Projected Expenditure
Item Quantity Unit Cost Total Cost ($)
Pakchoi Seedlings 12 $0.25 each 3.00
Insecticide 50ml $24.00 per 100ml bottle 12.00
Plastic bag 12 $0.05 each 0.60
Total Projected Expenditure 15.60
Projected Profit/Loss
The projected profit or was calculated using the formula below:
Projected Profit/Loss = Projected Income – Projected Expenditure
= $60.00 - $15.60
= $44.40
A projected profit of $44.40 is expected to be earned from pakchoi grown in the control bed.

18
Actual Income-Expenditure Statement
This section comprises the Actual Income, Actual Expenditure and the Actual Profit/Loss for
this activity.
Actual Income
The actual income earned from the pakchoi grown in the control bed was $32.00
Table 6: Actual Income
Item Quantity Unit Cost Total Cost ($)
Pakchoi 8 only $4.00 32.00
Total Income 32.00
Actual Expenditure
The actual expenditure for the pakchoi grown in the control bed was $18.40
Table 7: Actual Expenditure
Item Quantity Unit Cost Total Cost ($)
Pakchoi seedlings 12 $0.50 each 6.00
Insecticide 1 bottle $12.00 per 100ml bottle 12.00
Plastic bag 8 $0.05 each 0.40
Total Expenditure 18.40
Actual Profit/Loss
The projected profit/loss was calculated using the formula below:
Actual Profit/Loss = Total Income – Total Expenditure
= $32.00 - $18.40
= $13.60
This activity generated a profit of $13.60 from the sale of pakchoi grown in the control bed.
19
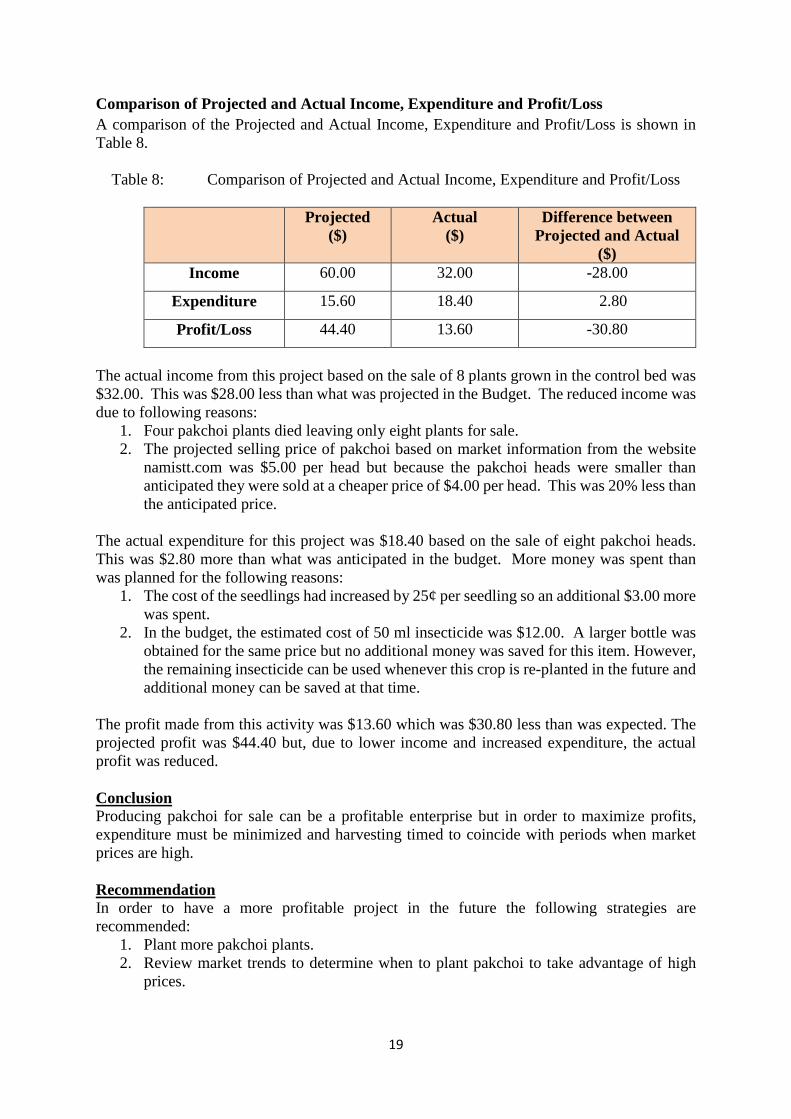
Comparison of Projected and Actual Income, Expenditure and Profit/Loss
A comparison of the Projected and Actual Income, Expenditure and Profit/Loss is shown in
Table 8.
Table 8: Comparison of Projected and Actual Income, Expenditure and Profit/Loss
Projected
($)
Actual
($)
Difference between
Projected and Actual
($)
Income 60.00 32.00 -28.00
Expenditure 15.60 18.40 2.80
Profit/Loss 44.40 13.60 -30.80
The actual income from this project based on the sale of 8 plants grown in the control bed was
$32.00. This was $28.00 less than what was projected in the Budget. The reduced income was
due to following reasons:
1. Four pakchoi plants died leaving only eight plants for sale.
2. The projected selling price of pakchoi based on market information from the website
namistt.com was $5.00 per head but because the pakchoi heads were smaller than
anticipated they were sold at a cheaper price of $4.00 per head. This was 20% less than
the anticipated price.
The actual expenditure for this project was $18.40 based on the sale of eight pakchoi heads.
This was $2.80 more than what was anticipated in the budget. More money was spent than
was planned for the following reasons:
1. The cost of the seedlings had increased by 25¢ per seedling so an additional $3.00 more
was spent.
2. In the budget, the estimated cost of 50 ml insecticide was $12.00. A larger bottle was
obtained for the same price but no additional money was saved for this item. However,
the remaining insecticide can be used whenever this crop is re-planted in the future and
additional money can be saved at that time.
The profit made from this activity was $13.60 which was $30.80 less than was expected. The
projected profit was $44.40 but, due to lower income and increased expenditure, the actual
profit was reduced.
Conclusion
Producing pakchoi for sale can be a profitable enterprise but in order to maximize profits,
expenditure must be minimized and harvesting timed to coincide with periods when market
prices are high.
Recommendation
In order to have a more profitable project in the future the following strategies are
recommended:
1. Plant more pakchoi plants.
2. Review market trends to determine when to plant pakchoi to take advantage of high
prices.

20
3. Add fertilizer to the plants to ensure that they grow stronger, healthier and look more
attractive to consumers.
4. Reap the crop as soon as it gets to a desirable size so additional money would not have
to be spent on labour and resources for taking care of the crop for a longer period than
is required.
Reference
Trinidad and Tobago, National Agricultural Market Information System. undated. Historical
Monthly Average Retail Prices 2016. National Agricultural Marketing and Development
Corporation. http://www.namistt.com/ (accessed January 11, 2017).
21
APPENDIX 1: DATA COLLECTION SHEETS FOR CROP INVESTIGATION
Plant Survivability
BED
Plant
Number
No. of Plants Surviving
(Weeks After Transplanting)
1 2 3 4 5 6
TR
EA
TM
EN
T
T 1
T 2
T 3
T 4
T 5
T 6
T 7
T 8
T 9
T 10
T 11
T 12
Total No.
of Plants
Surviving
CO
NT
RO
L
C 1
C 2
C 3
C 4
C 5
C 6
C 7
C 8
C 9
C 10
C 11
C 12
Total No.
of Plants
Surviving
22
Number of Leaves per Plant
BED
Plant
Number
Number of Leaves per Plant
(Weeks After Transplanting)
1 2 3 4 5 6
TR
EA
TM
EN
T
T 1
T 2
T 3
T 4
T 5
T 6
T 7
T 8
T 9
T 10
T 11
T 12
Average
Number
of Leaves
CO
NT
RO
L
C 1
C 2
C 3
C 4
C 5
C 6
C 7
C 8
C 9
C 10
C 11
C 12
Average
Number
of Leaves
23
Fresh Weight of Harvested Crop
TREATMENT BED CONTROL BED
Plant Number Fresh Weight of
Harvested Crop
(g/plant)
Plant Number Fresh Weight of
Harvested Crop
(g/plant)
T 1 C 1
T 2 C 2
T 3 C 3
T 4 C 4
T 5 C 5
T 6 C 6
T 7 C 7
T 8 C 8
T 9 C 9
T 10 C 10
T 11 C 11
T 12 C 12
Average Weight
(g)
Average Weight
(g)
24
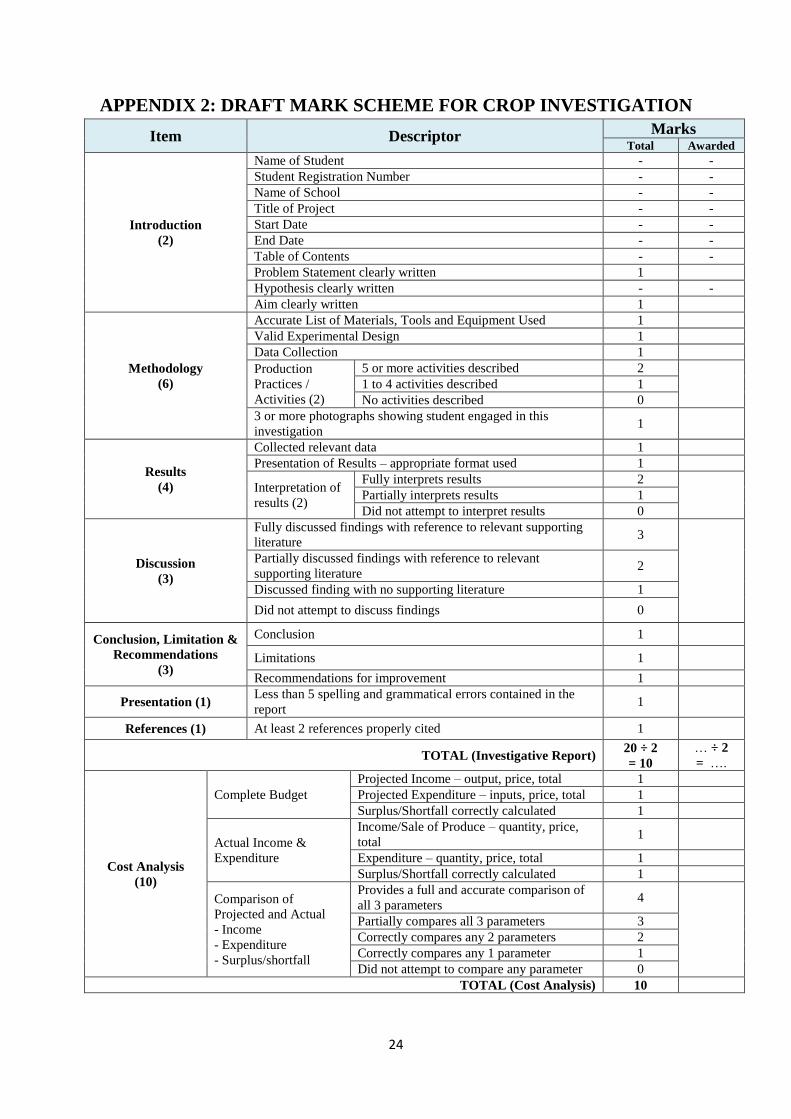
APPENDIX 2: DRAFT MARK SCHEME FOR CROP INVESTIGATION
Item Descriptor Marks
Total Awarded
Introduction
(2)
Name of Student - -
Student Registration Number - -
Name of School - -
Title of Project - -
Start Date - -
End Date - -
Table of Contents - -
Problem Statement clearly written 1
Hypothesis clearly written - -
Aim clearly written 1
Methodology
(6)
Accurate List of Materials, Tools and Equipment Used 1
Valid Experimental Design 1
Data Collection 1
Production
Practices /
Activities (2)
5 or more activities described 2
1 to 4 activities described 1
No activities described 0
3 or more photographs showing student engaged in this
investigation 1
Results
(4)
Collected relevant data 1
Presentation of Results – appropriate format used 1
Interpretation of
results (2)
Fully interprets results 2
Partially interprets results 1
Did not attempt to interpret results 0
Discussion
(3)
Fully discussed findings with reference to relevant supporting
literature 3
Partially discussed findings with reference to relevant
supporting literature 2
Discussed finding with no supporting literature 1
Did not attempt to discuss findings 0
Conclusion, Limitation &
Recommendations
(3)
Conclusion 1
Limitations 1
Recommendations for improvement 1
Presentation (1) Less than 5 spelling and grammatical errors contained in the
report 1
References (1) At least 2 references properly cited 1
TOTAL (Investigative Report) 20 ÷ 2
= 10
… ÷ 2
= ….
Cost Analysis
(10)
Complete Budget
Projected Income – output, price, total 1
Projected Expenditure – inputs, price, total 1
Surplus/Shortfall correctly calculated 1
Actual Income &
Expenditure
Income/Sale of Produce – quantity, price,
total 1
Expenditure – quantity, price, total 1
Surplus/Shortfall correctly calculated 1
Comparison of
Projected and Actual
- Income
- Expenditure
- Surplus/shortfall
Provides a full and accurate comparison of
all 3 parameters 4
Partially compares all 3 parameters 3
Correctly compares any 2 parameters 2
Correctly compares any 1 parameter 1
Did not attempt to compare any parameter 0
TOTAL (Cost Analysis) 10
25
PART 2 SAMPLE
LIVESTOCK
INVESTIGATIVE
PROJECT

26
FREEPORT HIGH SCHOOL
CSEC Agricultural Science (Single Award) Investigative Report
LIVESTOCK INVESTIGATIVE PROJECT
Name of Student: KAY MIKE
Student Registration No.: 1234567890
Name of School: FREEPORT HIGH SCHOOL
Title of Project:
The Effect of Spacing on Broiler Production at Freeport High
School, Trinidad & Tobago
Project Start Date: 9th January 2017
Project End Date: 27th February 2017

27
INTRODUCTION
Background
Broilers are a breed of domesticated fowl (Gallus gallus domesticus) that are reared specifically
for meat production. Popular breeds of broilers include Hyline, Vantress-Cross, Shaver,
Peterson and Star Cross. Some common characteristics of broiler birds are: white feathers,
yellow skin and rapid weight gain reaching a marketable size of about 2 kg in 5 to 7 weeks of
age.
Broiler meat is a very good source of protein and does not contain high levels of saturated fat
like other popular sources of animal protein such as mutton and beef. In Trinidad and Tobago,
consumers spend $1.2 billion each year on broiler meat (Douglas 2017).
Broiler farming can be a good source of income for many farmers. Some farmers engage in
broiler production on a large scale. Broilers are marketed as live birds or as dressed carcasses
(Weever et al. 1998).
A review of the literature on broiler production reveals a wide range of management practices.
These practices vary according to breed, system of management, husbandry practices and
environmental conditions (Aviagen 2015; Hubbard 2015; Cobb-Vantress 2013; Hi-Pro Feeds
n.d.)
Generally, there are three main systems of rearing broilers: (a) extensive or free-range system,
(b) semi-intensive or run system and (c) intensive or deep-litter system. Traditionally, at
Freeport High School, broilers are reared intensively using the deep-litter system as described
by Aviagen (2015), Hubbard (2015) and Cobb-Vantress (2013). There is a need however to
fine-tune these guidelines specific to conditions at Freeport High School. This experiment
seeks to investigate the effect of spacing on broiler production at Freeport High School.
Problem Statement
The response of broilers to spacing at Freeport High School is not known.
Hypothesis
Broiler weight gain is affected by spacing.
OR
Spacing affects broiler weight gain.
Aim
To determine the effect of spacing on weight gain in broilers and so determine the optimum
spacing for broiler birds at Freeport High School.

28
METHODOLOGY
Materials, Tools and Equipment
Materials
30 broiler chicks, starter feed, finisher feed, de-wormer, electrolyte, wood shavings,
disinfectant
Tools and Equipment
Wire mesh, infrared lamp, feeders, waterers, broom, 10 kg weighing scale, rake, bucket, shovel,
broiler weighing cone, garden hose, wheel barrow, electric fan, feed bags
Experimental Design
This investigation was conducted in the poultry pen at Freeport High School during the period
09 January to 27 February, 2017.
Twenty-four, one-day old broiler chicks were reared in a brooder for three weeks. After
brooding, the poultry pen was divided into two sections, labelled Section C and Section T.
Section C was the ‘control section’ and Section T was the ‘treatment section’. The treatment
section allowed for rearing the birds at a spacing of 0.14 m2 (1.5ft2) per bird and the control
section allowed a spacing of 0.09 m2 (1ft2) per bird. Twelve brooded chicks were randomly
selected and placed in each section of the pen.
Data Collection
Over the experimental period, the following data were recorded in tables and used to plot
graphs where appropriate:
Broiler Liveability
The number of surviving broilers were recorded each week until the end of the experiment.
Average Feed Consumption per bird per week
The feed was weighed prior to filling the feeders and the weight of feed given each week was
recorded until the end of the experiment. Average feed consumption was calculated as follows:
Average feed consumption/bird/week = Weekly Feed Consumption
Number of birds
Broiler Live Weight
All the birds were weighed at the start of the experiment and each week thereafter the weight
of the birds was recorded until the end of the experiment.
Feed Conversion Ratio (FCR)
FCR for each set of birds was calculated using the following formula (Ramharrackingh, 2011):
Feed Conversion Ratio = Weekly Feed Intake (kg)_
Weekly Weight Gain (kg)
29
Other Observations
The broilers were closely monitored throughout the investigative period and all other
observations were recorded.
Broiler Production Practices
Spacing
A spacing of 0.14 m2 (1.5ft2) was allowed for each bird in the treatment section and in the
control section the birds were reared at 0.09 m2 (1ft2) per bird. In this investigation, 12 birds
were reared in each section and the floor space was calculated accordingly with allowances
being made for one feeder and one waterer in each section. The spaces allocated for the feeder
and waterer were 0.13m2 and 0.15m2, respectively.
The dimensions of the treatment section were 1.4 m by 1.4 m with an area of 1.96 m2 (21.10ft2)
and the control section were 1.17 m by 1.17 m with an area of 1.36 m2 (14.64ft2) respectively.
Housing
Fluorescent lights were provided at nights to enable the birds to feed continuously. During hot
days, wall-mounted fans were also used to keep the poultry pen well ventilated.
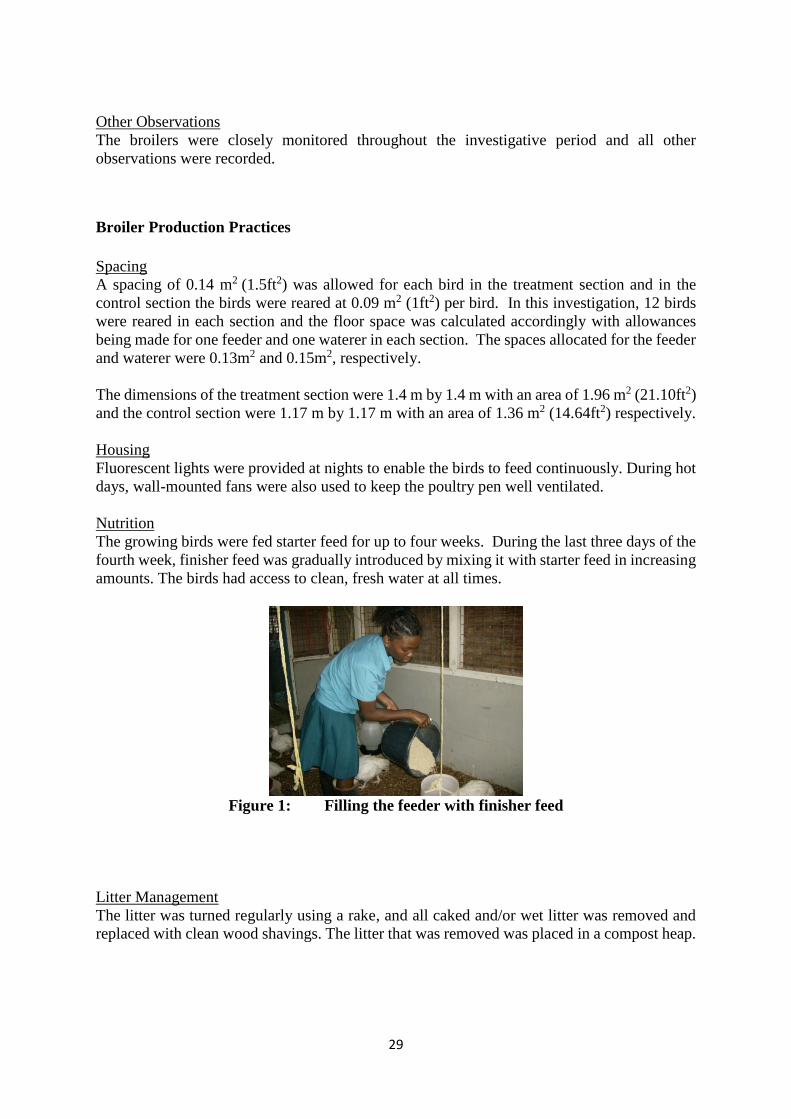
Nutrition
The growing birds were fed starter feed for up to four weeks. During the last three days of the
fourth week, finisher feed was gradually introduced by mixing it with starter feed in increasing
amounts. The birds had access to clean, fresh water at all times.
Figure 1: Filling the feeder with finisher feed
Litter Management
The litter was turned regularly using a rake, and all caked and/or wet litter was removed and
replaced with clean wood shavings. The litter that was removed was placed in a compost heap.

30
Figure 2: Turning litter
Health Management
Feeders and waterers were cleaned and sanitized regularly. At the end of the Week 4, the birds
were de-wormed using an appropriate de-wormer at the recommended rate.
Sale of Birds
At the end of seven weeks, the birds were ready for market. They were sold as live birds. They
were caught, weighed and their weights were recorded.
Figure 3: Weighing birds

31
RESULTS
Broiler Liveability
Table 1 shows the number of broilers that survived over the trial period. All 12 birds survived
in both the treatment and control sections of the pen.
Table 1: Liveability over the Experimental Period
Time
(weeks)
Number of Broilers Survived
Treatment Section Control Section
3 12 12
4 12 12
5 12 12
6 12 12
7 12 12
Feed Consumption
Table 2 shows the average weekly feed consumption of birds reared in the treatment and control
sections of the pen. The average weekly feed consumption per bird increased from 692 g to
1,298 g for the birds reared at the wider spacing (treatment) and from 700 g to 1,280 g for those
at the closer spacing (control). On average the birds reared in the treatment section ate 26 g
less feed than those in the control section.
Table 2: Average Feed Consumption/Bird over the Experimental Period
Time
(weeks)
Average Feed Consumption per bird (g)
Treatment Section Control Section
3 692 700
4 990 990
5 1112 1100
6 1255 1260
7 1298 1280
Total Average Feed Consumption/bird 5939 5965
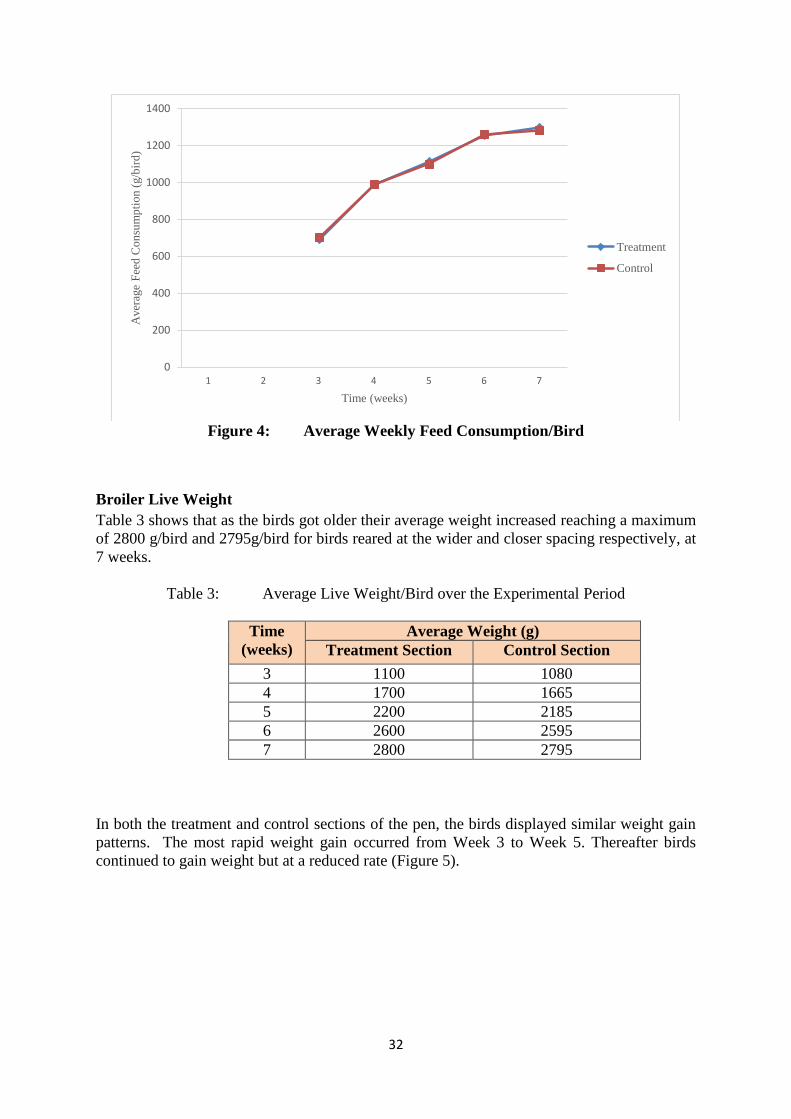
Figure 4 shows that in both the treatment and control sections of the pen, average broiler feed
consumption increased throughout the investigative period and displayed a similar pattern.
Initially, from Week 3 to Week 4 feed consumption increased rapidly; then from Weeks 5 to 7
feed consumption continued to increase but at a reduced rate.
32
Figure 4: Average Weekly Feed Consumption/Bird
Broiler Live Weight
Table 3 shows that as the birds got older their average weight increased reaching a maximum
of 2800 g/bird and 2795g/bird for birds reared at the wider and closer spacing respectively, at
7 weeks.
Table 3: Average Live Weight/Bird over the Experimental Period
Time
(weeks)
Average Weight (g)
Treatment Section Control Section
3 1100 1080
4 1700 1665
5 2200 2185
6 2600 2595
7 2800 2795
In both the treatment and control sections of the pen, the birds displayed similar weight gain
patterns. The most rapid weight gain occurred from Week 3 to Week 5. Thereafter birds
continued to gain weight but at a reduced rate (Figure 5).
0
200
400
600
800
1000
1200
1400
1 2 3 4 5 6 7
Aver
age
Fee
d C
on
sum
pti
on
(g/b
ird
)
Time (weeks)
Treatment
Control

33
Figure 5: Average Live Weight
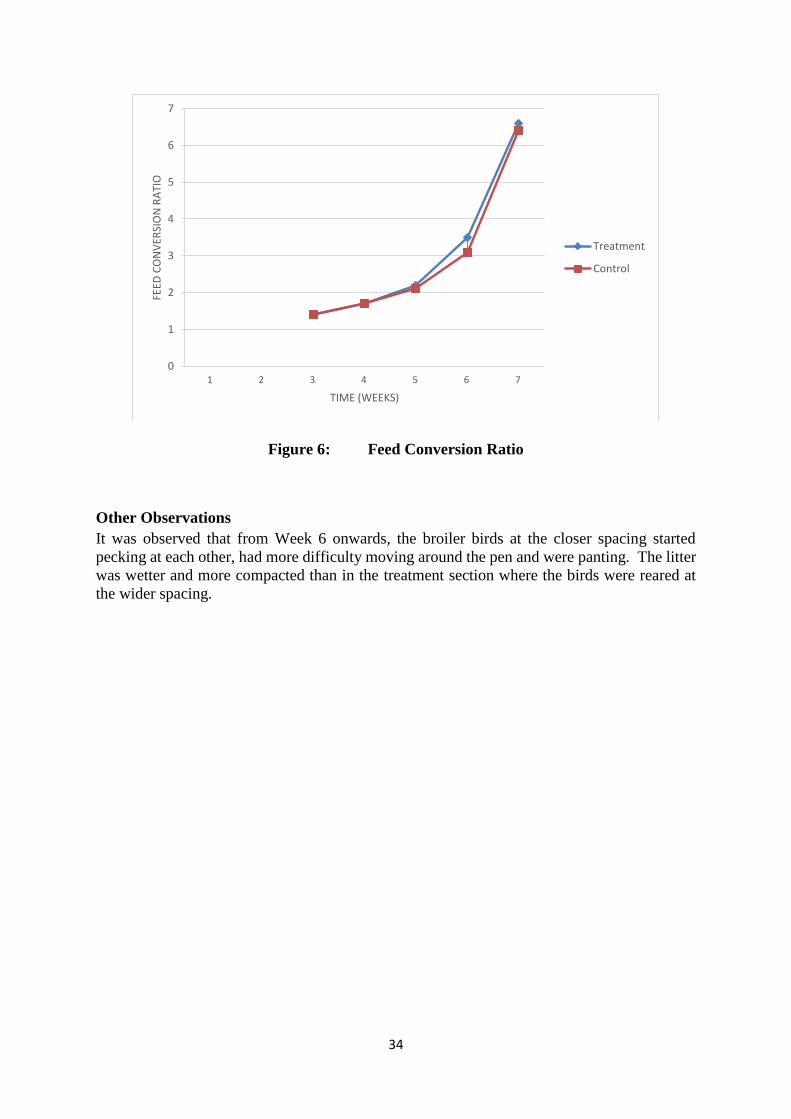
Feed Conversion Ratio (FCR)
Table 4 shows that as the birds got older FCR increased. At the start of this experiment, the
birds in both the treatment and control sections had the same FCR of 1.4:1. At the end of the
trial in Week 7, the FCR for the birds reared at the wider spacing was 6.6 and for those at the
closer spacing it was 6.4. The overall FCR for both the treatment and control was the same
(FCR = 2.1).
Table 4: Broiler Feed Conversion Ratio over the Experimental Period
Time
(weeks)
Feed Conversion Ratio
Treatment Section Control Section
3 1.4:1 1.4:1
4 1.7:1 1.7:1
5 2.2:1 2.1:1
6 3.5:1 3.1:1
7 6.6:1 6.4:1
Overall 2.1:1 2.1:1
Figure 6 shows that birds reared in the treatment and control sections of the pen had the same
FCR trends. Initially, the FCR at Week 3 was 1:4 which increased slowly to approximately
3:1 by Week 6, thereafter it rose rapidly to above 6:1.
0
500
1000
1500
2000
2500
3000
1 2 3 4 5 6 7
Bro
iler
Liv
e W
eigh
t (g
)
Time (weeks)
Treatment
Control
34
Figure 6: Feed Conversion Ratio
Other Observations
It was observed that from Week 6 onwards, the broiler birds at the closer spacing started
pecking at each other, had more difficulty moving around the pen and were panting. The litter
was wetter and more compacted than in the treatment section where the birds were reared at
the wider spacing.
0
1
2
3
4
5
6
7
1 2 3 4 5 6 7
FEED
CO
NV
ERSI
ON
RA
TIO
TIME (WEEKS)
Treatment
Control

35
DISCUSSION
Broiler Liveability
All the broiler birds survived in both the treatment and control sections of the pen during the
experiment. This was probably due to the fact that both the wider and closer spacing were
adequate for the growth and development of the birds.
The addition of the water soluble electrolyte to the drinking water probably contributed to the
high liveability by providing the necessary vitamins and minerals needed for the health, growth
and development of the birds. It also would have counteracted the negative effect of stress and
maintained hydration of the chicks during the early brooding stages (Vitalyte, n.d.).
Feed Consumption
In both the treatment and control sections, the birds ate approximately the same amount of feed
(5.9 kg) and displayed the same feed intake pattern. It would appear that spacing had no effect
on the quantity of feed consumed by the birds in this experiment. In both the treatment and
control sections, the birds had equal access to feed and water. The total feed consumed by the
birds in each section was much more than the 4.7 kg observed by Jacob and Pescatore (2012)
for seven-week-old broilers having a live weight of 2.4 kg in Kentucky, United States of
America.
Broiler Live Weight
In both the treatment and control sections, the broiler birds displayed similar live weight gain
patterns and by the end of the experiment at seven weeks, the average live weight of the birds
was approximately the same (2.8 kg). These results indicated that the spacing had no effect on
broiler live weight gain in this experiment. The live weight of the birds in this experiment was
0.4 kg more than was reported by Jacob and Pescatore (2012) for seven-week-old broilers in
Kentucky, United States of America. This was probably due to the greater amount of feed
consumed.
Feed Conversion Ratio (FCR)
At Week 3 and Week 4, the FCR for the birds in the treatment section (0.14 m2 /bird) was the
same as the FCR for those in the control section (0.09 m2/bird). This was probably due to the
birds having more than adequate space to move around thereby using the same amount of
energy and eating the same amount of feed. The overall FCR for both the treatment and the
control sections was the same (2.1:1); this was higher than what was reported by Fairchild
(2005) who found that birds reared at 0.09 m2 had an FCR of 1.83:1 with an average body
weight of 2.72 kg.
Other Observations
The pecking of the birds seen in the control section (0.09 m2/bird) may have been due to stress
induced by the closer spacing since the birds were bigger and had a relatively smaller space for
them to move around (Ragoonanan 2001)

36
The reduced space in the control section may have led to difficulty in movement for the birds
since these birds were stocked at a closer spacing (Fairchild 2005). This reduced movement
within this section would also contribute to the litter in the section being wetter and more
compacted.

37
CONCLUSION, LIMITATIONS AND RECOMMENDATIONS
Conclusion
It can be concluded that rearing birds at the wider spacing of 0.14 m2 (1.5ft2) per bird has no
effect on broiler production at Freeport High School.
Recommendation
Based on the results of this investigation, it is recommended that broilers can be reared at
the closer spacing of 0.09 m2 (1ft2) per bird. This spacing will allow the farmer to maximize
his stocking density, thereby improving the efficiency of his operations. However, the study
needs to be repeated and more broilers used.
Limitations
Some of the limitations of this investigation are:
1. This experiment was limited to only two spacing requirements. This was too narrow a
range to determine the optimum spacing requirement for broiler birds at Freeport High
School.
2. The number of birds reared were too few to make a generalized statement.
3. This trial was not replicated. This trial was only done at one time of the year and did
not take seasonality into account.
4. The results could have been affected by varying environmental conditions due to
inappropriate trial design.
38
REFERENCES
Aviagen. 2015. Ross Broiler Handbook. Huntsville, TN: Aviagen.
http://en.aviagen.com/assets/Tech_Center/Ross_Broiler/Ross-Broiler-Handbook-2014i-
EN.pdf (accessed January 23, 2017).
Cobb-Vantross. 2012. Cobb Broiler Management Guide. Siloam Springs, AK: Cobb-Vantross.
http://images.agri-profocus.nl/upload/cobb-broiler- management-guide-20121469468173.pdf
(accessed January 23, 2017).
Douglas, S. $1.2B Chicken Bill. Trinidad and Tobago Newsday, January 25, 2017.
Fairchild, B. D. 2005. Broiler Production Systems: The Ideal Stocking Density? The Poultry
Site.
http://www.thepoultrysite.com/articles/322/broiler-production-systems-the-ideal- stocking-
density/ (accessed January 23, 2017).
Hi-Pro Feeds. Undated. Broiler Management and Feeding Guide. Jamaica: Hi-Pro Farm
Supplies.
http://www.jamaicabroilersgroup.com/resources/our-operations/farming-manuals (accessed
January 25, 2017).
Hubbard. 2015. Hubbard Broiler Management Guide. Pikeville, TN: Americas Hubbard
LLC.
http://www.hubbardbreeders.com/media/hubbard_broiler_management_guide__078897700_
0945_07012015.pdf (accessed January 23, 2017).
Jacob, J., and T. Pescatore. 2012. How Much Will My Chickens Eat? Lexington: University of
Kentucky College of Agriculture, Food & Environment.
http://www2.ca.uky.edu/agcomm/pubs/asc/asc191/asc191.pdf (accessed January 13, 2017).
Ragoonanan, Sahadeo. 1994. CXC Agriculture. San Fernando, Trinidad: Caribbean
Educational Publishers.
Ramharracksingh, Ronald. 2011. Agricultural Science for CSEC Examinations. Oxford:
Macmillan Publishers.
Trinidad and Tobago, National Agricultural Market Information System. undated. Historical
Monthly Average Retail Prices 2016. National Agricultural Marketing and Development
Corporation. http://www.namistt.com/ (accessed January 11, 2017).
“Vitalyte”. ANUPCO Ltd. undated. http://export.anupco.com/Products/vitalyte/ (accessed
February 1, 2017).
Weever, F., J. J. L. M. Phillip-Neri, Y. McIntosh, N. Henery, W. Archer, L. Vickerie, and
E. O’D. Williams. 1998. Agricultural Science in Secondary Schools in Guyana Book 1.
Georgetown: Ministry of Education.
39
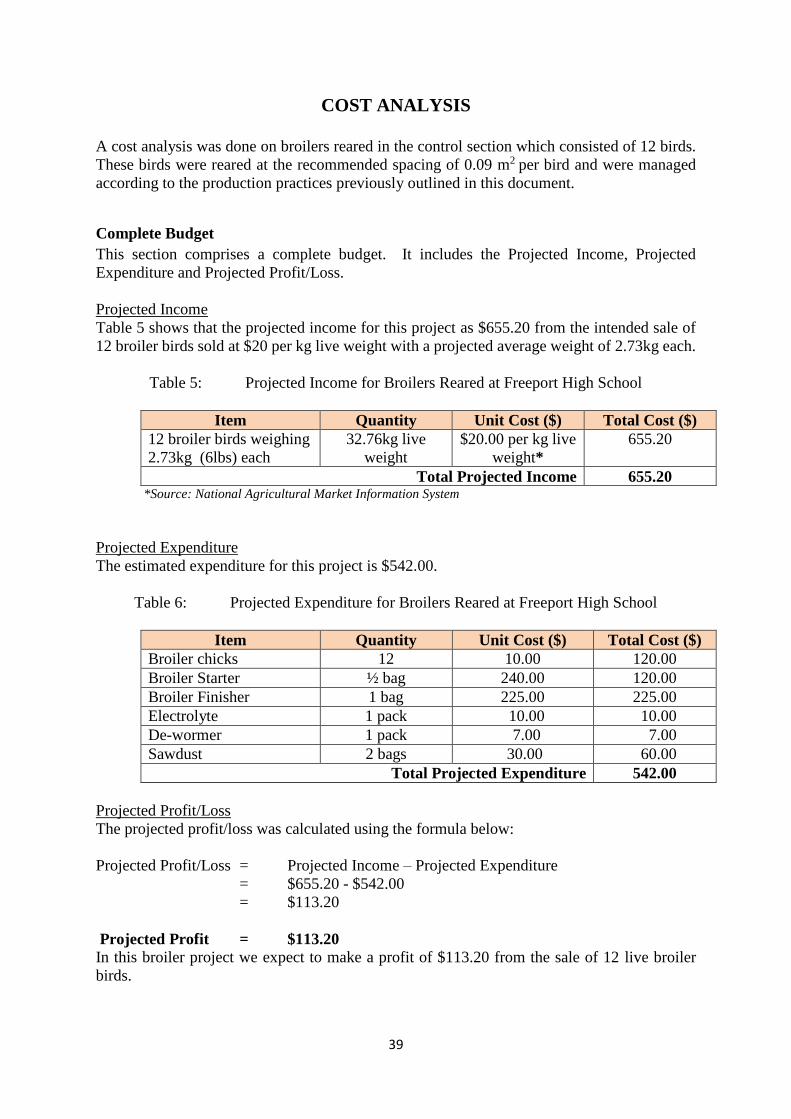
COST ANALYSIS
A cost analysis was done on broilers reared in the control section which consisted of 12 birds.
These birds were reared at the recommended spacing of 0.09 m2 per bird and were managed
according to the production practices previously outlined in this document.
Complete Budget
This section comprises a complete budget. It includes the Projected Income, Projected
Expenditure and Projected Profit/Loss.
Projected Income
Table 5 shows that the projected income for this project as $655.20 from the intended sale of
12 broiler birds sold at $20 per kg live weight with a projected average weight of 2.73kg each.
Table 5: Projected Income for Broilers Reared at Freeport High School
Item Quantity Unit Cost ($) Total Cost ($)
12 broiler birds weighing
2.73kg (6lbs) each
32.76kg live
weight
$20.00 per kg live
weight*
655.20
Total Projected Income 655.20 *Source: National Agricultural Market Information System
Projected Expenditure
The estimated expenditure for this project is $542.00.
Table 6: Projected Expenditure for Broilers Reared at Freeport High School
Item Quantity Unit Cost ($) Total Cost ($)
Broiler chicks 12 10.00 120.00
Broiler Starter ½ bag 240.00 120.00
Broiler Finisher 1 bag 225.00 225.00
Electrolyte 1 pack 10.00 10.00
De-wormer 1 pack 7.00 7.00
Sawdust 2 bags 30.00 60.00
Total Projected Expenditure 542.00
Projected Profit/Loss
The projected profit/loss was calculated using the formula below:
Projected Profit/Loss = Projected Income – Projected Expenditure
= $655.20 - $542.00
= $113.20
Projected Profit = $113.20
In this broiler project we expect to make a profit of $113.20 from the sale of 12 live broiler
birds.

40
Actual Income-Expenditure Statement
This section comprises the Actual Income, Actual Expenditure and the Actual Profit/Loss.
Actual Income
The actual income earned for this project was $403.20
Table 7: Actual Income for Broilers Reared at Freeport High School
Item Quantity Unit Cost ($) Total Cost ($)
12 broiler birds weighing
2.8kg each
33.6 kg live
weight
$12.00 per kg
live weight
403.20
Total Income 403.20
Actual Expenditure
The actual expenditure for this project was $572.00
Table 8: Actual Expenditure for Broilers Reared at Freeport High School
Item Quantity Unit Cost ($) Total Cost ($)
Broiler chicks 12 10.00 120.00
Broiler Starter ½ bag 240.00 120.00
Broiler Finisher 1 bag 225.00 225.00
Electrolyte 1 pack $10.00 10.00
De-wormer 1 pack $7.00 7.00
Sawdust 2 bags $20.00 40.00
Total Projected Expenditure 522.00
Actual Profit/Loss
In this project we made a loss of $118.80.
Actual Profit / Loss = Total Income – Total Expenditure
= $403.20- $522.00
= -$118.80
Actual Loss = $118.80
41
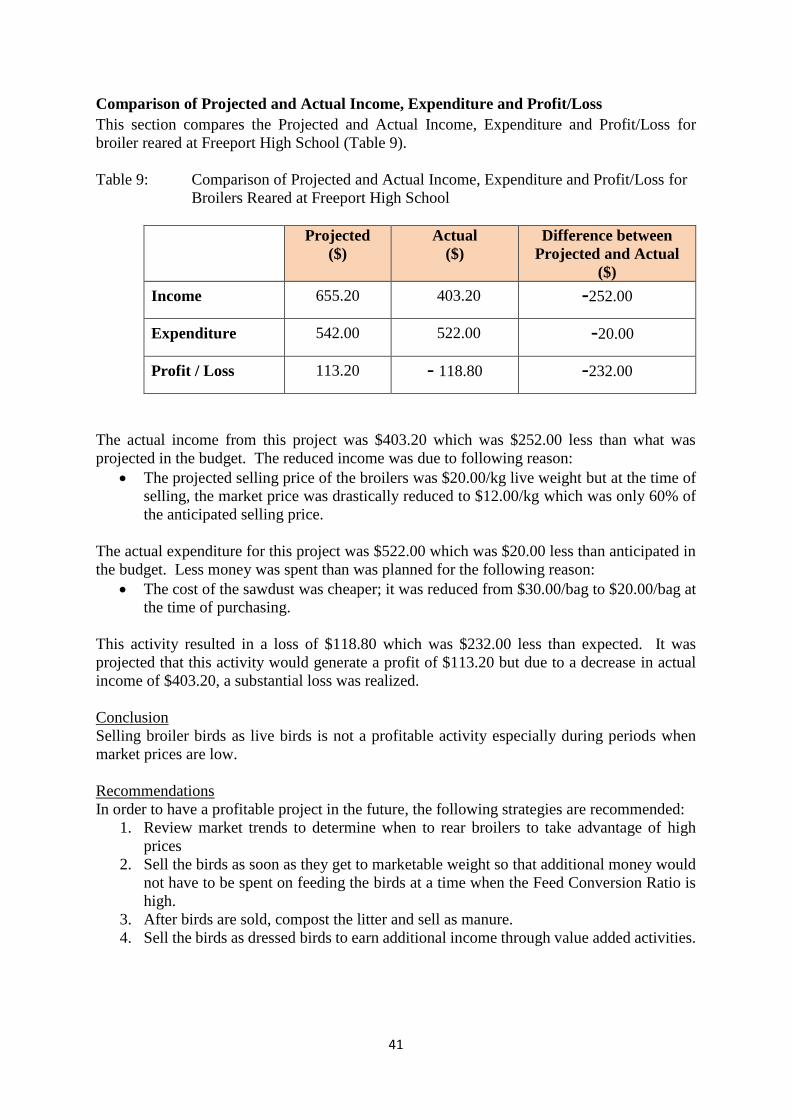
Comparison of Projected and Actual Income, Expenditure and Profit/Loss
This section compares the Projected and Actual Income, Expenditure and Profit/Loss for
broiler reared at Freeport High School (Table 9).
Table 9: Comparison of Projected and Actual Income, Expenditure and Profit/Loss for
Broilers Reared at Freeport High School
Projected
($)
Actual
($)
Difference between
Projected and Actual
($)
Income 655.20 403.20 -252.00
Expenditure 542.00 522.00 -20.00
Profit / Loss 113.20 - 118.80 -232.00
The actual income from this project was $403.20 which was $252.00 less than what was
projected in the budget. The reduced income was due to following reason:
The projected selling price of the broilers was $20.00/kg live weight but at the time of
selling, the market price was drastically reduced to $12.00/kg which was only 60% of
the anticipated selling price.
The actual expenditure for this project was $522.00 which was $20.00 less than anticipated in
the budget. Less money was spent than was planned for the following reason:
The cost of the sawdust was cheaper; it was reduced from $30.00/bag to $20.00/bag at
the time of purchasing.
This activity resulted in a loss of $118.80 which was $232.00 less than expected. It was
projected that this activity would generate a profit of $113.20 but due to a decrease in actual
income of $403.20, a substantial loss was realized.
Conclusion
Selling broiler birds as live birds is not a profitable activity especially during periods when
market prices are low.
Recommendations
In order to have a profitable project in the future, the following strategies are recommended:
1. Review market trends to determine when to rear broilers to take advantage of high
prices
2. Sell the birds as soon as they get to marketable weight so that additional money would
not have to be spent on feeding the birds at a time when the Feed Conversion Ratio is
high.
3. After birds are sold, compost the litter and sell as manure.
4. Sell the birds as dressed birds to earn additional income through value added activities.

42
References
Trinidad and Tobago, National Agricultural Market Information System. undated. Historical
Monthly Average Retail Prices 2016. National Agricultural Marketing and Development
Corporation. http://www.namistt.com/ (accessed January 11, 2017).
43
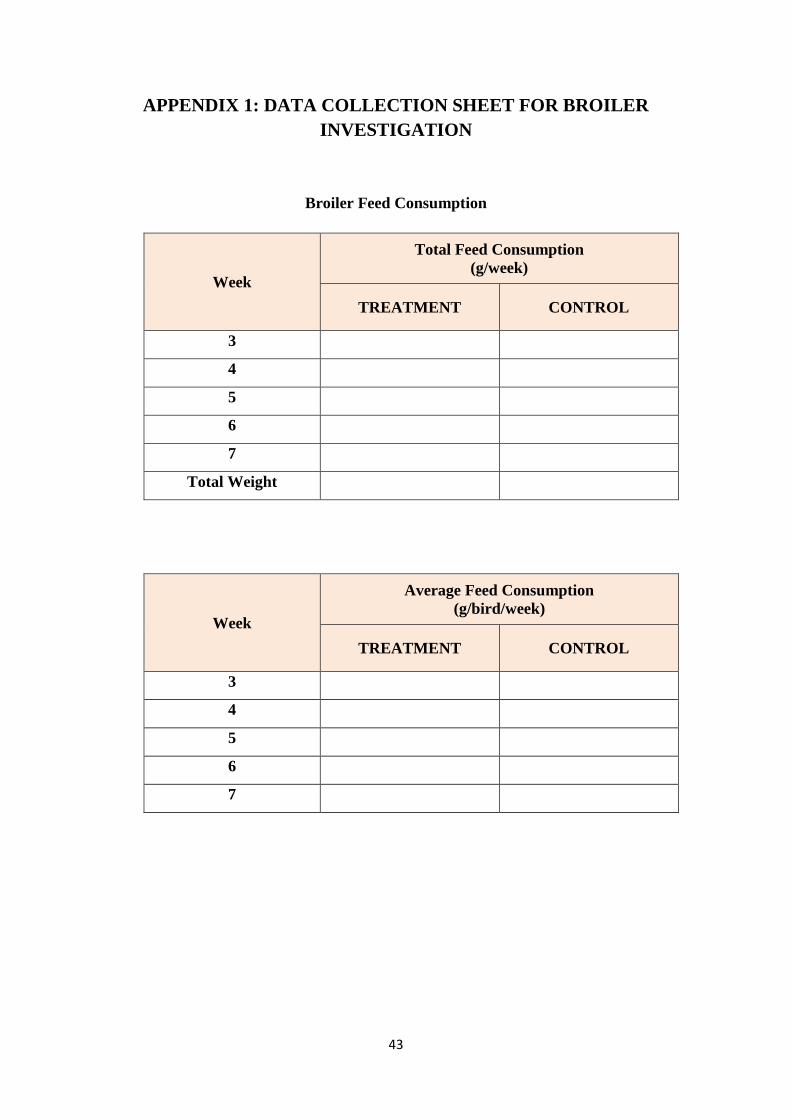
APPENDIX 1: DATA COLLECTION SHEET FOR BROILER
INVESTIGATION
Broiler Feed Consumption
Week
Total Feed Consumption
(g/week)
TREATMENT CONTROL
3
4
5
6
7
Total Weight
Week
Average Feed Consumption
(g/bird/week)
TREATMENT CONTROL
3
4
5
6
7
44
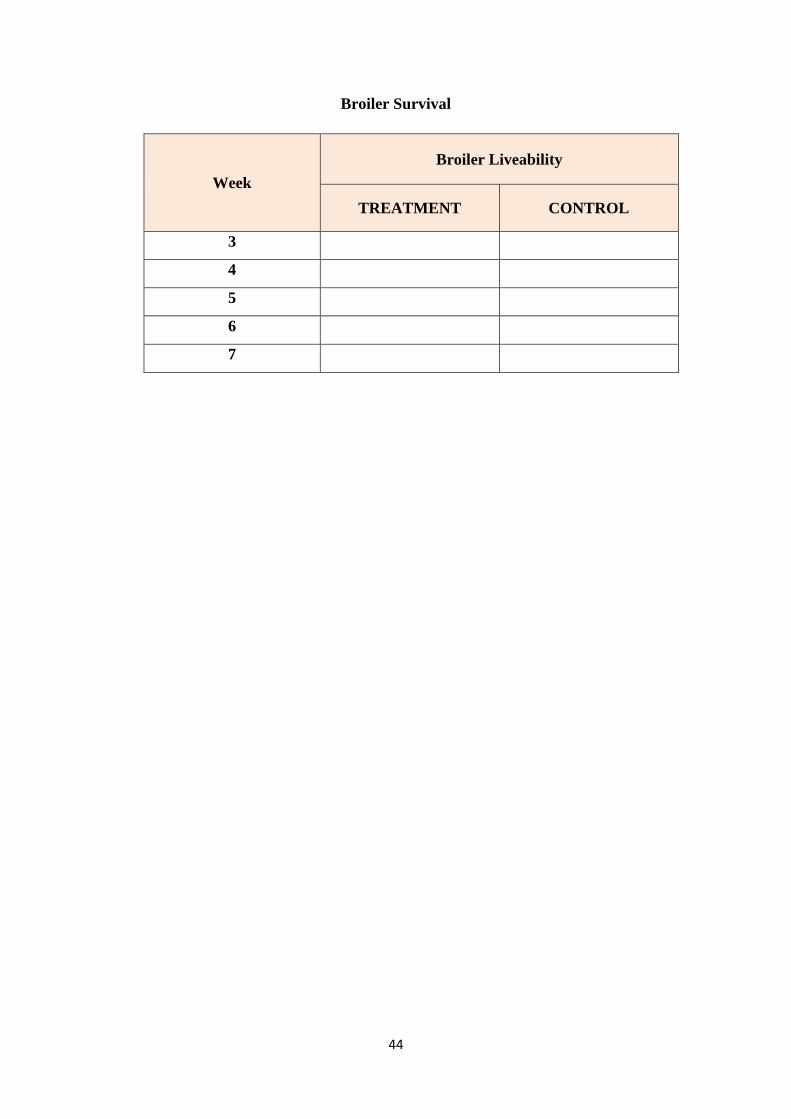
Broiler Survival
Week
Broiler Liveability
TREATMENT CONTROL
3
4
5
6
7
45
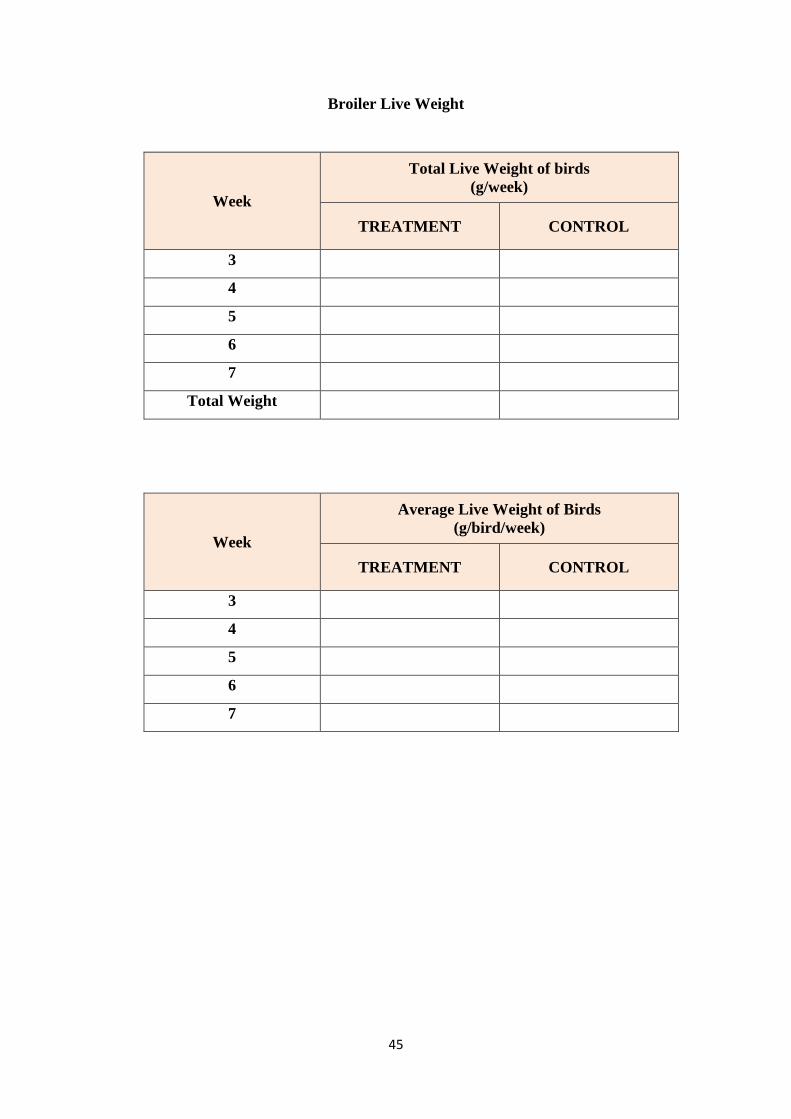
Broiler Live Weight
Week
Total Live Weight of birds
(g/week)
TREATMENT CONTROL
3
4
5
6
7
Total Weight
Week
Average Live Weight of Birds
(g/bird/week)
TREATMENT CONTROL
3
4
5
6
7

46
APPENDIX 2: DRAFT MARK SCHEME FOR LIVESTOCK INVESTIGATION
Item Descriptor Marks
Total Awarded
Introduction
(2)
Name of Student - -
Student Registration Number - -
Name of School - -
Title of Project - -
Start Date - -
End Date - -
Table of Contents - -
Problem Statement clearly written 1
Hypothesis clearly written - -
Aim clearly written 1
Methodology
(6)
Accurate List of Materials, Tools and Equipment Used 1
Valid Experimental Design 1
Data Collection 1
Production
Practices /
Activities (2)
5 or more activities described 2
1 to 4 activities described 1
No activities described 0
3 or more photographs showing student engaged in this
investigation 1
Results
(4)
Collected relevant data 1
Presentation of Results – appropriate format used 1
Interpretation of
results (2)
Fully interprets results 2
Partially interprets results 1
Did not attempt to interpret results 0
Discussion
(3)
Fully discussed findings with reference to relevant supporting
literature 3
Partially discussed findings with reference to relevant
supporting literature 2
Discussed finding with no supporting literature 1
Did not attempt to discuss findings 0
Conclusion, Limitation &
Recommendations
(3)
Conclusion 1
Limitations 1
Recommendations for improvement 1
Presentation (1) Less than 5 spelling and grammatical errors contained in the
report 1
References (1) At least 2 references properly cited 1
TOTAL (Investigative Report) 20 ÷ 2
= 10
… ÷ 2
= ….
Cost Analysis
(10)
Complete Budget
Projected Income – output, price, total 1
Projected Expenditure – inputs, price, total 1
Surplus/Shortfall correctly calculated 1
Actual Income &
Expenditure
Income/Sale of Produce – quantity, price,
total 1
Expenditure – quantity, price, total 1
Surplus/Shortfall correctly calculated 1
Comparison of
Projected and Actual
- Income
- Expenditure
- Surplus/shortfall
Provides a full and accurate comparison of
all 3 parameters 4
Partially compares all 3 parameters 3
Correctly compares any 2 parameters 2
Correctly compares any 1 parameter 1
Did not attempt to compare any parameter 0
TOTAL (Cost Analysis) 10

47