CSE Working Paper
25
Centre for Sustainable Employment cse.azimpremjiuniversity.edu.in CSE Working Paper 2019-06 The Size Structure of India's Enterprises: Not Just the Middle is Missing Santosh Mehrotra and Tuhinsubhra Giri December 2019
Transcript of CSE Working Paper

Centre for Sustainable Employmentcse.azimpremjiuniversity.edu.in
CSE Working Paper2019-06
The Size Structure of India's Enterprises: Not Just the Middle is Missing
Santosh Mehrotra and Tuhinsubhra GiriDecember 2019

P a g e | 1
The Size Structure of India’s Enterprises: Not just the middle is missing
Santosh Mehrotra and Tuhinsubhra GiriCenter for Informal Sector and Labour Studies,
Jawaharlal Nehru University, New Delhi
Most international development economics and industrial organization literature emphasisesthe importance of SMEs (small and medium enterprises) as important to output, butespecially to employment generation. Countries have different definitions for SMEs. In Indiathe MSMEs (micro, small and medium enterprises) are defined in terms of investment inplant and machinery or equipment. The MSME Ministry (Annual Report, Government ofIndia 2017–18) stated that the sector accounts for 45% of the manufacturing output and 40%of the total exports of the country; also that MSMEs accounted for 30.74% of GDP in 2014–15. Not surprising, MSMEs are considered a driving force of the economy.
Due to the predominance of tiny enterprises and informality in the industrial sector it is verydifficult to harness the economies of scale, adopt new technologies and regular upgradation.It is often found that the main challenge for many SMEs is to cultivate right skills andmanagement practices for establishing and integrating knowledge created by external partnerswith in-house practices and innovation processes (OECD 2013). Given that economies ofscale go hand in hand with higher productivity, the predominance of micro-enterprises in anyeconomy can prove to be a barrier to growth. There is a body of literature in developingcountries that notes that in the size distribution of enterprises in the non-agricultural sector,there is often a ‘missing middle’.
There are many studies of a missing middle situation in developing economies. The notionthat the distribution of firm size in poor countries is characterized by a bimodal distributionwith a ‘missing middle’ is a widely accepted fact in development economics (Krueger, 2013).The idea of the missing middle is that there are a large number of small firms, some largefirms, but very few medium-sized firms.
Dhar and Lydall (1961) were the first to observe missing middle in the data, the thin share ofemployment size class 50 to 499 in Indian manufacturing employment.
Tybout (2000) also finds that a large portion of small-sized and middle category is missing inpoor countries, and then argues that strict business regulation could be a reason for too manysmall firms. Hsieh and Olken (2014) argued that this is a misconception, and questionedTybout’s conclusion. However, Tybout (2014) revisited his study and justified the existenceof a ‘missing middle’ by comparing the size categories of firms. He argued that the share ofmedium-sized firms compared to small or large firms is smaller than the share one wouldobserve in an undistorted economy. The literature on firm size distribution suggests it isreasonable to approximate the undistorted cumulative size distribution as Pareto optimal.Tybout (2014) analysed the same data of Hsieh and Olken (2014) to understand the sizedistribution of firms. Then, the general tendency toward small scale production in poor

P a g e | 2
countries can be crudely controlled for by allowing the shape parameter k to vary acrosscountries, with a larger value for k implying a smaller size distribution. The value of k in hispaper appeared 1.43 for India, 1.08 for China and US both. That means there is no missingmiddle in China and USA. But India’s medium category is less populated.
Mazumdar (2003) and Mazumdar and Sarkar (2008) also find that size distribution of Indianfirm is characterised by a dense concentration of very small enterprises i.e. micro and a‘missing middle’. Mazumdar and Sarkar (2013) in their recent comparative study aboutmanufacturing firms in Asia shows that the size group of 6-49 workers accounts for morethan 55 percent of total non-household manufacturing in 2005. The share of large firms withmore than 500 workers was close to 20 percent and the remaining 25 percent is the share ofsize group with 50-499 workers in the same year. Another study also estimated that around 85percent people are employed in enterprises with less than 50 workers including OAEs in totalmanufacturing employment picture(Hasan and Jandoc, 2013). This dualistic size structure inmanufacturing has remained unchanged over the last two decades. Labour regulations is oneof the factors which can affect firm size and their distribution. More flexible labour regulationtend to go hand in hand with larger sized firms for mostly labour intensive industries.
However, Nagaraj (2018) has argued that there is no missing middle in India. He only drawsupon organised sector firms’, using data from Annual Survey of Industries (ASI). We believeit is necessary to take a holistic approach to see the true picture of different firm sizecategories, both organized as well as unorganized.
The India Wage Report (ILO, 2018) shows that low pay and wage inequality remain a seriouschallenge to India’s path to achieving inclusive growth. Nearly half of the workforce are self-employed in India, which is a source of low earnings. However, a stable wage employment(rather than self-employment) is a doorway to the middle class (Banerjee and Duflo 2008).
In this paper we have tried to merge the data on all of India’s registered as well asunorganised enterprises to figure out the exact size of the MSME sector (number ofenterprises by size of employment) and their size distribution (micro, small, medium andlarge) according to the definition of MSMED Act 2006 (given by ministry of MSME). Weargue that it’s not only the middle which is missing. Small firms are also missing from theIndian industrial sector.
The paper is organized as follows. Section 1 spells out the definitions and data sources.Section 2 depicts the picture of the size distribution of India’s non-agricultural enterprisestructure -formal and informal both. Section 3 presents the state wise distribution ofunorganised enterprises. Section 4 offer some concluding remarks.
1. Data Sources and definitions
We examine both formal and informal sector enterprises in this paper. To assess the sizestructure of the whole industrial sector it is necessary to analyse both ASI data and National

P a g e | 3
Sample Survey (NSS) data. Hence, the data sources for this paper are the ASI and NSSO unitlevel data for the organized and unorganised sector respectively. We use a combined data setthat includes formal and informal firms in India. The Annual Survey of Industries conductedby the Central Statistical Organisation, Ministry of Statistics and Programme Implementation(ASI) gathers information on “registered”, or formal sector firms that are covered by(Sections 2m(i) and 2m(ii) of) the 1948 Factories Act and firms registered in the 1966 Bidiand Cigar Workers Act—particularly (i) those firms that use electricity and hire more than 10workers; and (ii) those that do not use electricity but nevertheless employ 20 or moreworkers. It also covers certain utility industries such as power, water supply, cold storage, andthe like. Units with 100 or more workers are all counted, and a census of such enterprises iscaptured in the ASI, as they are completely enumerated, while the rest (<100 workers) aresampled and their survey is based on a predetermined sampling design.
Unorganised or informal sector firms are not covered by the ASI. NSSO Survey ofUnorganised Manufacturing Enterprises covers those, and hence two rounds (2010-11 and2015-16) have been used for our analysis. NSS unorganised surveys are follow-ups to thedifferent Economic Censuses. NSS uses Economic Census as their sampling frame.
The Ministry of Micro, Small and Medium Enterprises the Government of India has enactedthe Micro, Small and Medium Enterprises Development (MSMED) Act, 2006 in terms ofwhich these enterprises are defined. The MSMEs are classified in two classes:1. Manufacturing Enterprises: the enterprises engaged in the manufacture or production ofgoods pertaining to any industry specified in the first schedule to the Industries (Developmentand Regulation Act, 1951) or employing plant and machinery in the process of value additionto the final product having a distinct name or character or use. The size of ManufacturingEnterprises is defined in terms of investment in Plant & Machinery.2. Service Enterprises: the enterprises engaged in providing or rendering of services and aredefined in terms of investment in equipment.The limit for investment in plant and machinery / equipment for manufacturing / serviceenterprises is as under:
Table.1: Defining Micro, Small and Medium Enterprises: Thresholds for Plant &Machinery
Type of EnterprisesManufacturing Sector Service Sector
Investment in plant & machinery Investment in plant & equipmentMicro Enterprises Don’t exceed 25 lakh rupees Don’t exceed 10 lakh rupees
Small Enterprises More than 25 lakh rupees but doesn’texceed 5 crore rupees
More than 10 lakh rupees butdoesn’t exceed 2 crore rupees
Medium Enterprises More than 5 crore rupees but doesn’texceed 10 crore rupees
More than 2 crore rupees butdoesn’t exceed 5 crore rupees
Source: The MSMED Act, 2006, Ministry of MSMEs

P a g e | 4
We have used mainly four data sets i.e. NSS unorganised survey rounds unit level data (73 rd
in 2015-16 and 67th in 2010-11) and ASI databases (2010-11 and 2014-15 unit level data).The NSS is used for unorganised sector data, and for organised sector ASI has been used.
Other than these two data sources, there are two other databases on industries: MSME Censusdata and Centre for the Monitoring of the Indian Economy (CMIE) Prowess database. Wehave not used the latter two for this study. This is because the last MSME census which isavailable is 4th MSME census 2005-06 and the data was published in 2011. After that there isno MSME census data available. And CMIE Prowess database is mainly for companieswhich are registered in the share market. Therefore we used only NSS unorganised surveyrounds and ASI database for this study.
Sometimes there is a confusion about enterprises in formal/registered sector andinformal/unorganised sector. We should clarify that the Unorganised sector is not entirelyoverlapping with what is called the unregistered sector. In the NSS unorganised surveyrounds there are enterprises which can be small registered enterprises under Shops andEstablishment Act, or the Municipal corporation/Panchayat/local body, VAT/sales tax,Employee Provident Fund Act, the Employees State Insurance Corp. Act, and/or registeredwith SEBI/stock exchanges and any other specific act or authorities. So, the unorganisedsector consists of mostly unregistered enterprises and some registered enterprises under somespecific act or authorities other than Factories Act (which are being captured under the ASI).Firms captured under the ASI, on the other hand, are all registered/formal firms underSections 2m(i) and 2m(ii) of the 1948 Factories Act and firms registered in the 1966 Bidi andCigar Workers Act—particularly (i) those firms that use electricity and hire more than 10workers; and (ii) those that do not use electricity but nevertheless employ 20 or moreworkers. Therefore, it is evident that there is no overlapping or double counting between NSSand ASI datasets.
The National Sample Survey Rounds on the Unorganized SectorWe use two different rounds of the NSS specific survey that examines the unorganized sector.The specifics of these two rounds are explained in Table 2.

P a g e | 5
Table 2: NSS unorganised sector rounds: 73rd (2015-16) and 67th (2010-11) NSS rounds Brief data handling remarks 73rd unorganised enterprise round 2015-16 Estimated number of enterprises 63 million
In this round NSS provided data on
investment in plant & machinery, and did itfor each of the MSME categories in thedataset for the first time.
67th unorganised enterprise round 2010-11 Estimated number of enterprises 57 million. MSME categorization is not given in the
database To enable us to analyse trends about size
structure of enterprises between, 2011 and2016, we had to categorize the enterprises.So we have used the investment in plant andmachinery variable for both manufacturingand services sector firms.
Though according to MSME definition for
manufacturing firms plant and machineryshould be considered and for services firmsplant and equipment should be considered,but plant and equipment variables are notavailable in the dataset of 2010-11, so wehave used plant & machinery for all themanufacturing and services enterprises.
Annual Survey of Industries 2014-15 & 2010-2011The second source used is two years of the CSO’s Annual Survey of Industries, for 2010-11 and 2014-15, the laterr one being the latest for which unit-level data are available. Inthem, only operational enterprises were taken into consideration. ASI mostly coversmanufacturing units and manufacturing process (very small in number). However, theproblem is that in the ASI, almost 40 percent of firms have missing values in respect ofinvestment in the plant and machinery variable over the years. Hence, we used theremaining 60% of enterprises in the ASI database to categorize ASI firms in terms ofnumber of employees in each firm. Categorization as follows in Table 3.
Table.3: Defining Organized Manufacturing Firms by Size of Employment Categories Number of employees (Nos.) Micro <10 Small 10 to <20 Medium 20 to <100 Large >=100

P a g e | 6
We need to explain how we arrived at this particular size distribution, and why we are callingthem micro, small, or medium. We should explain that ASI does not classify firms by thecategories – Micro, Small and Medium – but NSSO’s unorganized sector survey does. So wetried to discover what might be the number of employees in organized sector firms if we wereto apply the Plant & Machinery thresholds that are used in the NSSO surveys to the ASI firms(even though the latter belong to the organized sector, while the former do not). We foundthat the plant & machinery based-definition corresponds quite strongly with the category-ranges for M-S-Ms for the number of workers shown above in Table 3. Since in this paperour attention is focused on MSMEs, we needed a common definition across the organized andunorganized categories in terms of number of employees.
2. India’s Non-agricultural Enterprise Structure:Formal & Informal MSMEs
Over 1950 to 1980, slow GDP growth pace was accompanied by a growth strategy dependentupon heavy-industry first, combined with reservation of products for small firms with theobjective of generating employment. The set of products reserved for small enterprises hadgrown, and consisted of more than 1200 products at the beginning of reform in 1991. Overthe years the number of reserved products was reduced to 500 by 2005, but it took more thanfifty years to end this. This has led to the emergence of underdeveloped informal firms andemploying informal workers, all operating in a low-level equilibrium trap of low wages –low-technology-low productivity (Mehrotra, 2020). On the other side too many labour laws fororganised or formal sector firms did not help; hardly any laws applied to the unorganizedsector. This lowered the demand for workers in formal sector.
Labour laws and regulations of India are very complex for firms. When any firms go from sixworkers to seven workers, the Trade Workers Act kicks in. When this number goes from nineto ten, the Factories Act is to be implemented. When firms go from 19 to 20 workers, theEmployees Provident Fund Act kicks in and if the firm adds one more worker after 99, andgoes to 100 workers, the Industrial Disputes Act gets triggered. The Industrial Disputes Actsays that if you are a manufacturing firm with 100 workers or more, you cannot dismiss anyof them under any circumstances unless you get prior approval from the state government.This is rarely given and it applies even if you go bankrupt, in which case the firm still has topay the workers. This is an additional reason why Indian firms have remained so small onaverage (Panagariya, 2013).
In this study we tried to capture the whole picture of formal and informal sector. Table 4presents the total universe of India’s non-agricultural enterprises. In Indian parlance,enterprises that employ less than 10 workers are considered as unorganized sector units,while those employing more than 10 workers are regarded as organized. What jumps out atthe reader is the scale of informality among India’s enterprise structure. India has 63.56 mnenterprises, informal (unorganized) and formal (organized) taken together in the non-agricultural economy. Around 30 percent enterprises are registered in both years (2015-16

P a g e | 7
and 2010-11) under any act or authority. There is no change in the share of registeredenterprises in informal sector over the years.
Another finding from Table 4 is that 99.7 percent enterprises are in the unorganized sectorand this share is constant over these two points of time i.e. 2015-16 & 2010-11. Of these two-thirds are not registered anywhere – which is a serious problem from the perspective of thepolicy maker, since that makes it difficult to extend services to them, if the state was desirousto do so.
What is most notable is how small is the total number of registered/ formal sector firms: only0.3 percent in total or only 1.7 laks in number. It has been well known that the informal sectoris much bigger than registered sector. Therefore, this study later on focuses mainly on theinformal sector size distribution of MSMEs. One could argue that India’s informal sector isthe backbone of the economy after agriculture. Table.4: Total Number of Enterprises in organised and unorganised sector in 2010-11 & 2015-16
ParticularsNumber of Enterprises
(Nos.)Share (%)
2010-11 2015-16 2010-11 2015-16
Unorganised(NSS)
Registered under any act/authority 16,826,639 19,592,554 29.1 30.8Unregistered 40,846,606 43,799,421 70.6 68.9Total 57,673245 63,391974 99.7 99.7
Registered under Factories act,companies act or other (ASI)*/
Formal 167.964 173,640 0.3 0.3Total 57,841,209 63,565,614 100 100
Source: Annual survey of Industry Unit level data of 2014-15, Annual survey of Industry Unit level data of2010-11, 73rd round NSSO Unincorporated Non-Agricultural Enterprises (Excluding Construction) survey 2015-16 unit level data & 67th NSS Unincorporated Non-Agricultural Enterprises (Excluding Construction) survey2010-11 unit level data*since still now ASI 2015-16 data is not available, we have used ASI 2014-15
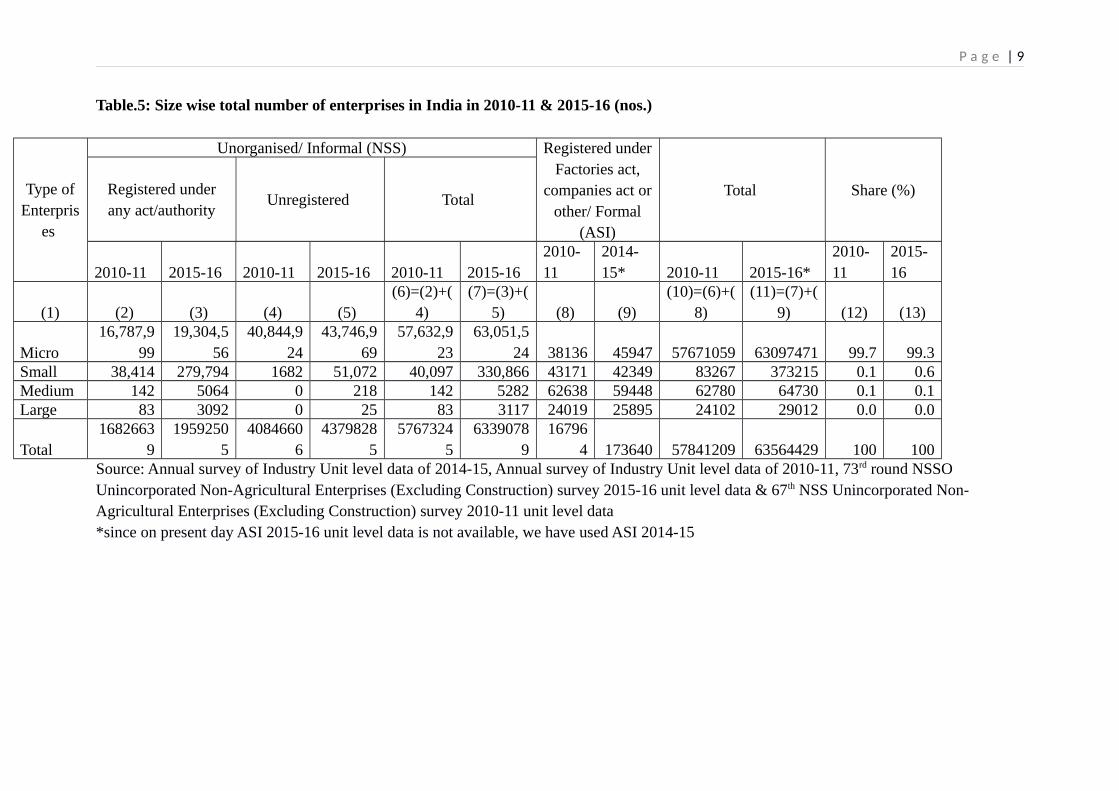
Table 5 shows the size of the formal and informal sector according to MSME categories. Themicro enterprises share and numbers is overwhelmingly large. What we do know (though notshown in the table) is that 84% of the micro-enterprises are actually own-account enterprises(OAEs), without hired labour, or let us say household enterprises. An estimated 93% of themicro-enterprises have less than 5 employees.
There is a nearly 10x increase in the number of small enterprises, in the unorganized units(Table 5). Within unorganized units, the number of small enterprises in 2010-11 and 2015-16does increase quite sharply in absolute terms, both among the registered as well as theunregistered unorganized sector. But their share is still marginal in 2015-16, as it was in2010-11: from 0.1 to 0.6 per cent of all unorganized enterprises.

P a g e | 8
Of the 63 mn MSMEs, barely 0.38 mn are small and medium. Naturally, their contributionwould be very limited in the growth story. What is notable is that between 2010-11 and2015-16 the number of registered (under Factories Act) units that are small has actuallyshrunk slightly, as have medium sized enterprises. However, the small firms among theunregistered just exploded in numbers, from 1682 to 51072 over the same period. But at thesame time, the unorganized small units (registered under any Act/authority) has alsoincreased from 38 414 to 279 794. The increase in number over just five years is too large tobe explicable; so we found, on careful examination, that the number of acts under whichregistration was permitted had increased between 2010-11 and the 2015-16 NSS Surveys;that is what explains the unprecedented rise in the registered category (see Table 6 for Acts,and Annex 1 table for the list of additional Acts under which registration is permitted), thoughnot in the unregistered category. This large rise needs further investigation before it can beexplained.
Medium enterprises have also seen a rise, but that rise seems reasonable, even though it ishighly likely that the sharp increase among small enterprises that we see between the twoperiods in the ‘registered’ category is also large. This too is likely to have happened due tonew acts being included. It is notable that for registered enterprises under the Factories Act(based on data from the Annual Survey of Industries), there is a fall in the number ofenterprises.
If we examine the registered firms under the Factories Act (columns 8 and 9) there is somegrowth, but here too the growth in number of firms is accounted for by micro firms, not thesmall or medium categories. If anything, small and medium firms actually shrink in numberover that five year period. The number of large firms grows only a little. Table 4 depicts the whole picture of the size distribution of MSMEs, both formal andinformal sector. Size distribution of formal sector firms is nearly normally distributed.Whereas informal sector size distribution is distinctly skewed to left, with a concentration ofmicro firms. The share of registered formal sector firms from Table 3 is only 0.3 percent andinformal sector firms account for 99.7 percent share of all firms. The registered formal sectorfirms have been analysed in several studies, but informal firms have been overlooked. Theinformal firms’ size distribution should be analysed more closely.
P a g e | 9
Table.5: Size wise total number of enterprises in India in 2010-11 & 2015-16 (nos.)
Type ofEnterpris
es
Unorganised/ Informal (NSS) Registered underFactories act,
companies act orother/ Formal
(ASI)
Total Share (%)Registered underany act/authority
Unregistered Total
2010-11 2015-16 2010-11 2015-16 2010-11 2015-162010-11
2014-15* 2010-11 2015-16*
2010-11
2015-16
(1) (2) (3) (4) (5)(6)=(2)+(
4)(7)=(3)+(
5) (8) (9)(10)=(6)+(
8)(11)=(7)+(
9) (12) (13)
Micro 16,787,9
9919,304,5
5640,844,9
2443,746,9
6957,632,9
2363,051,5
24 38136 45947 57671059 63097471 99.7 99.3Small 38,414 279,794 1682 51,072 40,097 330,866 43171 42349 83267 373215 0.1 0.6Medium 142 5064 0 218 142 5282 62638 59448 62780 64730 0.1 0.1Large 83 3092 0 25 83 3117 24019 25895 24102 29012 0.0 0.0
Total1682663
91959250
54084660
64379828
55767324
56339078
916796
4 173640 57841209 63564429 100 100Source: Annual survey of Industry Unit level data of 2014-15, Annual survey of Industry Unit level data of 2010-11, 73rd round NSSO Unincorporated Non-Agricultural Enterprises (Excluding Construction) survey 2015-16 unit level data & 67th NSS Unincorporated Non-Agricultural Enterprises (Excluding Construction) survey 2010-11 unit level data*since on present day ASI 2015-16 unit level data is not available, we have used ASI 2014-15

P a g e | 10
From Table 4 we have also seen that like the formal sector firms registered under the Factoryact, informal sector or unorganised sector firms are also registered under other acts orauthorities i.e. 29.1 percent in 2010-11 and 30.8 percent in 2015-16, which is pretty goodnumber for informal sector. The acts or authorities under which informal sector firms are registered have been shown inthe following Table 6. There are some inclusions and exclusions of acts and authoritiesbetween these two points of time between NSS rounds (Table 6).
Table.6: Registration Act/ authorities of unorganised firms
Particulars Number of Enterprises
2010-11 2015-16Shops and Establishment Act 3772223 4270136Municipal Corporation/Panchayats/ Local Body 9904106 12678481Vat /Sales Tax Act 1830626 2383199Provident Fund Act 72974 91159Employees State Insurance Corporation Act 64720 61390Registered with SEBI/ Stock Exchange? 13039any other industry-specific Act/ Authority 1181990 95150Total registered 16826639 19592554Total unregistered 40846606 43799421Total 57673245 63391974Source: 73rd round NSSO Unincorporated Non-Agricultural Enterprises (Excluding Construction) survey 2015-16 unit level data & 67th NSS Unincorporated Non-Agricultural Enterprises (Excluding Construction) survey 2010-11 unit level data*Any other industry specific Act/ Authorities are depicted in Annexure Table
Registration under these acts or authorities of informal sector firms is a mere formality, notparticularly effective. It is also not synonymous to formalisation. These acts or authoritiesonly register about 30 percent of the unorganised firms. Formalisation under Factory Actregistration tends to assure social security benefits and other benefits in the firms. Butregistration under these other acts or authorities are only for simple registration, but the firmsremain the same as before such registration. Some small incentives for any State/ CentralGovernment exhibitions or fairs, early access of benefits from any government schemes andavailing credit from banks can be gained by these type of registration of informal firms (asubject we return to in the last section).
Rather than speaking about a bimodal distribution or missing middle drawing on the earlierliterature, it is better to measure the share of the small and medium sized firms as opposed tomicro and large firms. Figure 1 depicts several hypothetical plant size distributions thatshows the notion of missing small and middle. The solid line shows an undistorted ideal firmsize distribution of developing economies and dotted line exhibits the missing small andmedium sized firms in India. The dotted line depicts the preponderance of micro firms, but itcan clearly be seen that small and medium categories are missing from the picture.

P a g e | 11
Figure.1: An hypothetical illustration of missing small and medium sized firms in the distribution
Missing Small and Medium Sized Firms
India's Firm Distribution
x
f(x)
Productivity of firms: registered versus unorganized
There are significant productivity differences between small and large establishments.Technical change and returns to scale can be the factors for productivity differentials betweenthese two (Taymaz, 2002). Productivity is one of the main indicators of performance. In Table7 we can see that formal sector firms have a higher productivity compared to informal ones.Micro formal firms have a higher productivity than informal ones. The larger the firm thehigher is the productivity.
Table.7: Average productivity of organised and unorganised firms in 2010-11 & 2015-16 (in Rupees per worker)
Type of Firms Average Productivity
Formal (ASI) Informal (NSS)2014-15 2010-11 2015-16 2010-11
Micro 517046 423692 86700 60544Small 363091 322278 237617 227340Medium 515499 390445 302148 204050Large 664897 610926 308089 275503Total 540007 411811 91728 61091Source: Annual Survey of Industries, Unit level data of 2014-15 and 2010-11, 67th and 73rd round NSSO Unincorporated Non-Agricultural Enterprises (Excluding Construction) survey 2015-16 unit level data Note:- Productivity calculated as GVA divided by the number of workers. GVA and productivity calculations hasbeen done after deflating the figures with WPI values (2011-12=100 as the base)

P a g e | 12
What is noticeable is that the formal micro firms have a higher productivity than the largerfirms in the formal sector. This needs an explanation. One possible reason is that micro firmsare particularly inclined to understate the number of their workers. They are unlikely to beinspected or audited, given how numerous they are. So the reported numbers in micro firmslisted in the ASI might be actually much smaller than the actual number employees workingin the enterprise.
2.1. Own Account Enterprises and Other Categories
Own account Enterprises (OAEs) comprise of tiny firms which are not even hiring oneworker. A major portion of unorganised/informal sector firms is OAEs. The share of OAEs isimportant since it can guide policies on employment generation and industrial development.It can also help to determine whether the emphasis of policy should be on micro enterprisesgrow or on the hurdles to operating larger enterprises (Mel, McKenzie, and Woodruff, 2008).
In Table 8, we find that in urban areas OAEs are 76.8 percent of all firms in 2010-11 and76.6 percent of firms in 2015-16, while the OAEs are 91.4% of all rural firms. No changehas been seen as just over 84.6 percent in 2015-16 are OAEs. This predominance of OAEs inrural and urban is the underlying symptom of, and a reason for, the widespread poverty in thecountry.
Table.8: Unorganised/ informal sector : Share of Own account enterprises (OAE) in total enterprises by rural and urban location, 2010-11 & 2015-16
SectorsOAE (nos.) Total (nos.) Share (%)
2010-11 2015-16 2010-11 2015-16 2010-11 2015-16Rural 28,245,998 29,695,861 30,891,074 32,489,670 91.4 91.4Urban 20,564,428 23,663,446 26,782,171 30,902,305 76.8 76.6Total 48,810,426 53,359,308 57,673,245 63,391,974 84.6 84.2Source: 67th and 73rd round NSSO Unincorporated Non-Agricultural Enterprises (Excluding Construction) survey 2015-16 unit level data
OAE’s high share led us to examine the sector according to number of workers. We havecategorised the unorganized sector firms into four categories i.e. OAEs, firms having 1-5workers (non-directory establishment), firms having 6-9 workers (directory establishment)and firms having 10 & more workers. Other than OAEs, firms are found mostly in thecategory that employ 1-5 workers i.e. 12.6 & 13.3 percent in 2010-11 & 2015-16respectively. A slight increase is seen in the category of firms having 1-5 workers.
The above table calculated with the given definition of ministry of MSME. NSS also earliergave these two groups in the dataset i.e. non-directory establishment and directoryestablishment. So Table 9 has been computed in terms of size of the employment. But there isnot much difference in the picture as the share of firms in these categories have not changedmuch between 2010-11 to 2015-16.
P a g e | 13
Table.9: Non-Agricultural enterprises in Unorganized sector: Size distribution by Number of firms, 2010-11 and 2015-16
Firm categories2010-11 2015-16
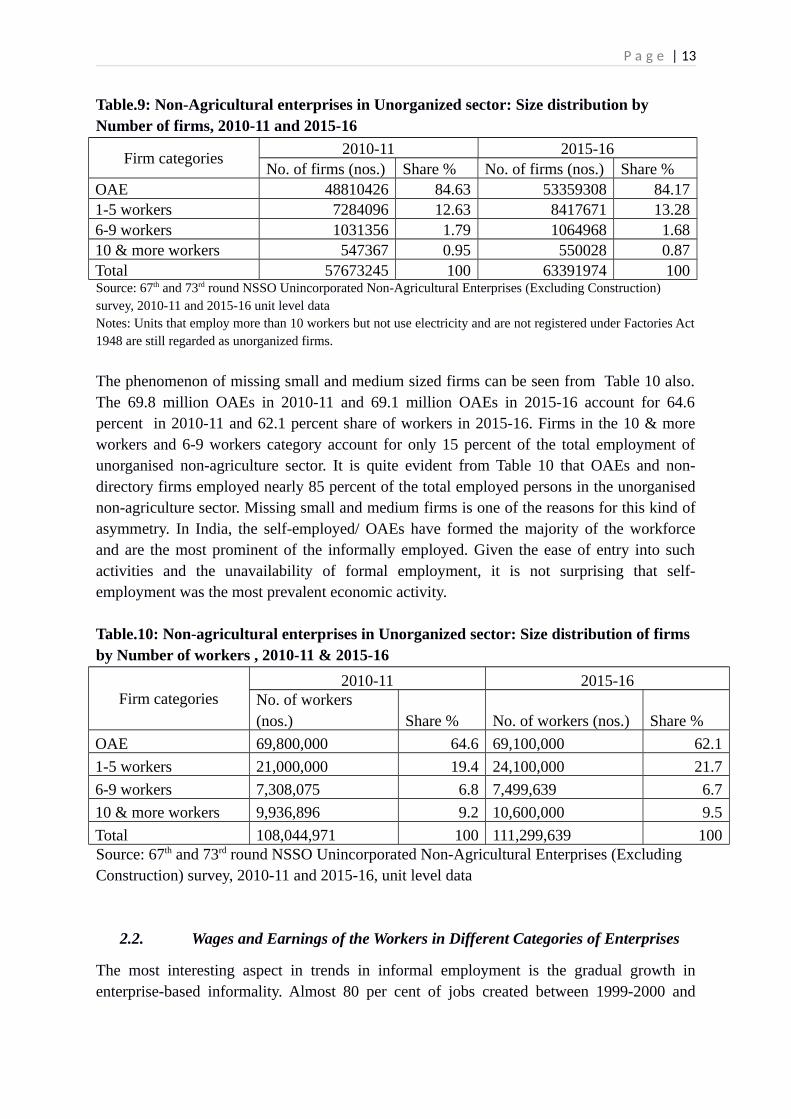
No. of firms (nos.) Share % No. of firms (nos.) Share %OAE 48810426 84.63 53359308 84.171-5 workers 7284096 12.63 8417671 13.286-9 workers 1031356 1.79 1064968 1.6810 & more workers 547367 0.95 550028 0.87Total 57673245 100 63391974 100Source: 67th and 73rd round NSSO Unincorporated Non-Agricultural Enterprises (Excluding Construction) survey, 2010-11 and 2015-16 unit level dataNotes: Units that employ more than 10 workers but not use electricity and are not registered under Factories Act1948 are still regarded as unorganized firms.
The phenomenon of missing small and medium sized firms can be seen from Table 10 also.The 69.8 million OAEs in 2010-11 and 69.1 million OAEs in 2015-16 account for 64.6percent in 2010-11 and 62.1 percent share of workers in 2015-16. Firms in the 10 & moreworkers and 6-9 workers category account for only 15 percent of the total employment ofunorganised non-agriculture sector. It is quite evident from Table 10 that OAEs and non-directory firms employed nearly 85 percent of the total employed persons in the unorganisednon-agriculture sector. Missing small and medium firms is one of the reasons for this kind ofasymmetry. In India, the self-employed/ OAEs have formed the majority of the workforceand are the most prominent of the informally employed. Given the ease of entry into suchactivities and the unavailability of formal employment, it is not surprising that self-employment was the most prevalent economic activity.
Table.10: Non-agricultural enterprises in Unorganized sector: Size distribution of firms by Number of workers , 2010-11 & 2015-16
Firm categories2010-11 2015-16
No. of workers (nos.) Share % No. of workers (nos.) Share %
OAE 69,800,000 64.6 69,100,000 62.1
1-5 workers 21,000,000 19.4 24,100,000 21.7
6-9 workers 7,308,075 6.8 7,499,639 6.7
10 & more workers 9,936,896 9.2 10,600,000 9.5
Total 108,044,971 100 111,299,639 100Source: 67th and 73rd round NSSO Unincorporated Non-Agricultural Enterprises (Excluding Construction) survey, 2010-11 and 2015-16, unit level data
2.2. Wages and Earnings of the Workers in Different Categories of Enterprises
The most interesting aspect in trends in informal employment is the gradual growth inenterprise-based informality. Almost 80 per cent of jobs created between 1999-2000 and

P a g e | 14
2011-12 were generated by unorganized enterprises and the majority of jobs were informal.Informal employment in the formal sector was also rising over the period (Abraham, 2016 ).
The increase in informal employment is as much a cause as it is a symptom of the way inwhich the benefits of economic growth in India have bypassed the majority of its population.This is unlike the experience of China where economic growth has been accompanied by anincrease in medium and large scale units which provide formal employment to its workers(Ghose, 2014; Majid, 2015). India’s long chronic informality in labour market since 1980screated more temporary workers, contract workers, subcontracting practices (Goldar, 2010)and self-employed jobs.
Low and stagnant wage is also one of the main reasons for this situation. In Table 11, we canclearly observe that first, the majority of units earn less than Rs 5000 per month. Second,there are hardly any units in the >10 workers category where workers earn more than Rs 10000 per month. Non-directory establishment(1-5 workers), directory establishments (6-9workers) and 10 & more workers are mostly receiving monthly average wage upto 5000rupees in 2010-11. Third, by 2015-16 the scenario has changed significantly. The share ofunorganized forms where earnings are as low as Rs 5000 or less falls sharply to 80% from96%. Fourth, the share of those earning Rs 5000 to 10 000 pm rises from 4 to 18%. If smalland medium sized firms are in goods numbers, they can play the role of the saviour by hiringmore and giving higher wages.
Table.11: Unorganized Sector: Monthly average wages & allowances per worker, by sizedistribution of enterprises, 2010-11 & 2015-16
Monthlyaverage wage,
salaries &other
allowances perworker (Rs.)
OAE (ownearnings)
1-5 workers 6-9 workers 10 & moreworkers
Total
2010-11
2015-16
2010-11
2015-16
2010-11
2015-16
2010-11
2015-16
2010-11
2015-16
Upto 5000 98.11 84.76
87.46
56.32
81.49
45.66
95.85
79.60
More than 5000 to 10000
1.80 14.08
11.28 36.56
16.27
43.11 3.80 18.06
More than 10000 to 15000
0.06 0.89 0.92 5.76 1.45 7.79 0.25 1.79
More than 15000 to 20000
0.02 0.16 0.24 0.89 0.38 1.92 0.07 0.33
More than 20000 to25000
0.00 0.05 0.07 0.25 0.16 0.90 0.02 0.12
More than 25000 to 30000
0.00 0.02 0.00 0.08 0.04 0.21 0.00 0.04
More than 30000 to 35000
0.00 0.01 0.01 0.06 0.08 0.11 0.01 0.02
P a g e | 15
More than 35000 to 40000
0.00 0.00 0.01 0.02 0.00 0.06 0.00 0.01
More than 40000
0.00 0.02 0.01 0.06 0.12 0.24 0.01 0.04
Wage category Total
100 100 100 100 100 100 100 100
Enterprise category Total
84.63
84.17
12.63
13.28
1.79 1.68 0.95 0.87 100 100
Source: 67th & 73rd round NSSO Unincorporated Non-Agricultural Enterprises (Excluding Construction) survey,2010-11 and 2015-16, unit level data
2.3. Sectoral Distribution of Unorganised Enterprises and Employees
If much of manufacturing is in the micro- or unorganized sector, that will not only reduceproductivity in manufacturing, but also in the economy. The contribution of manufacturing toIndia’s GDP in 2017 was only about 16%, a share that stagnated since the economic reformsbegan in 1991. The contrast with the major Asian economies is significant. For example,Malaysia roughly tripled its share of manufacturing in GDP to 24%, while Thailand’s shareincreased from 13% to 33% (1960-2014). Services sector has been flourished more thanmanufacturing for India. But without the growth of manufacturing sector, services will not beable to grow for very long (unless they access global markets).
No major country managed to reduce poverty or sustain growth without manufacturingdriving economic growth. This is because productivity levels in industry (and manufacturing)are much higher than in either agriculture or services. Manufacturing is an engine ofeconomic growth because it offers economies of scale, embodies technological progress andgenerates forward and backward linkages that create positive spillover effects in the economy(Mehrotra, 2019). However, India also has no industrial policy or employment strategy toride the wave of its demographic dividend.
Table 12: Size wise sectoral share distribution of informal enterprises in manufacturing & services in 2010-11 & 2015-16
FirmCategorie
s
RuralServices
UrbanServices
RuralManufacturi
ng
UrbanManufacturi
ng
Total
2010-11
2015-16
2010-11
2015-16
2010-11
2015-16
2010-11
2015-16
2010-11
2015-16
OAE 39.1 36.0 31.3 32.4 18.7 19.7 10.8 11.8 100.0 100.0Non-directory establishment
20.1 19.3 51.5 54.2 10.1 8.7 18.3 17.8 100.0 100.0
Directory establishment
11.4 14.0 43.7 45.8 13.3 11.6 31.6 28.6 100.0 100.0
10 & more workers
15.8 18.5 38.7 45.6 19.2 11.5 26.4 24.4 100.0 100.0

P a g e | 16
Source: 67th and 73rd round NSSO Unincorporated Non-Agricultural Enterprises (Excluding Construction) survey, 2010-11 and 2015-16. Estimated from unit level data
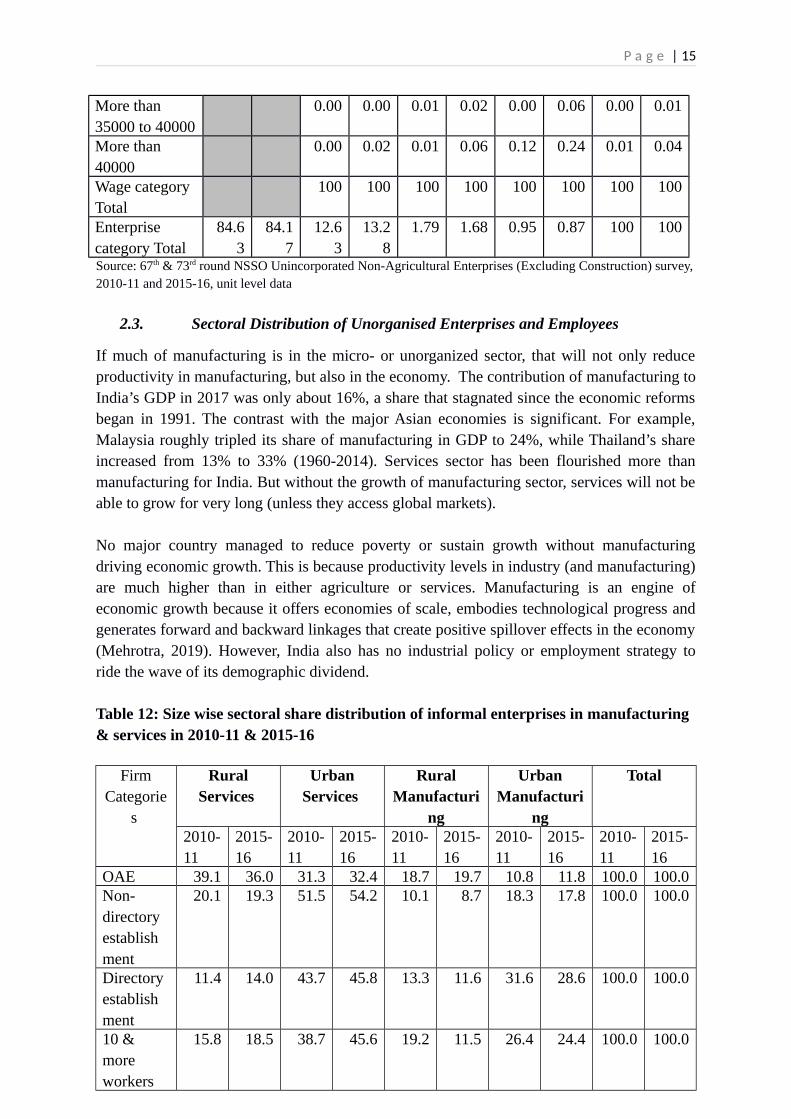
In Table 12, we examine the distribution across manufacturing and services of India’sunorganized sector enterprises. What is clear is that service firms dominate; they account foraround 60% or more of units (regardless of size of enterprise), with manufacturingaccounting for the remainder. What is interesting is that services are relatively moreimportant among the OAEs and the smallest units (with 1-5 workers), while manufacturing ismore important among the slightly bigger units (>6 workers). Secondly, it is notable thatmanufacturing is much more important as an economic activity in urban areas, regardless ofsize, than in rural areas.
Table 13: Rural vs urban: Size wise sectoral share distribution of non-agri informal enterprises in 2010-11 & 2015-16
Firm Categories Rural Urban Total
2010-11 2015-16 2010-11 2015-16 2010-11 2015-16OAE 57.9 55.7 42.1 44.3 100 100Non-directory estabmnt(2-5 workers) 30.2 28.0 69.8 72.0 100 100Directory estabmnt (6-9workers) 24.7 25.6 75.3 74.4 100 10010 & more workers 35.0 30.0 65.0 70.0 100 100Total 53.6 51.3 46.4 48.7 100 100Source: 67th & 73rd round NSSO Unincorporated Non-Agricultural Enterprises (Excluding Construction) survey2010-11 & 2015-16. Estimated from unit level data
Finally, Table 13 gives us an idea about the distribution of enterprises of different sizes inunorganized non-agriculture across location – rural and urban. First, what is clear is thatOAEs predominate in rural areas, and to a lesser extent in urban areas. Second, however,units of slightly larger size (in terms of employment) are what predominate in urban areas.Putting the information from these last two tables together suggests that manufacturing in theunorganized sector is mainly undertaken by slightly larger units (rather than OAEs), andtends to be located in urban areas. Both these propositions seem logical given thatmanufacturing would require more inputs and raw materials which might be easier to sourcein urban areas, and the markets would also be more accessible in urban areas.
3. Discussion: The Missing Small & Medium sized Enterprises
We would suggest that the size structure of the non-agricultural sector discussed in India hasbeen confined to a discussion of the ‘missing middle’ phenomena in policy circles. The lasttime there was a thorough analysis of this sector was in the reports of the NationalCommission for Enterprises in the Unorganized Sector (over 2007-09). This sector not onlydominates the enterprise structure of India’s establishments, but employs the vast majority ofworkers in India; they are the self-employed, as well as the wage employed (both casual and

P a g e | 17
regular wage work). They are also what constitutes the bulk of non-agri informality in India.Informal workers normally work in informal enterprises.
By contrast, in Economic Survey 2019, the Indian MSME sector was discussed but in thediscussion, MSME data of unorganised sector was not really used. ASI database was used toexamine the dwarf and infant firms (less than 100 workers in a firm and aged more than 10years is dwarf), small firms (less than 100 workers in a firm) and large firms (more than 100workers in a firm). However, what we have shown is that the MSME sector is not about onlythese two categories (although the Economic Survey does characterise ‘dwarf-ness’ rightly asan abiding problem India’s economy).
The MSME is much more complex in structure and the nature of problems they face cannotbe captured by this simple characterisation. We have shown earlier in this paper usingenterprise data that even the total number of unregistered and unorganised firms are notexactly overlapping. There are plenty of unorganized firms that are registered, except thatthey seem to be registered under a variety of Acts. Government authorities cannot address theproblems facing unorganized sector unless they deal with each of these types separately. Butif firms are not even registered, then authorities don’t have any idea about them in practice.How are policies or programmes to be devised in the face of such a state of ignorance?Second, although 31% of unorganized firms are registered, they happen to be registered underActs that are so numerous and diverse in nature, that there is likely to be little or noconsolidated information anywhere in government or any other agency (private orautonomous) that might help a well-meaning government to even begin to support such units.
Thirdly, we have noted that the total registered enterprises are less than one percent comparedto all enterprises (organized and unorganized). Fourth, we have found that the presence ofsmall and medium sized enterprises is almost negligible. Fifth, there is a vast sea of ownaccount enterprises, accounting for the vast majority of enterprises in India.
Yet, the policy discourse in the country is confined merely to the ‘missing middle’. What wehave found is that while there may not be a missing middle if you only examine the organizedsector firms (using ASI data), if you combine the ASI data with the NSSO data onunorganized sector, you discover not only a missing middle but also a missing small. In fact,the micro segment of the MSME sector of non-agri enterprises is vast, and is highlydifferentiated. The OAEs predominate, which could be called nano-enterprises, and theypractically don’t figure in the policy discourse (except as potential members of self-helpgroups). Moreover, the small sized enterprises may be numerous in sheer absolute number,but they hardly account for a negligible proportion of all enterprises.
What all this implies is the following. Firms start tiny, as means of survival, and also rarelygrow to become big. This kind of structure owes its origins to the reservation of products forsmall scale industries that began with the Industrial Policy Resolution of 1956, and lasted tillwell beyond the 21st century, until the end of the first decade of the millennium. In otherwords, this distorted the size structure of India’s enterprises over half a century. The policy

P a g e | 18
makers’ challenge now is how to correct for entrenched structure, caught in a low-levelequilibrium, a poverty trap.
As though that was not bad enough, the policy regime has tended to encourage sub-optimalsize of enterprises well into the very recent past. Government schemes and incentives areholding back micro or small firms from expansion to some extent. The following table showsthe name of schemes for micro, small, medium and large and who can avail the incentives-
Table.14: Government schemes: Who has access depends upon size of enterprise (2013)
Scheme Description Availability of Incentive by Size of
the organisation Micro Small Medium Large
National Manufacturing Competitiveness Program
Assistance aimed at improving processes, designs and technology.
Government Purchase andPrice preference policy for MSEs
Till 2012-13, 358 products were reserved for exclusivepurchase from MSEs. 20 %of annual value of goods and services purchased to be procured from MSEs
Credit linked Capital subsidy scheme for technology upgrade
15 % capital subsidy for Tech. upgrade on term loanfrom approved inst.
Credit Guarantee Fund scheme for MSE
Credit guarantee for collateral free loan upto 1cr.
MSE-Cluster Development Programme
Training, tech etc. grant of 75% of project cost and tangible assets, infrastructure, grant of 80% of project cost
Quality upgradation in MSEs-incentives for certification
Reimburse 75% of ISO certification expenses (max. Rs. 75k one time)
Micro Finance Programme
SIDBI supporting NGO/micro finance institutions in providing loans
Source: Economic Survey 2012-13
What table 13 demonstrates is that if firms grow larger than small, and think of becoming‘medium’ sized, they will lose all the incentives and the benefits of schemes such as the onesabove. This cannot be a situation fostering growth of firms.

P a g e | 19
Since 1 April 2015, a new scheme has come into existence: MUDRA. To enhance the creditflow to micro and small enterprises (MSEs), Micro Units Development and RefinanceAgency (MUDRA) was established on 25th September, 2014. On 8th April, 2015, PradhanMantri Mudra Yojana (PMMY) officially launched by PM which is nothing but a widerinitiative of original MUDRA. All loans to non-farm micro-enterprises up to Rs 10 lakh bypublic and private sector banks, and other financial institutions can be renamed as Mudra.Under the PMMY, three categories of loans were to be given, based on the stage ofdevelopment and funding needs of the micro enterprises: i) Shishu (meaning infant), loansup to Rs. 50,000/- provided with no collateral, @1% rate of interest/month repayable over aperiod of 5 years, ii) Kishor(meaning child): loans above Rs.50,000/- and up to Rs. 5 lakh,iii) Tarun (meaning adolescent): loans above Rs. 5 lakh and up to Rs. 10 lakh. In 2018-19,the number of Shishu loans were 89%, Kishor loans were 9.3% and Tarun loans merely 1.6%.
No additionality has been seen through this scheme. Though it has been claimed that it hascreated many employment and start-ups, but there is no sign of it. “It is a typical case ofrenaming and rebranding” (Mahajan, 2019). Loans under 10 lakhs by the financialinstitutions in normal course are now counted and reported as ‘Mudra loans’ which is no helpactually. Annual report of MUDRA shows that it contributed less than 3% of the total lendingby banks as part of their normal lending. Mudra loans account for between 8.5% to 12.6% tototal bank credit availed by mainly large borrowers. It also strengthens our argument aboutthe consequences of a vast pool of micro tiny enterprises and the negligible share of smallfirms.
Under Mudra Yojana the average size of loans disbursed is Rs.54072, but the largestproportion of loans, 89% of total, are the Shishu loans which had an average loan size just Rs28,074 in 2018-19. This amount is not enough to start up micro-enterprise for self-employment or provide jobs to others. Kishor and Tarun loans can generate additional incomeand employment but insignificant number of these loans are not helping much. Mudra loans are flawed as a financial product - these are structured as term loans with a tenorof three years, with periodic repayments of principal and interest, whereas 90% or more ofthe amount is used for working capital, which is needed as long as the microenterprise runs.If the loan is repaid, the unit will not have working capital. These loans should have beenoffered as cash credit overdraft limits. That would also have reduced the interest burden onthe borrowers.
Mudra loans risk a default because debt for new enterprises is the wrong financial product. Indebt financing, the entrepreneur has to maintain the fixed instalment repayment and this leadsto the loan becoming an NPA. Catching up on older instalments becomes tougher. Had theMudra financing been done using the micro-equity framework, the build-up of NPAs wouldhave been avoided (already 4-5%, but growing, since it is early days yet). An RBI expertmust examine alternatives to MUDRA retail loans.
Currently the risk of default is tried to be obviated through credit guarantees from the CreditGuarantee Trust for MSMEs (CGT-MSME). But no guarantee mechanism can sustainably

P a g e | 20
deal with failure rates as high as a 70-80% among new enterprises, which are normal fornano-enterprises run by individual entrepreneurs (Mahajan, 2019). Only a micro-equity fundmechanism can handle this. While many enterprises would go under, or would be marginallyprofitable, returns from the surviving and thriving enterprises would have been enough tooffset the investment losses
Missing middle is not new and researchers have been talking about this long time.There is an expectation that some formalization is occurring after the introduction of thegoods and services tax (GST) system in July 2017. There is slight change in the share of theinformal firms. Existing unorganized sector units have registered if they have an annualturnover 20 lakhs, because GST return has to be submitted. On account of this 93 percentinformal workers in India comes down to 90 percent (Mehrotra and Parida, 2019). It is truethat some of the firms do register under GST, but the percentage of this kind of cases is small.This missing part (small and medium sized firms) needs further detailed research todetermine their constraints, size wise, in detail.
Concluding remarksThe MSME sector is the second largest employer and an important driver of the economy.But the literature about the ‘missing middle’ rightly identifies this gap in the size structure ofenterprises in developing economies as a serious problem. Though some researchers denysuch a problem exists. Hsieh and Olken (2014) wrote about no missing middle in Indonesia,Mexico and India by considering plant size distribution as bimodal. Nagraj (2018) alsoconcluded that no missing middle exists, but based on an analysis of only the organisedsector. However, Tybout (2014) argued quite differently.
It is well known that informality abounds in India, both for workers as well as for firms. Wehave used ASI and NSS data sources both to demonstrate that not only is there a missingmiddle but a missing small scale sector as well. Even worse, of all micro enterprises 84.2percent are OAEs. Tiny micro enterprises’ ability to expand is minimal. Together with unitsthat employ 1-5 workers, OAEs have an almost 97 percent share.
These units have remained outside the policy makers’ frame of reference. Such policies thathave been adopted (which we examined briefly), have barely made a dent on the problem.There is a case for a new policy framework that takes these units as the main focus of theirattention, as opposed to clubbing together all MSMEs into one catch-all category.
P a g e | 21
BibliographyAbraham, R. (2016). Informal Employment in India: An Analysis of Forms and Determinants (ISEC Working Paper. 363). Bangalore: Institute for Social and Economic Change.Banerjee, A., & Duflo, E. (2008). What is Middle Class about the Middle Classes Around the
World? Journal of Economic Perspectives, 22(2), 3-28.
Bernard, A., Jensen, J., Redding, S., & Schott, P. (2012). The Empirics of Firm Heterogeneityand International Trade. Annual Review of Economics, 4(1), 283-313.
Bernard, A., Jensen, J., Redding, S., & Schott, P. (2007). Firms in international trade. Journal of Economic Perspectives, 21(3), 105-130.Chatterjee, U., & Kanbur, R.(2015). Non-compliance with India’s Factories Act: Magnitude and patterns. International Labour Review, 154(3), 393-412.Chong, S., Hoekstra, R. H., Lemmers, O., Beveren, I. V., Berg, M. V., Wal, R. V., & Verbiest,
P. (n.d.).(2019). The role of small- and medium-sized enterprises in the Dutch economy: an analysis using an extended supply and use Table Journal of Economic Structures, 8(1).
De Mel, S., McKenzie, D., & Woodruff, C. (2010). Who are the microenterprise owners? Evidence from Sri Lanka on Tokman versus De Soto. In: Lerner, J., & Schoar, A. (Eds.) International Differences in Entrepreneurship (pp. 63-87). Chicago, IL: University of Chicago Press.Dhar, P., & Lydall, H. F. (1961). The Role of Small Enterprises in Indian Economic. Bombay:
Asia Publishing House.Ghose, J. (2014). The Curious Case of the Jobs that did not Appear: Structural Change, Employment and Social Patterns in India. Indian Journal of Labour Economics, 57 (1).Goldar, B. (2010). Informalisation of Industrial Labour in India: Are Labour Market Rigidities and Growing Import Competition to Blame?. Working Paper No. id:3125, eSocialSciences. Retrieved from https://ideas.repec.org/p/ess/wpaper/id3125.htmlGovernment of India. (2017-18). Annual Report . New Delhi: Ministry of Micro, Small and Medium Enterprises.Government of India. (2018-19). Economic Survey. New Delhi: Ministry of Finance.
Hasan, R., and K. Jandoc. (2013). Labor Regulations and the Firm Size Distribution in Indian Manufacturing. in J. Bhagwati and A.Panagariya, eds. Reforms and Economic Transformation in India, Delhi: Oxford University Press. Hsieh, C.-T., & Olken, B. (2014). The Missing 'Missing Middle'. Journal of Economic Perspectives, 28(3), 89-98.Krueger, Anne O. (2013). The Missing Middle. in Economic Reform in India: Challenges, Prospects, and Lessons edited by Nicholas C. Hope, Anjini Kochar, Roger Noll, and T. N. Srinivasan, Cambridge University Press.Mahajan, V. (2019), Employment in MSMEs- Challenges with MUDRA and thePMMY: A Way Forward, Rajiv Gandhi Centre for Contemporary Studies, New Delhi, mimeo.Mazumdar, D. (2003). Small and Medium Enterprise Development in Equitable Growth and

P a g e | 22
Poverty Alleviation. In C. M. Edmonds, ed., Reducing Poverty in Asia; Emerging Issues in Growth,Targeting and Measurement. Chaltenham: Edward Elgar for the Asian Development BankMazumdar, D., and S. Sarkar. 2008. Globalization, Labor Markets and Inequality in India. London and New York: RoutledgeMazumdar, D., and S. Sarkar. (2013). Manufacturing Enterprise in Asia: Size Structure and Economic Growth, London and New York: Routledge and IDRC,Canada
Mehrotra, S. (2019). 'Manufacturing: The Cornerstone of Planning for a 21st Century India', in Mehrotra, S. and S. Guichard (Eds.) Planning in the 20th CEntury and Beyond: India's Planning Commission and NITI, Cambridge University Press, 2020.Mehrotra, S.(2016). Seizing the Demographic Dividend. Policies to Achieve Inclusive Growth in India, Cambridge University PRess.
Mehrotra, S. (2020), Informal Employment Trends in the Indian Economy: Persistent informality, but growing positive development, ILO Working Paper, Geneva.
Mehrotra, S. and J. Parida (2019), A JObs Crisis: Rising Education Levels and Falling Non- agri Job Growth, State of Working India Working Paper, Azim Premji University, Bangalore.(https://cse.azimpremjiuniversity.edu.in › wp-content › uploads › 2019)Nagaraj, R. (2018). Of Missing Middle and Size-based Regulation: A New Frontier in the Labour Market Flexibility Debate. CSE Working Paper # 2018-7.OECD . (2013). Skills Development and Training in SMEs. Paris : OECD Publishing .
Panagariya, A. (2013): Why growth matters: How India’s growth acceleration has reduced poverty, Ramaswamy, K.V.(2013). Understanding the ‘missing middle’ in Indian Manufacturing: The Role of Size-Dependent Labour Regulations and Fiscal Incentives. (V.R.F Series, No.480). Institute of Developing Economies, Japan External Trade Organisation. Taymaz, E. (2002). Are Small Firms Really Less Productive? An Analysis of Productivity Differentials and Firm Dynamics, presented at 9th Annual Conference of Economic Research Forum (ERF).Tybout, J. (2000). Manufacturing Firms in Developing Countries: How Well Do They Do,
and Why? Journal of Economic Literature, 38(1), 11–44.Tybout, J. (2014). The Missing Middle, Revisited. Retrieved from https://assets.aeaweb.org/ asset-server/articles-attachments/jep/app/2804/28040235_app.p

P a g e | 23
Annexure Industry-specific acts/ authorities under which enterprises registered in 2010-11 & 2015-16
Sl.No. 2010-11 2015-16
1 State directorate of industries State directorate of industries
2Khadi and Village Industries Commission/Board
Khadi and Village Industries Commission/ Board
3Development Commissioner of Handicraft/ handloom
Development Commissioner of Handicraft /handloom
4 Coir BoardCommodity boards (Coir board, Silk Board, Jute commissioner, etc.)
5 Directorate of education /AICTE/NCTE Directorate of education /AICTE/NCTE 6 Silk Board Pollution Control Board
7 Jute CommissionerDirectorate General of Foreign Trade/ other export promotion agencies
8 Pollution Control Board
State Financial Corporation/Industrial Cooperative Banks/Industrial Development Banks/ SIDBI
9Directorate General of Foreign Trade/ other export promotion agencies Food safety and Standards Act, 2006
10
State Financial Corporation/Industrial Cooperative Banks/Industrial Development Banks District Supply and Marketing Society
11
Technical Consultancy Services Organisations/Council for Technological Upgradation
Technical Consultancy Services Organisations/Council for Technological Upgradation
12Small Industries Development Bank of India (SIDBI) Sale tax
13Small Industries Services Institutes/ othersmall industries registration agencies Indian Charitable Act
14 District Supply and Marketing Society Cinematograph act
15State Trading Corporation of India Limited (STC)
Money lender’s Act (including the State variants)
16 Indian Charitable ActSocieties Registration Act, 1860 (including the State variants)
17 Cinematograph actIndian Trust Act/Public Trust Act (including the State variants)
18 Money lender’s ActEmployees Provident Fund Organisation (EPFO)
19Societies Registration Act, 1860 (including the State variants) Others
20 Public Trust Act 21 Others

P a g e | 24
Source: 73rd round NSSO Unincorporated Non-Agricultural Enterprises (Excluding Construction) survey 2015-16 unit level data & 67th NSS Unincorporated Non-Agricultural Enterprises (Excluding Construction) survey 2010-11 unit level data