CSE Report 586, 2003 - CRESST - UCLA
116
Research-Supported Accommodation for English Language Learners in NAEP CSE Technical Report 586 Jamal Abedi, Mary Courtney, and Seth Leon CRESST/University of California, Los Angeles January 2003 Center for the Study of Evaluation National Center for Research on Evaluation, Standards, and Student Testing Graduate School of Education & Information Studies University of California, Los Angeles Los Angeles, CA 90095-1522 (310) 206-1532
Transcript of CSE Report 586, 2003 - CRESST - UCLA

Research-Supported Accommodationfor English Language Learners in NAEP
CSE Technical Report 586
Jamal Abedi, Mary Courtney, and Seth LeonCRESST/University of California, Los Angeles
January 2003
Center for the Study of EvaluationNational Center for Research on Evaluation,
Standards, and Student TestingGraduate School of Education & Information Studies
University of California, Los AngelesLos Angeles, CA 90095-1522
(310) 206-1532

Project 4.2 Validity of Assessment and Accommodations for English Language LearnersJamal Abedi, Project Director, CRESST/UCLA
Copyright © 2003 The Regents of the University of California
The work reported herein was supported under the Educational Research and Development CentersProgram, PR/Award Number R305B960002, as administered by the Office of Educational Research andImprovement, U.S. Department of Education.
The findings and opinions expressed in this report do not reflect the positions or policies of the NationalInstitute on Student Achievement, Curriculum, and Assessment, the Office of Educational Research andImprovement, or the U.S. Department of Education.


v
Acknowledgements
This study relied on the participation of 17 schools, their administrators andfaculty—and the 1,300 students, who agreed to “do their best” 2 days in a row. We owea special thanks to the tech-savvy teachers who helped us on site and let us monopolizecomputers. Their troubleshooting assistance often made the difference between dataand no data.
The joy of research is partly due to its collaborative nature. We are grateful to thegenerosity with which Joan Herman provided insightful comments on the study designand report. Eva Baker graciously continues to guide and support our research. AnnMastergeorge kindly shared her thorough teacher survey on accommodation use. CarolLord of CSULB contributed her language acquisition expertise to the construction of ourglossaries. Susan Jurow helped us “connect” with fourth graders at UES/Seeds. FarzadSaadat programmed and Greg Chung supported the computer tests—and fed thestatisticians instant data. The saintly Cathy McCann provided tech ed to the techimpaired. Jenny Kao scoured the web and this report to contribute freshness and goodsense—while honing her linguistic modification skills. Fred Moss cheerfully fine-tunedthe report format.
In the field, Nida Poosuthasee set up laptops in the schools and administered thecomputer testing with finesse. Our charming and sharp-eyed test administrators alsoincluded Anne Buttyan, Judith CaJacob, Louise Nixon, Rafael Pizarro, and FrancisSotcher. Behind the scenes, Nida, Judy and Louise lent their multifaceted gifts.
Thanks to our team of thoughtful mathematicians for open-ended answer rating:John Baber, Lui Cordero, Michael Helperin, and Tim Hu. Our diligent reading raterswere Tiffany Gleason, Jennifer Gully, Danny Hsu, Amy Jamison, Rebecca Karni,Shannon Madsen, Katya Pertsov, Charles Tower, and Joseph Wright.
We are especially indebted to Jennifer Vincent, Project Assistant extraordinaire.Jennifer cheerfully formats tests and questionnaires for scanning, turns the responsesinto the cleanest of data, organizes site visit materials, and pays the bills—just to namethe big jobs.


vii
Executive Summary
With recent legislation calling for equal learning opportunity for allchildren—including English language learners (ELLs)—the issue of assessment andaccommodation for ELLs is gaining more attention. The No Child Left Behind Act of2001 (2002) asks for fair assessment for all children, including ELL students, andencourages experimentally controlled research to examine issues related toassessment and accommodation for ELL students. Considering the fast-growingnature of the ELL population, this study aims to address several important issuesconcerning the use of accommodation in NAEP. First, it is important to identifythose accommodations that help ELL students perform better by reducing thelanguage barriers in content-area assessments (i.e., accommodations that areeffective). A second major task is to make sure that accommodations that areeffective in increasing the performance of ELL students do not give them an unfairadvantage over non-ELL students not receiving the accommodations (i.e., theaccommodations should be valid). We test this by examining whether theaccommodations seem to have a positive effect on the performance of non-ELLstudents. The task of finding effective and valid accommodations is complete withthe testing of accommodation feasibility. Therefore, the main objective of this studyis to identify accommodations that are effective, valid, and logistically feasible toimplement.
Methods
Three main research hypotheses were tested, each related to one of the issuesconcerning accommodation. They were: (a) effectiveness, (b) validity, and (c)feasibility. A net total of 607 Grade 4 students (279 or 46% ELLs and 328 or 54% non-ELLs) and 542 Grade 8 students (256 or 47% ELLs and 286 or 53% non-ELLs) weretested.1 The accommodation plan was slightly different for the two grades. Studentsin Grade 4 were assessed under four different accommodation strategies (computertesting with a pop-up glossary, extra time, a customized dictionary, and small-grouptesting) and under a standard condition where no accommodation was provided.However, Grade 8 students were tested under two accommodations (computertesting with a pop-up glossary2 and a customized dictionary) and under thestandard condition. The research questions for this study are:
• Which test accommodations are more effective in reducing the gap inperformance between ELL and non-ELL students? (effectiveness)
1 The net total excludes those absent on 1 of the 2 days of testing and those completely non-English-speaking.When accommodated results were compared, the 20 small-group participants were not analyzed.2 All mention of computer testing as an accommodation refers to math tests delivered on computers toapproximately 8 students. These math tests included a pop-up glossary accommodation, described in themethods section. Most of these students also took the reading proficiency measures on the computer.

viii
• Do the accommodations impact the validity of the assessment (i.e., changethe content of the assessment)? (validity)
• Are the accommodations that reduce the performance gap between ELL andnon-ELL students (without altering the construct) easily implemented?(feasibility)
Results for Grade 4 Students
The test results of 268 of the 279 Grade 4 ELL students were analyzed. Wecompared three of the four accommodation conditions to the standard (non-accommodated) condition. Due to school space constraints, too few were tested inthe small-group condition to make a comparison. Also, due to the limited number ofcomputers available, a smaller number of students were tested on computer than onpaper.
Effectiveness. A comparison between the math scores of ELL studentsreceiving different forms of accommodation with the math scores of ELL studentsunder the standard condition provided evidence of the effectiveness of theaccommodations for ELL students. Those accommodations that helped students toperform significantly higher than the standard condition were labeled as effective.
To test for effectiveness, we adjusted for any initial difference in the level ofEnglish proficiency by using the reading composite score as a covariate. Adjustedscores were obtained and compared. The adjusted mean score for ELL studentsunder the computer accommodation was 14.922 (SE = .805, n = 35, p = .005); underextra time, the mean was 14.037 (SE = .506, n = 89, p = .012); and under thecustomized dictionary condition, the mean was 13.372 (SE = .597, n = 64, p = .138),compared to a mean of 12.182 (SE = .533, n = 80) under the standard condition. Asthese data show, ELL students in Grade 4 performed better under all forms ofaccommodation that were provided in this study, except the small-group testing.3
However, the data also suggest that ELL students benefited more from some formsof accommodation than others. For example, ELL students taking the computer testobtained 2.740 score points higher than students under the standard condition. Thisdifference was smaller with other accommodations. The difference in studentperformance under the extra time condition compared to the standard conditionwas 1.855. For the customized dictionary accommodation, the difference was 1.190.
The results of planned comparisons suggest that the difference between theperformance of ELL students under the computer condition and ELL students underthe standard condition was significant at the .005 nominal level, well beyond the .01nominal level. For extra time, the difference between the accommodated and non-accommodated testing of ELL students was also significant at the .01 nominal level.
3 Because of the small number of students tested under the small-group accommodation, an adjusted mean is notavailable.

ix
For the customized dictionary accommodation and small-group testing, thedifference between the ELL accommodated and non-accommodated performancewas not statistically significant.
Thus, the results of analyses for students in Grade 4 suggest that computertesting and testing with extra time were effective forms of accommodation.
Validity. The test results of 319 of the 328 Grade 4 non-ELL students wereanalyzed. We compared results from three of the four accommodation conditionswith the standard (non-accommodated) condition.4 For the computer testing, theadjusted mean for non-ELL students was 16.295 (SE = .822, n = 44, p = .262); for extratime, the adjusted mean was 16.55 (SE = .595, n = 84, p = 292); and for thecustomized dictionary accommodation, the adjusted mean was 17.435 (SE = .565, n =93, p = .971), compared to an adjusted mean of 17.406 (SE = .550, n = 98) for thestandard (non-accommodated) condition.
The results of analyses on adjusted math scores suggest that the differencesbetween the accommodated and non-accommodated assessments for Grade 4 non-ELL students were not statistically significant. That is, non-ELL students performedthe same under the accommodated and non-accommodated assessments. Theseresults are encouraging since they suggest that accommodations found to beeffective for ELL students in Grade 4 are also valid because they did not affect theconstruct (math performance).
Feasibility. The project staff and test administrators recorded the feasibility ofpreparing and administering the accommodations. Each accommodation strategyused in this study had its own logistical pros and cons. Here are a few examples:
• The project staff spent a substantial amount of time developing appropriateglossaries for two of the accommodation conditions in each of the gradelevels. This required consultation with content specialists (to make surecontent-related terms were not glossed) and students (to make sure that allunfamiliar non-technical terms were glossed).
• The extra time accommodation ran into scheduling difficulties. Schooladministrators and teachers were reluctant to let the testing conflict with thestructure of the school-day schedule.
• In administering the computer testing, the main obstacles were access to anInternet connection, adequate computer memory, and current Webbrowsers. In some schools, there was not a quiet place for students to taketests on computers.
4 Again, due to school space constraints, there was not as much computer or small-group testing. In the small-group condition, too few were tested to make a comparison.

x
• To administer the test in a small-group setting required a separate, quiettesting space that did not exist in most schools.
Results for Grade 8 Students
We analyzed the test results of 256 Grade 8 ELL students assessed under twoaccommodation conditions: computer testing and customized dictionaryaccommodations, as well as under the standard condition with no accommodationprovided.
Effectiveness. Just as with the Grade 4 results, we adjusted for any initialdifferences in the level of English proficiency by using the reading composite scoreas a covariate. The results of the analyses indicate that Grade 8 ELL studentsperformed higher under both accommodations when compared to ELL studentperformance under the standard condition. For the computer testing, the adjustedmean was 10.656 (SE = .408, n = 84, p = .008); for the customized dictionary, theadjusted mean was 9.838 (SE = .399, n = 86, p = .197); and for the standard condition,the adjusted mean was 9.108 (SE = .401, n = 86).
The results of the analyses using planned comparisons show that increasedperformance of ELL students under the computer testing was significant beyond the.01 nominal level. However, the increased performance under the customizeddictionary condition was not significant for ELL students. These results suggest thatcomputer testing is an effective accommodation for ELL students in Grade 8.
Validity. For the 286 non-ELL students in Grade 8, the adjusted means for thecomputer testing and for the customized dictionary were slightly higher than theadjusted mean math under the standard condition. For the computer testing, theadjusted mean was 14.674 (SE = .491, n = 68, p = .220); for the customized dictionary,the adjusted mean was 14.205 (SE = .434, n = 87, p = .623); compared to an adjustedmean of 13.930 (SE = .354, n = 131) for students tested under the standard condition.
The results of the analyses for non-ELL students in Grade 8 indicate that noneof the comparisons were significant. That is, the two accommodation strategies didnot affect the performance of non-ELL students. This suggests that theaccommodations used in this study may be implemented without concern for thevalidity of the accommodated testing.
Discussion
The results of our analyses for Grade 4 revealed that extra time and computertesting were effective forms of accommodations for ELL students. For non-ELLstudents, the results did not show any significant differences between theaccommodated and non-accommodated assessments. Therefore, the twoaccommodation strategies showed effectiveness, without posing any threat to thevalidity of the assessment.

xi
The results indicate that only computer testing is an effective accommodationfor the Grade 8 ELL students in this study. This accommodation had no impact onthe assessment of non-ELL students, suggesting that the computer testing for Grade8 can be implemented without a validity concern.
This discussion focuses on three major themes, some of which are unique tothis study:
1. Computer testing as a form of accommodation for ELL students;
2 . Using a composite of multiple measures of students’ level of Englishproficiency; and
3. Accommodation impact on measurement with varying degrees of linguisticcomplexity.
Computer Testing as a Form of Accommodation for ELL Students
In this study, computer testing was used as an accommodation strategy forelementary and middle school ELL students. The results of analyses indicated thatcomputer testing was the most effective among other accommodation strategiesused in this study. The results also indicated that computer testing was a validaccommodation since it did not affect the performance of non-ELL students.
We believe computer testing was effective since it incorporates into the sessionan interactive set of accommodation features such as presentation of a single item ata time; a pop-up glossary; extra time; and a small and novel setting. An elaborationof these features follows.
The ELL students taking the computer version were presented with a singlequestion at a time on the screen in front of them, rather than 15 test pages, with eachpage presenting as many as 3 questions. However, test-wise students noticed thedisadvantage of not being able to jump ahead to easier (i.e., multiple choice)questions, and then return to the harder ones. A few mouse-savvy students used theright mouse button to go back a page to change an answer.
One of the most important characteristics of the computer testing was theextensive use of its pop-up glossaries by the students. Under the customized Englishdictionary accommodation, almost no students marked circles to indicate that theyhad looked up words in the customized dictionary. Students assessed under thecomputer testing approach, however, used their glossary at a much higher rate thanthe customized English dictionary group. Delivery of the customized dictionary bycomputer had some advantages for the students. Instead of searching for anunknown word in an alphabetical glossary, students could use the mouse to point toa word in the test and were presented with a gloss. They were given a briefdefinition or synonym of that word (or its root) in its present context, rather thanbeing given all the possible definition entries. (No math terms were glossed.)

xii
Whether it was the novelty of taking a test on a computer—usually in aseparate room—being presented one item at a time, and/or having words glossedby sliding the mouse—ELL students seemed to enjoy the computer testing strategy.We were expecting that the randomly selected non-ELL students would performsignificantly better on the computers than their “paper-test” peers because of thenovel test delivery in a familiar medium. (Many more of the non-ELL students havecomputers at home than the ELL students—66% non-ELLs compared to 49%ELLs—and a surprising number of non-ELLs were touch typists.) However, Grade 8non-ELLs performed only slightly better on the computer math test than their peersdid on the paper test. This difference did not reach a significant level (p > .05).
Students expressed enjoyment of the computer delivery of the test, despite thepredominance of “hunt and peck” typing. All students indicated in theirbackground questionnaires that they had more fun with computer testing than withany other accommodation used in this study.
However, there are some logistical concerns with the computeraccommodation. Because Internet access was required for administering thecomputer version of the math and reading tests, testing was limited to certainschools, certain rooms and computers of a certain size. Difficulties beyond the scopeof the students or “delivery” computers interrupted testing: a power outage, theUCLA host server being rebooted during a test, and the data server crashing.Because of technical difficulties, some students took the math test on computer, buttook the reading test on paper.
Using a Composite of English Proficiency Measures
Due to the importance of English proficiency measures in the instruction,assessment, and classification of ELL students, we tried to establish a more reliableand valid measure of students’ level of English proficiency by compiling a battery ofexisting measures that are shown to have good measurement properties. We usedthree measures in this battery: (a) a subscale of the LAS (reading fluency) which hashigher discrimination power than other LAS subscales, (b) a 25-minute NAEPreading comprehension block, and (c) a word recognition test. We created a simplecomposite and a latent composite of these components and used these composites ascovariates to adjust for any possible initial differences of students’ level of Englishproficiency.
An English word recognition measure was used on an experimental basis asone of the components of the English language proficiency battery. The results ofthis study show that this word recognition measure had a significantly highcorrelation with other reading measures, (so it has some value as an efficient form ofreading measurement) but was very likely more difficult to take on a computer thanon paper, as the results were so much lower. For this reason, it was not used as acovariate in the primary analysis.
xiii
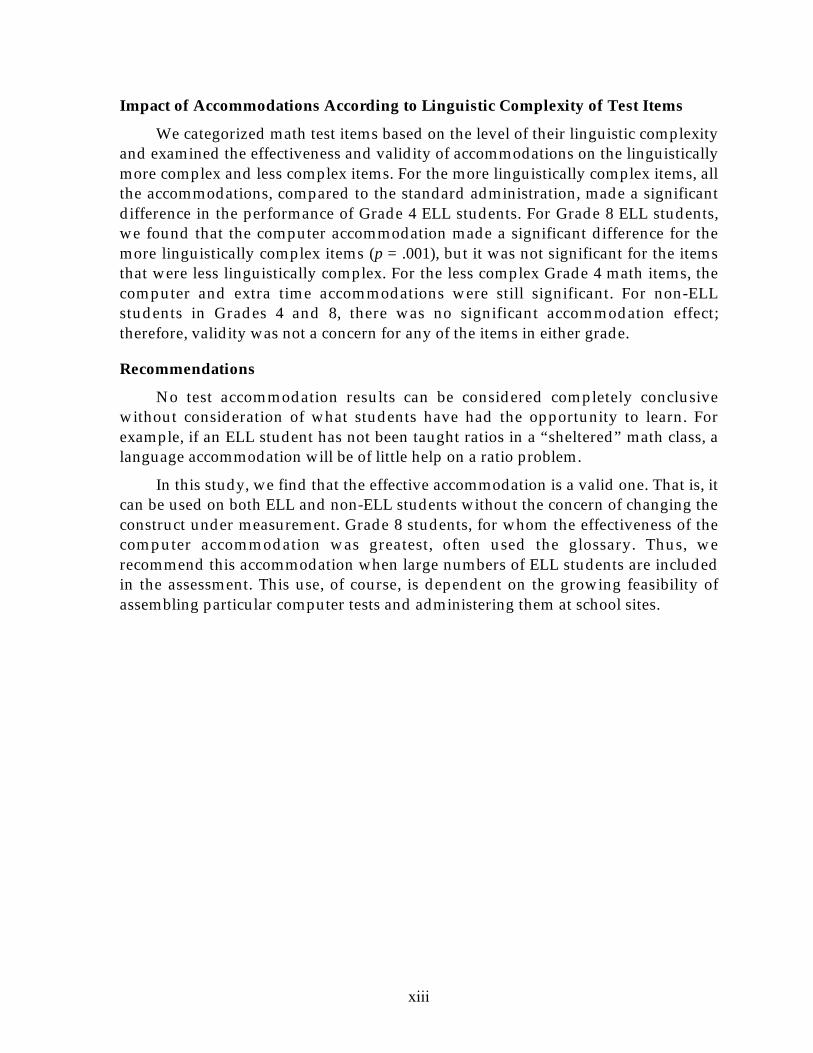
Impact of Accommodations According to Linguistic Complexity of Test Items
We categorized math test items based on the level of their linguistic complexityand examined the effectiveness and validity of accommodations on the linguisticallymore complex and less complex items. For the more linguistically complex items, allthe accommodations, compared to the standard administration, made a significantdifference in the performance of Grade 4 ELL students. For Grade 8 ELL students,we found that the computer accommodation made a significant difference for themore linguistically complex items (p = .001), but it was not significant for the itemsthat were less linguistically complex. For the less complex Grade 4 math items, thecomputer and extra time accommodations were still significant. For non-ELLstudents in Grades 4 and 8, there was no significant accommodation effect;therefore, validity was not a concern for any of the items in either grade.
Recommendations
No test accommodation results can be considered completely conclusivewithout consideration of what students have had the opportunity to learn. Forexample, if an ELL student has not been taught ratios in a “sheltered” math class, alanguage accommodation will be of little help on a ratio problem.
In this study, we find that the effective accommodation is a valid one. That is, itcan be used on both ELL and non-ELL students without the concern of changing theconstruct under measurement. Grade 8 students, for whom the effectiveness of thecomputer accommodation was greatest, often used the glossary. Thus, werecommend this accommodation when large numbers of ELL students are includedin the assessment. This use, of course, is dependent on the growing feasibility ofassembling particular computer tests and administering them at school sites.


1
RESEARCH-SUPPORTED ACCOMMODATIONFOR ENGLISH LANGUAGE LEARNERS IN NAEP
Jamal Abedi, Mary Courtney, and Seth Leon
CRESST/University of California, Los Angeles
Abstract
Both English language learners (ELLs) and non-ELL students in Grades 4 and 8 were tested
in math using one of several accommodations during the winter of 2002. The results in thisreport compare computer-, customized dictionary-, and extra-time-accommodated test
results of both ELL students and non-ELL students. A reading composite score was used as acovariate, and adjusted scores were obtained. Students’ responses to accommodation follow-
up questionnaires and background questionnaires were analyzed. The computeraccommodation was the most effective. It provided an alternative test item delivery and an
easy-to-access gloss of non-math lexicon. Since non-ELL students who received the sameaccommodations performed consistently with non-accommodated, non-ELL students, there
is evidence that the accommodations do not affect the construct being measured and, thus,are valid for assessing the performance of ELL students. As schools increase their technology
base, the computer test platform may be the means to provide language accommodation ondemand to ELL students and other students not proficient in academic English.
For non-native English speakers and for speakers of English dialects, every testgiven in English becomes, in part, a language or literacy test. Therefore, there arechallenges in testing individuals who have not had substantial exposure to the Englishused in tests. Test results may not reflect accurately the abilities and competencies beingmeasured if test performance depends on these test takers’ knowledge of English. Thusspecial attention may be needed in many aspects of test development, administration,interpretation, and decision-making.
Standardized testing is being used to make a variety of important decisions. Thediligence of schools and teachers is assessed via tests. Students are promoted to the nextgrade or held back, depending on their state exams. Students who speak a non-Englishlanguage at home are often designated “limited” or “fluent” in their English proficiencybased on the results of a standardized test. Later, other tests are used to decide ifEnglish language learners (ELL) are ready to move from sheltered content instruction.The reliability and validity of ELL student test scores is an issue of great interest toschools, teachers, parents and students. As it concerns the rights to equal access toeducation—and everyone’s tax dollars—the issue of English Language Learners is

2
discussed in public circles of debate, such as legislative houses, the media, and thecourts.
By school year 2005-2006, the three state assessments given in Grades 3-12 will beincreased to annual assessments in Grades 3-8 plus a high school assessment, asmandated by the No Child Left Behind Act of 2001 (2002) (See Title 1, Part A, Section1111 [B] [2]). Limited English proficient students “must be provided reasonableaccommodations, including ‘to the extent practicable,’ in the language and form mostlikely to yield accurate and reliable information on what they know and can do incontent areas” (See Section 1111 (4) (a)). Another provision of the act includes annualEnglish language proficiency testing of all limited-English-proficient studentsbeginning in the 2002-2003 school year [See Section 1111 (B) (3) (a)].
In taking math, science, and other content assessments, some English languagelearners may have the content knowledge and/or the cognitive ability needed toperform successfully on assessment tasks, but are not yet able to demonstrate in Englishwhat they know. Therefore, assessment procedures may not be equitable and may notyield valid results for ELL students (Gandara & Merino, 1993; LaCelle-Peterson &Rivera, 1994). The Standards for Educational and Psychological Testing (AmericanEducational Research Association [AERA], American Psychological Association [APA],& National Council on Measurement in Education [NCME], 1999) point out thatwhenever students are tested in English, regardless of the content or intent of the test,their proficiency in English will also be tested. This is especially relevant for studentstested in English who are still in the process of learning English.
NAEP and Accommodation
The 1996 National Assessment of Educational Progress (NAEP) main assessmentin math is a milestone in the assessment of limited-English-proficient (LEP) students byintroducing the concept of multiple samples (S1, S2, S3) and by including the bilingualmath booklet and other forms of accommodation in the assessment.
Since then, NAEP continues to use accommodation in assessing LEP students.However, the number of accommodated students remains very small compared to thenumber of LEP students included in the assessment. For example, in the 1998 nationalreading assessment, 896 LEP students were included in the Grade 8 sample (about 7%of the total Grade 8 sample) but only 31 of those (about 3% of the included LEPstudents) were accommodated. Similarly, in 1998 Grade 4 reading, 975 LEP students(11.5% of the total Grade 4 sample) were included, but only 41 of them (4%) were

3
accommodated. There may be several reasons for not providing accommodations for allor the majority of LEP students. Issues concerning feasibility and validity ofaccommodations may be among the strongest. Carefully designed systematic studiesare needed to address the validity and feasibility issues.
In the pilot study (The Effects of Accommodations on the Assessment of LEP Students in
NAEP, Abedi, Lord, Kim, & Miyoshi, 2000) conducted during the 1999-2000 school year,we began an examination of the effectiveness of accommodations by addressing thedifficulty of English vocabulary within test items in a NAEP science assessment. Wecompared ELL and non-ELL students’ scores on 20 items and found that ELL studentsdid particularly well using a customized dictionary, whereas the non-ELL students’scores did not seem significantly affected by the same condition. The pilot studycontributed to the design of this main study that examines two delivery systems for thecustomized dictionary accommodation and compares them with three otheraccommodation conditions.
Testing Accommodation Itself
The impact of various accommodation strategies on NAEP outcomes (the validityissue) must be assessed to see if it closes or reduces the gap between ELL and non-ELLstudents without altering the construct under measurement. As for feasibility, thoseaccommodation strategies that are more easily implemented in large-scale assessmentare the most useful, whereas strategies that are expensive, impractical, or logisticallycomplicated are unlikely to be widely accepted. Thus, for an accommodation strategy tobe considered by NAEP, it must be effective, valid, and relevant to students’background characteristics. It must also be feasible, since in large-scale assessments,feasibility is of paramount concern.
Effectiveness. An ELL accommodation strategy is effective if it significantlyincreases the performance of ELL students. That is, ELL students under an effectiveaccommodation perform significantly better than ELL students with noaccommodation. ELL accommodations typically attempt to reduce the non-contentlanguage load of the test items by rewriting the item, glossing the non-content wordsand/or allowing extra time for deciphering the test item language.
Validity. The main concern in using any form of accommodation for ELL studentsis the validity of accommodated assessment. Researchers argue that some forms ofaccommodation may alter the construct under measurement and thereby may provideunfair advantage to the recipients. To examine the impact of accommodations on the

4
construct, both ELL and non-ELL students must be assessed under the accommodatedcondition. If the accommodated, non-ELL students perform significantly better thantheir non-accommodated, non-ELL peers, the validity of the accommodation becomessuspect. A validity-suspect language accommodation might be the provision of a fullEnglish dictionary containing definitions for terms being tested. With access todefinitions of science or math terms, for example, accommodated students would havean unfair advantage over non-accommodated students.
While there are many school districts nationwide that are providing or allowingaccommodations for ELL students (such as extra time and prescribed bilingualglossaries), these accommodations are not being provided for non-ELL students;consequently, there is no way to check the validity of the accommodation. Testingaccommodation on non-ELL students is something that has not been practical in NAEPtesting either. Furthermore, the accommodation impact must be assessed under anexperimentally controlled condition. Our study provides ELL and non-ELL students thesame form of accommodation in order to determine the impact of the accommodationon the construct under measurement.
Feasibility. An important criterion for any accommodation strategy is feasibility ofadministration, especially in large-scale assessments. Some forms of accommodationmay prove to be effective but may not be feasible. We propose to test highly feasibleaccommodations. Our goal is to identify accommodation strategies that are not onlyeffective but are also practical to administer. Feasibility and ease of use wouldencourage the use of accommodations, thereby helping to increase the level of inclusionof ELL students in the NAEP assessments.
Research Questions
In this study, we focused on three major concerns in test accommodation forstudents with limited English proficiency: (a) effectiveness; (b) validity; and (c)feasibility. Several research questions are addressed by this accommodation study.
• Which test accommodations are more effective in reducing the gap inperformance between ELL and non-ELL students? (effectiveness)
• Do the accommodations impact the validity of the assessment (i.e., change thecontent of the assessment)? (validity)
• Are the accommodations that reduce the performance gap between ELL andnon-ELL students (without altering the construct) easily implemented?(feasibility)

5
Accommodations Selected for This Study: Type and Rationale
The several types of accommodations used in this study were: a computerizedadministration of each math test, which included a pop-up glossary, a customizedEnglish dictionary, an extension of testing time, and small-group testing. There was aslight difference in the plan of accommodations for Grades 4 and 8, in that extendedtime and small-group testing were included only for Grade 4 students, as middleschools have even more space and time constraints than elementary schools.
The pilot phase of this study suggested that a customized English dictionary waseffective in reducing the performance gap between ELL and non-ELL students and atthe same time did not affect the construct; therefore, providing this accommodation toELL students did not compromise the validity of assessment. At the same time, thecustomized dictionary was easy to administer in large-scale assessments; therefore,feasibility did not inhibit using this form of accommodation. The customized Englishdictionary was a glossary of non-content words in the math test. It was composed ofexact excerpts from an ELL dictionary. In a new type of glossary, brief pop-up glosses ofthe same words were incorporated into each of the two computer-based math tests weused.
We also included two strategies used in NAEP assessments. In this study, small-group testing (as a feasible replacement for one-on-one testing) and extension of testingtime were used with some Grade 4 students.
Instrumentation
Several different instruments were used in this study. Some of these instrumentswere developed and tested in prior CRESST studies and refined for this study. Theyinclude math tests for Grades 4 and 8, reading proficiency tests for each grade,accommodation follow-up questionnaires, student background questionnaires, ateacher questionnaire, and a school questionnaire. All the instruments were field tested.
Design
The main accommodations study was conducted at two grade levels (Grades 4 and8) in a single urban public school district in southern California, with nearly half of theparticipants classified as limited English proficient.
The design of this study was a quasi-experimental design. Students within intactclassrooms initially were randomly assigned one of several accommodation conditionsor to a control group where no accommodation was offered. However, because of

6
limited space and equipment, a smaller number of students were assigned to thecomputer and small-group testing accommodations. For the computer testing, over halfof the students who initially would have been assigned to the computer condition wererandomly distributed to other conditions. For the small-group testing, the number ofstudents reassigned to other conditions was even larger. For the testing of Grade 4students with the extra time accommodation, entire classes were chosen.
After excluding a small number of participants from the study because they werecompletely non-English-speaking or were absent on one of the two days of testing, weexamined the test and questionnaire results from a net total of 607 students in Grade 4and 542 students in Grade 8. (See Appendix A, Tables A1 and A2, for gross totals.) Also,as there were too few Grade 4 students in the small-group accommodation conditionwith which to make accommodation comparisons, slightly fewer test results wereanalyzed.
To evaluate the impact of accommodation on student performance, both ELL andnon-ELL students took the assessment with no accommodation. These two groupsserved as comparison groups. Most of the ELL students spoke Spanish as a homelanguage. The non-ELL students were a mixture of students designated as “English-only,” (EO) and as “re-designated” (RFEP) students and “fluent” (FEP) students from avariety of language backgrounds. Many spoke Spanish as a home language.
The minimum number of subjects per cell was calculated through a power analysis(see Kirk, 1995, pp. 60-64) using the variance that was obtained in an earlier, similarCRESST accommodations study (Abedi, Lord, & Hofstetter, 1998). This number ofsubjects has proven to be sufficient for the analytic work needed for research and policypurposes. We analyzed the results of 1,149 participants in this study.
ELL designation was used as the main independent variable; however, studentbackground variables (including language background variables) served as additionalindependent variables. The impact of those variables on student-accommodatedperformance was examined. This design, with 50 to 150 students per cell, has built-insafeguards for testing differences between ELL students by their background variables.
The results of these analyses help in understanding any differential impact ofaccommodation on students’ performance.

7
Literature Review
Uses of Standardized Tests
Both federal and state legislation now require inclusion of all students in large-scale assessments in an effort to provide fair assessment and uphold instructionstandards for every child in this country—including the English language learners(ELLs5) previously exempted from testing (see the Individuals with DisabilitiesEducation Act Amendments of 1997 and the Improving America’s Schools Act of 1994).The reauthorization of Title I of the Elementary and Secondary Education Act of 1965,known as the No Child Left Behind Act of 2001 (2002) calls for stronger accountabilityand mandates inclusion of limited English proficient students and the provision ofreasonable accommodations. Accommodations can include “to the extent practicable,assessments in the language and form most likely to yield accurate data on what [ELL]students know and can do in content areas” [See Title I, Part A, Sec. 1111 (3)(C)(ix)(II)].While raising expectations for ELL students and improving their level of assessmentparticipation, this latest legislation adds a call to improve the validity and equitabilityof the inferences drawn from standardized assessments. This subsequently affects theirdesign, delivery, interpretation, and use.
The challenge of serving and assessing those ELL students considered limitedEnglish proficient (LEP) continues to grow. According to the Summary Report of theSurvey of the States’ Limited English Proficient Students and Available EducationalPrograms and Services, 1999-2000, more than 4.4 million LEP students were enrolled inpublic schools, representing almost 10% of the total public school enrollment ofstudents in pre-kindergarten through Grade 12 (Kindler, 2002). California enrolled thelargest number of public school LEP students (1,480,527), which is one third of the totalnational LEP enrollment. The state with the second highest number of LEP studentswas Puerto Rico (613,019), followed by Texas (554,949), Florida (235,181), and New York(228,730). Since the 1997-’98 school year, there has been a 27.3% increase in LEPenrollments, the greatest in South Carolina, (82% increase) and Minnesota (67%increase) (see Kindler). With this evolution in school demographics, and with continuedcalls for accountability, student assessment fairness and validity remain crucial issues
5 In this report, the descriptor English language learner or ELL signifies a student whose English proficiency isconsidered limited. The designation limited English proficient or LEP is also used without any disrespect todescribe the target students in this study or in studies mentioned in the research literature.

8
on national, state, and school district agendas, as well as in the courts and the popularmedia.
Besides the use of standardized achievement tests for accountability and/or gradepromotion, they are frequently used for assessment and classification of ELL students.These tests are used by approximately 52% of school districts and schools to helpidentify ELL students, assign them to school services, and reclassify them from ELLstatus. About 40% of districts and schools use achievement tests for assigning ELLstudents to specific instructional services within a school, and over 70% of districts andschools use achievement tests to reclassify students from ELL status (Zehler, Hopstock,Fleischman, & Greniuk, 1994).
More and more states implement high-stakes assessments that include ELLstudents, and a significant number of ELL students are having difficulty passing suchtests (Liu & Thurlow, 1999; Liu, Thurlow, Thompson, & Albus, 1999).
Even when standardized, content-based tests (such as science and math tests) areused as achievement tests, they are conducted in English and are normed on nativeEnglish speaking test populations. Therefore, for ELL students, standardized testsbecome as much a test of English language skills as a test of academic content skills(Liu, Anderson, Swierzbin, & Thurlow, 1999). Abedi, Lord, and Plummer (1997) foundthat students’ language proficiency could adversely affect their performance onstandardized tests administered in English. Using standardized tests normed only for amonolingual English population casts doubts on the validity of these tests for ELLstudents (LaCelle-Peterson & Rivera, 1994).
Performance Differences Between ELL and Non-ELL Students
English language learners may be unfamiliar with the linguistically complexstructure of questions, may not recognize vocabulary terms, or may mistakenlyinterpret an item literally (Duran, 1989; Garcia, 1991). Additionally, they may performless well on tests because they read more slowly (Mestre, 1988). Thus, languagebackground factors are likely to confound ELL students’ ability to show what theyknow and thus reduce the validity and reliability of inferences drawn about theircontent-based knowledge. The Standards for Educational and Psychological Testing(AERA, APA, & NCME, 1999) reminds us that test results may not measure what isintended with “individuals who have not sufficiently acquired the language of the test.”Even native speakers of some dialects of English may not be measured accurately if theEnglish used on a test is too complex or unfamiliar (p. 91).

9
Findings of a series of studies conducted by the National Center for Research onEducation, Standards and Student Testing (CRESST) on the impact of students’language backgrounds on their performance indicated that:
• students’ language backgrounds affect their performance in content-basedareas such as math and science;
• the linguistic complexity of test items may threaten the validity and reliabilityof achievement tests, particularly for ELL students; and
• as the level of language demand decreases, so does the performance gapbetween ELL and non-ELL students.
(See Abedi, Courtney, & Leon, 2001; Abedi & Lord, 2001; Abedi, Lord, Hofstetter, &
Baker, 2000; Abedi & Leon, 1999; Abedi, Leon, & Mirocha, 2001).
In addition to language difficulties, there are several cultural variables such asstudent disinclination to ask questions during testing that may influence test results
for those who are not completely acculturated to the United States. Other culturalvariables include attitudes toward competition, attitudes toward the importance of theindividual versus the importance of the group or family, a belief in fate versus belief inindividual responsibility, gender roles, attitudes toward the use of time, attitudestoward the demonstration of knowledge, use of body movements and gestures,proximity, and use of eye contact (Liu, Thurlow, Erickson, Spicuzza, & Heinze, 1997).Analyses from students’ background questions and math and reading scores (Abedi etal., 1998) indicated that language-related background variables, the length of time ofstay in the United States, overall Grades, and the number of school changes, werevaluable predictors of ELL students’ performance in math and reading.
Exemption From Exams
Because of the many issues raised by testing ELL students with exams in English,many ELL students have traditionally been exempted from large-scale assessments.
According to Cummins (1980), most ELL students take between 1 and 3 years todevelop the basic interpersonal communication skills that allow them to communicatein English at a very superficial level with peers and teachers. The time it takes ELLstudents to acquire the cognitive academic language proficiency that is necessary forthem to actively participate in their classroom learning, however, is between 5 and 7years (Collier, 1987; Cummins, 1981). Understandably, many students havetraditionally been exempted from exams. Most local and state assessments still allow for
10
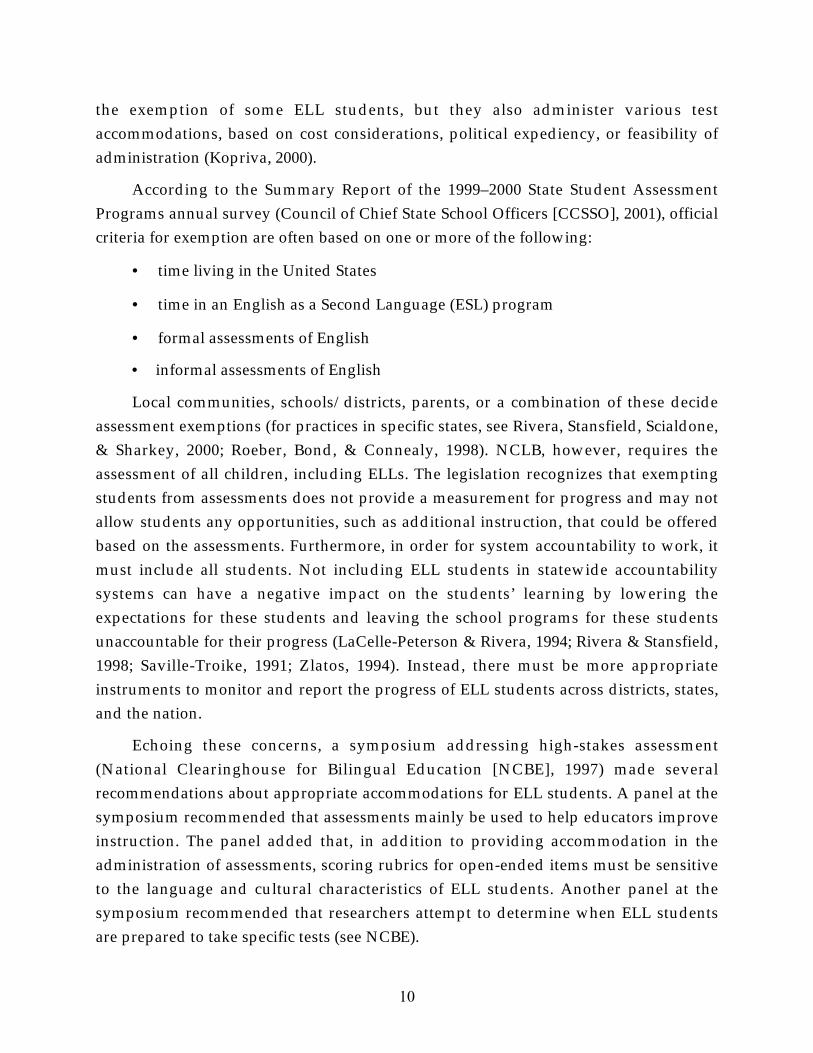
the exemption of some ELL students, but they also administer various testaccommodations, based on cost considerations, political expediency, or feasibility ofadministration (Kopriva, 2000).
According to the Summary Report of the 1999–2000 State Student AssessmentPrograms annual survey (Council of Chief State School Officers [CCSSO], 2001), officialcriteria for exemption are often based on one or more of the following:
• time living in the United States
• time in an English as a Second Language (ESL) program
• formal assessments of English
• informal assessments of English
Local communities, schools/districts, parents, or a combination of these decideassessment exemptions (for practices in specific states, see Rivera, Stansfield, Scialdone,& Sharkey, 2000; Roeber, Bond, & Connealy, 1998). NCLB, however, requires theassessment of all children, including ELLs. The legislation recognizes that exemptingstudents from assessments does not provide a measurement for progress and may notallow students any opportunities, such as additional instruction, that could be offeredbased on the assessments. Furthermore, in order for system accountability to work, itmust include all students. Not including ELL students in statewide accountabilitysystems can have a negative impact on the students’ learning by lowering theexpectations for these students and leaving the school programs for these studentsunaccountable for their progress (LaCelle-Peterson & Rivera, 1994; Rivera & Stansfield,1998; Saville-Troike, 1991; Zlatos, 1994). Instead, there must be more appropriateinstruments to monitor and report the progress of ELL students across districts, states,and the nation.
Echoing these concerns, a symposium addressing high-stakes assessment(National Clearinghouse for Bilingual Education [NCBE], 1997) made severalrecommendations about appropriate accommodations for ELL students. A panel at thesymposium recommended that assessments mainly be used to help educators improveinstruction. The panel added that, in addition to providing accommodation in theadministration of assessments, scoring rubrics for open-ended items must be sensitiveto the language and cultural characteristics of ELL students. Another panel at thesymposium recommended that researchers attempt to determine when ELL studentsare prepared to take specific tests (see NCBE).

11
Accommodation Defined
In an earlier incarnation of the No Child Left Behind Act—The ImprovingAmerica’s Schools Act of 1994—we find the mandate: “Limited-English-proficientstudents . . . shall be assessed to the extent practical in the language and form mostlikely to yield accurate and reliable information on what students know and can do todetermine such students’ mastery of skills and subjects other than English.” The debateon what form such assessments should take continues. Accommodations, sometimesreferred to as modifications or adaptations, are intended to “level the playing field,” sothat students may provide a clearer picture of what they know and can do, especiallywith regard to content-based assessments (e.g., mathematics and science), whereperformance may be confounded with their English or home language proficiency orother background variables. Accommodations are not intended to give ELL students anunfair advantage over students not receiving an accommodated assessment.
The umbrella term “accommodation” includes two types of changes: modificationsof the test itself and modifications of the test procedure. The first type, changes in thetest format, includes translated or adapted tests, for example.:
• a translation of the assessment into the student’s home language;
• a bilingual version of the test (items in English and in home language);
• modification of linguistic complexity in the test; or
• incorporation of home language and/or English glossaries into the test.
These accommodations may directly address the linguistic needs of the student,
but they must be chosen with knowledge of the students’ literacy level in the homelanguage, and the students’ exposure to glossary use. Modified tests must be designedwith care to ensure that the accommodated format does not change the construct beingmeasured. For this reason, schools have more often employed accommodations of thesecond type: changes in the test procedure. Examples (from Rivera et al., 2000) include:
• allowing English language learners to have extended time to take the test onthe same day;
• multiple testing sessions, small group or separate room administration, orindividual administration;
• administration by a familiar test administrator;
• availability of published dictionaries or bilingual glossaries;

12
• simplified directions;
• repeated instructions;
• translating the directions; or
• reading the directions or questions aloud.
Validity Questions
When testing academic achievement in content areas, assessments must providevalid information about student ability in specific content areas, such as math orscience. Ideally, instruments will yield beneficial and accurate information aboutstudent learning. In order to provide the most meaningful achievement data, severalquestions are addressed when evaluating assessments (LaCelle-Peterson & Rivera,1994). The first set of questions concern test validity.
Is the test valid for the school populations being assessed—including ELL students?
Have available translations been validated and normed?
Has the role of language been taken into account in the scoring criteria?
Do the scoring criteria for content area assessments focus on the knowledge, skills, and
abilities being tested, and not on the quality of the language in which the response isexpressed? Are ELL students inappropriately being penalized for lacking English language
skills?
Are raters who score students’ work trained to recognize and score ELL responses?
And to examine assessment equity, the following are asked.
Are ELL students adequately prepared and instructed to demonstrate knowledge of thecontent being assessed?
Have ELL students been given adequate preparation to respond to the items or tasks of theassessment?
Has the content of the test been examined for evidence of cultural, gender or other biases?
Is the assessment appropriate for the purpose(s) intended?
Has appropriate accommodation been provided that would give ELL students the sameopportunity available to monolingual students?

13
Appropriate test accommodation helps “level the playing field” by ensuring thevalidity of the test for all students. To do this, it is important for accommodation not togive an advantage to students who receive them over students who do not (Rivera &Stansfield, 1998). For example, students who have access to standard publisheddictionaries during an assessment may be able to correctly respond to certain items onlybecause the answer to the item is contained within a dictionary definition (see Abedi, etal., 1998; Abedi, Lord, Hofstetter et al., 2000). Another example of an unfair advantage isproviding extra time to ELL students in a “speed test.” This validity problem wasverified when non-ELL students with extra time scored higher than other, comparablenon-ELLs without extra time who were not able to complete the test items (Hafner,2001). An extra time accommodation may be valid when speed is not being tested andthe language of the test items merits extra time for “decoding” or using a glossaryaccommodation.
Accommodation may improve the accuracy of test scores by eliminating irrelevantobstacles for ELL students (Rivera & Stansfield, 1998). Therefore, scores earned on testswith appropriate accommodation are more likely to maintain the validity of the test andminimize error in the measurement of the student’s abilities. These tests will be more ofa measure of the individual’s true ability in the subject being assessed than scoresearned on tests without appropriate accommodation. The accommodation may alsoincrease the comparability of scores (Rivera & Stansfield).
Linguistic Complexity of Test Items
Standardized achievement tests attempt to measure students’ knowledge ofspecific content areas. However, analyses of mathematics and science subsections of 3rd-and 11th-grade standardized content assessments by Imbens-Bailey and Castellon-Wellington (1999) pointed out that two thirds of the items include non-contentvocabulary considered uncommon or used in an atypical manner. One third of theitems included complex or unusually constructed syntactic structures. To accuratelyassess knowledge within content areas, students must comprehend what the items areasking and understand the response choices.
Analyses based on the linguistic complexity of items (Abedi et al., 1997) revealedsignificant differences with respect to language background between student scores oncomplex items and less complex items. Research clearly shows the impact of students’language background on their performance on math word problems (see, for example,

14
Abedi & Lord, 2001). Language backgrounds may also impact scores on science tests iflanguage comprehension, rather than content knowledge, is reflected in scores.
Linguistic Modification of Test Items
In studies examining the language of math problems, making minor changes in thewording of a problem affected student performance (Cummins, Kintsch, Reusser, &Weimer, 1988; De Corte, Verschaffel, & DeWin, 1985; Hudson, 1983; Riley, Greeno, &Heller, 1983, for example). Larsen, Parker, and Trenholme (1978) compared studentperformance on math problems that differed in sentence complexity and level offamiliarity of the non-math vocabulary. Low-achieving Grade 8 students scoredsignificantly lower on the items with more complex language. Recent studies usingitems from the NAEP assessments compared student scores on actual NAEP items withparallel, modified items in which the math task and math terminology were retainedbut the language was simplified. In studies that have found significant improvements inthe scores of students answering linguistically simpler versions of test items, thelinguistic features that appeared to contribute to the item difficulty were low-frequencyvocabulary and passive voice verb constructions, and longer problem statements(Abedi et al., 1997; Abedi et al., 1998; Abedi & Lord, 2001). In a study testing 946 Grade8 students in math with different accommodations including modified linguisticstructures, provision of extra time, and provision of a glossary, only the modified-language accommodation narrowed the score gap between English language learnersand students proficient in English (Abedi, Courtney, & Leon, 2001). Rivera andStansfield (2001) compared student performance on regular and simplified scienceitems in Grades 4 and 6. Although the small sample size did not show significantdifferences in scores for English language learners, the study did demonstrate thatlinguistic simplification did not affect the scores of the English-proficient students,indicating that linguistic simplification is not a threat to score comparability.
It is interesting that students have indicated preferences for items that weresimpler linguistically in interviews and scored higher, on average, on linguisticallymodified items. The linguistic modification had an especially significant impact for low-performing students. ELL students performed better on linguistically modified testitems than did proficient speakers of English. (Abedi, Courtney, & Leon, 2001; Abedi &Lord, 2001).

15
Effects of Other Language Accommodation
This study focuses on accommodations that directly address the students’anticipated difficulty with the language of the text. This section summarizes severalfindings pertinent to the effectiveness, validity, and feasibility of the approaches used inthis study. We discuss assessments that provide a glossary and the provision of extratime.
Customized English dictionary use. In order to overcome the main disadvantagesof commercial dictionary use as an accommodation (such as accidental provision of testcontent material, difficult format and language, the difficulty of providing dictionaries,and disuse), this study created customized glossaries and dictionaries that are definedand discussed here.
A study of 422 students in Grade 8 science classes (Abedi, Lord, Kim et al., 2000)compared performance on NAEP science items in three test formats: one booklet inoriginal format (no accommodation); one booklet with English glosses and Spanishtranslations in the margins; and one booklet with a customized English dictionary at theend of the test booklet. The customized dictionary included only words that appearedin the test items. English learners scored highest on the customized dictionaryaccommodation. Interestingly, although the accommodations helped the Englishlearners score higher, for the English-proficient students there was no significantdifference between their scores in the three test formats. This suggests that theseaccommodation strategies did not affect the construct.
Abedi, Courtney, & Leon (2001) found that linguistically modified testing, extratime, and glossary plus extra time helped ELL students. The results also suggest that theeffectiveness of accommodation strategies, to some extent, may depend on the students’background variables, particularly their language background variables.
Extra time. Allowing more time to complete test sections than is normally allottedis a common accommodation strategy that does not require changes to the test itself. Itis considered a language accommodation because it may facilitate the decoding of testlanguage, with or without a glossary or dictionary. This accommodation may lead tohigher scores for English learners (Hafner, 2001; Kopriva, 2000).
There is no conclusive research to date on the validity of extra time as anaccommodation strategy for ELL students. In a study allowing extra time to samples ofboth LEP and non-LEP students, the students with the extra time condition showed thehighest scores (Hafner, 2001). While extra time helped Grade 8 English learners on
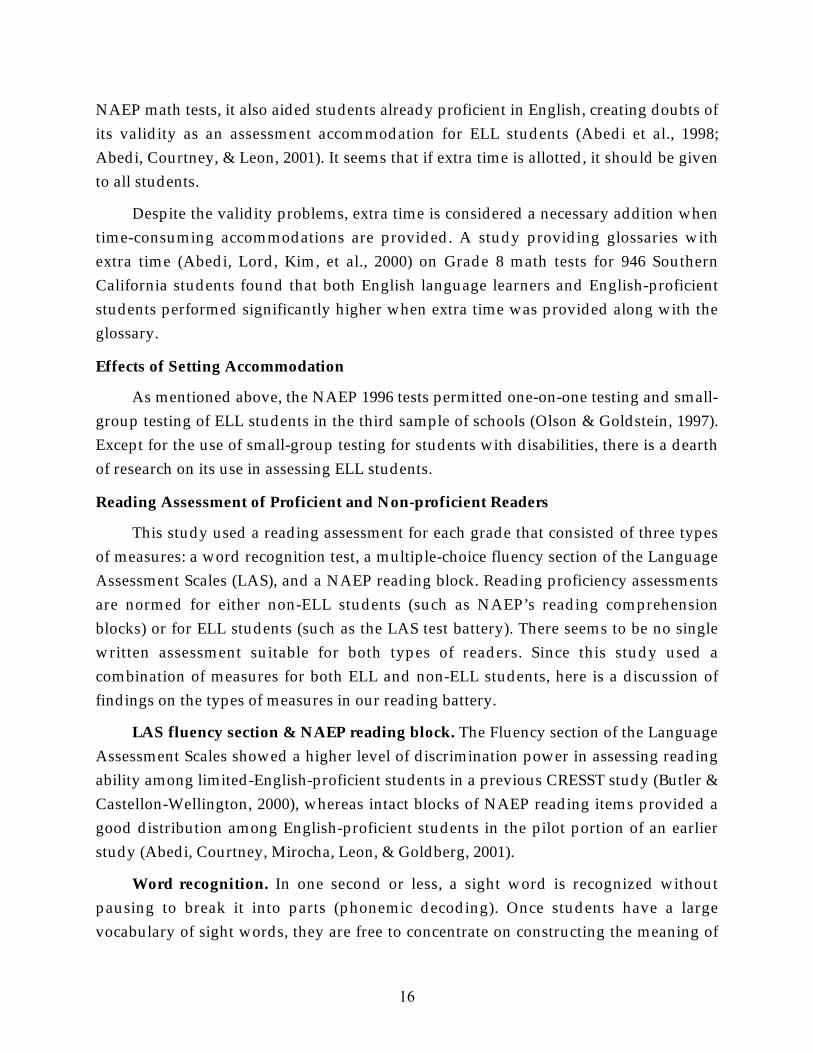
16
NAEP math tests, it also aided students already proficient in English, creating doubts ofits validity as an assessment accommodation for ELL students (Abedi et al., 1998;Abedi, Courtney, & Leon, 2001). It seems that if extra time is allotted, it should be givento all students.
Despite the validity problems, extra time is considered a necessary addition whentime-consuming accommodations are provided. A study providing glossaries withextra time (Abedi, Lord, Kim, et al., 2000) on Grade 8 math tests for 946 SouthernCalifornia students found that both English language learners and English-proficientstudents performed significantly higher when extra time was provided along with theglossary.
Effects of Setting Accommodation
As mentioned above, the NAEP 1996 tests permitted one-on-one testing and small-group testing of ELL students in the third sample of schools (Olson & Goldstein, 1997).Except for the use of small-group testing for students with disabilities, there is a dearthof research on its use in assessing ELL students.
Reading Assessment of Proficient and Non-proficient Readers
This study used a reading assessment for each grade that consisted of three typesof measures: a word recognition test, a multiple-choice fluency section of the LanguageAssessment Scales (LAS), and a NAEP reading block. Reading proficiency assessmentsare normed for either non-ELL students (such as NAEP’s reading comprehensionblocks) or for ELL students (such as the LAS test battery). There seems to be no singlewritten assessment suitable for both types of readers. Since this study used acombination of measures for both ELL and non-ELL students, here is a discussion offindings on the types of measures in our reading battery.
LAS fluency section & NAEP reading block. The Fluency section of the LanguageAssessment Scales showed a higher level of discrimination power in assessing readingability among limited-English-proficient students in a previous CRESST study (Butler &Castellon-Wellington, 2000), whereas intact blocks of NAEP reading items provided agood distribution among English-proficient students in the pilot portion of an earlierstudy (Abedi, Courtney, Mirocha, Leon, & Goldberg, 2001).
Word recognition. In one second or less, a sight word is recognized withoutpausing to break it into parts (phonemic decoding). Once students have a largevocabulary of sight words, they are free to concentrate on constructing the meaning of

17
text (Gough, 1996). Since word recognition is central to the reading process (Chard,Simmons, & Kameenui, 1998), word recognition tests may help to determine readinglevels.
The Eurocentres Vocabulary Size Test (EVST) (Meara & Buxton, 1987; Meara &Jones, 1988) has been used to estimate the vocabulary size of ELL students in languageschools. The EVST estimates a student’s vocabulary size by using a graded sample ofwords covering numerous frequency levels. This test also uses non-words to provide abasis for adjusting the test-takers’ scores if they appear to be overstating theirvocabulary knowledge. A distinctive feature of the EVST is that a computer administersit. Some schools have viewed the EVST as an efficient and accurate placementprocedure, able to assign students to classes with minimum administrative effort (Read,2000).
The great attraction of EVST’s checklist style test format in the estimation ofvocabulary size is how simple it is to construct, administer, and take. The simplicity ofthe task means that a large number of words can be covered within the testing timeavailable, which is important for achieving the sample size necessary for making areliable estimate (Read, 2000).
State Policies on Accommodation
States vary on policies regarding the identification of ELL students and the role ofaccommodation on assessments for ELL students. During the 1998-1999 school year, 40states had accommodation policies and 37 of the 40 allowed accommodations (Rivera etal., 2000), bringing accommodation use to 74% nationwide.
California and Texas are the two states with the largest populations of Spanish-speaking ELL students. Following is a summary of their state policies onaccommodation. (For a more detailed look or for information on other states, see Riveraet al., 2000.)
In California, students are classified as ELL students based on home languagesurveys, English oral/aural proficiency tests, and grade-appropriate literacy tests. Testexemptions are not allowed in California. There is not a specific California State policyregarding accommodation on assessments for ELL students (California Department ofEducation, 2000; Rivera et al., 2000).
In Texas, ELL students are identified based on home language surveys, orallanguage proficiency tests, informal assessments through teacher/parent interviews,

18
student interview or teacher surveys, standardized achievement test scores, andclassroom Grades. Since the 2000-’01 school year, all Texas ELL students take the TexasAssessment of Academic Skills (TAAS) in English or Spanish unless the student is arecent unschooled immigrant enrolled in U.S. schools for 12 months or less. Testingaccommodations are permitted, except those that make a particular test invalid as ameasure for school accountability. The permissible accommodations include translationof directions on all components in a student’s home language and translation of somecomponents of the test in a student’s home language. School district officials are thedecision-makers of ELL accommodation.
In general, state policies on the process of identifying ELL students contain somesimilarities, including collecting information from assessments and home language. Notall states have specific accommodation policies, although all states seem to beaddressing the issues of including all students in large-scale assessments. However,more research is needed to determine the best means of accommodating ELL students.
Participation With Accommodation
Evidence indicates that the provision of accommodation results in higher rates ofparticipation for ELL students (Mazzeo, Carlson, Voelkl, & Lutkus, 2000; O’Sullivan,Reese, & Mazzeo, 1997).
The Summary Report of the 1999–2000 State Student Assessment Programs(CCSSO, 2001) annual survey examined participation in state assessments by ELLstudents and found that 29 states allowed accommodations for ELL students in allassessments, 18 allowed them with some assessments, and four did not permit anyaccommodations for ELL students. An alternate assessment, often used for the leastEnglish proficient who would have been excluded before, was possible for ELLstudents in 16 states. A variety of accommodations were allowed that year: ELLstudents were assessed in a modified setting (44 states); with a modified format ofpresenting the assessment (43 states), such as directions read aloud, interpreted,repeated, etc.; with a change of timing or scheduling (41 states); and/or with a modifiedmethod of responding to the questions, such as marking responses in the booklet, usinga computer, or having a scribe record their answers. The other accommodations listedin the report (permitted in 27 states) were word lists, dictionaries, or glossaries.According to Rivera et al. (2000), a survey of state assessment directors for 1998-1999found 21 states that allowed bilingual dictionary accommodations on reading tests; 11of the 21 allowed them for all parts of the assessment.

19
Rivera, Vincent, Hafner, and LaCelle-Peterson (1997) noted that 52% of statesreported that they allowed test modifications for ELL students on at least one statewideassessment. Extra time was the most frequent test modification reported by states. TheNorth Central Regional Educational Laboratory (NCREL) also found that half of thestates reported allowing accommodations for ELL students, including separate settings,flexible testing schedules, small-group administration, extra time, and simplifieddirections (Liu et al., 1997; NCREL, 1996a, 1996b). Some states, such as Arizona, Hawaii,New Mexico, and New York, used other languages for the test or an alternative test (Liuet al.).
The National Assessment of Educational Progress (NAEP) has been providingaccommodation to some ELL participants for many years. In the NAEP field test in1995, several accommodations for mathematics were provided for ELL students.Administrative procedures included extra testing time, modifications in theadministration of sessions, and facilitation in the reading of directions. Also, Spanish-English bilingual assessment booklets, with items in different languages presented onfacing pages, and Spanish-only assessment booklets were available. Most ELL studentschose to take the Spanish version. The results indicated that the translated versions ofsome items might not have been parallel in measurement properties to the Englishversions (Olson & Goldstein, 1997).
The NAEP 1996 tests were designed with three samples of schools, using the 1996inclusion criteria in the second and third samples and having assessmentaccommodations available in the third sample. ELL students were permitted some ofthe accommodations—one-on-one testing, small-group testing, extended time, oralreading of directions, use of magnifying equipment, and the use of an individual torecord answers—plus a Spanish/English glossary of scientific terms. Students using theglossary were usually given extra time. Very few ELL students used the glossaryprovided (O’Sullivan et al., 1997).
Many different forms of accommodation—some of which have shown promisingresults—have been documented (see Abedi et al., 1998; Castellon-Wellington, 2000; Liu,Anderson, Swierzbin, Spicuzza, & Thurlow, 1999; Liu, Anderson, Swierzbin, &Thurlow, 1999; Mazzeo, 1997; Miller, Okum, Sinai, & Miller, 1999; Olson & Goldstein,1997). However, some accommodation strategies that have demonstrated effectivenessmay not be the most feasible accommodations. For example, an accommodationconsisting of testing one-on-one was used in NAEP assessment (see Mazzeo). This formof accommodation—among others that were used in NAEP main

20
assessment—increased the level of inclusion of students with limited Englishproficiency. However, one-on-one testing is neither space-, time-, nor cost-efficientenough to be a feasibility favorite in large-scale assessments.

21
Methods
Instrumentation
Math Tests. Math tests were assembled for Grade 4 and Grade 8 students usinga combination of NAEP (1996) and TIMSS (1994-5) public release items.6 Two formsof math tests were constructed: Form A and Form B. The two forms had the samemath items, but in different locations. Thus, having two test forms allowed us toexamine the difficulty level of test items at different locations. It also helped to detercheating. Items were selected to test a range of content areas with a varied range oflanguage demand. Tables A3 and A4 show the distribution of content areas coveredin each math test. Tables A5 and A6 show the variation of linguistic complexityamong the items (see Appendix A). Each math test was made into a computerversion as well.
Reading proficiency tests. A reading measure is an essential part of theaccommodation study since students at different levels of reading proficiency maybenefit differently from the accommodations used in the study. A battery of Englishreading proficiency tests were chosen for this study to measure student levels ofreading proficiency. The battery included the fluency subscale of LanguageProficiency Scales (LAS) (to provide a good distribution among various levels ofELL students), a NAEP reading block, and a CRESST-devised test of English wordrecognition. CRESST researchers have already examined the content coverage ofsome commonly used English language and literacy tests. (See Abedi, Courtney,Mirocha et al., 2000; Imbens-Bailey, Dingle, & Moughamian, 1999.) All sections wereadministered within rigid time restrictions.
Accommodation follow-up questionnaire. This brief feedback gatheredstudents’ opinions of the math test and accommodations—and on math tests andtest accommodations in general.
Background questionnaire. The background questionnaire included questionson student background characteristics, such as gender and ethnicity. Thequestionnaire also included questions pertaining to students’ language background,such as length of time in the United States, language other than English spoken inthe home, and country of origin.
6 The Third International Mathematics and Science Study (TIMSS).
22
Teacher and school questionnaire. Teacher and school questionnaires wereadministered. The teacher questionnaire included questions regarding teachers’educational background and experience as well as the teachers’ teaching of scienceand use of accommodation in the classroom. The school questionnaire includedquestions about school population and resources.
Sample and Design
Classes of students in Grades 4 and 8 in a single urban public school district inSouthern California were tested in math and reading on 2 consecutive days. InGrade 4, 666 students participated; 304 of them English language learners (ELLs)classified as limited English proficient (LEP). In Grade 8, of the 643 participants, 290of them were classified as LEP. Of the 1,309 total student participants, 594 wereclassified by their schools as LEP. A total of 29 Grade 4 and 27 Grade 8 classesparticipated from 9 elementary schools, 7 middle schools and 1 K-12 newcomerschool (see Tables A1 and A2).
We examined the test results and questionnaires from a net total of 607students in Grade 4 and 542 students in Grade 8.7 The minimum number of subjectper cell was calculated through a power analysis (see Kirk, 1995, pp. 60-64) using thevariance that was obtained in an earlier, similar CRESST accommodations study(Abedi et al., 1998). This number of subjects has proven to be sufficient for theanalytic work needed for research and policy purposes. We analyzed the results of1149 participants in this study.
In Grade 4, of the net total of 607 students, 279 or 46% were ELL students and328 or 54% were non-ELL students. Of the net total of 542 Grade 8 students, 256students (47%) were ELL students and 286 (53%) were non-ELL students. Fourdifferent forms of accommodation were administered to Grade 4 students and twoforms for Grade 8. A control or comparison group was included in the study tomeasure the effectiveness of accommodation strategies. In addition to a comparisongroup that received no accommodation, non-ELL students were sampled in thisstudy to serve as another control or comparison group to determine the impact ofaccommodation on the construct under measurement.
7 A small number of participants were excluded from the study because they were completely non-English-speaking or were absent on one of the two days of testing. In addition, when accommodated results werecompared, the scores of the 20 small-group participants were excluded.
23
For Grade 4, five accommodation conditions were used: (a) customized Englishdictionary, (b) small-group testing, (c) extended time, (d) computer testing, and (e)no accommodation. This generated 10 cells for Grade 4 students: fiveaccommodation conditions for ELL students and five for non-ELL students.
For students in Grade 8, the extension of testing time and small-group testingwere excluded from the accommodation. For this grade, the accommodations were:(a) customized English dictionary, (b) computer testing, and (c) no accommodation.Thus, for Grade 8, we generated 6 cells.
The timing of the test allowed extra assessment time in order for studentsassigned an accommodation to make use of the customized English dictionary or thecomputer test’s pop-up glossary. To absorb their extra time, students who did notreceive an accommodation were given a word list and asked to check off which testwords were difficult to understand.
Customized English dictionary. This is the second CRESST study to use acustomized English dictionary as an accommodation. This tool simulates the lookand full entries of a dictionary without the bulk of the entire text or the unfairadvantage of providing definitions for terms and concepts being tested. To the left ofeach entry is a circle for students to check if they looked up that word.
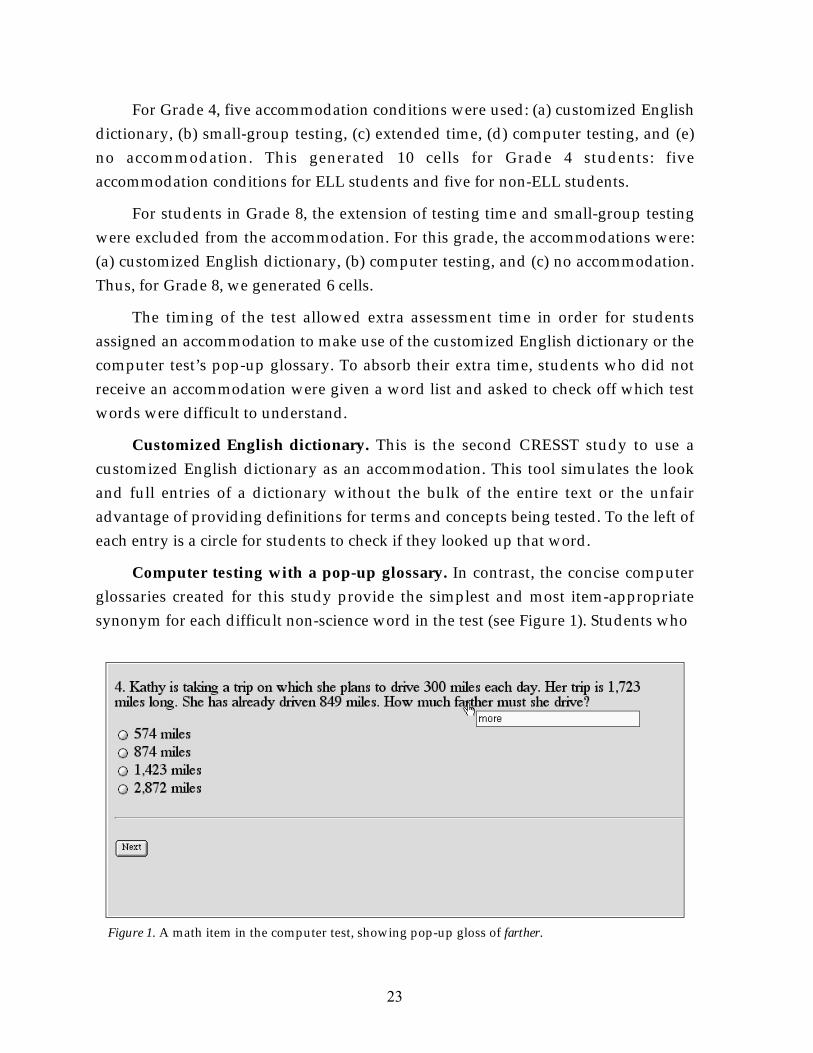
Computer testing with a pop-up glossary. In contrast, the concise computerglossaries created for this study provide the simplest and most item-appropriatesynonym for each difficult non-science word in the test (see Figure 1). Students who
Figure 1. A math item in the computer test, showing pop-up gloss of farther.

24
took the computer version of the math test had access to a “pop-up glossary,” afeature that provided a simple gloss of a word with the touch of the (mouse) pointer.The program timed the length of time students spend on each test item and the timethat the gloss appeared on the screen.
Small-group testing. Four to 7 students were tested at once in a separate room,usually a quiet school library.
Testing with extra time. Eight intact Grade 4 classes were tested with extratime for completing the math test.
Distributing Grade 4 accommodations. If computer testing was possible, 1 to 4ELL students were randomly selected for that accommodation, as were 1 to 4 non-ELL students. Where small-group testing was possible, 4 to 7 students (just over halfELLs) were randomly selected for that accommodation. Their classmates remainedin their classroom, and 50% to 60% of them (a fairly even mixture of ELL and non-ELL students) were randomly given a glossary called a customized Englishdictionary with the math test. The remaining students were given a list of the samewords, unglossed. Eight of the Grade 4 classes received an accommodation of extratime, but no customized dictionary.
While 3 of the participating elementary schools had no Internet capability atthe time, 14 classes in 6 of the schools had the facilities to host the computer versionof the tests, in most cases a quiet room. Only 4 elementary schools had the space toaccommodate small-group testing.
Of the 607 Grade 4 participants, 157 (25.9%; 64 ELL, 93 non-ELL) were assessedunder the customized dictionary condition, 20 (3.3%; 11 ELL, 9 non-ELL) with small-group testing, 173 (28.5%; 89 ELL, 84 non-ELL) with extended time, and 79 students(13%; 35 ELL, 44 non-ELL) with computer testing. Testing under the standard (non-accommodated) condition were 178 participants (29.3%; 80 ELL, 98 non-ELL). Thetotals analyzed in each accommodation group are listed again in Table 1.
Distributing Grade 8 accommodations. If computer testing was possible, oneto 16 ELL students were randomly selected for that accommodation, as were one to11 non-ELL students.8 Their classmates remained in their classroom, and 50% to 60%
8 Some classes contained only ELL or only non-ELL students. One large group of ELL students was split intotwo groups for computer testing to keep the group size to 11 or less.

25
Table 1
Number of Students Tested Under Different Forms of Accommodation byELL Categories
Type of accommodation/grade Total ELL Non-ELL
Grade 4
Customized dictionary 157 64 93
Small-group testing 20 11 9
Extended time 173 89 84
Computer testing 79 35 44
No-accommodation 178 80 98
Total 607 279 328
Grade 8
Customized dictionary 173 86 87
Computer testing 152 84 68
No-accommodation 217 86 131
Total 542 256 286
of them were given a glossary called a customized English dictionary with the mathtest. The remaining students were given a list of the same words, un-glossed.
While 3 of the participating middle schools had no Internet capability at thetime, there were 20 computer-testing groups in 7 of the schools. We tested between 5and 11 Grade 8 students at a time on the computer version of the tests.
Of the 542 Grade 8 participants, 173 students were assessed under thecustomized dictionary condition (32%; 86 ELL and 87 non-ELL), 152 with computertesting (28%; 84 ELL and 68 non-ELL), and 217 were tested under the standard (noaccommodation) condition (40%; 86 ELL and 131 non-ELL). The totals analyzed ineach accommodation group are shown above in Table 1.
Test Administration
Test administrators followed a script so that all study participants received thesame instructions. The tests included instructions and samples of multiple-choiceand open-ended questions. Where glossaries were administered, the students wereasked to find and mark a particular word in the customized dictionary or (if non-accommodated) in the word list. Most of the testing occurred in the students’regular classroom. The few small-group-testing sessions were held in a library or

26
resource room. We conducted computer testing in a library, a computer lab, or aclassroom—usually separate from the rest of the class.
The math test administration of the customized dictionary and standard (non-accommodated) conditions had the same allotment of time, 40 minutes for Grade 4and 30 minutes for Grade 8. The Grade 4 math testing with extra time was allotted60 minutes, but few students took advantage of the extra time. Reading tests,whether on paper or computer, were given without extra time. The computer andsmall-group conditions were administered with extra time, except where middleschool or school bus schedules did not permit.
Computer testing. Computer testing was given in a variety of locations on oneof three types of computers. The best computer test situation was a set-up withCRESST’s PC laptops (using the Internet Explorer browser) in a quiet lab or library.This created the most uniform look and behavior of the tests and pop-up glossaryfor all students. Additionally, the data came across to the server without beingaffected by school computers’ idiosyncratic settings.9
Questionnaire Administration
In most cases, the accommodation follow-up questionnaire was administeredimmediately after the math test. The student background questionnaire wasadministered during a time convenient to the testing schedule. Usually, the studentbackground questionnaire was filled out during the first testing visit, checked by thetest administrators for consistency and completeness, and, as needed, was correctedby the student on the second visit.
The test and questionnaire data were scanned into a database and verifiedusing the TELEform software. The scanned entry of every student ID on each of thefour instruments was verified.
9 The second-best platform was using a school s PCs (loaded with Internet Explorer), with each display set to800 x 600 pixels, and with auto-complete turned off. A less test-friendly computer set-up was when we usedschools Macintosh computers especially those with older or un-compatible Web browsers. In some cases, wewere not able to use existing computer labs because the school s computers small memory capacity made thetest pages and their images load too slowly. While many schools had Internet access in a quiet lab or a library,the worst testing environments were in the classroom where the computers worked. In these cases, the roomhost lectured to a history class while our participants took their tests. We were pleased with the participantsability to focus on the computer test.

27
Rating Open-Ended Items
The Grade 4 and 8 math and reading tests included open-ended items. Thestudents’ answers were rated by trained, degreed personnel whose work waschecked for interrater reliability. NAEP scoring rubrics were used for both math andreading tests. The training encouraged raters to score only the substantive content ofthe responses only to the extent possible (rather than consider the composition,grammar, spelling, or punctuation). In other words, efforts were made to rate itemsbased on the rubric (the evidence of reading comprehension or mathematicalunderstanding in each response), not on the fluency of the English prose. Anyretraining focused on agreeing how to interpret the rubric.
For 10% of the tests, two raters rated each open-ended item separately. Theinterrater reliability indices included percent of exact and within one pointagreement, Product Moment correlation, intra-class correlation, kappa coefficient,and Williams’ index or rater consistency. Computation of interrater reliabilities wasperformed through the use of Inter-rater Test Reliability System (ITRS). (For adiscussion of ITRS and different interrater reliability indices, see Abedi, 1996.) Afterthese responses were double-rated, interrater reliabilities were calculated. Raterswere given additional rubric training for items with low reliability statistics. Onceinterrater reliabilities were proven to be satisfactory, a single rater then scored theremainder of the items.
Grade 4 math test. All items showed high interrater consistency (reliabilitiesranging from .810 to .981). Table 2 presents a summary of the interrater reliabilityanalyses for the Grade 4 open-ended math items.
Grade 4 reading test. There was more variability in the interrater reliabilitiesfor the reading test items than the interrater reliabilities for the math test items(kappas ranging from .667 to .984). See Table 2 for reliability summaries for theGrade 4 open-ended reading items.

28
Table 2
Grade 4 Results of Interrater Reliability Studies for Open-Ended TestItems
Item # # Students Kappa % Agreement
Math 13A/19B 120 .981 99.17
Math 14A/20B 124 .851 92.74
Math 26A/27B 111 .810 86.49
Math 27A/26B 118 .950 96.61
Reading 1 124 .984 99.19
Reading 6 110 .890 98.18
Reading 8 104 .881 96.15
Reading 10 93 .667 84.95
Grade 8 math test. Equivalent scoring and training procedures were providedfor rating the Grade 8 math items. Again, after all responses for the first 10% of thestudents were rated, interrater reliabilities were calculated. All the math itemsshowed high to perfect interrater consistency (reliabilities ranging from .854 to .990).Many students left the more difficult items blank, which explains why some of thenumbers are small. None of the “blank” responses were included in the interraterreliability analyses. Table 3 presents a summary of the interrater reliability analysesfor the Grade 8 open-ended math items.
Grade 8 reading test. Generally, the interrater reliabilities for the reading testitems were lower (kappas ranging from .708 to .942) than for the math test items,with one item posing considerable difficulty for the raters (kappa = .529). See Table3 for reliability summaries for the Grade 8 open-ended reading items.
Rating of Items for Linguistic Complexity
Our previous studies have clearly shown that linguistic complexity of content-based test items negatively impacts the performance of ELL students (see forexample, Abedi et al., 1997; Abedi, Courtney, & Leon, 2001; Abedi & Lord, 2001). Toexamine such an effect and to control for linguistic complexity of math test items,individual test items were rated for linguistic complexity.
The linguistic complexity rating was based on the rubric developed in ourearlier studies (Abedi, Courtney, Mirocha, et al., 2001). These ratings are compositesfrom the scores given by two college instructors of English grammar. A 5-point

29
Table 3
Grade 8 Results of Interrater Reliability Studies for Open-Ended Test Items
Item # # Students Kappa % Agreement
Math 16A/21B “Estimate” 91 1.000 100.00
Math 16A/21B “Explain” 71 .854 95.77
Math 20A/34B 47 1.000 100.00
Math 22A/20B 113 .968 98.23
Math 24A/22B 71 1.000 100.00
Math 25A/17B 47 .956 97.87
Math 35A/35B 12 1.000 100.00
Reading 1 131 .922 96.18
Reading 2 121 .708 89.26
Reading 3 105 .763 85.71
Reading 4 71 .529 74.65
Reading 6 82 .942 96.34
Reading 9 55 .808 89.09
Likert scale was used for rating linguistic difficulty of the items (0 being lesslinguistically complex to 4 being very complex). (A rating for each math item isfound in Table A5 for Grade 4 and in Table A6 for Grade 8 items.) We combineditems into two categories, less complex (0, 1, and 2) and more complex (3 and 4). Wecreated two testlets accordingly. We examined the hypotheses of effectiveness andvalidity separately for each testlet.
We looked at how accommodation effect varied between the two testlets byperforming a multivariate analysis of covariance in order to assess whether thesignificant accommodation effect found in the total score was due to the complexityof the item.
Math performance of ELLs and non-ELLs was also compared using analysis ofvariance. The results will be discussed in the next chapter.
Psychometric issues concerning English reading proficiency tests. Bothclassical and modern test theories discuss the issues concerning the impact of testlength on reliability of the entire test. For example, in classical test theory, “as ageneral rule, the more items in a test, the more reliable the test” (Salvia & Ysseldyke,1998, p. 149), assuming test items are unidimensional. Similarly, in Generalizability(G) Theory, when test items as a facet of a G study have a substantial contribution to

30
the measurement error in terms of both relative and absolute decisions (seeShavelson & Webb, 1991), then increasing the number of items reduces the source oferror due to test items. One can expand the concept of test length to multipleoutcome measures. A single outcome measure may not be as reliable as a compositeof several outcome measures assuming unidimensionality of the components. Thismay be more evident in areas where complex measurement is taken.
The literature is clear on the lack of a single reliable and valid measure ofEnglish reading proficiency (see for example, Abedi, Courtney, & Leon, 2001). Forexample, the most commonly used English language proficiency tests may not haveenough discrimination power to be used as a single measure of English proficiency.On the other hand, other tests of English language (measures of language arts suchas reading, writing, and vocabulary) may be more difficult for ELL students in thelower part of the English language proficiency distribution. Therefore, the scoredistribution of English language measures may be either highly skewed to the left(positive skew, being difficult for lower performing kids) or highly skewed to theright (negative skew, lack of enough discrimination power).
A solution to this problem is to provide multiple measures of English readingproficiency and create a composite of scores. The composite score is obtainedthrough a simple composite approach by averaging the scores after adjusting forscale differences. If the score components are highly correlated (.80 and above), thisis a reasonable approach. However, if the components are not highly correlated,then a latent-variable modeling approach is more appropriate. A latent composite isthen used as a covariate, for example, in the analyses comparing accommodated andnon-accommodated performance.
In this study we obtained multiple measures of students’ English proficiency.Composites of these measures were obtained in both ways, simple and latent-composites. Figure 2 presents a model of a composite English measure. As Figure 2shows, the reading latent variable is defined as the common variance among threemeasures: (a) LAS fluency section, (b) NAEP open-ended reading comprehensionquestions, and (c) NAEP multiple-choice reading questions. To estimate the validityof the latent composite, it was correlated with the NCE (Normal Curve Equivalent)scores of the Stanford 9 (SAT9) test. Table 4 summarizes some of the results of thisanalysis. As Table 4 shows, the correlation between the reading SAT9 and the simplereading composite was .675. The correlation between the SAT9 and readingincreases slightly to .698 when the SAT9 scores are correlated with the latent reading

31
composite. For math, correlation between SAT9 and simple math composite (.566) isidentical with the correlation between the SAT9 and the latent composite (.566).
To be used as an effective covariate, a variable must be highly correlated withthe outcome variable. We computed the correlation between the simple mathcomposite and the simple English reading composite (r = .558) and we compared itwith the correlation between the two latent composites (math and reading) (r = .559).Since the data did not show much difference between the simple and latentcomposite in this case, we used the simple composite in our analyses and reported itbecause it is easier to report.
Figure 2. Latent variable diagrams.

32
Table 4
Pearson Correlations: Stanford 9 Normal Curve Equivalents With Total Test Raw Scores andLatent Factor Scores
Test raw scores Latent factor scores
Reading Math Reading Math
Reading SAT9 .675(n = 427)
.579(n = 427)
.698(n = 427)
NA
Math SAT9 .479(n = 420)
.566(n = 420)
NA .566(n = 420)

33
Results
To examine the effectiveness and validity of accommodations for ELL students,sampled students in Grades 4 and 8 were observed under different forms ofaccommodation, and under a control condition where no accommodation wasprovided. The purpose of this study was to test the three main research hypotheses,each related to one of the issues related to accommodation. They were: (1)effectiveness, (2) validity, and (3) feasibility. The accommodation plan was slightlydifferent for the two grades. As indicated earlier, Grade 4 students were assessedunder four different accommodation strategies (computer testing, extra time,customized dictionary, and small-group testing), as well as under a standardcondition where no accommodation was provided. However, Grade 8 students weretested under two accommodations (computer testing and customized dictionary)and under the standard condition. Because of such a difference amongaccommodation conditions across the two grades, we report the findings separatelyfor the two grades. The research questions for this study are:
• Which test accommodations are more effective in reducing the gap inperformance between ELL and non-ELL students? (effectiveness)
• Do the accommodations impact the validity of the assessment (i.e., changethe content of the assessment)? (validity)
• Are the accommodations that reduce the performance gap between ELL andnon-ELL students (without altering the construct) easily implemented?(feasibility)
Results for Grade 4 Students
Effectiveness. We tested ELL and non-ELL students in Grade 4 under fiveconditions: four different accommodations and a standard condition. Studentstested under the standard condition served as a control group. We also studied non-ELL students under the five conditions to provide data for examining the validity ofaccommodations used in this study. A comparison among the math mean scores ofELL students receiving different forms of accommodation with the mean scores ofELL students under the standard condition provides evidence on the effectiveness ofthe accommodations for ELL students. Those accommodations that help studentsperform significantly higher than the standard, no-accommodation condition arelabeled as effective. The higher the difference between the accommodated and non-accommodated performance, the more effective is the accommodation.

34
Table 5 presents the means, standard deviations, and numbers of students foreach of the five conditions (four accommodations and the standard condition). Asthe data in Table 5 show, a total of 279 Grade 4 ELL students were tested under thefive conditions. Because there were limits to how many we could testsimultaneously on computers, a smaller number of students were tested under thiscondition (n = 35). The mean score for students under the computer accommodationwas 14.69 (SD = 5.12, n = 35); under the extra time accommodation, the mean was13.74 (SD = 6.02, n = 89); under the customized dictionary accommodation the meanwas 13.81 (SD = 6.04, n = 64); under the small-group accommodation, the mean was9.55 (SD = 2.88, n = 11); and under the standard condition, the mean math score was12.27 (SD = 5.24, n = 80). As these data suggest, students in Grade 4 performed betterunder most forms of accommodation that were provided in this study. However, thedata also is clear that students benefited more from some forms of accommodationthan others. For example, students taking the computer test obtained 2.42 scorepoints (about a half standard deviation) higher than students under the standardcondition. This difference becomes smaller with the other accommodations. Thedifference in student performance under extra time and standard condition was 1.47(about a quarter standard deviation). For the customized dictionary, the differencewas 1.54 (about a quarter standard deviation), and for small-group testing, thedifference was 2.72.
The data in Table 5 suggest that students performed better under allaccommodation conditions except small-group testing. Since the number of studentswho participated in small-group testing was very small, descriptive statistics for thisaccommodation may not be reliable; therefore, further analyses were not performedon the data from this accommodation.
These accommodations are considered effective if the difference inperformance is statistically significant. We randomly assigned students to thedifferent accommodation conditions (8 groups, 4 ELL and 4 non-ELL). However, inspite of randomization of students to the 8 accommodation conditions, initialEnglish proficiency differences may exist. If so, a significant difference betweenaccommodated and non-accommodated conditions may be due to such initialdifferences. That is, students testing under a high-scoring accommodation conditionmay have belonged to a higher (math) performance group with higher level ofEnglish proficiency. To adjust for any initial difference in the level of Englishproficiency, the reading total score (LAS subscale score plus multiple-choice and
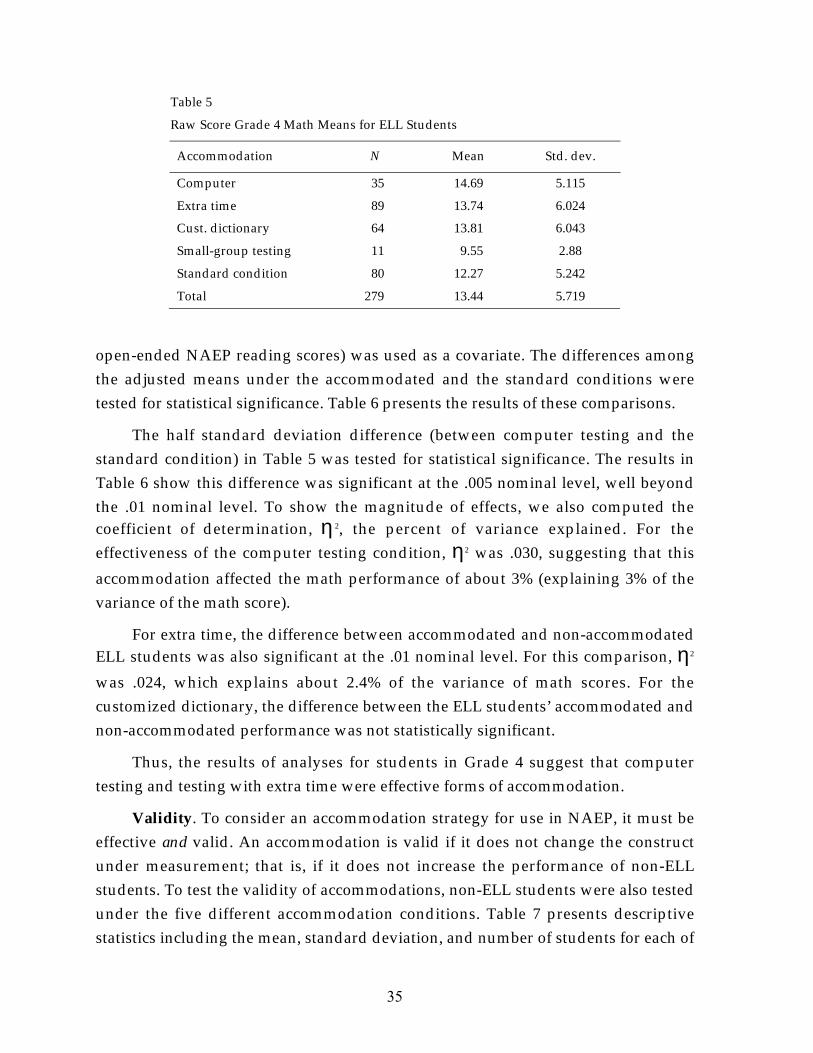
35
Table 5
Raw Score Grade 4 Math Means for ELL Students
Accommodation N Mean Std. dev.
Computer 35 14.69 5.115
Extra time 89 13.74 6.024
Cust. dictionary 64 13.81 6.043
Small-group testing 11 9.55 2.88
Standard condition 80 12.27 5.242
Total 279 13.44 5.719
open-ended NAEP reading scores) was used as a covariate. The differences amongthe adjusted means under the accommodated and the standard conditions weretested for statistical significance. Table 6 presents the results of these comparisons.
The half standard deviation difference (between computer testing and thestandard condition) in Table 5 was tested for statistical significance. The results inTable 6 show this difference was significant at the .005 nominal level, well beyondthe .01 nominal level. To show the magnitude of effects, we also computed thecoefficient of determination, η 2, the percent of variance explained. For theeffectiveness of the computer testing condition, η2 was .030, suggesting that this
accommodation affected the math performance of about 3% (explaining 3% of thevariance of the math score).
For extra time, the difference between accommodated and non-accommodatedELL students was also significant at the .01 nominal level. For this comparison, η2
was .024, which explains about 2.4% of the variance of math scores. For thecustomized dictionary, the difference between the ELL students’ accommodated andnon-accommodated performance was not statistically significant.
Thus, the results of analyses for students in Grade 4 suggest that computertesting and testing with extra time were effective forms of accommodation.
Validity. To consider an accommodation strategy for use in NAEP, it must beeffective and valid. An accommodation is valid if it does not change the constructunder measurement; that is, if it does not increase the performance of non-ELLstudents. To test the validity of accommodations, non-ELL students were also testedunder the five different accommodation conditions. Table 7 presents descriptivestatistics including the mean, standard deviation, and number of students for each of
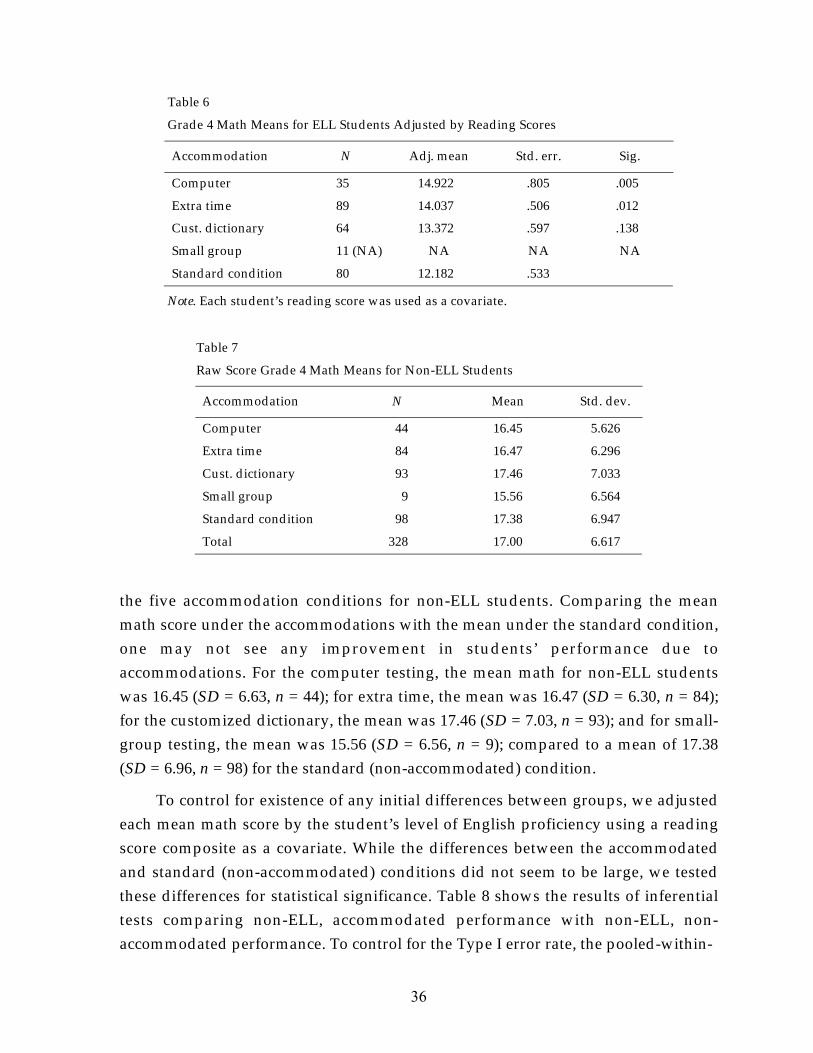
36
Table 6
Grade 4 Math Means for ELL Students Adjusted by Reading Scores
Accommodation N Adj. mean Std. err. Sig.
Computer 35 14.922 .805 .005
Extra time 89 14.037 .506 .012
Cust. dictionary 64 13.372 .597 .138
Small group 11 (NA) NA NA NA
Standard condition 80 12.182 .533
Note. Each student’s reading score was used as a covariate.
Table 7
Raw Score Grade 4 Math Means for Non-ELL Students
Accommodation N Mean Std. dev.
Computer 44 16.45 5.626
Extra time 84 16.47 6.296
Cust. dictionary 93 17.46 7.033
Small group 9 15.56 6.564
Standard condition 98 17.38 6.947
Total 328 17.00 6.617
the five accommodation conditions for non-ELL students. Comparing the meanmath score under the accommodations with the mean under the standard condition,one may not see any improvement in students’ performance due toaccommodations. For the computer testing, the mean math for non-ELL studentswas 16.45 (SD = 6.63, n = 44); for extra time, the mean was 16.47 (SD = 6.30, n = 84);for the customized dictionary, the mean was 17.46 (SD = 7.03, n = 93); and for small-group testing, the mean was 15.56 (SD = 6.56, n = 9); compared to a mean of 17.38(SD = 6.96, n = 98) for the standard (non-accommodated) condition.
To control for existence of any initial differences between groups, we adjustedeach mean math score by the student’s level of English proficiency using a readingscore composite as a covariate. While the differences between the accommodatedand standard (non-accommodated) conditions did not seem to be large, we testedthese differences for statistical significance. Table 8 shows the results of inferentialtests comparing non-ELL, accommodated performance with non-ELL, non-accommodated performance. To control for the Type I error rate, the pooled-within-
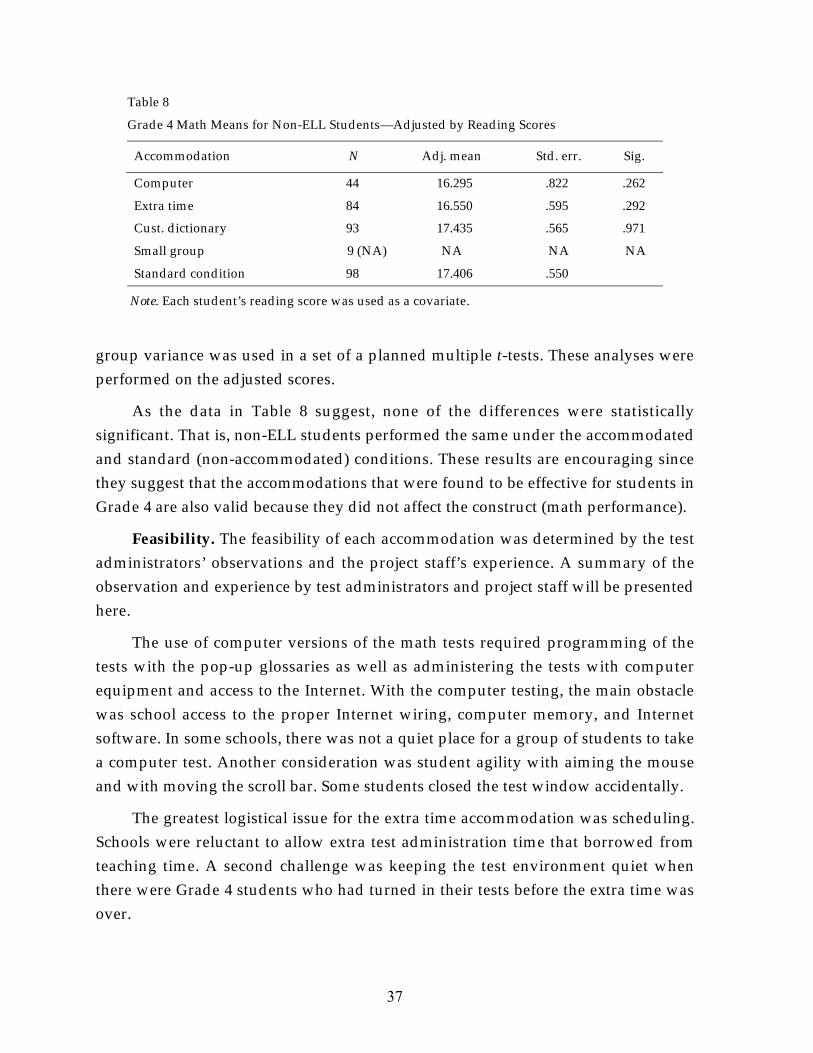
37
Table 8
Grade 4 Math Means for Non-ELL Students—Adjusted by Reading Scores
Accommodation N Adj. mean Std. err. Sig.
Computer 44 16.295 .822 .262
Extra time 84 16.550 .595 .292
Cust. dictionary 93 17.435 .565 .971
Small group 9 (NA) NA NA NA
Standard condition 98 17.406 .550
Note. Each student’s reading score was used as a covariate.
group variance was used in a set of a planned multiple t-tests. These analyses wereperformed on the adjusted scores.
As the data in Table 8 suggest, none of the differences were statisticallysignificant. That is, non-ELL students performed the same under the accommodatedand standard (non-accommodated) conditions. These results are encouraging sincethey suggest that the accommodations that were found to be effective for students inGrade 4 are also valid because they did not affect the construct (math performance).
Feasibility. The feasibility of each accommodation was determined by the testadministrators’ observations and the project staff’s experience. A summary of theobservation and experience by test administrators and project staff will be presentedhere.
The use of computer versions of the math tests required programming of thetests with the pop-up glossaries as well as administering the tests with computerequipment and access to the Internet. With the computer testing, the main obstaclewas school access to the proper Internet wiring, computer memory, and Internetsoftware. In some schools, there was not a quiet place for a group of students to takea computer test. Another consideration was student agility with aiming the mouseand with moving the scroll bar. Some students closed the test window accidentally.
The greatest logistical issue for the extra time accommodation was scheduling.Schools were reluctant to allow extra test administration time that borrowed fromteaching time. A second challenge was keeping the test environment quiet whenthere were Grade 4 students who had turned in their tests before the extra time wasover.

38
The project staff spent a substantial amount of time compiling appropriateglossaries for the paper and computer math tests. They worked with contentspecialists to make sure content-related terms were not glossed, and at the sametime, they worked with students to make sure that all non-math terms needingglossing were glossed.
However, the lack of use of the customized English dictionary led us to look forevidence of lack of exposure to dictionary use. We found in the student backgroundquestionnaire that only 12 of the Grade 4 students (7.6%) provided with thecustomized English dictionary stated on the questionnaire that they had used “anEnglish dictionary” in the classroom before (see Table 9). Looking at the responses ofall the Grade 4 participants, only 55 students (9.1%) responded that they had used adictionary in the classroom before. Similarly, when asked on the accommodationfollow-up questionnaire which accommodations they would prefer, only 26 (16.6%)of the students provided with the customized English dictionary and 96 of the totalGrade 4 students (15.8%) stated that they would like an English dictionary “to makeit easier for me to understand math problems” (see Table 10). (See Appendix B forfurther accommodation follow-up questionnaire results.)
Results for Grade 8 Students
Effectiveness. Grade 8 students were assessed under the computer testing andcustomized dictionary accommodations as well as under the standard condition (noaccommodation provided). Table 11 presents descriptive statistics including themean, standard deviation, and number of ELL students for the accommodated and
Table 9
Grade 4 Background Question #5a - I Have Used an English Dictionary
No Yes Total
Accommodation N % N % N %
Computer 77 97.5 2 2.5 79 100.0
Extra time 155 89.6 18 10.4 173 100.0
Cust. dictionary 145 92.4 12 7.6 157 100.0
Small group 17 85.0 3 15.0 20 100.0
Standard condition 158 88.8 20 11.2 178 100.0
Total 552 90.9 55 9.1 607 100.0

39
Table 10
Grade 4 Follow-Up Question #2f - To Make It Easier to Understand MathQuestions I Would Like an English Dictionary
No Yes Total
Accommodation N % N % N %
Computer 69 87.3% 10 12.7% 79 100.0
Extra time 148 85.5% 25 14.5% 173 100.0
Cust. dictionary 131 83.4% 26 16.6% 157 100.0
Small group 17 85.0% 3 15.0% 20 100.0
Standard condition 146 82.0% 32 18.0% 178 100.0
Total 511 84.2% 96 15.8% 607 100.0
Table 11
Raw Score Grade 8 Math Total Means for ELL Students
Accommodation N Mean Std. dev.
Computer 84 10.17 4.361
Cust. dictionary 86 9.95 3.835
Standard condition 86 9.47 4.005
Total 256 9.86 4.065
standard (non-accommodated) conditions. As the data in Table 11 show, ELLstudents performed higher under both accommodations when compared to theperformance under the standard condition. For the computer testing, the mean was10.17 (SD = 4.36, n = 84); for the customized dictionary, the mean was 9.95 (SD =3.84, n = 86); and for the standard condition the mean was 9.47 (SD = 4.00, n = 86).
To test the effectiveness of accommodations used for students in Grade 8, themean math scores were compared across the accommodation conditions. In spite ofa random assignment of students to the different accommodation conditions, theirinitial English reading proficiency may lead to math performance differencesbetween the groups. Similar to the analytical approach used for Grade 4 data, weused a reading score composite as a covariate to control for possible initialdifferences among the 6 condition groups.
A series of planned comparisons were conducted on the adjusted means to comparestudent performance under the accommodated conditions with the performance

40
under the standard condition. Table 12 presents the results of these comparisons. Asthe data in Table 12 show, increased performance of ELL students under computertesting was significant beyond the .01 nominal level. However, the increasedperformance under the customized dictionary condition was not significant for thesestudents. This suggests that computer testing is an effective accommodation for ELLstudents in Grade 8.
Validity. Table 13 presents descriptive statistics (mean, standard deviation, andnumber of students per group) for non-ELL students under the threeaccommodation conditions (computer testing, customized dictionary, and standardcondition). As the data in Table 13 suggest, the means for the computer testing andfor the customized dictionary are slightly higher than the mean math under thestandard condition. For the computer testing, the mean was 14.76 (SD = 4.55, n = 68);for the customized dictionary, the mean was 14.12 (SD = 4.28, n = 87); compared to amean of 13.94 (SD = 4.57, n = 131) for students tested under the standard condition.
Table 12
Grade 8 Math Total Means for ELL Students—Adjusted by Reading Scores
Accommodation N Adj. mean Std. err. Sig.
Computer 84 10.656 .408 .008
Cust. dictionary 86 9.838 .399 .197
Standard condition 86 9.108 .401
Note. Each student’s reading score was used as a covariate.
Table 13
Raw Score Grade 8 Math Total Means for Non-ELL Students
Accommodation N Mean Std. dev.
Computer 68 14.76 4.547
Cust. dictionary 87 14.12 4.277
Standard condition 131 13.94 4.572
Total 286 14.19 4.474
Table 14 presents the results of planned multiple comparisons for non-ELLstudents. The adjusted mean math scores of non-ELL students under eachaccommodation were compared to the adjusted mean scores of non-ELL students

41
Table 14
Grade 8 Math Total Means for Non-ELL Students—Adjusted by Reading Scores
Accommodation N Adj. mean Std. err. Sig.
Computer 68 14.674 .491 .220
Cust. dictionary 87 14.205 .434 .623
Standard condition 131 13.930 .354
Note. Each student’s reading score was used as a covariate.
under the standard condition. As the data in Table 14 show, none of thecomparisons were significant. That is, the two accommodation strategies did notaffect the performance of non-ELL students. This suggests that the accommodationsused in this study can be implemented without concerns about validity.
Feasibility. The feasibility of administering tests with a customized glossaryand computer accommodations is possibly greater for Grade 8 students. (See Grade4 results above.) Feasibility more likely increases with Grade 8 students becausetheir exposure to dictionary and computer use may be greater, and their schoolshave more computers and more Internet access connections.
Accommodation Impact on Measurement With Degree of Linguistic Complexity
To examine the effect of accommodation and to control for linguisticcomplexity of math test items, individual test items were rated for linguisticcomplexity. The linguistic complexity rating was based on the rubric developed inour earlier studies (Abedi, Courtney, & Leon, 2001). A five-point Likert scale wasused for rating linguistic difficulty of the items (0 being less linguistically complex to4 being very complex). We combined items into two categories, less complex (rated0, 1, or 2) and more complex (rated 3 or 4) and created two testlets accordingly. Weexamined the hypotheses of effectiveness and validity separately for each testlet.
In previous CRESST studies of linguistic demand of test items, the greater thelanguage demand, the greater the gap in performance between ELL students andnon-ELL students. For example, the findings of Abedi, Courtney, and Leon, (2001)suggest that there was more language demand in Grade 8 tests than in Grade 4 tests.To examine the relationship between ELL status and test item linguistic complexity,we performed multivariate analyses of variance with the linguistic complexitytestlets serving as the outcome variables. The results indicate that for Grades 4 and8, the ELL status was a stronger predictor of performance on the linguistically
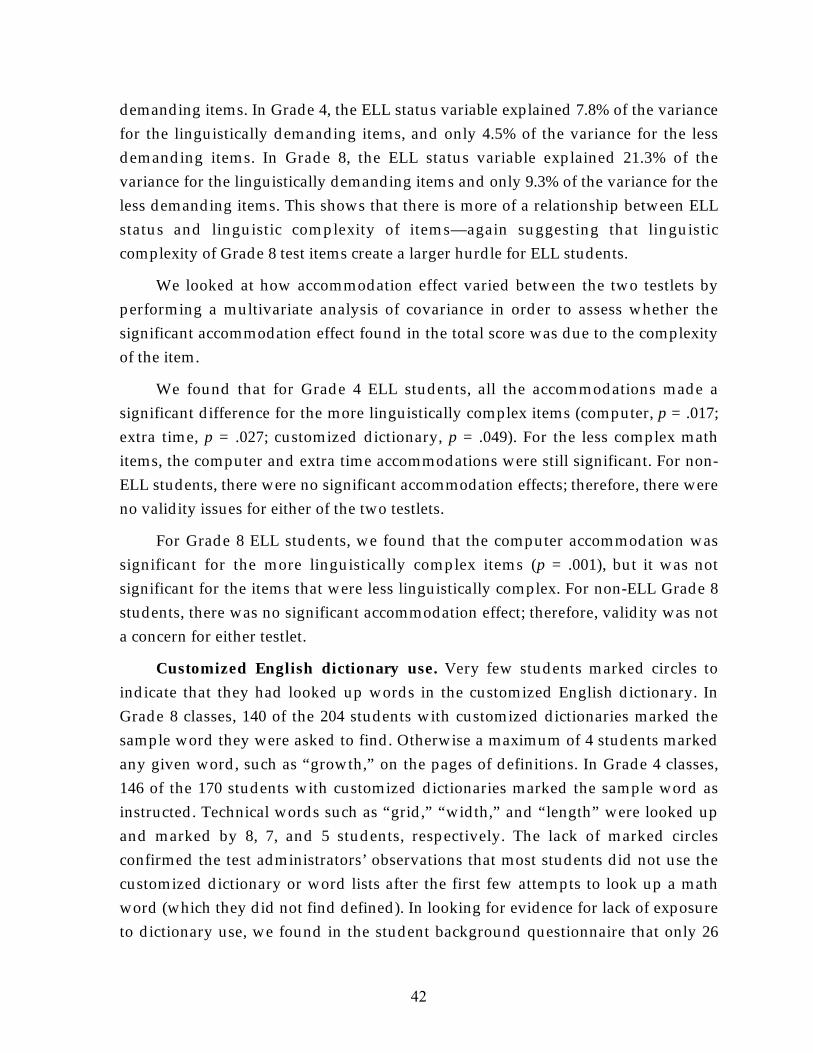
42
demanding items. In Grade 4, the ELL status variable explained 7.8% of the variancefor the linguistically demanding items, and only 4.5% of the variance for the lessdemanding items. In Grade 8, the ELL status variable explained 21.3% of thevariance for the linguistically demanding items and only 9.3% of the variance for theless demanding items. This shows that there is more of a relationship between ELLstatus and linguistic complexity of items—again suggesting that linguisticcomplexity of Grade 8 test items create a larger hurdle for ELL students.
We looked at how accommodation effect varied between the two testlets byperforming a multivariate analysis of covariance in order to assess whether thesignificant accommodation effect found in the total score was due to the complexityof the item.
We found that for Grade 4 ELL students, all the accommodations made asignificant difference for the more linguistically complex items (computer, p = .017;extra time, p = .027; customized dictionary, p = .049). For the less complex mathitems, the computer and extra time accommodations were still significant. For non-ELL students, there were no significant accommodation effects; therefore, there wereno validity issues for either of the two testlets.
For Grade 8 ELL students, we found that the computer accommodation wassignificant for the more linguistically complex items (p = .001), but it was notsignificant for the items that were less linguistically complex. For non-ELL Grade 8students, there was no significant accommodation effect; therefore, validity was nota concern for either testlet.
Customized English dictionary use. Very few students marked circles toindicate that they had looked up words in the customized English dictionary. InGrade 8 classes, 140 of the 204 students with customized dictionaries marked thesample word they were asked to find. Otherwise a maximum of 4 students markedany given word, such as “growth,” on the pages of definitions. In Grade 4 classes,146 of the 170 students with customized dictionaries marked the sample word asinstructed. Technical words such as “grid,” “width,” and “length” were looked upand marked by 8, 7, and 5 students, respectively. The lack of marked circlesconfirmed the test administrators’ observations that most students did not use thecustomized dictionary or word lists after the first few attempts to look up a mathword (which they did not find defined). In looking for evidence for lack of exposureto dictionary use, we found in the student background questionnaire that only 26

43
(15.0%) of the Grade 8 students provided with the customized English dictionarystated on the questionnaire that they had used “an English dictionary” in theclassroom before (see Table 15). Looking at the responses of all the Grade 8participants, only 78 students (14.4%) responded that they had used a dictionary inthe classroom before. Similarly, when asked on the accommodation follow-upquestionnaire which accommodations they would prefer, only 22 (12.7%) of thestudents provided with the customized English dictionary and 80 of the total Grade8 students (14.8%) stated that they would like an English dictionary “to make iteasier for me to understand math problems” (see Table 16). (See Appendix B forfurther questionnaire results.)
Computer pop-up glossary. Students taking the computer version of the mathtest had access to a “pop-up glossary,” a feature that provided a simple gloss ofwords when students pointed to them with the mouse. The program timed thelength of time students spent on each test item and the time that the gloss appeared
Table 15
Grade 8 Background Question #5a - I Have Used an English Dictionary
No Yes Total
Accommodation N % N % N %
Computer 124 81.6 28 18.4 152 100.0
Cust. dictionary 147 85.0 26 15.0 173 100.0
Standard condition 193 88.9 24 11.1 217 100.0
Total 464 85.6 78 14.4 542 100.0
Table 16
Grade 8 Follow-Up Question #2f - To Make It Easier to Understand MathQuestions, I Would Like an English Dictionary
No Yes Total
Accommodation N % N % N %
Computer 129 84.9% 23 15.1% 152 100.0
Cust. dictionary 151 87.3% 22 12.7% 173 100.0
Standard condition 182 83.9% 35 16.1% 217 100.0
Total 462 85.2% 80 14.8% 542 100.0
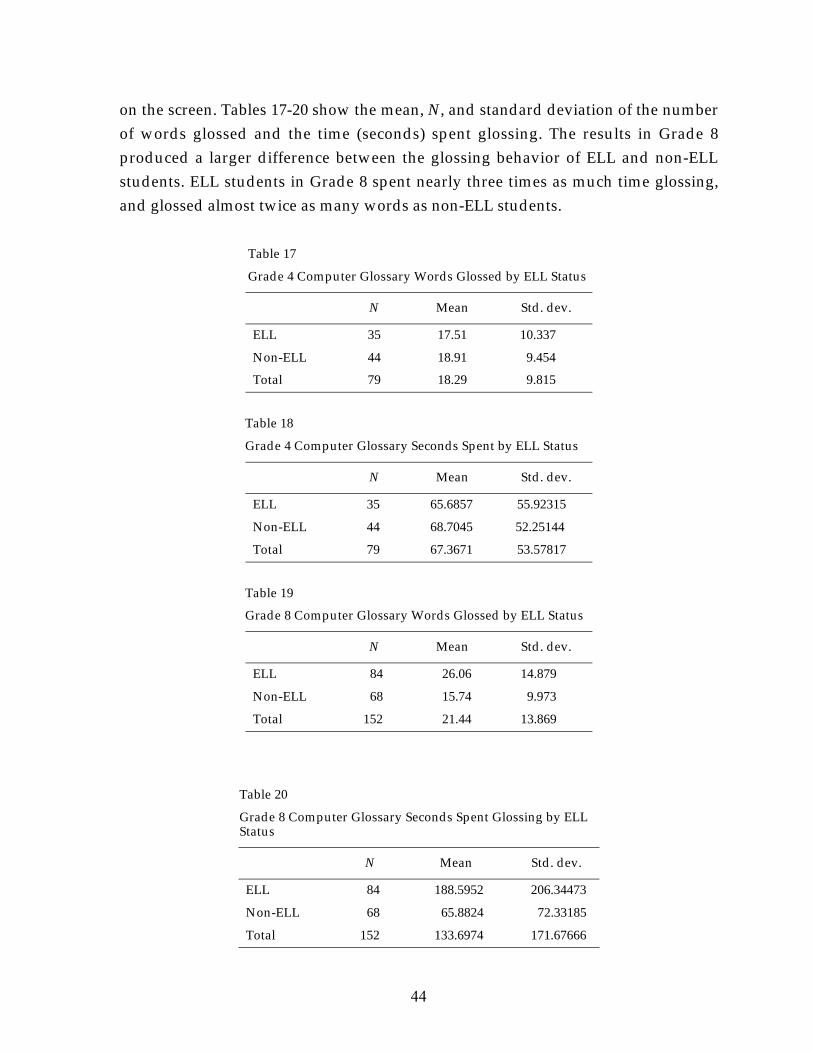
44
on the screen. Tables 17-20 show the mean, N, and standard deviation of the numberof words glossed and the time (seconds) spent glossing. The results in Grade 8produced a larger difference between the glossing behavior of ELL and non-ELLstudents. ELL students in Grade 8 spent nearly three times as much time glossing,and glossed almost twice as many words as non-ELL students.
Table 17
Grade 4 Computer Glossary Words Glossed by ELL Status
N Mean Std. dev.
ELL 35 17.51 10.337
Non-ELL 44 18.91 9.454
Total 79 18.29 9.815
Table 18
Grade 4 Computer Glossary Seconds Spent by ELL Status
N Mean Std. dev.
ELL 35 65.6857 55.92315
Non-ELL 44 68.7045 52.25144
Total 79 67.3671 53.57817
Table 19
Grade 8 Computer Glossary Words Glossed by ELL Status
N Mean Std. dev.
ELL 84 26.06 14.879
Non-ELL 68 15.74 9.973
Total 152 21.44 13.869
Table 20
Grade 8 Computer Glossary Seconds Spent Glossing by ELLStatus
N Mean Std. dev.
ELL 84 188.5952 206.34473
Non-ELL 68 65.8824 72.33185
Total 152 133.6974 171.67666

45
Accommodation Follow-Up Questionnaire
To examine students’ level of interaction with the accommodations and theirimpressions of the usefulness of accommodations, a follow-up accommodationquestionnaire was developed. It was administered immediately after the math test.Students received questionnaires appropriate to their assigned accommodation.However, most of the prompts and alternatives contained in each version of thequestionnaire were the same. Table 21 lists the common prompts and responsealternatives included in each of the accommodation follow-up questionnaires.
We will compare the responses of ELL students and non-ELL students on thesequestions. These questions were in different formats. Some of the responsealternatives were in a Likert-scale format with different scale points (3-point,
Table 21
Questions Common to Each Type of Follow-Up Questionnaire, With Response Alternatives
1. In the math test I did not understand: 1-no problem, 2-some words,3-many words
2. To make it easier to understand math problems, I wouldlike:
a-easier words
b-simpler sentences
c-easier math problems
d-math I learned
e-more pictures
f-an English dictionary
g-a translation dictionary
h-some words in my language
i-all words in my language
j-questions read aloud
k-more time
3. Most of these math problems were: 1-very easy, 2-easy, 3-hard,4-very hard
4. Taking the test with this accommodation was: a-a little hard
b-hard
c-same as other math tests
d-easy
e-fun
5. Did you want to look up words during the test? 1-no, 2-sometimes, 3-often
8. Would you like your tests to be more like this one? 1-yes, 0-no

46
4-point, etc.), and some (lettered above) were in a dichotomous format (yes/no orselected/not-selected). For such latter comparisons, we used the group average.
For the Likert-scale question, this average is the mean of the scale points, andfor the dichotomous response, it is the proportion of “yes” or “selected.” Forexample, question 1 asked: “In the math test, I did not understand” and thealternatives were coded as: (1) “I had no problem understanding the math test,” (2)“I had problems with some words or sentences,” and (3) “I had problems with manywords or sentences.” Thus, the responses for this question range between 1 (thewords were clear) and 3 (the words were difficult). A mean closer to 1 wouldsuggest that students on average did not find the words difficult, and a mean closerto 3 would suggest otherwise.
On dichotomous questions, the mean for each possible response rangesbetween 0 (no/not selected as a response) and 1 (yes/selected). A mean closer to 1suggests that most of the respondents said “yes” or selected that reply. A meancloser to 0 suggests otherwise.
Accommodation Follow-Up Questionnaire Results for Grade 4
Table B1 summarizes the results of descriptive statistics (mean and standarddeviation) for the common set of the follow-up questions for Grade 4 students. InTable B1, for each of the 19 questions, the mean and standard deviations arereported for ELL, non-ELL, and for the total group of students. For example, forquestion 1, the overall mean, on a 3-point Likert scale, across all fouraccommodation conditions for ELL students was 1.77 (SD = .61), and for the non-ELL students the mean was 1.61 (SD = .57). These data suggest that ELL students inGrade 4 did not understand words in the math test more than non-ELL students.Within the four accommodations, the mean for ELL students ranges between 1.64(SD = .59) for the extra time accommodation and 1.87 (SD = .66) for the customizeddictionary accommodation. For non-ELL students, the mean ranges between 1.53(SD = .51) for the computer accommodation and 1.73 (SD = .59) for the extra timeaccommodation. As these data suggest, there is not a big range among the meansacross the four accommodations in either ELL category.
Question 2 asks students to indicate a condition that would help themunderstand math problems better. For example, if easier words in the math testwould make it easier for them to understand the math questions, students selectedoption 2a. The overall mean for ELL students in Grade 4 was .51 (SD = .50) and for

47
non-ELL students the mean was .47 (SD = 50). That is, 51% of ELL students and 47%of non-ELL students indicated that easier words would help them understand themath problems.
Data in Table B1 show trends similar to those explained above for questions 1and 2a. Usually, ELL students asked for easier words and clearer (less complex)sentences. However, in most cases, the differences between the means of ELLstudents and non-ELL students are not large enough to suggest any major trend. Totest the differences between the response patterns of ELL students and non-ELLstudents for statistical significance, a multivariate general linear model was used.Table B1 presents the results of these analyses. In this table, “L” stands for asignificant LEP main effect at the .05 nominal level; “A” stands for a significantaccommodation main effect; and “I” stands for a significant ELL/accommodationinteraction. For example, “LI” for question 1 in Table B1 suggests two significantresults; “L” indicates that the difference between the overall mean for ELL studentsand non-ELL students was significant; and “I” suggests that the interactionsbetween ELL and accommodations were significant.
The results of significance testing reveal that in the math test, ELL students haddifficulty understanding more words than did non-ELL students. More ELL thannon-ELL students reported that an English dictionary, a translation dictionary, somewords in their language, or all words in their language would help them with themath test. ELL students were more likely to report that reading the test questionsaloud would make the math questions easier. Students who took the computer testwere much more likely to report that taking the test was “fun” than students withthe customized dictionary or standard condition. These students were also morelikely to want “more tests like this one.” Students who took the computer test or hadextra time felt that more pictures would better help them understand the mathquestions. Students who took the computer test or had extra time were less likely torequest a translation dictionary compared to students with the standard condition.Students who took the computer accommodation reported looking up more wordsduring the test.
Accommodation Follow-Up Questionnaire Results for Grade 8
The same set of follow-up questions reported in Table B1 was used for Grade 8students. Table B2 summarizes the results of descriptive statistics (mean andstandard deviation) for the common set of follow-up questions for Grade 8 students.

48
The trend of results for Grade 8 students is similar to the trend reported for Grade 4.In general, ELL students in Grade 8 preferred easier words and less linguisticallycomplex sentences. For example, the mean for question 1 for ELL students was 1.98(SD = .68) compared to a mean of 1.72 (SD = .60) for non-ELL students. The meanwithin the ELL status designations ranges between 1.94 (SD = .80) for the standardcondition and 2.02 for the customized dictionary (SD = .63). Within the non-ELLstudents, the means range between 1.69 (SD = .61) and 1.75 (SD = .56). Once again,as these data suggest, there were not major differences between the means forquestion 1 across the accommodation categories.
To test for the significance of the differences, comparisons were made usingmultivariate ANOVA. Table B2 identifies the significant results as “L” (significantLEP main effect), “A” (significant accommodation main effect), and/or “I”(interaction between ELL status and accommodation). On the math test, ELLstudents in Grade 8 had difficulty understanding more words than did non-ELLstudents. ELL students in Grade 8 were more likely to report that more pictures onthe math test would make the problems easier to understand. This was especiallytrue for ELL students who took the computer test.
More ELL than non-ELL Grade 8 students reported that an English dictionary,a translation dictionary, some words in their home language or all words in theirlanguage would help them with the math test. ELL students were less likely toreport that the test they took was the same as other math tests.
Grade 8 students who took the computer test were much more likely to reportthat taking the test was “fun” than students with the customized dictionary orstandard condition. These students were also more likely to want “more tests likethis one.” A higher percentage of students in Grade 8 who took the computer- andcustomized-dictionary-accommodated tests reported that the test was easycompared to those who took the standard condition test. Similarly, a lowerpercentage of those accommodated felt that the math test was hard. Students inGrade 8 who took the computer accommodation reported looking up more wordsduring the test than those using the customized dictionary.
Highlights of Follow-up Questionnaires
We want to highlight results that compare computer accommodation withother forms of accommodation used in this study. We will discuss students’impressions of computer testing based on the accommodation follow-up

49
questionnaire data. In the discussion section we will then present a morecomprehensive picture of the level of efficiency of this accommodation by linkingdata from the different sources including background, performance, and follow-updata.
For comparing the computer accommodation with other accommodations, wefocus on the following questions:
• 4d. Taking the test with this accommodation was (1-easy)
• 4e. Taking the test with this accommodation was (1-fun)
• 5. Did you want to look up words during the test (1-no, 2-sometimes, 3-often)
For Grade 4 students, the mean for question 4d was .38. For this question, the
closer the mean is to its maximum value of 1, the easier students feel it is to take thetest under that accommodation. For non-ELL students, the mean was .45. Theseresults indicate that in general, non-ELL students felt that taking the test with thecomputer accommodation was easy—more so than did ELL students. However,there is a substantial range among responses to this question within the categories ofaccommodations. For example, for ELL students, the mean for this question rangesbetween .24 (SD = .43) for the extra time accommodation and .59 (SD = .36) for thecomputer accommodation. That is, ELL students felt more comfortable taking thetest under the computer accommodation than under any other accommodations. Forthe non-ELL students, the mean for the computer-accommodated students was .37(SD = .49)—considerably lower than the mean of .59 for the ELL students, in spite oftheir higher overall mean.
For Grade 8 ELL students, the overall mean on this question was .28 (SD = .45),and for the non-ELL students, the mean was .24 (SD = .43). Within ELLs, thecomputer-testing mean was .29 (SD = .46) compared to a mean of .21 (SD = .41)under the standard condition. For non-ELLs, the mean for the computer testing was.30 (SD = .46) compared to a mean of .18 (S D = .39) for the standard condition.Comparing these means with the means for Grade 4 students suggests that, ingeneral, students in Grade 4 felt more comfortable with the accommodations thanstudents in Grade 8. However, computer testing was still among the preferred formsof accommodation for both ELL students and non-ELL students in both grades.

50
Question 4e asks if “taking the test with this accommodation was fun.” Thecloser the mean of this question was to 1, the more students felt they had fun takingthe math test under the computer accommodation. For Grade 4 ELL students, theoverall mean for this question was .60 (SD = .49) compared to a mean of .53 (SD =.50) for non-ELL students. Comparing the overall means between ELL and non-ELLgroups suggests that ELL students indicated they were having slightly more funthan the non-ELL students. However, there were large differences among the meansacross the accommodation conditions. For example, the mean for ELL studentsranged between .51 (SD = .50) for the standard condition and .85 (SD = .36) for thecomputer condition—a substantially higher mean for the computer accommodation.This suggests that ELL students felt that they had more fun being tested with thecomputer test than under any other accommodation. This was also true for non-ELLstudents. Their mean for the computer testing was .84 (SD = .37) compared to amean of .40 for extra time.
For Grade 8 students, the overall mean for ELL students was .29 (SD = .45) andfor non-ELL students, the mean was .20 (SD = .40) indicating that accommodationsused in this study were not considered fun. However, as in the case of Grade 4students, there is a substantial gap among the means under differentaccommodations. For example, for the ELL students, the mean ranged between .18(SD = .39) for the standard condition and .45 (S D = .50) for the computeraccommodation. Similarly, the lowest mean for non-ELL students was .13 (SD = .34)under the standard condition, and the highest mean was .42 (SD = .50) for thecomputer testing condition. These results suggest that computer testing was fun forGrade 8 students.
Question 5 asks students if they wanted to “look up words during the test.”Responses to this question included: 1 for “no,” 2 for “sometimes,” and 3 for “often.”The overall mean for ELL students in Grade 4 was 1.56 (SD = .72) compared to amean of 1.53 (SD = .72) for non-ELL students. That is, both ELL and non-ELLstudents indicated at about the same rate that sometimes they wanted to look upwords during the test. However, once again, there are substantial differences acrossthe accommodation subgroups. For example, within ELL accommodation categories,the mean ranges between 1.45 (SD = .57) for extra time and 1.91 (SD = .51) for thecomputer testing. Similar results were found for the non-ELL students. For non-ELLstudents, the mean ranged between 1.37 (SD = .60) for extra time and 1.95 (SD = .65)for the computer testing. For Grade 8 students, the overall mean for ELL students

51
was 1.75 (SD = .63), and for non-ELL students, the mean was 1.38 (SD = .52), whichindicates that ELL students look up more words during the test than the non-ELLstudents.
Several points are readily noticeable from the follow-up data presented aboveregarding the new accommodation strategy, the computer testing. Following are afew highlights:
• ELL students (more than non-ELLs) felt more comfortable with computertesting as a form of accommodation (they felt the test was easy) than withany other accommodation used in this study.
• Both ELL students and non-ELL students indicated that computer testingwas more (substantially more) fun than any other accommodationconditions used in this study, including the standard condition.
• ELL students and non-ELL students (more so with ELLs) indicated thatthey looked up words more often under the computer accommodation thanwith the customized dictionary.
Test administrators noted in their observations that students taking the
computer version of the tests rarely seemed distracted while taking the test, andthat, of the 246 students taking the computer version of the tests (123 ELLs; 123 non-ELLs), 66% of the non-ELL students had computers at home, compared to 49% ofELL students.10 Understandably, more non-ELLs were observed using touch-typingin taking the computer test.
In summary, students who were tested under the computer accommodation(particularly the ELLs) indicated that testing under this accommodation was easyand more fun. This accommodation also makes all students (particularly ELLs) moreinclined to look up more words that they would have with the customized Englishdictionary.
Results of the Background Questionnaire
Grade 4 student background questionnaire. Question 1 in the backgroundquestionnaire asks for the place of birth. Table 22 presents the results for thisquestion. As the data in Table 22 show, the mean reading score for students whowere not born in the United States was lower than the means for those born in theUnited States. This variable was used in a multiple regression (MR) model as one of
10 Based on responses from 77% of the computer testing participants. Of the respondents, there is a wider gap:89% of the non-ELLs used a computer at home; 66% of the ELLs did.

52
Table 22
Grade 4 Background Question #1 - Country of Birth
1. I was born in: N Reading mean Std. dev.
Korea 7 10.29 6.396
Mexico 52 10.81 4.348
The United States 507 12.15 3.803
Other 36 11.67 4.640
Total 602 11.99 3.953
the predictors of math and reading. Significance testing data will be presented forthis variable in the discussion of the MR analysis.
Table 23 presents the mean reading scores by the number of years studentshave lived in the United States. There was a trend of an increased reading mean bythe increase in the number of years in the United States. For example, students withonly 1 year in the U.S. had a reading mean of 8.29 (SD = 5.30) compared to thereading mean of 12.30 (SD = 3.73) for students who indicated that they have lived inthe U.S. their entire life. This variable is related to the students’ languagebackground. The level of impact of this and other background variables on studentperformance in math and reading will be explained in the multiple regression (MR)section.
Table 24 summarizes the results of descriptive statistics for question 3 in thebackground questionnaire. Students were asked to report their starting grade in the
Table 23
Grade 4 Background Question #2 - Number of Years in the U.S.
2. I have lived in theUnited States: N
Readingmean Std. dev.
Less than 1 year 4 9.13 4.768
1 year 14 8.29 5.298
2 years 10 10.10 5.021
3 years 12 12.58 3.801
4 years 23 10.83 4.441
5-8 years 78 11.40 4.180
All my life 462 12.30 3.734
Total 603 11.99 3.950

53
Table 24
Grade 4 Background Question #3 - Starting Grade in U.S.
3. I started school inthe United States in: N
Readingmean Std. dev.
Preschool 366 12.46 3.776
Kindergarten 163 11.80 3.675
1st grade 35 11.50 3.976
2nd grade 12 9.42 5.900
3rd grade 12 10.17 4.802
4th grade 16 7.03 4.117
Total 604 11.98 3.954
United States. Similar to the results presented above for question 2, there was anincreasing trend of reading test scores by an early start in U.S. schools. For example,students who started in a U.S. preschool had a reading mean of 12.46 (SD = 3.78)compared to the mean of 7.03 (SD = 4.12) of students who very recently started inU.S. schools.
Table 25 shows descriptive statistics for reading scores by the availability ofresources in school. There were differences in the mean reading scores by differenttypes of resources. For example, students who reported access to the Internet had arelatively higher reading mean (M = 12.60, SD = 3.89) than those reporting access toa bilingual dictionary (M = 10.14, SD = 4.28).
Table 25
Grade 4 Background Question #4 - Resources Used in School
4. I have used these in myschool: (Choose all that apply) N
Readingmean Std. dev.
English dictionary 487 12.29 3.742
Bilingual dictionary 66 10.14 4.277
Word processor on a computer 159 11.93 4.130
The Internet 165 12.60 3.892
Computer tests 135 11.34 3.821
In school tutor 69 11.16 4.042
After school tutor 84 10.96 3.817
Library 369 12.35 3.939

54
Table 26 shows descriptive statistics for reading scores by students’ interest inhaving certain resources in school. There were differences in the mean readingscores by different types of resources. For example, students who wished for accessto the Internet had a relatively higher reading mean (M = 12.32, SD = 3.78) thanthose wanting access to an English dictionary (M = 9.57, SD = 4.40).
In this study, we asked students to self-report their level of understanding ofthe teacher’s directions since comprehension of the language of oral instruction is anessential part of student learning. The summary of data for question 6 that isreported in Table 27 supports the hypothesis that an inability to understand theteacher’s directions may lead to poor learning and result in poor performance. Thereading mean for students who indicated that they understand the teacher’sdirections was 12.28 (SD = 3.86) compared to a reading mean of 6.75 (SD = 3.31) forstudents who indicated that they did not understand the directions. It must benoted, however, that the large majority of students (451 or 75%) indicated that theyunderstood the teacher’s directions “very well,” and only four students (less than1%) mentioned that they did not understand the teacher’s directions at all. Thus, asmall n in (and insufficient comprehension of) some of these categories may makethe results inconsistent.
Table 26
Grade 4 Background Question #5 – Resources Needed in School
5. I wish my classroom had:(Choose all that apply) N
Readingmean Std. dev.
English dictionary 55 9.57 4.407
Bilingual dictionary 178 12.10 3.967
Word processor on a computer 167 12.09 3.863
The Internet 282 12.32 3.784
Computer tests 77 10.03 4.375
In school tutor 108 11.63 3.464
After school tutor 89 11.46 3.607
Library 62 9.47 4.689

55
Table 27
Grade 4 Background Question #6 - Understanding Teacher Directions
6. I can understand my teacherswhen they give directions inEnglish: N
Readingmean Std. dev.
Very well 451 12.28 3.846
Well 133 11.53 3.925
Not well 12 8.42 5.017
Not well at all 4 6.75 3.304
Total 600 12.00 3.947
Question 9 (as summarized in Table 28) in the background questionnaire asksstudents to indicate, in comparison to others, how they are doing in math this year.Among the response options, students could select an option that indicates difficultyin understanding what the teacher says. Of the total 584 students who responded tothis question, 14 (2.4%) indicated that they could not understand the teacher. Thereading mean for this small group of students was 6.57 (SD = 4.36). In the nextresponse category, students indicated that they learn less math than other fourthgraders. For this group, the mean was 10.12 (SD = 4.17, n = 70). The reading meanfor the next response, “I am learning as much math as other fourth graders” was12.57 (SD = 3.54, n = 323), and for the next response, “I am learning more math thanmany fourth graders,” the mean was 12.20 (SD = 4.08, n = 177). As these datasuggest, the higher the level of students’ self-rating of their math learning, thehigher the level of their English proficiency. This is, to some extent, indicative of thevalidity of students’ self-reported data.
Table 28
Grade 4 Background Question #9 - Learning Math How Well This Year
9. How well are you learningmath this year? N
Readingmean Std. dev.
I don't understand what theteacher is saying in English.
14 6.57 4.363
I am learning less math thanmany fourth graders.
70 10.12 4.165
I am learning as much mathas other fourth graders.
323 12.57 3.504
I am learning more maththan many fourth graders.
177 12.20 4.082
Total 584 12.02 3.951

56
Background question 10 (as summarized by Table 29) asks about the linguisticdifficulty and content difficulty of the math test items. Students having difficultywith the language of test items had substantially lower performance than those whohad difficulty with the content of the items. The mean for students expressingconcern over the linguistic difficulty of test items was 10.11 (SD = 4.35, n = 107)compared to a mean of 12.32 (SD = 3.61, n = 277) for students who had difficultywith content. Students who complained that they were asked questions that theyhad not had the opportunity to learn also performed about the same as those whohad difficulty with the content. For this group (lack of opportunity to learn), themean was 12.44 (SD = 3.95, n = 183).
Students were also asked to report the language they spoke before going toschool. For this question, there were two major response categories with a large n.The results are summarized in Table 30. Students who indicated that they spoke
Table 29
Grade 4 Background Question #10 – Main Complaint About Math Tests
10. What is your maincomplaint about math tests(such as the Stanford-9)? N
Readingmean Std. dev.
They are hard to read. 107 10.11 4.35
They are hard mathproblems to answer.
277 12.32 3.61
They ask about math Ihaven't learned yet.
183 12.44 3.95
Total 567 11.94 3.96
Table 30
Grade 4 Background Question #11 - Language Spoken Before Going toSchool
11. Before I started going to school, I spoke: (Choose all that apply) N
Readingmean Std. dev.
English 404 12.16 4.00
Chinese 4 8.00 5.77
Korean 10 7.90 5.58
Spanish 350 11.92 3.73
Other 39 13.76 4.25

57
English before going to school had a mean of 12.16 (SD = 4.00, n = 404). For studentswho spoke Spanish before going to school, the mean was 11.92 (SD = 3.73, n = 350).These results suggest that the language spoken prior to schooling does not havemuch impact on students’ reading performance.
Table 31 shows a summary of descriptive statistics for question 12, thelanguage currently spoken at home. Response categories with the number ofstudents smaller than 10 were excluded. Students who indicated that they currentlyspeak English at home had higher reading score means than those speaking otherlanguages. For example, the reading mean for students living in primarily English-speaking homes was 12.36 (SD = 3.89, n = 274) compared to a mean of 11.64 (SD =3.82, n = 288) for students who speak Spanish at home. (This variable has been usedin our previous studies as a proxy for English learners when an ELL designationcode was not available.)
In background questions 13, 14, and 15, students who speak a language otherthan English at home were asked to indicate how well they speak, read, and writethat language. Tables 32 through 34 present a summary of responses to thesequestions in relation to the students’ reading scores. These questions are importantsince they examine the possible relationship between students’ primary languagewith their proficiency level in English. As the data show, there seems to be arelationship between the level of students’ proficiency in their primary language—atleast in speaking and reading—with their level of proficiency in English. Forexample, students who indicated that they speak the other language “very well” had
Table 31
Grade 4 Background Question #12 - Language Spoken at HomeNow
12. Now, at home, we mostly speak: N
Readingmean Std. dev.
English 274 12.36 3.89
Chinese 1 13.00
Korean 8 9.50 6.33
Spanish 288 11.64 3.82
Other 21 11.90 5.16
Total 592 11.96 3.96
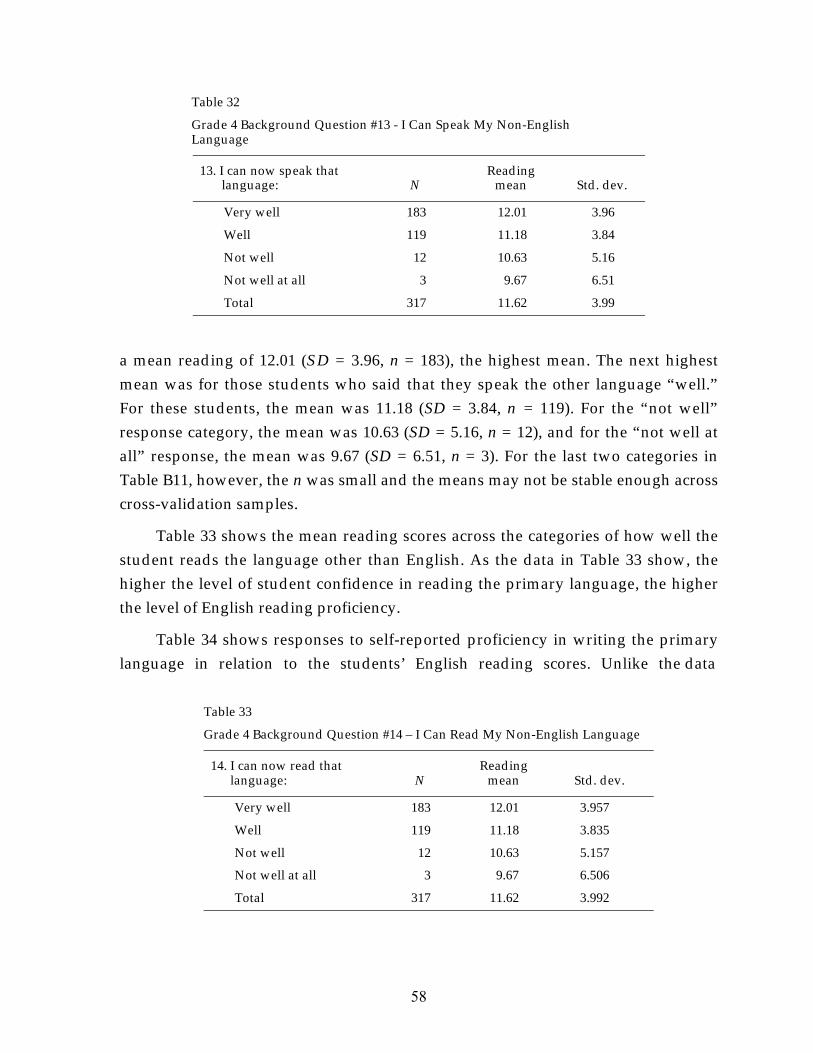
58
Table 32
Grade 4 Background Question #13 - I Can Speak My Non-EnglishLanguage
13. I can now speak that language: N
Readingmean Std. dev.
Very well 183 12.01 3.96
Well 119 11.18 3.84
Not well 12 10.63 5.16
Not well at all 3 9.67 6.51
Total 317 11.62 3.99
a mean reading of 12.01 (SD = 3.96, n = 183), the highest mean. The next highestmean was for those students who said that they speak the other language “well.”For these students, the mean was 11.18 (SD = 3.84, n = 119). For the “not well”response category, the mean was 10.63 (SD = 5.16, n = 12), and for the “not well atall” response, the mean was 9.67 (SD = 6.51, n = 3). For the last two categories inTable B11, however, the n was small and the means may not be stable enough acrosscross-validation samples.
Table 33 shows the mean reading scores across the categories of how well thestudent reads the language other than English. As the data in Table 33 show, thehigher the level of student confidence in reading the primary language, the higherthe level of English reading proficiency.
Table 34 shows responses to self-reported proficiency in writing the primarylanguage in relation to the students’ English reading scores. Unlike the data
Table 33
Grade 4 Background Question #14 – I Can Read My Non-English Language
14. I can now read that language: N
Readingmean Std. dev.
Very well 183 12.01 3.957
Well 119 11.18 3.835
Not well 12 10.63 5.157
Not well at all 3 9.67 6.506
Total 317 11.62 3.992

59
Table 34
Grade 4 Background Question #15 - I Can Write My Non-EnglishLanguage
15. I can now write my non-English language: N
Readingmean Std. dev.
Very well 117 11.98 3.544
Well 124 11.18 4.226
Not well 41 12.20 4.114
Not well at all 33 11.45 4.395
Total 315 11.64 3.991
presented in Tables 32 and 33, these data do not show a relationship between thewriting proficiency in the students’ primary language and their proficiency inreading English.
Grade 8 Student Background Questionnaire
Tables 35 through 47 present a summary of responses of Grade 8 students tothe background questions. As data in these tables show, the trend of responses forGrade 8 students was very similar to those reported for Grade 4 students. In general,students who were born in, or received most of their education outside, the UnitedStates performed lower than those in the U.S. Similarly, students who spoke alanguage other than English performed lower than students who spoke English athome. We will discuss these results for each question briefly.
Table 35 summarizes responses to question 1 (country of birth) in relation tothe reading scores. Response categories with a response frequency of less than 10will not be discussed. The reading score mean for those born in the United States (M= 12.99, SD = 3.79, n = 334) was higher than those born outside the U.S. (for studentsborn in Mexico, M = 11.04, SD = 3.96, n = 98; and for students born in other countriesM = 10.32, SD = 4.03, n = 94). This variable is related indirectly to student languagebackground.
Table 36 reports the reading scores by the categories of question 2, time lived inthe United States. As the data suggest, the trend was increasing reading score meanswith the increase of years lived in the U.S. That is, the longer students had lived inthe U.S., the higher their reading mean score was. This variable was also related tostudent language background.

60
Table 35
Grade 8 Background Question #1 - Country of Birth
1. I was born in: N Reading mean Std. dev.
China 5 10.40 5.55
Korea 7 8.43 3.95
Mexico 98 11.04 3.96
The United States 334 12.99 3.79
Other 94 10.32 4.03
Total 538 12.09 4.05
Table 36
Grade 8 Background Question #2 - Time Lived in the U.S.
2. I have lived in the United States: N Reading mean Std. dev.
Less than 1 year 32 7.89 3.780
1- 2 years 61 9.13 3.898
3 - 4 years 33 10.89 3.409
5 - 6 years 24 12.13 3.564
7 - 8 years 28 12.46 3.958
Between 9 and 14 years 51 12.17 3.841
All my life 310 13.16 3.672
Total 539 12.07 4.055
Table 37 reports reading score means by the starting grade in the United States.Consistent with results for Grade 4 students, the sooner students entered U.S.schools, the higher the level of their reading. Once again, this is consistent with ourearlier discussion of the impact of student language background on theirperformance.
Self-reported data for Grade 4 suggests that some school resources may havepositive effects on student academic performance. Data for Grade 8 confirms thisfinding. As data in Table 38 show, for example, the availability of an Englishdictionary, a computer word processor, access to the Internet, and access to a libraryhelped students.

61
Table 37
Grade 8 Background Question #3 – Grade Starting in the U.S.
3. I started school inthe United States in: N
Readingmean Std. dev.
Preschool 242 13.06 3.795
Kindergarten 126 12.89 3.722
1st grade 10 11.95 4.669
2nd grade 17 12.29 3.869
3rd grade 13 11.12 2.902
4th grade 16 11.19 3.898
5th grade 17 10.79 2.818
6th grade 32 10.45 4.411
7th grade 40 8.75 3.436
8th grade 27 7.72 3.859
Total 542 12.05 4.064
Table 38
Grade 8 Background Question #4 - Resources Used in the School
4. I have used these in myschool: (Choose all that apply) N
Readingmean Std. dev.
English dictionary 442 12.64 3.917
Bilingual dictionary 106 10.49 3.654
Word processor on a computer 211 13.36 4.011
The Internet 288 13.03 4.008
Computer tests 195 12.67 4.068
In school tutor 66 12.70 3.970
After school tutor 139 12.74 3.867
Library 344 13.07 3.943
Table 39 shows data on students’ desire to obtain some resources. Studentswho felt a need for a resource may perform lower than many other groups. Forexample, for students who express a need for access to a dictionary, having adictionary may help them improve their performance.

62
Table 39
Grade 8 Background Question #5 - Resources Needed in School
5. I wish my classroom had:(Choose all that apply) N
Readingmean Std. dev.
English dictionary 78 10.62 4.181
Bilingual dictionary 111 11.32 4.271
Word processor on a computer 141 11.99 3.832
The Internet 275 12.25 3.846
Computer tests 205 12.53 4.143
In school tutor 62 12.62 4.106
After school tutor 31 10.58 3.704
Library 56 11.06 3.678
Table 40 shows the relationship between understanding the teacher’s directionsand reading scores. Students who indicated that they understood their teacher’sdirections had higher reading scores than those who had difficulty understandingthe teacher.
Table 41 shows that self-reported performance in math was related to students’reading scores. As the data in Table 41 show, there was an increasing trend inreading scores associated with students’ impression of their higher performance inmath. Students who indicated that they did not understand what their teacher saysin English obtained the lowest scores in reading (M = 8.75, SD = 2.43, n = 20). Forstudents who indicated that they learn as others learn, the mean was 12.90 (SD =3.86, n = 296).
Table 40
Grade 8 Background Question #6 - Understanding the Teacher’s Directions
6. I can understand myteachers when they givedirections in English: N
Readingmean Std. dev.
Very well 291 12.99 4.074
Well 215 11.17 3.750
Not well 22 9.98 3.479
Not well at all 5 10.50 3.873
Total 533 12.10 4.036

63
Table 41
Grade 8 Background Question #9 - How Well Learning Math This Year
9. How well are you learningmath this year? N
Readingmean Std. dev.
I don't understand what theteacher is saying in English.
20 8.75 2.43
I am learning less math thanmany eighth graders.
109 11.56 3.79
I am learning as much mathas other eighth graders.
296 12.90 3.86
I am learning more maththan many eighth graders.
80 11.98 4.35
I am not taking math rightnow.
8 6.38 1.60
Total 513 12.21 4.02
Table 42 reports students’ complaints about math tests and their readingscores. Similar to what was reported for Grade 4 students, students in Grade 8 whoexpressed difficulty with the test language had lower reading performance thanthose having difficulty with the content of the questions.
Table 43 reports the language spoken before going school, which is related toreading scores in Grade 4. Similarly, for Grade 8, this variable seems to impactstudents’ reading scores. Students who, before starting school, spoke a languageother than English showed lower reading performance than those who spokeEnglish.
Table 42
Grade 8 Background Question #10 - Main Complaint About Math Tests
10. What is your main complaint about math tests? N
Readingmean Std. dev.
They are hard to read. 64 10.87 3.872
They are hard mathproblems to answer.
183 11.40 4.009
They ask about math Ihaven't learned yet.
248 12.85 4.051
Total 495 12.06 4.087

64
Table 43
Grade 8 Background Question #11 - Language Spoken Prior to Schooling
11. Before I started going to school I spoke: (Choose all that apply) N
Readingmean Std. dev.
English 298 12.84 4.031
Chinese 9 12.06 4.475
Korean 8 9.13 4.155
Spanish 303 11.62 3.786
Other 47 12.00 4.464
In the CRESST studies on the impact of language on performance, it wasdemonstrated that language spoken at home was related to students’ performance inschool. Students who spoke a language other than English at home, in general, hadlower performance than those who spoke English (see, for example, Abedi & Lord,2001). The results of this study on the relationship between home language andperformance confirm our earlier findings that students who speak a language otherthan English had lower reading scores than those who speak English at home (Table44).
Tables 45 through 47 show the relationship between students’ level ofefficiency in their primary language and their reading scores. Table 45 shows thatthe higher the level of students’ self-reported proficiency in speaking, the higher wastheir English reading score. However, this relationship was not quite clear forreading in Table 46, or for writing in Table 47.
Table 44
Grade 8 Background Question #12 – Language Now Spoken at Home
12. Now, at home, we mostly speak: N
Readingmean Std. dev.
English 224 13.24 3.994
Chinese 6 12.33 4.367
Korean 9 9.78 4.353
Spanish 244 11.28 3.779
Other 36 10.79 4.426
Total 519 12.08 4.057

65
Table 45
Grade 8 Background Question #13 - I Can Speak My Non-English Language
13. I can now speak that language: N
Readingmean Std. dev.
Very well 123 11.51 3.418
Well 141 11.27 4.224
Not well 25 9.30 3.674
Not well at all 2 7.00 2.828
Total 291 11.17 3.892
Table 46
Grade 8 Background Question #14 - I Can Read My Non-English Language
14. I can now read thatlanguage: N
Readingmean Std. dev.
Very well 105 11.64 3.502
Well 134 10.91 4.018
Not well 36 9.97 4.364
Not well at all 16 13.38 3.304
Total 291 11.19 3.902
As data in Table 46 show, there was an increasing trend in students’ Englishreading scores with the increasing trend in students’ self-reported readingproficiency in their primary language. However, this trend does not continue for allcategories of the self-reported proficiency. Students who indicated that they did notread well at all in their primary language had higher reading scores than those whoindicated that they read very well in their primary language.
Table 47 shows the relationship between students’ ability to write their primarylanguage and their English reading score. While there was a small positiveincreasing trend, as with the reading data presented above, the trend did notcontinue.
Predicting Scores From Background Questions: A Multiple Regression Approach
The student background questionnaire was developed to collect data onstudents’ background characteristics that are related to their school achievement. Indeveloping the background questionnaire, the focus was on language backgroundquestions. Background questions are an important part of NAEP. The background
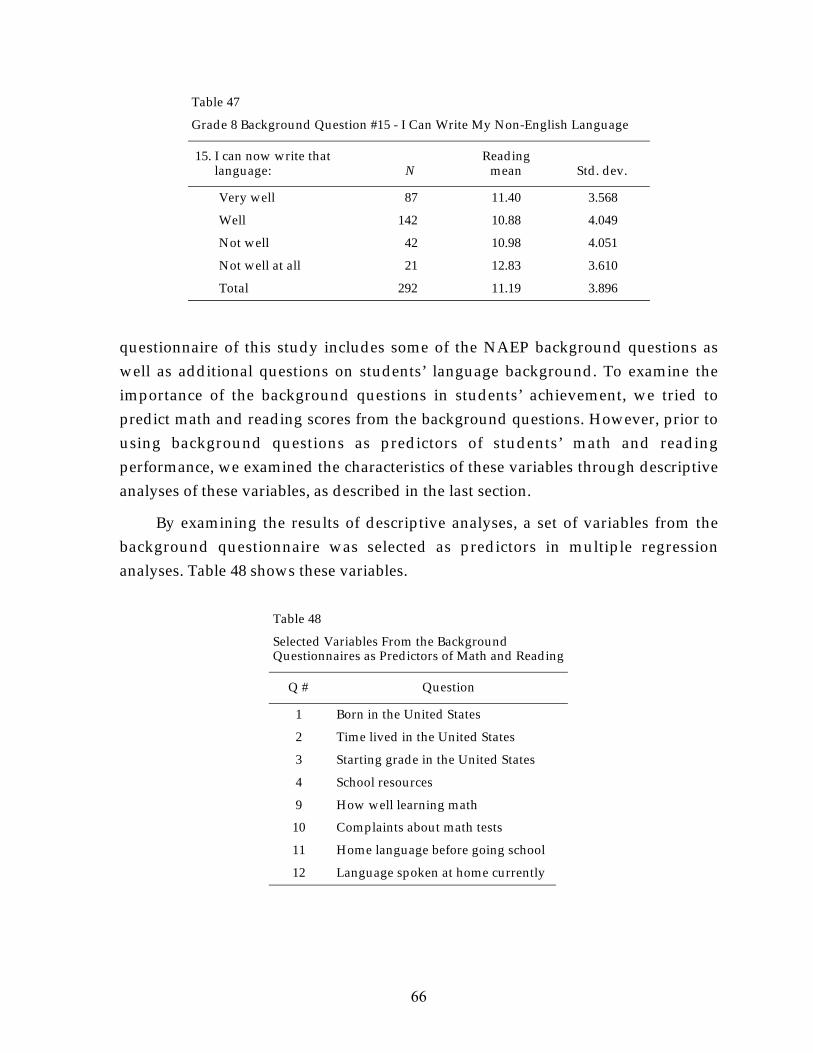
66
Table 47
Grade 8 Background Question #15 - I Can Write My Non-English Language
15. I can now write that language: N
Readingmean Std. dev.
Very well 87 11.40 3.568
Well 142 10.88 4.049
Not well 42 10.98 4.051
Not well at all 21 12.83 3.610
Total 292 11.19 3.896
questionnaire of this study includes some of the NAEP background questions aswell as additional questions on students’ language background. To examine theimportance of the background questions in students’ achievement, we tried topredict math and reading scores from the background questions. However, prior tousing background questions as predictors of students’ math and readingperformance, we examined the characteristics of these variables through descriptiveanalyses of these variables, as described in the last section.
By examining the results of descriptive analyses, a set of variables from thebackground questionnaire was selected as predictors in multiple regressionanalyses. Table 48 shows these variables.
Table 48
Selected Variables From the BackgroundQuestionnaires as Predictors of Math and Reading
Q # Question
1 Born in the United States
2 Time lived in the United States
3 Starting grade in the United States
4 School resources
9 How well learning math
10 Complaints about math tests
11 Home language before going school
12 Language spoken at home currently

67
We created two multiple regression models. In both models, the above ninebackground variables were used as predictors. In the first model, the score ofEnglish reading was used as the criterion variable, and in the second model, themath score was used as the criterion variable. We used the same models on the datafrom Grades 4 and 8. We will discuss the results of regression analyses separatelyfor each grade.
Regression Results for Grade 4
Table 49 summarizes the results of multiple regression analysis for Grade 4.
As the data in Table 49 show, using all nine variables yields an R2 of .132. That is,
about 13% of the variance in reading scores was explained by the background
variables. Among the nine predictors, four are strongly related to performance on
the reading test. These variables are:
1. whether student attended first grade in the United States
2. how well student claims to be learning math
3. student’s complaints about math tests
4. student’s opportunity to learn math
Table 49
Grade 4 Background Questions. Multiple Regression (Reading Total Is OutcomeMeasure). R2 = .132
B Std err. Beta T Sig.
Constant 9.019 1.954 4.615 .000
Time in U.S. -.121 .250 -.036 -.486 .627
First grade in U.S. -.785 .221 -.224 -3.555 .000
How well are youlearning math?
.811 .229 .148 3.545 .000
Complaints aboutmath tests
.779 .241 .139 3.234 .001
Born in the U.S. -5.497 E-02
.610 -.005 -.090 .928
School resources -1.172 E-02
.137 -.004 -.085 .932
Home language prior .182 .371 .022 .489 .625
Home language now .655 .347 .083 1.885 .060
Opportunity to learnmath
8.754 E-02
.040 .097 2.206 .028

68
Once again, having attended first grade in the United States, claiming to belearning math well, and having the opportunity to learn a variety of math contentareas are the variables most strongly related to higher performance on the readingtest.
Table 50 summarizes the results of multiple regression analysis, predicting themath score from the nine background questions. The model had an R2 of .099, that is,about 10% of the variance of math score was explained by the backgroundquestions. Among the most powerful predictors are:
1. whether student started first grade in U.S. schools
2. how well student claims to be learning math
3. student’s opportunity to learn math
Regression Results for Grade 8
Two multiple regression models were created for Grade 8. These models aresimilar to those used for Grade 4. In the first model, the reading score was used asthe criterion variable and the nine background variables as predictors. Table 51presents the results of the first multiple regression model for Grade 4. As the data inTable 51 show, the R2 for this model was .139 suggesting that about 14% of the
Table 50
Grade 4 Background Questions. Multiple Regression (Math Total Is OutcomeMeasure). R2 = .099
B Std Err. Beta T Sig.
Constant 14.184 3.257 4.355 .000
Time in U.S. -.617 .416 -.112 -1.483 .139
1st grade in U.S. -1.297 .368 -.226 -3.523 .000
How well are youlearning math
1.334 .381 .149 3.501 .001
Complaints aboutmath tests
.548 .401 .060 1.364 .173
Born in the U.S. 3.331E-02
1.016 .002 .033 .974
School resources .393 .228 .077 1.719 .086
Home language prior -.560 .619 -.041 -.904 .366
Home language now .380 .579 .029 .657 .512
Opportunity to learnmath
.174 .066 .118 2.629 .009
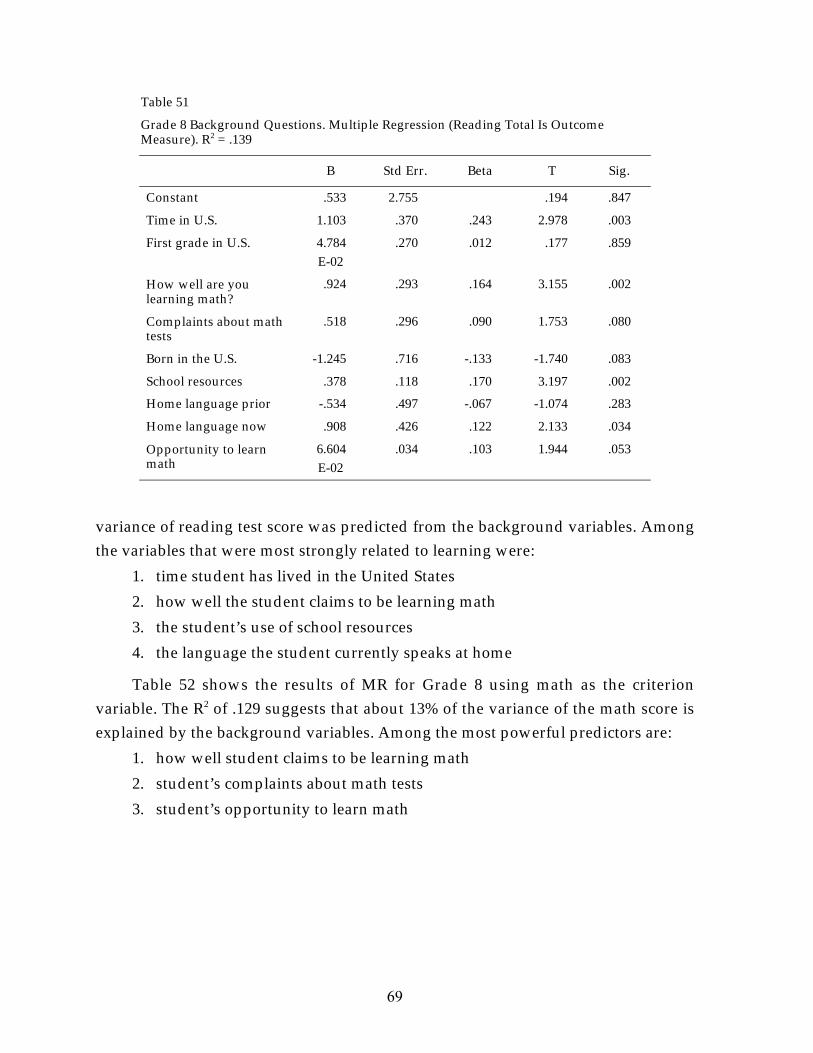
69
Table 51
Grade 8 Background Questions. Multiple Regression (Reading Total Is OutcomeMeasure). R2 = .139
B Std Err. Beta T Sig.
Constant .533 2.755 .194 .847
Time in U.S. 1.103 .370 .243 2.978 .003
First grade in U.S. 4.784E-02
.270 .012 .177 .859
How well are youlearning math?
.924 .293 .164 3.155 .002
Complaints about mathtests
.518 .296 .090 1.753 .080
Born in the U.S. -1.245 .716 -.133 -1.740 .083
School resources .378 .118 .170 3.197 .002
Home language prior -.534 .497 -.067 -1.074 .283
Home language now .908 .426 .122 2.133 .034
Opportunity to learnmath
6.604E-02
.034 .103 1.944 .053
variance of reading test score was predicted from the background variables. Amongthe variables that were most strongly related to learning were:
1. time student has lived in the United States
2. how well the student claims to be learning math
3. the student’s use of school resources
4. the language the student currently speaks at home
Table 52 shows the results of MR for Grade 8 using math as the criterionvariable. The R2 of .129 suggests that about 13% of the variance of the math score isexplained by the background variables. Among the most powerful predictors are:
1. how well student claims to be learning math
2. student’s complaints about math tests
3. student’s opportunity to learn math

70
Table 52
Grade 8 Background Questions. Multiple Regression (Math Total Is OutcomeMeasure). R2 = .129
B Std Err. Beta T Sig.
Constant 2.673 3.420 .782 .435
Time in U.S. .554 .460 .099 1.206 .229
First grade in U.S. -.271 .335 -.053 -.808 .420
How well are youlearning math?
.905 .363 .130 2.490 .013
Complaints aboutmath tests
.737 .367 .104 2.008 .045
Born in the U.S. -.543 .888 -.047 -.611 .542
School resources .375 .147 .137 2.555 .011
Home language prior -.444 .617 -.045 -.720 .472
Home language now .619 .528 .068 1.171 .242
Opportunity to learnmath
.154 .042 .194 3.646 .000

71
Discussion
In response to the legislative call for equal educational opportunity for allchildren, including English language learners, NAEP has recently adopted thepolicy of inclusion. In order to include English language learners in NAEP and otherlarge-scale assessments and to provide a fair and valid assessment for them, someforms of assessment accommodations have been provided. The purpose ofproviding accommodations to ELL students is to help them overcome problems dueto limited English language proficiency. The main objective of this study was toidentify accommodations that can help ELL students with their languagedeficiencies without altering the construct of the assessment. To identify effectiveand valid accommodations, two sets of accommodation strategies were included inthis study. The first set was selected from those used in NAEP and found effective inincreasing the inclusion rate. The second set of accommodations was languagerelated and was among those that researchers found to be effective in reducing theperformance gap between ELL students and non-ELL students.
For this study, we selected two samples, one from Grade 4 and one from Grade8 classes, in order to be consistent with NAEP assessments. Differentaccommodation plans were used for each grade. For Grade 4, we used fouraccommodations (customized English dictionary, extra time, small-group testing,and computer testing with a pop-up glossary). For Grade 8, we used a customizedEnglish dictionary and a computer version of the math test. We also tested Grade 4and 8 students under the standard NAEP testing condition.
For this study, students were only available in their intact classrooms; thus, thedesign of this study was quasi-experimental. Within the intact classrooms, thedifferent accommodation conditions were assigned randomly to students. However,due to logistical issues, smaller numbers of students were tested under someaccommodations, such as small-group testing and computer testing. Therefore, someof the students who would have been selected for small-group testing and computertesting were randomly distributed to other accommodation conditions.
Due to the random assignment of students to different accommodationstrategies, we did not expect any initial differences in student performance acrossthe accommodation groups. However, because of the small number of students insome groups, we decided to control for possible initial differences in reading using ameasure of English reading proficiency as a covariate. Since our search for a single,

72
reliable, and valid measure of English reading proficiency did not provide us withsuch a measure, we decided to use a battery of English reading proficiencymeasures. We used a composite (a simple or a latent composite) of those measuresas a covariate.
We examined different accommodations for their: (1) effectiveness, that is, howeffective an accommodation is in increasing ELL students’ performance; (2) validity,whether an accommodation affects the construct being measured or alters theperformance of non-ELL students; and (3) feasibility, whether effective and validaccommodations are also logistically feasible (i.e., easy to implement). For testingthe effectiveness of accommodations, we tested students under the standard NAEPcondition as a comparison group. For examining the validity of accommodations,we also included non-ELL students to serve as another control or comparison group.
The accommodated assessment subject matter in this study was mathematics.A total of 25 released math items were selected from the recent NAEP assessmentsand from the Third International Mathematics and Science Study (TIMSS). Itemswere selected to represent a wide range of content coverage, language, andpsychometric characteristics. Both multiple-choice and open-ended items wereincluded. In addition to the math test, we included different measures of Englishproficiency, an accommodation follow-up questionnaire to collect data on students’impressions regarding the accommodations, a student background questionnaire tocollect background data relevant to content-based assessment, and finally, teacherand school questionnaires to collect relevant information from teachers and schoolofficials.
The reading test battery included a section of the Language Assessment Scales(LAS) with a higher level of discrimination power, a 25-minute block of a NAEPreading comprehension test, and a word-recognition test. A latent composite ofthese measures was obtained through a latent-modeling approach. A simplecomposite was also computed. These composites were used in separate analyses tocontrol for possible initial English proficiency differences between accommodationgroups. Using these composites as covariates, math scores were adjusted forpossible initial differences. Adjusted math scores were compared across theaccommodation groups using a priori or planned comparisons.
The results of our analyses for Grade 4 revealed that extra time and computertesting were effective forms of accommodation for ELL students. For non-ELL

73
students, the results did not show any significant differences betweenaccommodated and non-accommodated assessments. Therefore, the twoaccommodation strategies showed effectiveness, without posing any threat to thevalidity of the assessment.
The results indicate that only computer testing is an effective accommodationfor the Grade 8 ELL students in this study. This accommodation has no impact onthe assessment of non-ELL students, suggesting that the computer testing for Grade8 can be implemented without a validity concern.
We did not look for differential effects for the multiple-choice and open-endeditems separately because there were not enough items in each of the two categoriesto do so. However, we grouped the items according to their linguistic complexity toexamine the validity and effectiveness of accommodations. This is discussed below.
Students’ background variables showed a significant impact on theirperformance in math. These background variables included language-related andother background variables. As we reported earlier, among the backgroundvariables that were powerful predictors of student performance were “Time studentlived in the U.S.,” “How well student claims to be learning math,” and “Student’sopportunity to learn math.” For example, in Grade 4, students who lived in the U.S.for a year had a mean math score of 8.29 (SD = 5.30) as compared to a mean of 12.30(SD = 3.73) for those who lived their entire life in the U.S. Once again, the predictivepower of a variable that may indirectly be linked to the students’ languagebackground suggests that language background is a determining factor of testperformance. Among variables that are not language related, opportunity to learn(OTL) seemed to have significant impact on student performance.
This discussion focuses on three major themes, some of which are unique tothis study: (1) computer testing as a form of accommodation for ELL students; (2)using a composite of multiple measures of students’ level of English proficiency, and(3) accommodation impact on measurement with varying degree of linguisticcomplexity.
Computer Testing With a Pop-up Glossary as a Form of Accommodation for ELLStudents
In this study, computer testing was used as an accommodation strategy forelementary and middle school ELL students. (To test for validity, both ELL and non-ELL students participated in taking the computer version of the tests.) As presented

74
in the previous section of this report, the results of analyses indicated that computertesting was the most effective among other accommodation strategies used in thisstudy. The results also indicated that computer testing was a valid accommodationsince it did not affect the performance of non-ELL students.
We believe computer testing was effective because it incorporates into thesession an interactive set of accommodation features. While a primary interest in thisstudy was the provision of easy access to glossary help, this accommodation alsorepresented additional characteristics, such as the presentation of a single item at atime; extra time; and a small and novel setting. Below is an elaboration of thesefeatures:
Pop-up glossary. One of the most important characteristics of the computertesting was the extensive use of its glossaries by the students. Under the customizedEnglish dictionary accommodation, almost no students marked circles to indicatethat they had looked up words in the customized dictionary. In Grade 8 classes, 140of the 204 students with this accommodation marked the sample word everyonewas asked to find and mark. Otherwise, a maximum of 4 students marked any givenword, such as “growth,” on the pages of definitions. In Grade 4 classes, 146 of the170 students with customized dictionaries marked the sample word as instructed.Technical words such as “grid,” “width,” and “length” led the words looked up andwere marked by 8, 7, and 5 students respectively.
Students assessed under the computer testing approach, however, used theirglossary at a much higher rate than the customized English dictionary group.Students taking the computer version of the math test had access to a “pop-upglossary,” a feature that provided a simple gloss of words when students pointed tothem with the mouse. The program timed the length of time students spend on eachtest item. The computer also kept track of which glossary items the students lookedup and how long the mouse stayed in that position. The results indicated a largedifference between the glossing behavior of ELL and non-ELL students. Forexample, ELL students in Grade 8 spent nearly three times as much time glossing,and glossed almost twice as many words as non-ELL students.
Delivery of the customized dictionary by computer had several advantages forthe students. Students pointed the mouse to an unknown word instead of searchingfor it in an alphabetical collection. Students were presented with the dictionary entry
75
of only that word (or its root) in its present context, rather than being given all thepossible definition entries.
Presentation of a single item at a time. The ELL students taking the computerversion were presented with a single question at a time on the screen in front ofthem, rather than 15 test pages, each page presenting as many as 3 questions.However, test-wise students noticed the disadvantage of not being able to jumpahead to easier (i.e., multiple-choice) questions, and then return to the harder ones.A few mouse-savvy students used the right button to go back a page to change ananswer.
Small, novel setting. Taking a test on a computer—usually in a special roomand in a group of about 8—may have been perceived as a privilege rather than achore. We expected that the randomly selected non-ELL students would alsoperform better than their “paper-test” peers, but they did not in Grade 4, and theslight increase in Grade 8 did not reach a significant level (p > 0.05). The slightdifference may be accounted for by familiarity with the keyboard and mouse. Asmentioned in the results section, more of the non-ELL students have computers athome (66% non-ELLs; 49% ELLs). Another consideration from test administratorobservation is that more non-ELL students possessed the touch-typing skills thatmade responding to open-ended questions faster.
Computer testing was fun. Students expressed enjoyment of the computerdelivery of the test, despite the predominance of “hunt and peck” typing. Asdiscussed in the results section of this report, all students indicated in theirbackground questionnaires that they had more fun with computer testing than withany other accommodation used in this study. A few explained that they preferredbackspacing to erasing. Some students used the “copy and paste” mouse techniqueto answer open-ended questions about the reading passage. A very few figured outhow to go back to a previous question without having a “back” button available.(This unfortunately produced multiple answers in the database.) The testadministrators noticed that people or noise in the room rarely distracted computertesters.
Feasibility issues with computer testing. Because Internet access was requiredfor administering the computer version of the math and reading tests, testing waslimited to certain schools, certain rooms, and computers of a certain size. When weneeded to bring laptops to the site, there was at least an hour of setup and another of

76
clean up. We sometimes had to borrow some of the static IP addresses for thatschool and type a unique one into each laptop’s Internet set-up menu the day before.When using a school’s Macintosh computers, some browser versions could notdisplay the pop-up glossary properly, so we had to load new browsers.
If a student accidentally closed the browser when trying to click on the scrollbar, the student’s test would be interrupted. This was most common with Grade 4students trying to use the laptop touchpad instead of the mouse provided.Difficulties beyond student error interrupted testing: a power outage, the UCLAhost server being rebooted during a test, and the data server crashing. Because oftechnical difficulties, some students took the math test on computer, but took thereading test on paper. Thus, while computer testing was a successfulaccommodation, its implementation was not without logistical problems.
Using a Composite of English Proficiency Measures
Due to the importance of English proficiency measures in the instruction,assessment, and classification of ELL students, we tried to establish a more reliableand valid measure of students’ level of English proficiency by compiling a battery ofexisting measures that are shown to have good measurement properties. We usedthree measures in this battery: (1) a subscale of the LAS (reading fluency), which hashigher discrimination power than other LAS subscales, (2) a 25-minute NAEPreading comprehension block, and (3) a word recognition test. After adjusting forscale differences, we created a simple composite of these components and used thiscomposite as a covariate to adjust for any possible initial differences of students’level of English proficiency. We also created a latent composite based on the fact thatthe psychometric characteristics of these instruments (e.g., reliability coefficients) aredifferent. Both simple composites and latent composites were used as covariates. Insome cases, some differences were observed and the latent composite was a moreefficient covariate. However, due to ease of computation and reporting, we used thesimple composite in our analyses.
What we learned from using a composite of English proficiency measures was:
1 . Multiple measures provide a more stable/reliable measure of Englishlanguage proficiency—an essential element in studies on ELL assessment;and
2. Care must be taken in the procedure of combining multiple measures of aconstruct; that is, when multiple measures are used, there needs to be a

77
more comprehensive approach to the analysis, such as a latent-variablemodeling approach.
Among the components used in the English proficiency battery, the wordrecognition deserves a comment.
Word recognition. An English word recognition measure used on anexperimental basis had a significantly high correlation with other reading measures,(so it has some value as an efficient form of reading measurement) but was verylikely more difficult to take on a computer than on paper, as the results were somuch lower for the computer testing sample. For this reason, it was not used as acovariate in the primary analysis.
Accommodation Impact on Measurement With Degrees of Linguistic Complexity
We categorized math test items based on the level of their linguistic complexityand examined the effectiveness and validity of accommodations on the linguisticallymore complex and less complex items. We combined items into two categories, lesscomplex (rated 0, 1, or 2, using a linguistic complexity rubric) and more complex(rated 3 or 4). Accordingly, we created two testlets. We then looked at howaccommodation effect varied between the two testlets by performing a multivariateanalysis of covariance to assess whether the significant accommodation effect foundin the total score was due to the complexity of the item.
For the more linguistically complex items, all the accommodations made asignificant difference for Grade 4 ELL students. For Grade 8 ELL students, we foundthat the computer accommodation was significant for the more linguisticallycomplex items (p = .001), but it was not significant for the items that were lesslinguistically complex. This is additional evidence of the validity of theaccommodations by showing that the computer accommodation at Grade 8 onlyshowed an effect on those items for which we would expect language to mostdisadvantage ELLs.
For the less complex Grade 4 math items, the computer and extra timeaccommodations were still significant for ELL students. For non-ELL students inGrades 4 and 8, there was no significant accommodation effect; therefore, validitywas not a concern for either testlet in either grade.

78
Recommendations
In this study, we find that the computer accommodation is effective and valid.That is, it can be used on both ELL and non-ELL students without the concern ofchanging the construct under measurement. Thus, we recommend thisaccommodation for ELL students when large numbers are included in theassessment. This use, of course, is dependent on an increase in the feasibility ofputting together computer tests and administering them at school sites.
A finding that relates OTL to test performance is consistent with the literatureand suggests that it is essential that all students have an equal opportunity to learnin schools. We would like to examine the interaction between OTL and students’language background. In this study, however, we did not have enough data toelaborate on such an interaction. We propose that future studies focus on a possibledifferential level of OTL for students with different language backgroundcharacteristics.

79
References
Abedi, J. (1996). The interrater/test reliability system (ITRS). Multivariate BehavioralResearch, 31(4), 409-417.
Abedi, J., Courtney, M., & Leon, S. (2001). Language accommodation for large-scaleassessment in science. Los Angeles: University of California, Center for the Study ofEvaluation/National Center for Research on Evaluation, Standards, and StudentTesting.
Abedi, J., Courtney, M., Mirocha, J., Leon, S., & Goldberg, J. (2001). Languageaccommodation for large-scale assessment in science. Los Angeles: University ofCalifornia, National Center for Research on Evaluation, Standards, and StudentTesting.
Abedi, J., & Leon, S. (1999). Impact of students’ language background on content-basedperformance: Analyses of extant data. Los Angeles: University of California, NationalCenter for Research on Evaluation, Standards, and Student Testing.
Abedi, J., Leon, S., & Mirocha, J. (2001). Examining ELL and non-ELL student performancedifferences and their relationship to background factors: Continued analyses of extant data.Los Angeles: University of California, National Center for Research on Evaluation,Standards, and Student Testing.
Abedi, J., & Lord, C. (2001). The language factor in mathematics tests. AppliedMeasurement in Education, 14(3), 219-234.
Abedi, J., Lord, C., Hofstetter, C., & Baker, E. (2000). Impact of accommodationstrategies on English language learners’ test performance. Educational Measurement:Issues and Practice, 19(3), 16-26.
Abedi, J., Lord, C., & Hofstetter, C. (1998). Impact of selected background variables onstudents’ NAEP math performance. Los Angeles: University of California, Center forthe Study of Evaluation/National Center for Research on Evaluation, Standards,and Student Testing.
Abedi, J., Lord, C., Kim, C., & Miyoshi, J. (2000). The effects of accommodations on theassessment of LEP students in NAEP. Los Angeles: University of California, Centerfor the Study of Evaluation/National Center for Research on Evaluation,Standards, and Student Testing.
Abedi, J., Lord, C., & Plummer, J. (1997). Language background as a variable in NAEPmathematics performance (Tech. Rep. No. 429). Los Angeles: University of California,Center for the Study of Evaluation/National Center for Research on Evaluation,Standards, and Student Testing.

80
American Educational Research Association, American Psychological Association, &National Council on Measurement in Education (1999). Standards for educational andpsychological testing. Washington, DC: American Educational Research Association.
Butler, F. A., & Castellon-Wellington, M. (2000). Students’ concurrent performance on testsof English language proficiency and academic achievement (Draft Deliverable toOBEMLA). Los Angeles: University of California, Center for the Study ofEvaluation/National Center for Research on Evaluation, Standards, and StudentTesting.
California Department of Education. (2000). California demographics data. Retrieved fromhttp://www.cde.ca.gov/demographics/
Castellon-Wellington, M. (2000). The impact of preference for accommodations: Theperformance of English language learners on large-scale academic achievement tests (Tech.Rep. No. 524). Los Angeles: University of California, Center for the Study ofEvaluation/National Center for Research on Evaluation, Standards, and StudentTesting.
Chard, D. J., Simmons, D. C., & Kameenui, E. J. (1998). Word recognition: Researchbases. In D. C. Simmons & E. J. Kameenui (Eds.), What reading research tells us aboutchildren with diverse learning needs: Bases and basics (pp. 141-167). Mahwah, NJ:Erlbaum.
Collier, V. (1987). Age and rate of acquisition of second language for academicpurposes. TESOL Quarterly, 21(4), 617-41.
Council of Chief State School Officers. (2001). Annual survey of state studentassessment programs: A summary report, Spring 2001. Washington, DC: Author.
Cummins, D. D., Kintsch, W., Reusser, K., & Weimer, R. (1988). The role ofunderstanding in solving word problems. Cognitive Psychology, 20, 405-438.
Cummins, J. (1980) The entry and exit fallacy in bilingual education. The Journal for theNational Association for Bilingual Education, 4(3), 25-59.
Cummins, J. (1981). Four misconceptions about language proficiency in bilingualeducation. The Journal for the National Association for Bilingual Education, 5(3), 31-45.
De Corte, E., Verschaffel, L., & DeWin, L. (1985). Influence of rewording verbalproblems on children’s problem representations and solutions. Journal ofEducational Psychology, 77(4), 460-470.
Duran, R. P. (October 1989). Assessment and instruction of at-risk Hispanic students.Exceptional Children, 56(2), 154-158.
Gandara, P., & Merino, B. (1993) Measuring the outcomes of LEP programs: Test scores,exit rates, and other mythological data. Educational Evaluation and Policy Analysis,15, 320-328.

81
Garcia, G. E. (1991). Factors influencing the English reading test performance ofSpanish-speaking Hispanic children. Reading Research Quarterly, 26(4), 371-391.
Gough, P. B. (1996). How children learn to read and why they fail. Annals of Dyslexia, 46,3-20.
Hafner, A. L. (2001, April). Evaluating the impact of test accommodations on test scores ofLEP students & non-LEP students. Paper presented at the annual meeting of theAmerican Educational Research Association, Seattle, WA.
Hudson, T. (1983). Correspondences and numerical differences between disjoint sets.Child Development, 54, 84-90.
Improving America’s Schools Act of 1994, Pub. L. No. 103-382, 108 Stat. 3518 (1994).
Imbens-Bailey, A., & Castellon-Wellington, M. (1999, September). Linguistic demands oftest items used to assess ELL students. Paper presented at the CRESST NationalConference, Los Angeles, CA.
Imbens-Bailey, A., Dingle, M., & Moughamian, A. (1999). Evaluation and selection ofEnglish language and literacy. Los Angeles: University of California, Center for theStudy of Evaluation/National Center for Research on Evaluation, Standards, andStudent Testing.
Individuals with Disabilities Education Act Amendments of 1997, Pub. L. No. 105-17, 37Stat. 111 (1997).
Kindler, A. L. (2002). Survey of the states’ limited English proficient students & availableeducational programs and services, 1999-2000 Summary Report. Washington, DC:National Clearinghouse for English Language Acquisition and LanguageInstruction Educational Programs.
Kirk, R. E. (1995). Experimental design: Procedures for the behavioral sciences. Pacific Grove,CA: Brooks/Cole.
Kopriva, R. (2000). Ensuring accuracy in testing for English language learners. Washington,DC: Council of Chief State School Officers.
LaCelle-Peterson, M. W., & Rivera, C. (1994). Is it real for all kids? A framework forequitable assessment policies for English language learners. Harvard EducationalReview, 64(1), 55-75.
Larsen, S. C., Parker, R. M., & Trenholme, B. (1978). The effects of syntactic complexityupon arithmetic performance. Educational Studies in Mathematics, 21, 83-90.
Liu, K., Anderson, M., Swierzbin, B., & Thurlow, M. (1999). Bilingual accommodations forlimited English proficient students on statewide reading tests: Phase 1 (Rep. No. 20).Minneapolis: University of Minnesota, National Center on Educational Outcomes.

82
Liu, K., Anderson, M., Swierzbin, B., Spicuzza, R., & Thurlow, M. (1999). Feasibility andpracticality of a decision making tool for standards testing of students with limited Englishproficiency (Rep. No. 22). Minneapolis: University of Minnesota, National Center onEducational Outcomes.
Liu, K., & Thurlow, M. (1999). Limited English proficient students’ participation andperformance on statewide assessments (Rep. No. 19). Minneapolis: University ofMinnesota, National Center on Educational Outcomes.
Liu, K., Thurlow, M., Erickson, R., Spicuzza, R., & Heinze, K. (1997). A review of theliterature on students with limited English proficiency and assessment (Rep. No. 11).Minneapolis: University of Minnesota, National Center on Educational Outcomes.
Liu, K., Thurlow, M., Thompson, S., & Albus, D. (1999). Participation and performance ofstudents from non-English language backgrounds (Rep. No. 17). Minneapolis:University of Minnesota, National Center on Educational Outcomes.
Mazzeo, J. (1997, March). Toward a more inclusive NAEP. Paper presented at the annualmeeting of the American Educational Research Association, Chicago, IL.
Mazzeo, J., Carlson, J. E., Voelkl, K. E., & Lutkus, A. D. (2000). Increasing the participationof special needs students in NAEP: A report on 1996 NAEP research activities (NCESPublication No. 2000-473). Washington, DC: National Center for EducationStatistics.
Meara, P., & Buxton, B. (1987). An alternative to multiple choice vocabulary test.Language Testing, 4, 142-154.
Meara, P., & Jones, G. (1988). Vocabulary size as a placement indicator. In P. Grunwell(Ed.), Applied linguistics in society (pp. 80-87). London: Centre for Information onLanguage Teaching and Research.
Mestre, J. P. (1988). The role of language comprehension in mathematics and problemsolving. In R. R. Cocking & J. P. Mestre (Eds.), Linguistic and cultural influences onlearning mathematics (pp. 200-220). Hillsdale, NJ: Erlbaum.
Miller, E. R., Okum, I., Sinai, R., & Miller, K. S. (1999). A study of the English languagereadiness of limited English proficient students to participate in New Jersey’s statewideassessment system. Paper presented at the meeting of the National Council ofMeasurement in Education, Montreal, Canada.
National Clearinghouse for Bilingual Education. (1997). High-stakes assessment: Aresearch agenda for English language learners. Symposium summary. Washington,DC: Author.
No Child Left Behind Act of 2001, Pub. L. No. 107-110, 115 Stat. 1425 (2002).

83
North Central Regional Educational Laboratory. (1996a). Part 1: Assessment of studentswith disabilities and LEP students. The status report of the assessment programs in theU.S. State student assessment program database. Oakbrook, IL: Author & Council ofChief State School Officers.
North Central Regional Educational Laboratory (1996b). The status of state studentassessment programs in the United States: Annual report. Oakbrook, IL: Author &Council of Chief State School Officers.
O’Sullivan, C. Y., Reese, C. M., & Mazzeo, J. (1997, May). NAEP 1996 science report cardfor the nation and the states (NCES Pub. No. 97497). Washington, DC: NationalCenter for Education Statistics.
Olson, J. F., & Goldstein, A. A. (1997). The inclusion of students with disabilities and limitedEnglish proficiency students in large-scale assessments: A summary of recent progress(NCES Pub. No. 97-482). Washington, DC: National Center for Education Statistics.
Read, J. (2000). Assessing vocabulary. New York: Cambridge University Press.
Riley, M. S., Greeno, J. G., & Heller, J. I. (1983). Development of children’s problem-solving ability in arithmetic. In H. P. Ginsburg (Ed.), The development ofmathematical thinking (pp. 153-196). New York: Academic Press.
Rivera, C., & Stansfield, C. W. (1998). Leveling the playing field for English languagelearners: Increasing participation in state and local assessments through accommodations.Retrieved fromhttp://ceee.gwu.edu/standards_assessments/researchLEP_accommodcase.htm
Rivera, C., & Stansfield, C. W. (2001, April). The effects of linguistic simplification of sciencetest items on performance of limited English proficient and monolingual English-speakingstudents. Paper presented at the annual meeting of the American EducationalResearch Association, Seattle, WA.
Rivera, C., Stansfield, C. W., Scialdone, L., & Sharkey, M. (2000). An analysis of statepolicies for the inclusion and accommodation of English language learners in stateassessment programs during 1998-1999. Arlington, VA: The George WashingtonUniversity, Center for Equity and Excellence in Education.
Rivera, C., Vincent, C., Hafner, A., & LaCelle-Peterson, M. (1997). Statewide assessmentprogram policies and practices for the inclusion of limited English proficient students.Washington, DC: Clearinghouse on Assessment and Evaluation (ERIC DocumentReproduction Service No. EDO-TM-97-02)
Roeber, E., Bond, L., & Connealy, S. (1998). Annual survey of state student assessmentprograms. Vol. I, II. Data on 1996-97 statewide student assessment programs, Fall 1997.Washington, DC: Council of Chief State School Officers.
Salvia, J., & Ysseldyke, J. (1998). Assessment. Boston: Houghton Mifflin.

84
Saville-Troike, M. (1991, Spring). Teaching and testing for academic achievement: Therole of language development. NCBE Focus: Occasional Papers in Bilingual Education,4. Retrieved from: http://www.ncbe.gwu.edu/ncbepubs/focus/focus4.html
Shavelson, R., & Webb, N. (1991). Generalizability theory: A primer. Newbury Park, CA:Sage Publications.
Zehler, A. M., Hopstock, P. J., Fleischman, H. L., & Greniuk, C. (1994). An examination ofassessment of limited English proficient students. Arlington, VA: DevelopmentAssociates, Special Issues Analysis Center.
Zlatos, B. (1994). Don’t test, don’t tell. American School Board Journal, 181(11), 24-28.

85
APPENDIX A
NUMBERS OF PARTICIPANTS PER ACCOMMODATION PER ELL
DESIGNATION PER SITE
DETAILS ABOUT MATH TEST ITEMS

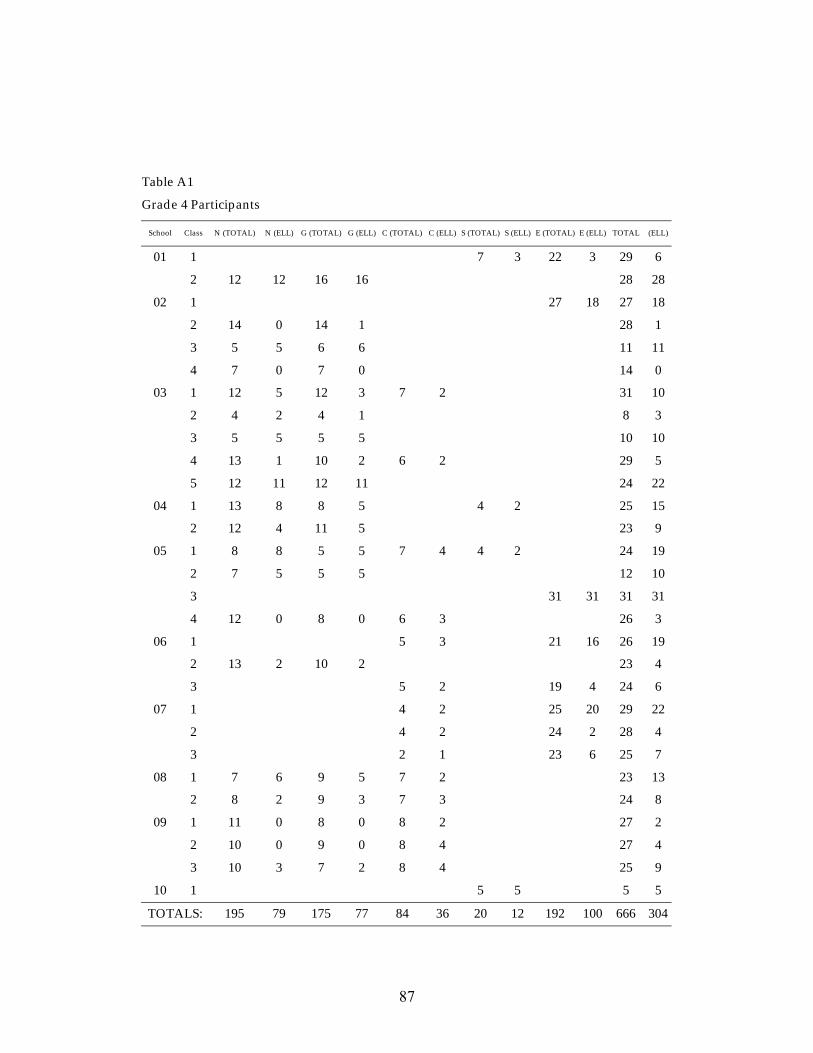
87
Table A1
Grade 4 Participants
School Class N (TOTAL) N (ELL) G (TOTAL) G (ELL) C (TOTAL) C (ELL) S (TOTAL) S (ELL) E (TOTAL) E (ELL) TOTAL (ELL)
01 1 7 3 22 3 29 6
2 12 12 16 16 28 28
02 1 27 18 27 18
2 14 0 14 1 28 1
3 5 5 6 6 11 11
4 7 0 7 0 14 0
03 1 12 5 12 3 7 2 31 10
2 4 2 4 1 8 3
3 5 5 5 5 10 10
4 13 1 10 2 6 2 29 5
5 12 11 12 11 24 22
04 1 13 8 8 5 4 2 25 15
2 12 4 11 5 23 9
05 1 8 8 5 5 7 4 4 2 24 19
2 7 5 5 5 12 10
3 31 31 31 31
4 12 0 8 0 6 3 26 3
06 1 5 3 21 16 26 19
2 13 2 10 2 23 4
3 5 2 19 4 24 6
07 1 4 2 25 20 29 22
2 4 2 24 2 28 4
3 2 1 23 6 25 7
08 1 7 6 9 5 7 2 23 13
2 8 2 9 3 7 3 24 8
09 1 11 0 8 0 8 2 27 2
2 10 0 9 0 8 4 27 4
3 10 3 7 2 8 4 25 9
10 1 5 5 5 5
TOTALS: 195 79 175 77 84 36 20 12 192 100 666 304

88
Table A2
Grade 8 Participants
School Class N (TOTAL) N (ELL) G (TOTAL) G (ELL) C (TOTAL) C (ELL) TOTAL (ELL)
01 1 13 10 11 9 7 4 31 23
2 11 11 11 11 22 22
3 13 4 8 3 7 3 28 10
02 1 16 12 15 14 31 26
2 16 2 13 3 29 5
03 1 12 1 10 1 7 4 29 6
2 6 1 4 1 7 4 17 6
04 1 6 9 5 20 0
2 11 1 10 5 26 1
3 13 9 12 11 5 5 30 25
05 1 10 1 11 3 10 4 31 8
2 9 8 7 7 10 10 26 25
3 8 7 10 1 25 1
4 16 3 9 1 10 5 35 9
5 7 6 11 24 0
6 5 5 4 4 11 11 20 20
06 1 1 1 1 1
2 16 16 16 16
07 1 13 2 8 4 21 6
2 11 8 10 8 21 16
3 15 4 10 6 25 10
4 13 4 10 6 23 10
5 10 7 7 4 8 4 25 15
6 11 2 5 2 8 4 24 8
7 14 3 6 4 8 4 28 11
8 12 2 5 8 4 25 6
08 1 1 1 7 1 8 2
2 2 1 2 1
3 1 1 1 1
TOTALS: 272 101 208 102 164 87 644 290

89
Table A3
Grade 4 Math Test Items by Content
Order ID Content Process
9/6 40501 algebra & functions conceptual understanding
19/14 41101 data analysis, statistics & probability conceptual knowledge10/23 40601 data analysis, statistics & probability conceptual understanding27/26 69101 data analysis, statistics & probability problem solving7/11 68601 data analysis, statistics & probability knowing procedures20/16 K-4 data repres., analysis, probability using complex procedures
5/24 K-1 geometry conceptual understanding25/10 K-8 geometry conceptual understanding1/3 J-1 geometry conceptual understanding
26/27 41201 geometry problem solving15/18 M-4 geometry problem solving
18/15 K-7 meas., estimation & number sense knowing procedures12/22 L-6 meas., estimation & number sense problem solving8/25 J-6 meas., estimation & number sense problem solving2/1 40401-3 measurement conceptual understanding
14/20 69001 measurement problem solving17/13 41001 measurement problem solving
21/17 40901 numbers & operations conceptual understanding6/9 68501 numbers & operations conceptual understanding11/5 40701 numbers & operations conceptual understanding22/4 40301 numbers & operations conceptual understanding13/19 68901 numbers & operations problem solving4/12 68301 numbers & operations knowing procedures24/8 68401 numbers & operations conceptual understanding23/7 I-7 patterns, relations, and functions problem solving3/2 I-4 whole numbers knowing procedures
16/21 I-2 fractions and proportionality conceptual understanding

90
Table A4
Grade 8 Math Test Items by Content
Order ID Content Process
30/12 R-11 algebra problem solving10/32 50801 algebra & functions problem solving31/9 50701 algebra & functions conceptual understanding
20/34 69301 algebra & functions knowing procedures33/11 50601 algebra & functions knowing procedures
27/5 50401 data analysis, stats & prob. conceptual understanding35/35 70001 data analysis, stats & prob. problem solving
1/2 50201-4 data analysis, stats & prob. problem solving12/33 K-7 data repres., analysis & prob. problem solving
2/3 I-6 fractions and number sense conceptual understanding23/25 R-13 fractions and number sense problem solving16/21 U-1 fractions and number sense problem solving
18/24 P-9 geometry knowing procedures28/8 N-12 geometry knowing procedures
22/20 51001 geometry problem solving21/19 L-15 geometry problem solving11/31 P-8 geometry problem solving6/29 M-7 geometry problem solving
14/13 Q-10 geometry using complex procedures32/10 R-10 geometry using complex procedures
34/15 I-3 measurement conceptual understanding26/6 N-15 measurement conceptual understanding3/4 69401 measurement conceptual understanding4/1 M-1 measurement conceptual understanding9/30 50501 measurement knowing procedures8/27 O-6 measurement knowing procedures
15/18 69201 numbers & operations conceptual understanding13/16 50301 numbers & operations conceptual understanding7/28 50001 numbers & operations conceptual understanding
17/14 50101 numbers & operations knowing procedures24/22 69901 numbers & operations conceptual understanding29/7 69501 numbers & operations conceptual understanding5/26 49901 numbers & operations conceptual understanding
25/17 69601 numbers & operations problem solving
19/23 M-6 proportionality problem solving

91
Table A5
Linguistic Complexity of Grade 4 Math Items
Order ID Word count Score
1/3 J-1 10 02/1 40401-3 10 23/2 I-4 5 04/12 68301 33 45/24 K-1 19 16/9 68501 29 37/11 68601 31 48/25 J-6 5 09/6 40501 25 1
10/23 40601 26 311/5 40701 37 312/22 L-6 25 213/19 68901 59 414/20 69001 29 215/18 M-4 57 416/21 I-2 5 017/13 41001 22 218/15 K-7 24 419/14 41101 41 420/16 K-4 36 321/17 40901 34 322/4 40301 6 023/7 I-7 34 324/8 68401 14 125/10 K-8 9 026/27 41201 30 327/26 69101 47 3

92
Table A6
Linguistic Complexity of Grade 8 Math Test Items
Order ID Word count Score
1/2 50201-4 81 32/3 I-6 8 13/4 69401 29 34/1 M-1 10 15/26 49901 12 36/29 M-7 15 27/28 50001 10 18/27 O-6 31 49/30 50501 64 4
10/32 50801 58 311/31 P-8 16 112/33 K-7 30 313/16 50301 17 214/13 Q-10 22 215/18 69201 36 416/21 U-1 57 417/14 50101 0 018/24 P-9 11 019/23 M-6 19 120/34 69301 47 421/19 L-15 32 322/20 51001 60 323/25 R-13 15 124/22 69901 86 225/17 69601 77 426/6 N-15 9 127/5 50401 59 428/8 N-12 29 129/7 69501 25 3
30/12 R-11 33 231/9 50701 36 4
32/10 R-10 23 233/11 50601 12 134/15 I-3 11 235/35 70001 150 4

93
APPENDIX B
ACCOMMODATION FOLLOW-UP QUESTIONNAIRE RESULTS


95
Grade 4 Accommodation Follow-Up Questionnaire Results
A multivariate general linear model was used to examine the relationships amongthe follow-up questions, accommodation types, and ELL designations. The follow-upquestions were the dependent variables, and accommodation type and ELL status wereconsidered fixed factors. Results appear in Table B1.
Significant findings for ELL students. In the math test, ELL students haddifficulty understanding more words than did non-ELL students. Few studentsreported that an English dictionary, a translation dictionary, some words in theirlanguage, or all words in their language would help them with the math test. For eachof these questions, ELL students felt they would be of help more often than non-ELLstudents. ELL students were more likely to report that reading the test questions aloudwould make the math questions easier.
Significant findings for the accommodation types. Students who took thecomputer test were much more likely to report that taking the test was “fun” thanstudents with the customized dictionary or standard condition. These students werealso more likely to want “more tests like this one.” Students who took the computer testor had extra time felt that more pictures would better help them understand the mathquestions. Students who took the computer test or had extra time were less likely torequest a translation dictionary to help them understand the math questions comparedto students with the standard condition. Students who took the computeraccommodation reported looking up more words during the test.

96
Table B1
Grade 4 Follow-up Question Means by ELL Status and Accommodation
ELL Non-ELL Total
Accommodation Mean Std. dev. Mean Std. dev. Mean Std. dev.1. In the math test I did not understand (1-no problem, 2-some words, 3-many words)LI
Computer 1.85 .558 1.53 .505 1.68 .549Extra time 1.64 .590 1.73 .588 1.68 .589Cust. dictionary 1.87 .591 1.57 .580 1.69 .601Standard condition 1.81 .662 1.57 .556 1.68 .615Total 1.77 .613 1.61 .567 1.68 .5942a. To make it easier to understand math problems, I would like (1-easier words)Computer .59 .500 .47 .505 .52 .503Extra time .51 .503 .50 .503 .50 .501Cust. dictionary .54 .502 .42 .496 .47 .501Standard condition .44 .500 .48 .502 .46 .500Total .51 .501 .47 .500 .48 .5002b. To make it easier to understand math problems, I would like (1-simpler sentences)Computer .29 .462 .40 .495 .35 .480Extra time .26 .444 .29 .454 .27 .448Cust. dictionary .25 .434 .31 .464 .28 .452Standard condition .34 .477 .32 .467 .33 .471Total .29 .453 .32 .466 .30 .4602c. To make it easier to understand math problems, I would like (1-easier math problems)Computer .38 .493 .37 .489 .38 .488Extra time .40 .493 .27 .449 .34 .475Cust. dictionary .33 .473 .27 .449 .30 .458Standard condition .42 .496 .32 .467 .36 .482Total .39 .488 .30 .459 .34 .4742d. To make it easier to understand math problems, I would like (1-math I learned)Computer .50 .508 .42 .499 .45 .501Extra time .62 .488 .49 .503 .56 .498Cust. dictionary .48 .504 .51 .503 .49 .502Standard condition .51 .503 .46 .501 .48 .501Total .54 .500 .47 .500 .50 .5002e. To make it easier to understand math problems, I would like (1-more pictures) A
Computer .38 .493 .35 .482 .36 .484Extra time .32 .470 .33 .474 .33 .471Cust. dictionary .21 .413 .21 .409 .21 .409Standard condition .22 .414 .21 .412 .21 .412Total .27 .446 .26 .441 .27 .4432f. To make it easier to understand math problems, I would like (1-an English dictionary) L
Computer .12 .327 .14 .351 .13 .338Extra time .17 .380 .12 .326 .15 .354Cust. dictionary .21 .413 .14 .352 .17 .378Standard condition .28 .451 .10 .304 .18 .386Total .21 .406 .12 .329 .16 .368
Note: L—Significant ELL Main effect p < .05;A—Significant Accommodation Main effect p < .05;I—Significant ELL/accommodation interaction p < .05.

97
Table B2
Grade 8 Follow-up Question Means by ELL Status and Accommodation
ELL Non-ELL Total
Accommodation Mean Std. dev. Mean Std. dev. Mean Std. dev.
2g. To make it easier to understand math problems, I would like (1-translation dictionary) LA
Computer .15 .359 .05 .213 .09 .289Extra time .13 .334 .04 .187 .08 .275Cust. dictionary .16 .373 .10 .300 .13 .332Standard condition .22 .414 .14 .352 .18 .381Total .16 .372 .09 .285 .12 .3292h. To make it easier to understand math problems, I would like (1-some words in mylanguage) L
Computer .21 .410 .07 .258 .13 .338Extra time .22 .416 .08 .278 .15 .360Cust. dictionary .08 .277 .07 .250 .07 .260Standard condition .24 .430 .08 .275 .15 .361Total .19 .394 .08 .265 .13 .3352i. To make it easier to understand math problems, I would like (1-all words in my language) L
Computer .21 .410 .07 .258 .13 .338Extra time .13 .334 .08 .278 .11 .308Cust. dictionary .20 .401 .07 .250 .12 .324Standard condition .15 .361 .10 .304 .12 .331Total .16 .368 .08 .275 .12 .3232j. To make it easier to understand math problems, I would like (1-questions read aloud) L
Computer .38 .493 .21 .412 .29 .455Extra time .25 .437 .18 .385 .22 .413Cust. dictionary .20 .401 .24 .431 .22 .418Standard condition .24 .430 .12 .329 .18 .381Total .25 .435 .18 .388 .21 .4112k. To make it easier to understand math problems, I would like (more time)A
Computer .38 .493 .37 .489 .38 .488Extra time .37 .485 .30 .460 .33 .473Cust. dictionary .46 .502 .54 .501 .51 .502Standard condition .47 .502 .48 .502 .47 .501Total .42 .495 .43 .496 .43 .4953. Most of these math problems were (1-very easy, 2-easy, 3-hard, 4-very hard)Computer 2.12 .769 2.14 1.246 2.13 1.056Extra time 2.18 .829 2.05 .805 2.12 .818Cust. dictionary 2.15 .853 2.18 1.207 2.16 1.076Standard condition 2.29 1.221 1.89 1.044 2.07 1.141Total 2.20 .960 2.05 1.069 2.12 1.023
Note: L—Significant ELL Main effect p < .05;A—Significant Accommodation Main effect p < .05;I—Significant ELL/accommodation interaction p < .05.

98
Table B3
Grade 4 Follow-up Question Means by ELL Status and Accommodation
ELL Non-ELL Total
Accommodation Mean Std. dev. Mean Std. dev. Mean Std. dev.
4a. Taking the test with this accommodation was (1-a little hard) A
Computer .15 .359 .09 .294 .12 .323Extra time .43 .497 .39 .491 .41 .493Cust. dictionary .15 .358 .15 .363 .15 .360Standard condition .27 .445 .19 .397 .23 .419Total .28 .448 .22 .416 .25 .4314b. Taking the test with this accommodation was (1-hard) L A
Computer .18 .387 .14 .351 .16 .365Extra time .07 .255 .02 .153 .05 .212Cust. dictionary .11 .321 .08 .268 .09 .290Standard condition .27 .445 .13 .341 .19 .395Total .15 .361 .09 .285 .12 .3234c. Taking the test with this accommodation was (1-same as other math tests)Computer .35 .485 .37 .489 .36 .484Extra time .33 .474 .35 .478 .34 .475Cust. dictionary .38 .489 .41 .494 .39 .490Standard condition .38 .488 .37 .485 .37 .485Total .36 .481 .37 .484 .37 .4834d. Taking the test with this accommodation was (1-easy) A
Computer .59 .500 .37 .489 .47 .502Extra time .24 .430 .39 .491 .32 .466Cust. dictionary .39 .493 .48 .502 .45 .499Standard condition .42 .496 .50 .503 .46 .500Total .38 .485 .45 .498 .42 .4934e. Taking the test with this accommodation was (1-fun) AI
Computer .85 .359 .84 .374 .84 .365Extra time .55 .500 .40 .494 .48 .501Cust. dictionary .64 .484 .43 .498 .51 .501Standard condition .51 .503 .58 .496 .55 .499Total .60 .491 .53 .500 .56 .4975. Did want to look up words during the test (1-no, 2-sometimes, 3-often) A
Computer 1.91 .514 1.95 .653 1.94 .592Extra time 1.45 .605 1.37 .597 1.41 .601Cust. dictionary 1.66 1.031 1.47 .603 1.55 .804Standard condition 1.46 .573 1.52 .864 1.49 .747Total 1.56 .724 1.53 .719 1.54 .7218. Would you like your tests to be more like this one (1-yes, 2-no) A
Computer 1.09 .288 1.05 .213 1.06 .248Extra time 1.24 .430 1.24 .428 1.24 .428Cust. dictionary 1.15 .358 1.26 .443 1.22 .414Standard condition 1.15 .361 1.27 .444 1.21 .412Total 1.17 .378 1.23 .420 1.20 .402
Note: L—Significant ELL Main effect p < .05;A—Significant Accommodation Main effect p < .05;I—Significant ELL/accommodation interaction p < .05.

99
Grade 8 Accommodation Follow-up Questionnaire Results
A multivariate general linear model was used to examine the relationships amongthe follow-up questions, accommodation types, and ELL designations. The follow-upquestions were the dependent variables, and accommodation type and ELL status wereconsidered fixed factors. Results appear in Table B2.
Significant findings for ELL students. In the math test, ELL students haddifficulty understanding more words than did non-ELL students. ELL students weremore likely to report that more pictures on the math test would make the problemseasier to understand. This was especially true for ELL students who took the computertest.
Few students reported that an English dictionary, a translation dictionary, somewords in their language, or all words in their language would help them with the mathtest. For each of these questions ELL students felt they would be of help more often thannon-ELL students.
ELL students were less likely to report that the test they took was the same asother math tests.
Significant findings for the accommodation types. Students who took thecomputer test were much more likely to report that taking the test was “fun” thanstudents with the customized dictionary or standard condition. These students werealso more likely to want “more tests like this one.”
Students who took the computer test were much more likely to report that takingthe test was fun than students with the customized dictionary or standard condition.
A higher percentage of students who took the computer- and customizeddictionary-accommodated tests reported that the test was easy compared to those whotook the test under the standard condition. Similarly, a lower percentage of thoseaccommodated felt that the math test was hard.
Students who took the computer accommodation reported looking up more wordsduring the test.

100
Table B4
Grade 8 Follow-up Question Means by ELL Status and AccommodationELL Non-ELL Total
Accommodation Mean Std. dev. Mean Std. dev. Mean Std. dev.
1. In the math test I did not understand (1-no problem, 2-some words, 3-many words) LComputer 1.99 .615 1.69 .608 1.85 .628
Cust. dictionary 2.02 .628 1.71 .651 1.86 .658
Standard condition 1.94 .795 1.75 .563 1.82 .666
Total 1.98 .680 1.72 .601 1.84 .652
2a. To make it easier to understand math problems, I would like (1-easier words)Computer .41 .495 .40 .494 .41 .493
Cust. dictionary .37 .485 .32 .468 .34 .476
Standard condition .40 .493 .38 .486 .38 .488
Total .39 .489 .36 .482 .38 .485
2b. To make it easier to understand math problems, I would like (1-simpler sentences)Computer .29 .456 .36 .483 .32 .468
Cust. dictionary .38 .488 .32 .468 .35 .478
Standard condition .26 .439 .42 .496 .36 .481
Total .31 .463 .38 .485 .34 .4762c. To make it easier to understand math problems, I would like (1-easier math problems)Computer .40 .492 .57 .499 .47 .501
Cust. dictionary .41 .496 .40 .493 .41 .493
Standard condition .41 .495 .35 .480 .37 .485
Total .41 .492 .42 .494 .41 .4932d. To make it easier to understand math problems, I would like (1-math I learned)Computer .46 .501 .54 .502 .49 .502
Cust. dictionary .45 .501 .45 .500 .45 .499
Standard condition .45 .501 .50 .502 .48 .501
Total .45 .499 .49 .501 .47 .500
2e. To make it easier to understand math problems, I would like (1-more pictures) LI
Computer .39 .490 .13 .344 .27 .447
Cust. dictionary .23 .425 .15 .362 .19 .395
Standard condition .29 .459 .20 .402 .24 .426
Total .30 .461 .17 .376 .23 .423
2f. To make it easier to understand math problems, I would like (1-an English dictionary) L
Computer .18 .387 .12 .327 .15 .362
Cust. dictionary .18 .389 .08 .277 .13 .339
Standard condition .21 .406 .12 .326 .15 .361
Total .19 .393 .11 .311 .15 .354
Note: L—Significant ELL Main effect p < .05;A—Significant Accommodation Main effect p < .05;I—Significant ELL/accommodation interaction p < .05.

101
Grade 8 Follow-up Question Means by ELL Status and Accommodation (cont.)
ELL Non-ELL Total
Accommodation Mean Std. dev. Mean Std. dev. Mean Std. dev.
2g. To make it easier to understand math problems, I would like (1-translation dictionary) L
Computer .11 .313 .06 .239 .09 .282Cust. dictionary .11 .315 .06 .237 .08 .278Standard condition .15 .363 .04 .197 .08 .278Total .12 .330 .05 .219 .08 .2792h. To make it easier to understand math problems, I would like(1-some words in my language) L
Computer .11 .313 .07 .265 .09 .292Cust. dictionary .18 .389 .11 .310 .14 .352Standard condition .18 .386 .03 .177 .09 .285Total .16 .364 .06 .247 .11 .3102i. To make it easier to understand math problems, I would like (1-all words in my language) L
Computer .13 .341 .06 .239 .10 .301Cust. dictionary .13 .343 .09 .294 .11 .318Standard condition .13 .336 .03 .177 .07 .254Total .13 .339 .06 .234 .09 .2902j. To make it easier to understand math problems, I would like (1-questions read aloud)Computer .14 .354 .13 .344 .14 .348Cust. dictionary .09 .281 .14 .350 .11 .318Standard condition .14 .350 .12 .326 .13 .335Total .12 .330 .13 .337 .13 .3332k. To make it easier to understand math problems, I would like (more time)A
Computer .58 .497 .45 .501 .52 .501Cust. dictionary .65 .481 .72 .453 .68 .467Standard condition .67 .474 .66 .474 .67 .473Total .63 .484 .63 .484 .63 .4843. Most of these math problems were (1-very easy, 2-easy, 3-hard, 4-very hard)Computer 2.58 .843 2.42 .924 2.51 .880Cust. dictionary 2.52 .959 2.69 1.337 2.61 1.166Standard condition 2.55 .989 2.50 1.082 2.52 1.045Total 2.55 .927 2.54 1.134 2.55 1.0414a. Taking the test with this accommodation was (1-a little hard) A
Computer .35 .480 .24 .430 .30 .460Cust. dictionary .13 .343 .13 .338 .13 .339Standard condition .36 .483 .37 .484 .36 .482Total .28 .450 .26 .441 .27 .4454b. Taking the test with this accommodation was (1-hard) A
Computer .11 .313 .07 .265 .09 .292Cust. dictionary .12 .329 .05 .213 .08 .278Standard condition .22 .416 .18 .382 .19 .395Total .15 .356 .11 .316 .13 .335
Note: L—Significant ELL Main effect p < .05;A—Significant Accommodation Main effect p < .05;I—Significant ELL/accommodation interaction p < .05.

102
Grade 8 Follow-up Question Means by ELL Status and Accommodation (cont.)
ELL Non-ELL Total
Accommodation Mean Std. dev. Mean Std. dev. Mean Std. dev.
4c. Taking the test with this accommodation was (1-same as other math tests) L A
Computer .25 .437 .37 .487 .31 .463Cust. dictionary .40 .493 .58 .497 .49 .501Standard condition .33 .474 .56 .498 .47 .500Total .33 .471 .52 .501 .43 .4964d. Taking the test with this accommodation was (1-easy) A
Computer .29 .456 .30 .461 .29 .457Cust. dictionary .34 .477 .27 .447 .31 .462Standard condition .21 .406 .18 .389 .19 .395Total .28 .450 .24 .427 .26 .4384e. Taking the test with this accommodation was (1-fun) A
Computer .45 .500 .42 .497 .43 .497Cust. dictionary .23 .425 .14 .350 .19 .390Standard condition .18 .386 .13 .335 .15 .356Total .29 .454 .20 .402 .24 .4295. Did want to look up words during the test (1-no, 2-sometimes, 3-often) L A
Computer 1.93 .620 1.63 .517 1.79 .594Cust. dictionary 1.62 .601 1.25 .510 1.43 .586Standard condition 1.69 .631 1.34 .507 1.47 .583Total 1.75 .629 1.38 .529 1.55 .6068. Would you like your tests to be more like this one (1-yes, 0-no) L A
Computer .77 .423 .69 .467 .73 .444Cust. dictionary .59 .496 .36 .857 .47 .710Standard condition .53 .503 .51 .502 .52 .501Total .63 .484 .51 .635 .57 .572
Note: L—Significant ELL Main effect p < .05;A—Significant Accommodation Main effect p < .05;I—Significant ELL/accommodation interaction p < .05.