CS677 Final Project
12
CS677 Final Project (NLP) Sentiment Analysis using VADER on Tweets Tzupin Kuo Dec 10, 2019
Transcript of CS677 Final Project

CS677 Final Project (NLP)Sentiment Analysis using VADER on Tweets
Tzupin Kuo
Dec 10, 2019

Sentiment Analysis
• What
The process of ‘computationally’ determining whether a piece of sentence is positive, negative, or neutral (i.e., Polarity). Also known as opinion mining.
• Why
A very useful tool for identifying the public sentiments on fields such as Business, Politics, Public Relations, social phenomena, etc.
And ,when it comes to Financial field, it could be used to understand the public sentiments for things such as Company’s merging/acquisition, quarterly/annually positive results published, leadership changed for good, etc.

Sentiment Analysis
• Who
Researcher, marketer, Analyst, Politician, etc.
• How
1. Polarity Detection (positive/negative/neutral)
2. Emotion Detection (happy/sad/angry etc)
3. Intent Detection (e.g. underlying complaint in a product review)

Sentiment Analysis
• Which
Rule-based (or lexical) :
- VADER
- TextBlob
Machine Learning based :
- Standford CoreNLP (RNN)
- LSTM RNN
Excellent article by @ johngapper # TiffanyAndCo # LVMH # luxurylifestyle # Diamonds
Positive
I am so disappointed. # TiffanyAndCo # FightForFreedomStandWithHongKong
Negative
just like me! But I'm proud of it and I know it will taste amazing! # alltheworldsamage # bakingftw # tiffany # tiffanyandco # tiffanyblue
Positive
Now this is just wrong!!! We need Tiffany’s at a time like this!!!! # TiffanyAndCo # HurricaneDorainpic.twitter.com
Negative
I have the very best mom and sister in the world They have spoiled me so much for my birthday!! # birthdaygirl # birthdaypresent # tiffanyandco # imsospoiled # mymomisbetterthanyours
Positive
Extracting tweets’ sentiments using VADER
Data Collection PreprocessingVader Sentiment
Extraction
• Remove URLs• Remove Special
chars• Remove Stopwords
Twitter Data• Official Twitter API• Tweepy (API Wrapper)
Stock Data• Yahoo Finance
Visualization
Libraries used : Pandas, Numpy, VaderSentiment, Matplotlib, Plotly
Procedures
Plotly:• Interactive candle
chart (stock price)• Interactive bar chart
(sentiment score)
Matplotlib:• Scatterplot
• Sentiment score• -1 to 1
(most negative/most positive)
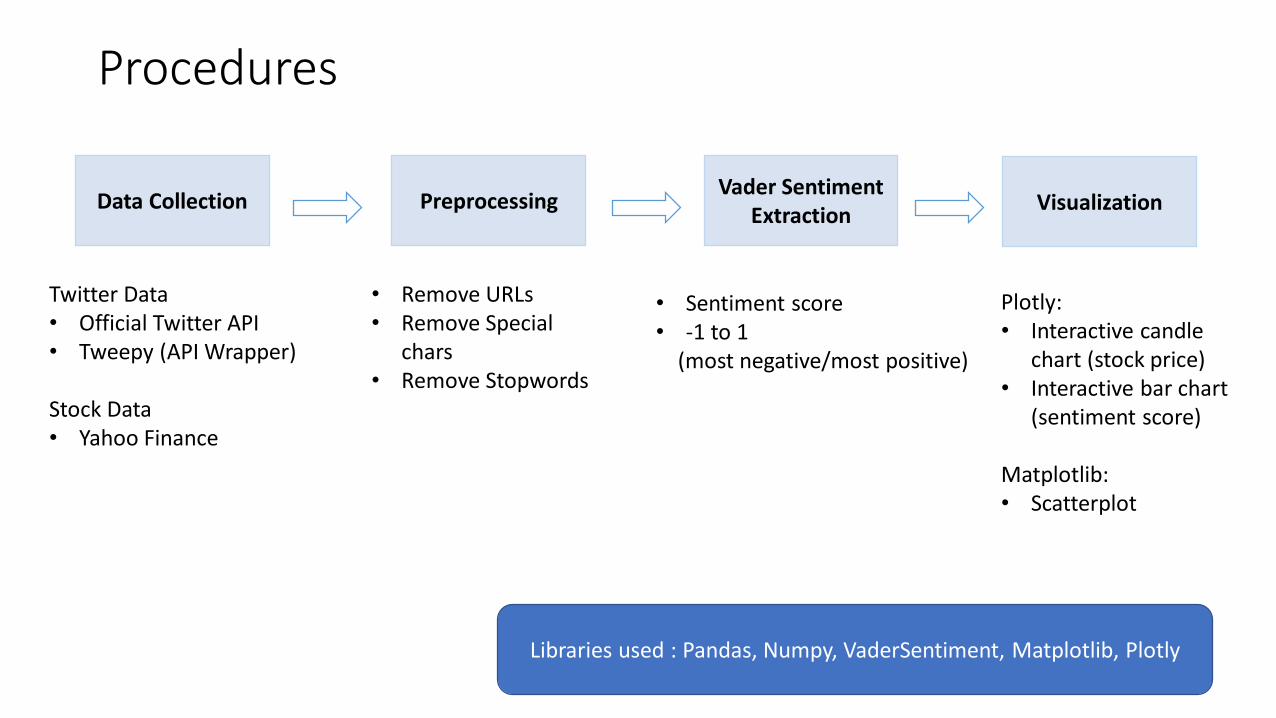
Correlation Analysis - LVMH Moët Hennessy (LVMUY)
v_pos v_neg price
v_pos 1.000000 0.773049 0.140242
v_neg 0.773049 1.000000 0.138225
price 0.140242 0.138225 1.000000
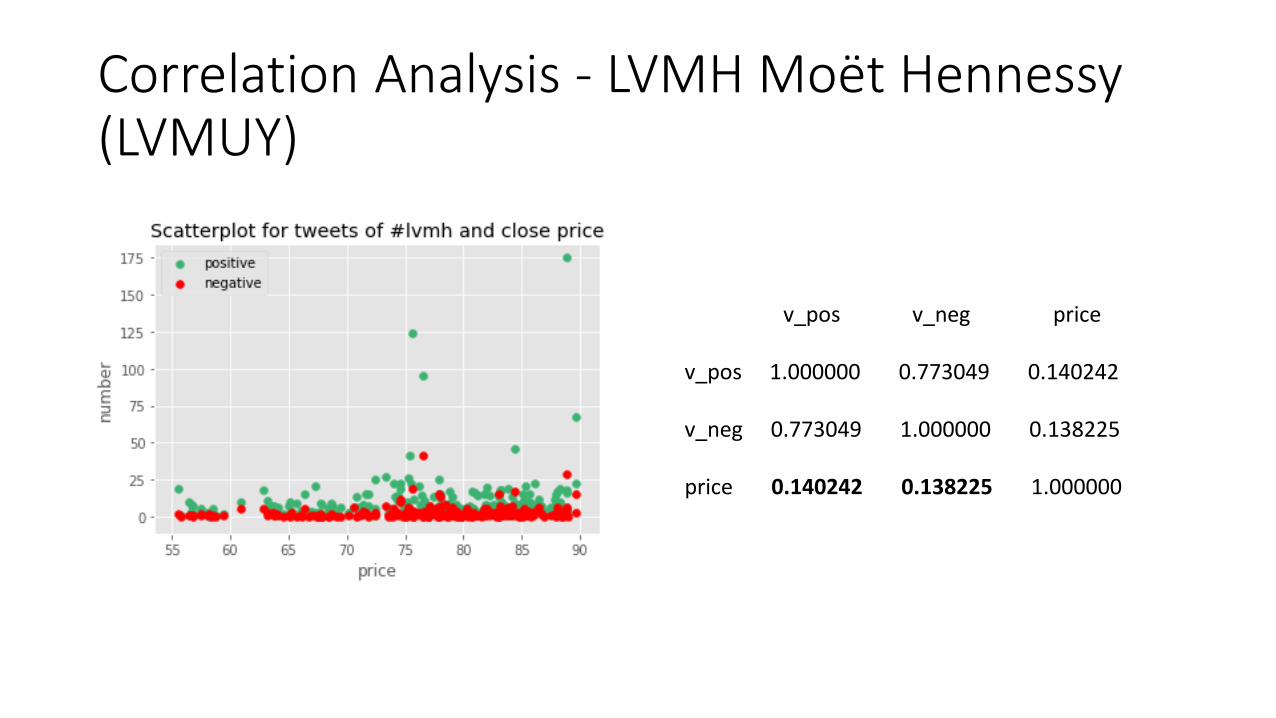
Correlation Analysis - Tiffany & Co. (TIF)
v_pos v_neg price
v_pos 1.000000 0.523049 0.353015
v_neg 0.523049 1.000000 -0.040759
price 0.353015 -0.040759 1.000000

Conclusion
• In this analysis, I have shown that a little bit positive correlation exists between rise/fall in stock prices of a company to the public opinions (especially positive tweets) expressed on twitter.
• But other than those ‘big news days’, it would be hard to tell the effectiveness of public sentiments (through tweets) on stock price fluctuation on those regular days.
• We can set a threshold and only use the “spikes” on positive/negative tweets for stock price prediction.

Future Work
• Use different combination of keywords and assign weights to them for reducing biases.
• Gather data from different sources such as other social medium (Instagram, Facebook, etc), and news headline on forums/new webs. Assign weights to them to reduce the biases.
• Use advanced Machine Learning based approach instead to extract sentiment score (LSTM & BERT) for a better accuracy.

THANK YOU! ANY QUESTION?