CS3700: Data Mining and Machine Learning - Purdue University

©Jan-20 Christopher W. Clifton 120
CS3700:
Data Mining and Machine Learning
Course Overview
Prof. Chris Clifton
14 January 2020
Goals
• Identify key elements of data mining and machine learning algorithms
• Understand how algorithmic elements interact to impact performance
• Understand how to choose algorithms for different analysis tasks
• Analyze data in both an exploratory and targeted manner
• Implement and apply basic algorithms for supervised and unsupervised learning
• Accurately evaluate the performance of algorithms, as well as formulate and test hypotheses
©Jan-20 Christopher W. Clifton 220
Topics
• Elements of data mining algorithms
• Statistical basics and background
• Data preparation and exploration
• Predictive modeling
• Methodology, evaluation
• Descriptive modeling
• Pattern mining and anomaly detection
Logistics
• Time and location: TTh 10:30-11:45am, MATH 175
• Instructor: Chris [email protected], LWSN 2116E, office hours: TBD
• Teaching assistants (office hours TBD in HAAS G050)– Reham M. Aburas
– Prerit Gupta
– Tao Li
– Jiayi Liu
– Jin Young Son
• Webpage: http://www.cs.purdue.edu/~clifton/cs37300/
• Email list: [email protected] (announcement only)
• Discussion: Piazza (signup through Blackboard)
• Prerequisites: CS18200, CS25100Concurrent prerequisite: STAT35000, STAT35500 or STAT51100b
©Jan-20 Christopher W. Clifton 320
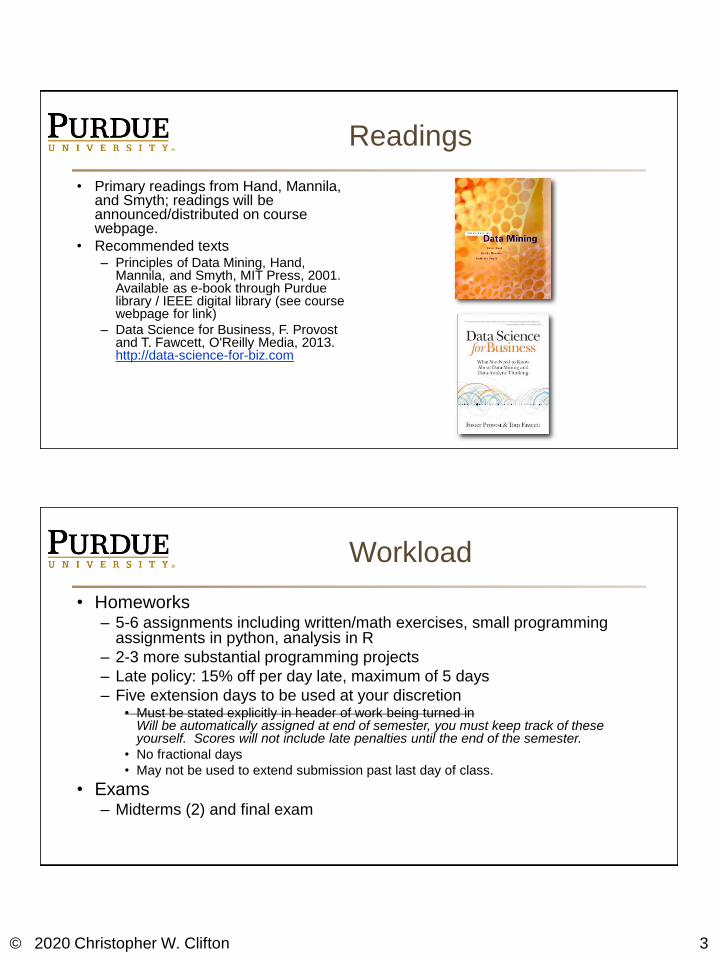
Readings
• Primary readings from Hand, Mannila, and Smyth; readings will be announced/distributed on course webpage.
• Recommended texts– Principles of Data Mining, Hand,
Mannila, and Smyth, MIT Press, 2001.Available as e-book through Purdue library / IEEE digital library (see course webpage for link)
– Data Science for Business, F. Provost and T. Fawcett, O'Reilly Media, 2013.http://data-science-for-biz.com
Workload
• Homeworks– 5-6 assignments including written/math exercises, small programming
assignments in python, analysis in R
– 2-3 more substantial programming projects
– Late policy: 15% off per day late, maximum of 5 days
– Five extension days to be used at your discretion• Must be stated explicitly in header of work being turned in
Will be automatically assigned at end of semester, you must keep track of these yourself. Scores will not include late penalties until the end of the semester.
• No fractional days
• May not be used to extend submission past last day of class.
• Exams– Midterms (2) and final exam
©Jan-20 Christopher W. Clifton 420
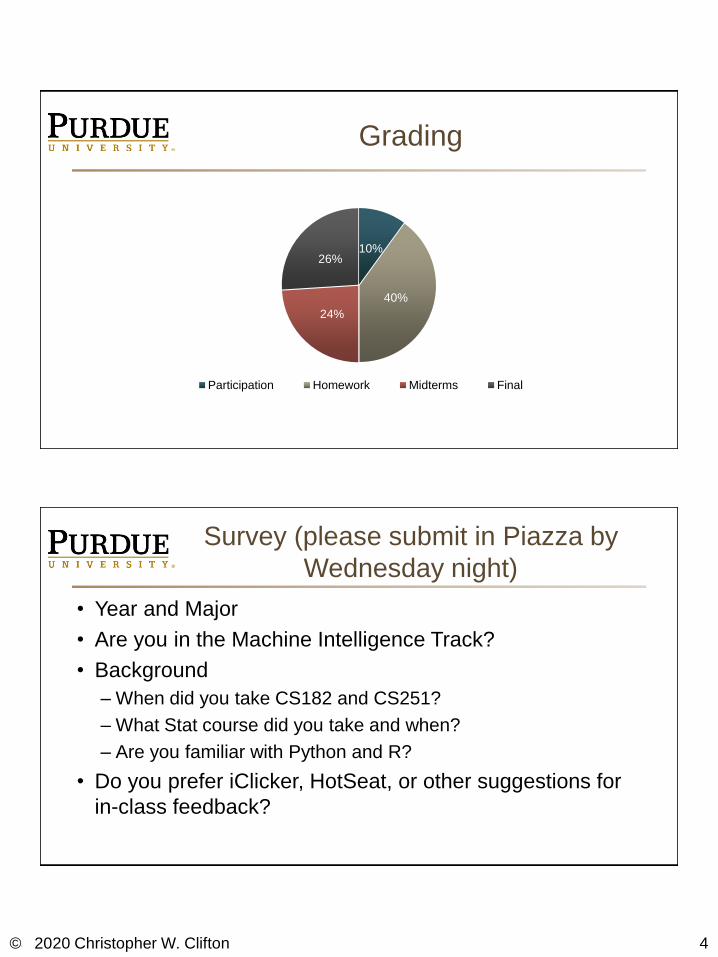
Grading
10%
40%
24%
26%
Participation Homework Midterms Final
Survey (please submit in Piazza by
Wednesday night)
• Year and Major
• Are you in the Machine Intelligence Track?
• Background
– When did you take CS182 and CS251?
– What Stat course did you take and when?
– Are you familiar with Python and R?
• Do you prefer iClicker, HotSeat, or other suggestions for
in-class feedback?
©Jan-20 Christopher W. Clifton 520
Course introduction
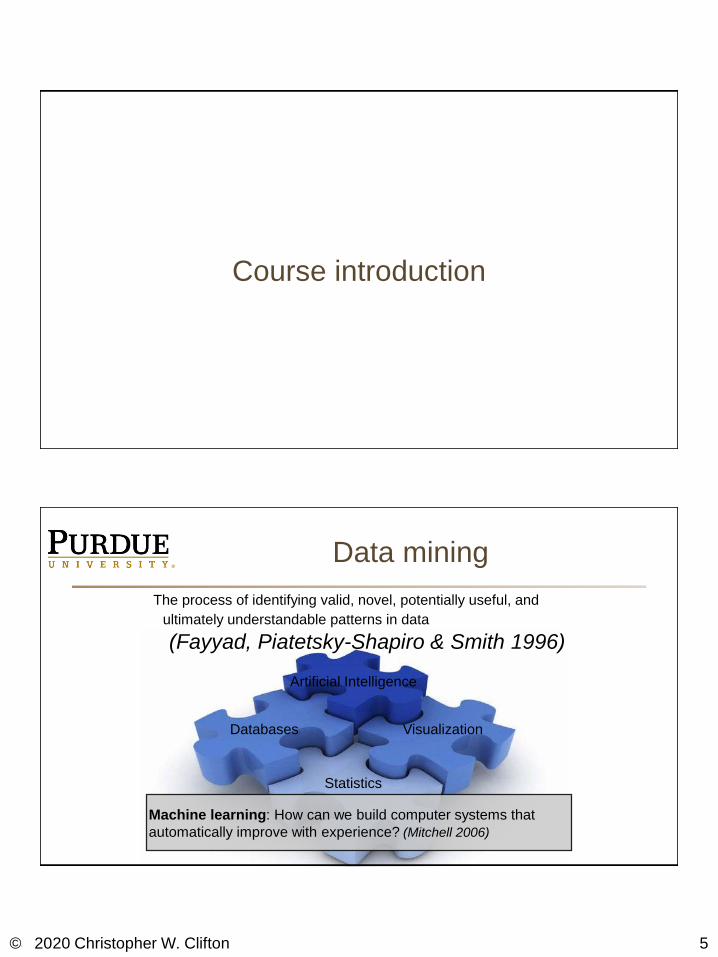
Data mining
The process of identifying valid, novel, potentially useful, and
ultimately understandable patterns in data
(Fayyad, Piatetsky-Shapiro & Smith 1996)
Databases
Artificial Intelligence
Visualization
Statistics
Machine learning: How can we build computer systems that
automatically improve with experience? (Mitchell 2006)
©Jan-20 Christopher W. Clifton 620
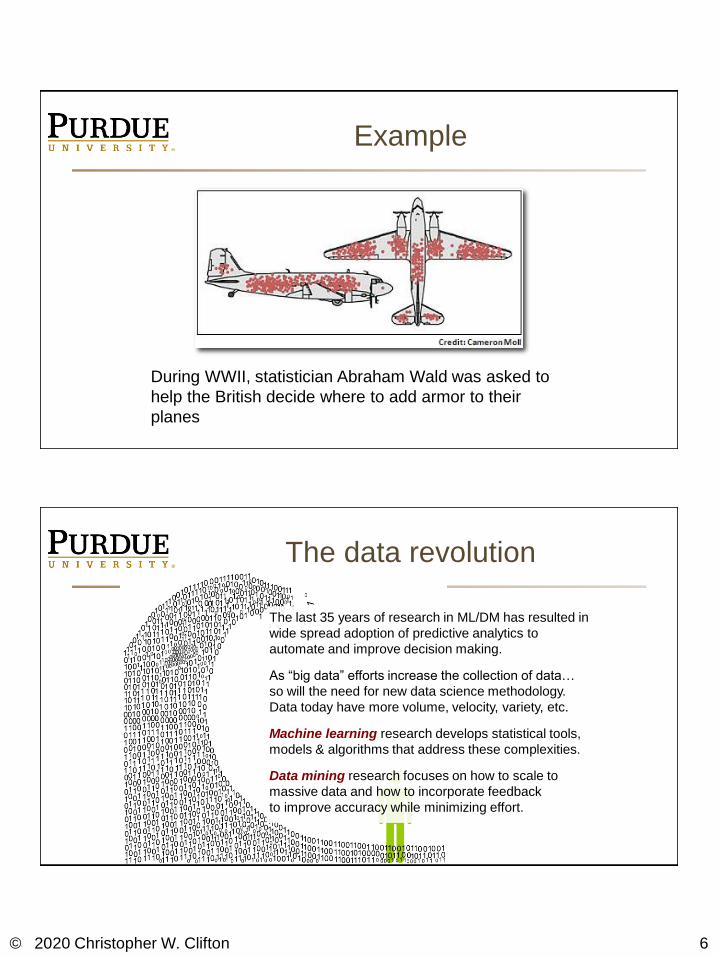
Example
During WWII, statistician Abraham Wald was asked to
help the British decide where to add armor to their
planes
The data revolution
The last 35 years of research in ML/DM has resulted in
wide spread adoption of predictive analytics to
automate and improve decision making.
As “big data” efforts increase the collection of data…
so will the need for new data science methodology.
Data today have more volume, velocity, variety, etc.
Machine learning research develops statistical tools,
models & algorithms that address these complexities.
Data mining research focuses on how to scale to
massive data and how to incorporate feedback
to improve accuracy while minimizing effort.
©Jan-20 Christopher W. Clifton 720
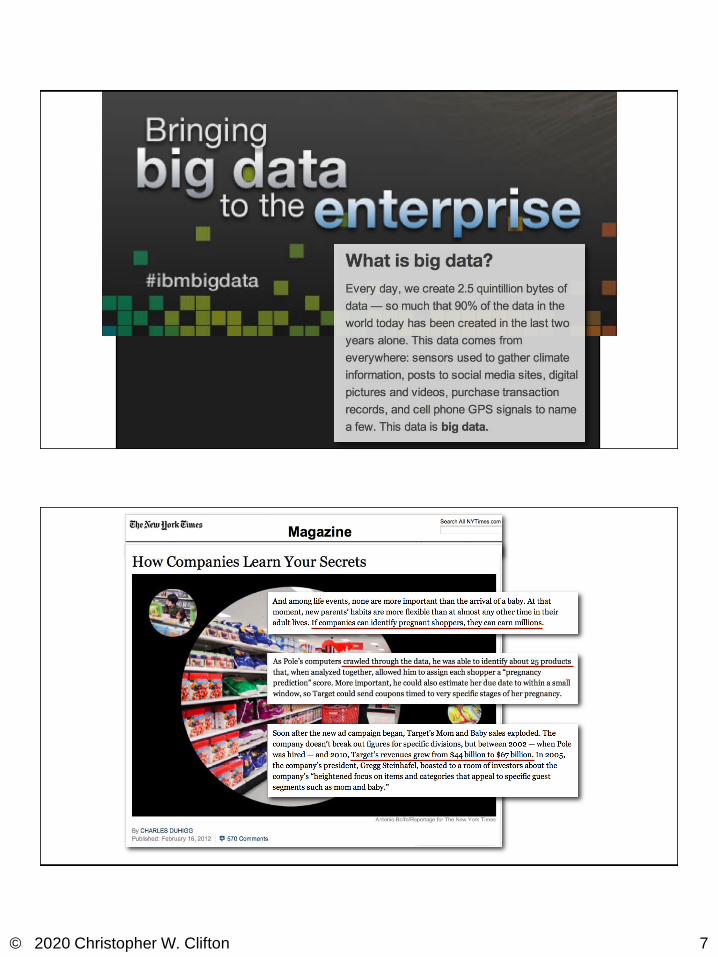
Big data
©Jan-20 Christopher W. Clifton 820
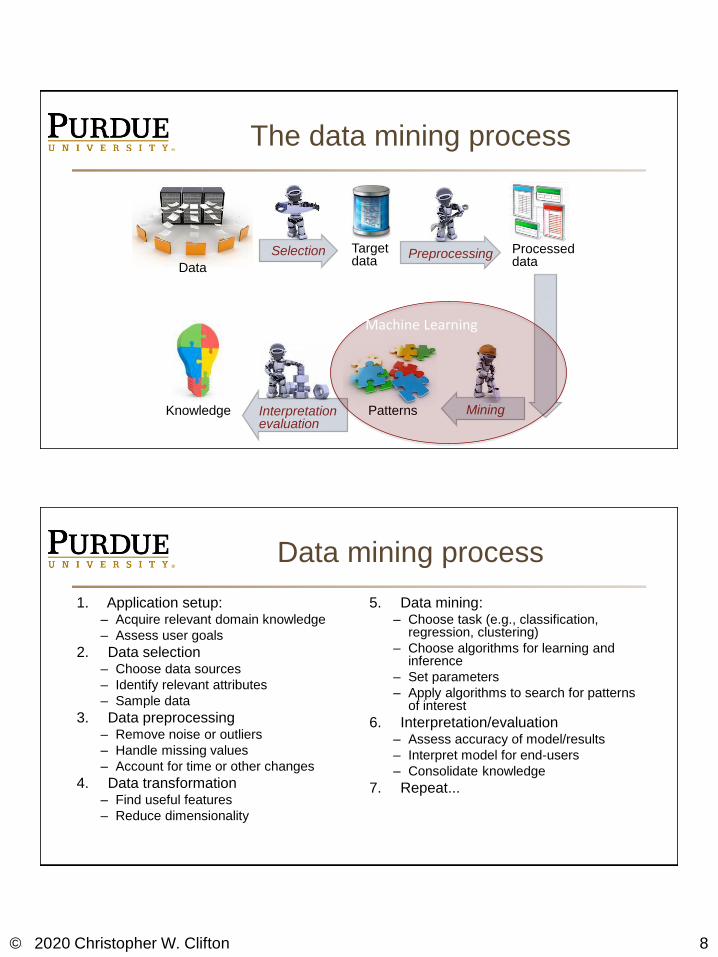
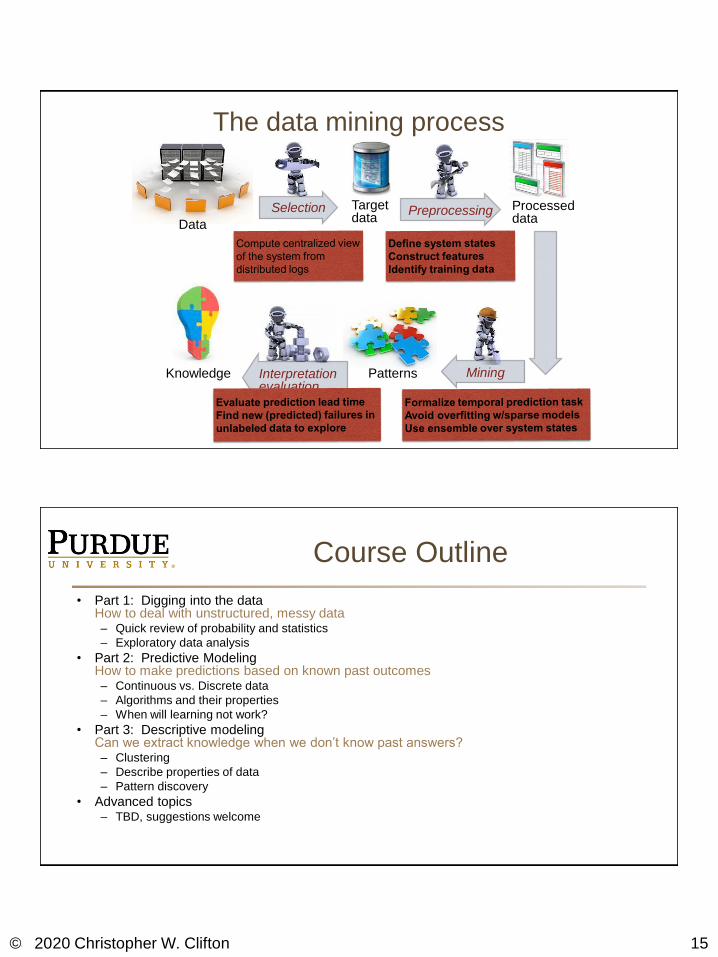
Processed data
Target data
Data
Selection Preprocessing
MiningPatternsInterpretationevaluation
Knowledge
Machine Learning
The data mining process
Data mining process
1. Application setup:– Acquire relevant domain knowledge
– Assess user goals
2. Data selection– Choose data sources
– Identify relevant attributes
– Sample data
3. Data preprocessing– Remove noise or outliers
– Handle missing values
– Account for time or other changes
4. Data transformation– Find useful features
– Reduce dimensionality
5. Data mining:– Choose task (e.g., classification,
regression, clustering)
– Choose algorithms for learning and inference
– Set parameters
– Apply algorithms to search for patterns of interest
6. Interpretation/evaluation– Assess accuracy of model/results
– Interpret model for end-users
– Consolidate knowledge
7. Repeat...
©Jan-20 Christopher W. Clifton 920
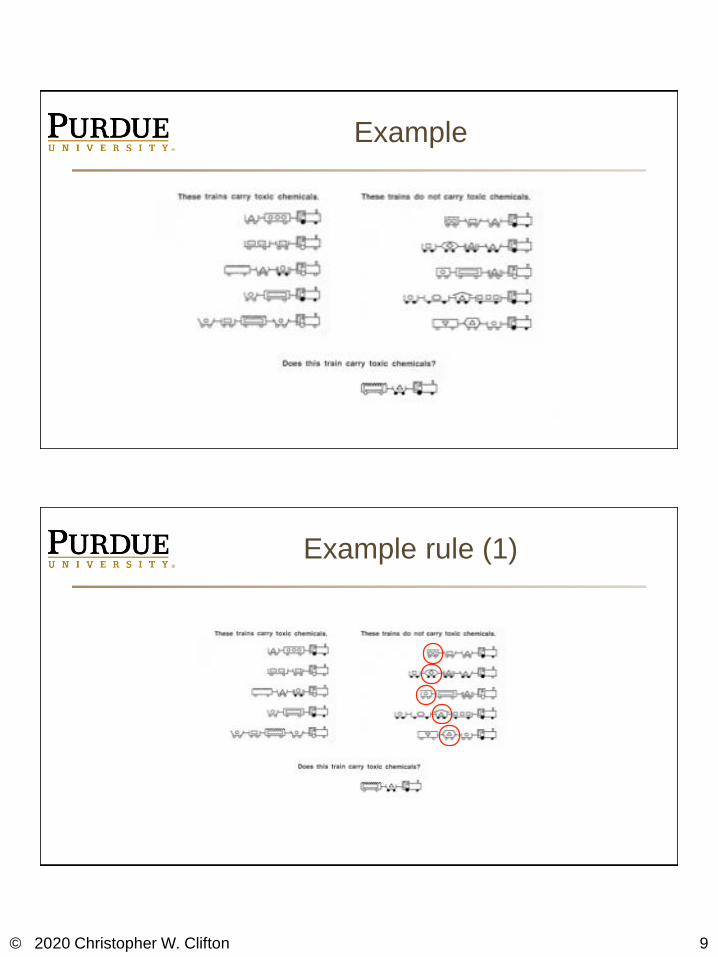
Example
Example rule (1)
©Jan-20 Christopher W. Clifton 1020
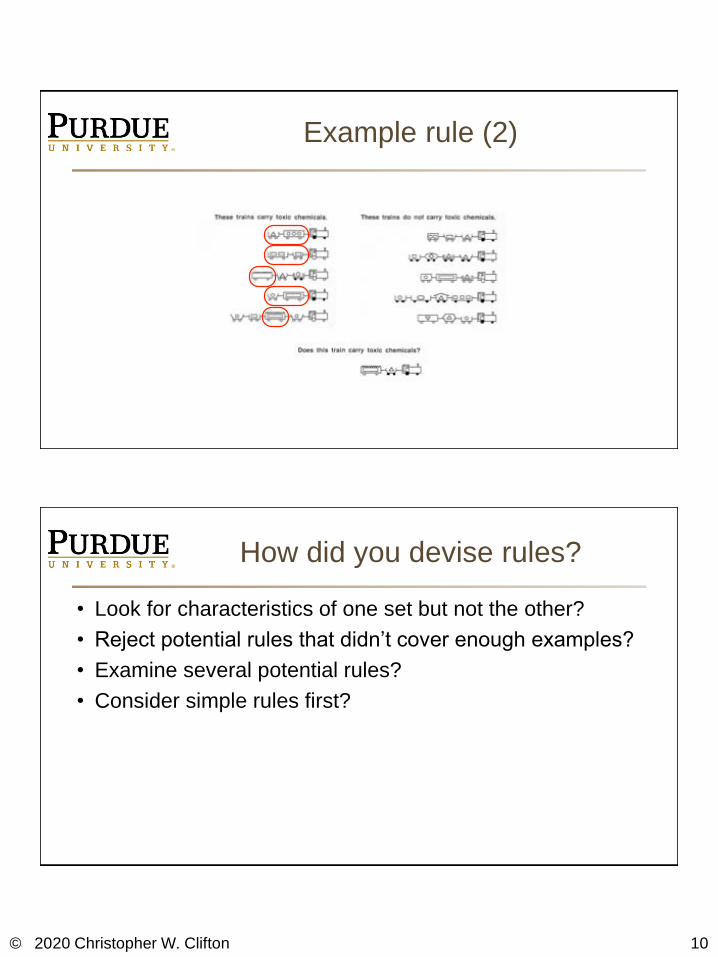
Example rule (2)
How did you devise rules?
• Look for characteristics of one set but not the other?
• Reject potential rules that didn’t cover enough examples?
• Examine several potential rules?
• Consider simple rules first?
©Jan-20 Christopher W. Clifton 1120
This is data mining...
• Data representation: Describe the data
• Task specification: Outline the goal(s)
• Knowledge representation: Describe the rules
• Learning technique:
– Search: Identify a rule
– Evaluation function: Estimate confidence
• Prediction technique: Apply the rule
• Data mining system: Do above in combination
Complexities
• Data size: vastly larger or changing rapidly
• Data representation: can affect ability to learn and
interpret models
• Knowledge representation: needs to capture more subtle
forms of probabilistic dependence
• Search space: vastly larger
• Evaluation functions: difficult to assess confidence in
model utility
©Jan-20 Christopher W. Clifton 1220
Example
Many complex natural, physical and social
systems can be represented as dynamic,
attributed graphs
©Jan-20 Christopher W. Clifton 1320
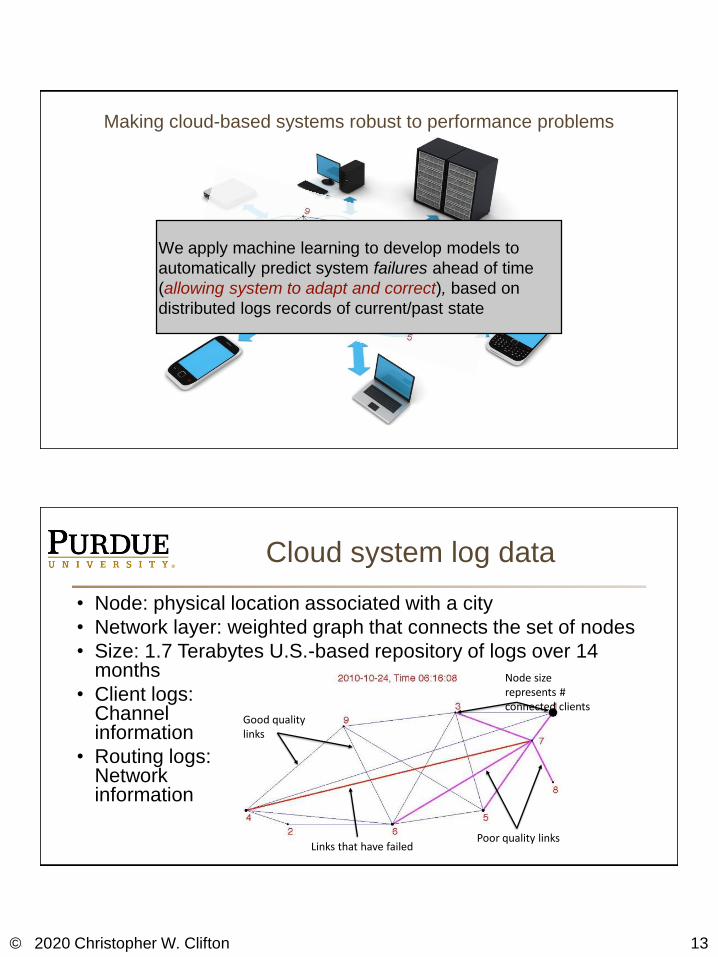
We apply machine learning to develop models to
automatically predict system failures ahead of time
(allowing system to adapt and correct), based on
distributed logs records of current/past state
Making cloud-based systems robust to performance problems
Cloud system log data
• Node: physical location associated with a city
• Network layer: weighted graph that connects the set of nodes
• Size: 1.7 Terabytes U.S.-based repository of logs over 14 months
• Client logs: Channel information
• Routing logs: Network information
Links that have failed
Good quality links
Node size represents # connected clients
Poor quality links
©Jan-20 Christopher W. Clifton 1420
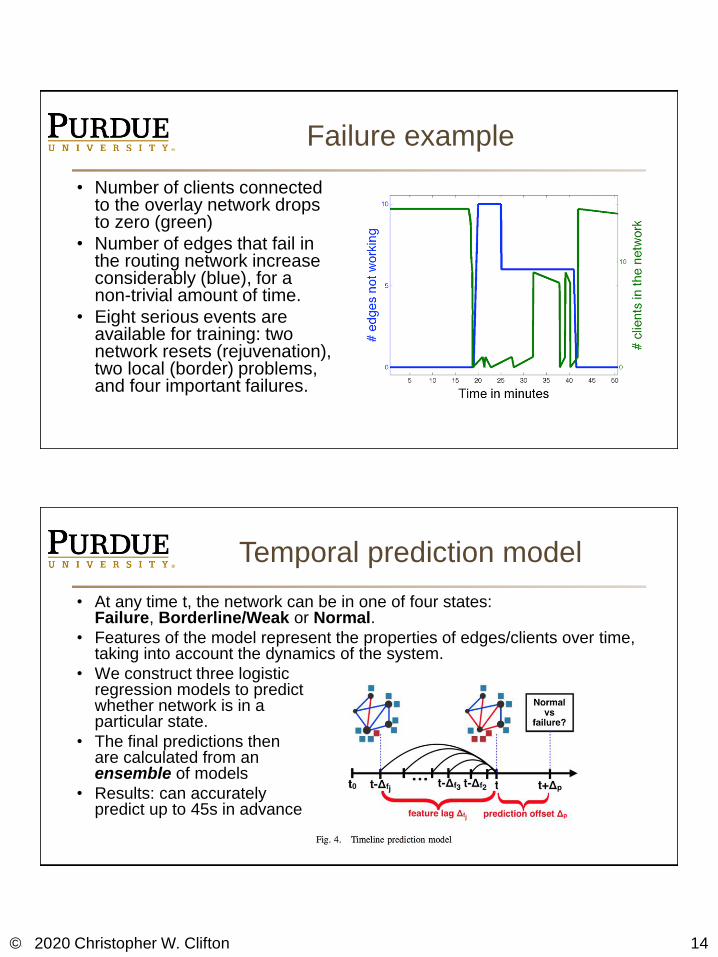
Failure example
• Number of clients connected to the overlay network drops to zero (green)
• Number of edges that fail in the routing network increase considerably (blue), for a non-trivial amount of time.
• Eight serious events are available for training: two network resets (rejuvenation), two local (border) problems, and four important failures.
Temporal prediction model
• At any time t, the network can be in one of four states: Failure, Borderline/Weak or Normal.
• Features of the model represent the properties of edges/clients over time, taking into account the dynamics of the system.
• We construct three logistic regression models to predict whether network is in a particular state.
• The final predictions then are calculated from an ensemble of models
• Results: can accurately predict up to 45s in advance
©Jan-20 Christopher W. Clifton 1520
Processed data
Target data
Data
Selection Preprocessing
MiningPatternsInterpretationevaluation
Knowledge
The data mining process
Course Outline
• Part 1: Digging into the dataHow to deal with unstructured, messy data– Quick review of probability and statistics
– Exploratory data analysis
• Part 2: Predictive ModelingHow to make predictions based on known past outcomes– Continuous vs. Discrete data
– Algorithms and their properties
– When will learning not work?
• Part 3: Descriptive modelingCan we extract knowledge when we don’t know past answers?– Clustering
– Describe properties of data
– Pattern discovery
• Advanced topics– TBD, suggestions welcome

©Jan-20 Christopher W. Clifton 1620
Take-home quiz
(Due Friday 5:30pm in Gradescope)Examples claims from recent news articles that could be supported or disproved by data analysis:
• The temperature of the planet is rising and the increase is due to human activities such as fossil fuel use and deforestation.
• Aspirin is effective in reducing cancer risk.
• Fathers who perform an equal share of household chores are more likely to have daughters who aspire to less traditionally feminine occupations.
Task: Identify two specific claims in news articles
1. Briefly state the claim
2. Describe the data that is (or could be) used to support the claim
3. Include a reference to the article
Length: One paragraph per claim.