CS302 Thursday, Topics: * More on Simulation and Priority ...
33
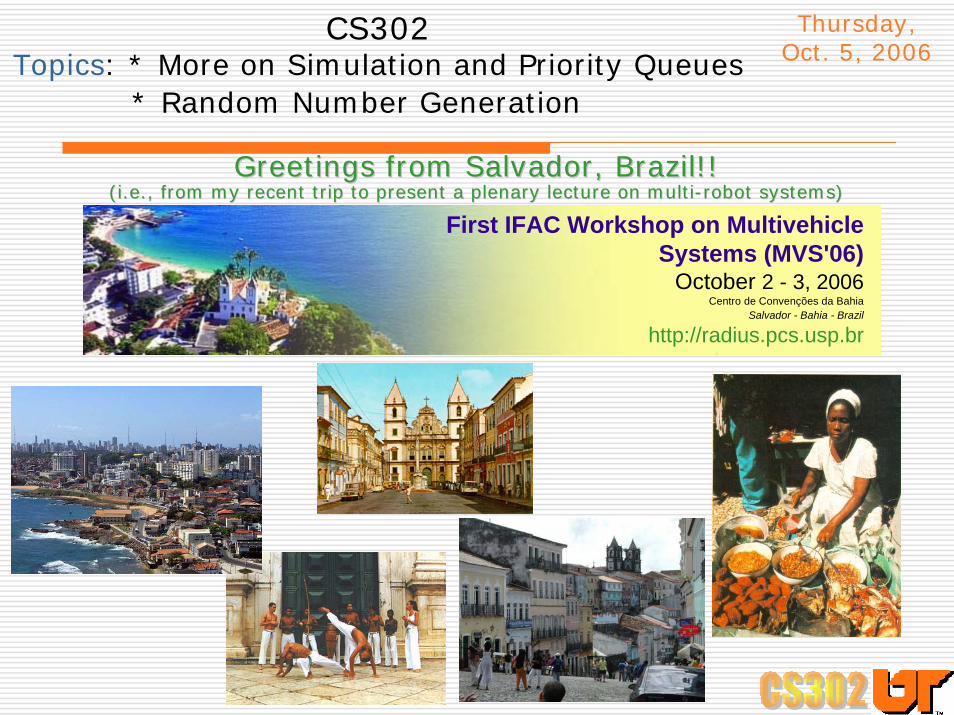
CS302 Topics: * More on Simulation and Priority Queues * Random Number Generation Thursday, Oct. 5, 2006 Greetings from Salvador, Brazil!! Greetings from Salvador, Brazil!! (i.e., from my recent trip to present a plenary lecture on multi (i.e., from my recent trip to present a plenary lecture on multi - - robot systems) robot systems) First IFAC Workshop on Multivehicle Systems (MVS'06) October 2 - 3, 2006 Centro de Convenções da Bahia Salvador - Bahia - Brazil http://radius.pcs.usp.br
Transcript of CS302 Thursday, Topics: * More on Simulation and Priority ...
CS302Topics: * More on Simulation and Priority Queues
* Random Number Generation
Thursday, Oct. 5, 2006
Greetings from Salvador, Brazil!! Greetings from Salvador, Brazil!! (i.e., from my recent trip to present a plenary lecture on multi(i.e., from my recent trip to present a plenary lecture on multi--robot systems)robot systems)
First IFAC Workshop on MultivehicleSystems (MVS'06)
October 2 - 3, 2006 Centro de Convenções da Bahia
Salvador - Bahia - Brazil
http://radius.pcs.usp.br

AnnouncementsLab 4 (Algorithm Analysis) due next Wed., Oct. 11
Lab 5 (Stock Reports) now available; due Wed., Oct. 25
Don’t procrastinate!!
“You may delay, but time will not. “You may delay, but time will not. ---- Benjamin FranklinBenjamin Franklin
Midterm:Tuesday, Oct. 17Open book, open notes, no electronic devices[Review during Tuesday’s class (Oct. 10)]

Recall: Discrete Event Simulations
Here, we’re interested in procesess and systemsthat change at discrete instants.
We’re interested in discrete events, which occur at an instant of time.
Because some systems are complex, we can’t model them and derive an analytical solution.
Thus, we can simulate them to answer interesting questions.

Recall: The Banking SimulationWe have a bank:
Customers arrive and wait in a line until one of ktellers is availableCustomer arrival governed by probability distributionService time governed by a probability distribution
We want to know:How long (on average) does a customer have to wait?How long (on average) is the line?What is the optimal number of tellers?
Enough so that customers don’t have to wait too longNot so many that we waste our money paying tellers

Recall: The general process for discrete event simulation loop“State”: all variables that describe a system
Initialize (State)Time ← 0Initialize (futureEventSet)While (futureEventSet not empty) do:
Event ← next event in futureEventSet (i.e., deleteMin)Time ← Time (Event)State ← function of old state and eventUpdate(futureEventSet)
Generic Simulation Program:Generic Simulation Program:

Event Generation
Tricky part of simulation:Choosing how to generate random events
Example: Say we want transaction times to average 10 minutes.
Here are 2 sequences that average 10:8 12 10 11 9 7 130 0 0 0 0 0 0 0 0 100
But, these have very different characteristics
we need to define the distribution we’re interested in

Event Generation (con’t.)
The distribution defines the characterization of the data in ways other than just the mean (average)
Here are some common distributions:
Gaussian/Normal ExponentialUniform

Distributions: UniformDistribution: Defines characterization of random numbers in more specific ways than just an average value
Uniform distribution:Mean m
For our purposes, we’ll have random numbers 0 ≤ r ≤ 2m, with every value between 0 and 2mequally likely
1( ) for
( )0 otherwise
b a a x bf x − ≤ ≤⎧⎪= ⎨
⎪⎩

Uniform Distribution in Banking Example
Service time: represented by uniform distribution

Uniform distributions in C++(pseudo-random number generators)
srand48(i): takes integer i and uses it as a seed to the random number generator (just do this once)
drand48(): returns a double uniformly distributed in range [0,1)
drand is a random number generator that follows a uniform distribution with a mean of 0.5
What do you do if you want a mean of m?
Multiply the result of drand48 by 2m.

Note on how pseudo-random number generators work
drand48() generates a sequence of 48-bit integers Xiaccording to following:
srand48(seedval) sets the high order 32-bits of Xi to the argument seedval
Low order 16-bits are set to arbitrary value 0x330E
Note: these numbers aren’t really random.
Sequence repeats
Numbers are predictable
1 ( ) mod , for 00x5DEECE66D0xB
n nX aX c m nac
+ = + ≥==

Example of generating random numbers from uniform distribution
/* generate 20 random numbers using a uniform distribution with a mean of “mean” */
srand48(737); // provide an initial "seed" to random generator for (i = 0; i < 20; i++) {
d = drand48()*mean*2; printf("%d \t %lf \n", i, d);
}

Distributions: Exponential
Exponential distribution Exponential distributionplotted on log axis
In our bank simulation, customer arrivals are modeled using an exponential distribution
Here, mean = 120
1 1mean 120
( ) xf x e λ
λ−
= =
=

How to generate non-uniform random numbers in C++?
Unfortunately, there is no C++ standard library implementation of a general random number generator (at least yet)
drand() just generates a uniform distribution
But there are lots of probability distributions:
Poisson
( , )!
kef kk
λλλ−
=2( )
221( , , )2
x
f x eµ
σµ σσ π
−−=
GaussianExponential
( ) xf x e λ−=

How do we implement an arbitrary probability distribution in C++?
General idea:Come up with a mapping from a uniform distributionto our arbitrary distributionBigger “chunks” of uniform distribution map to numbers that are more likely to occur in our arbitrary distribution
uniform distribution
arbitrary distribution

Use histogram to represent arbitrary distribution
Histogram: “bins” values along x axis
Rather than usethe continuous representation,we use a discrete representation (with the bins)

Bin width of histogram is important
Here’s an example using a distribution describing the eruption durations of the Old Faithful geyser in Yellowstone Nat’l. Park:
http://www.stat.sc.edu/~west/javahtml/Histogram.html
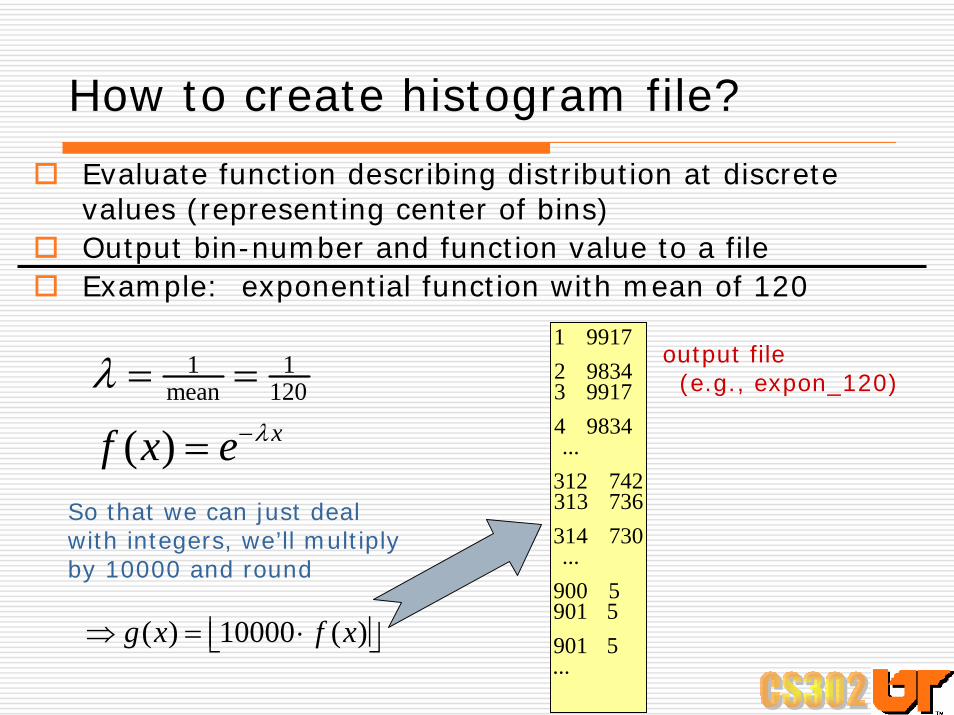
How to create histogram file?
Evaluate function describing distribution at discrete values (representing center of bins)Output bin-number and function value to a fileExample: exponential function with mean of 120
1 1mean 120
( ) xf x e λ
λ−
= =
=So that we can just deal with integers, we’ll multiply by 10000 and round
( ) 10000 ( )g x f x⇒ = ⋅⎢ ⎥⎣ ⎦
1 99172 98343 99174 9834...
312 742313 736314 730...
900 5901 5901 5...
output file(e.g., expon_120)

How do we generate random numbers matching arbitrary distribution?
General idea:Come up with a mapping from a uniform distributionto our arbitrary distributionBigger “chunks” of uniform distribution map to numbers that are more likely to occur in our arbitrary distribution
arbitrary distribution
uniform distribution

We’ll store this mapping in a red-black tree
Create red-black treetotal ← 0Do following for each line of histogram file
Get x and y valuetotal ← total + yinsert (key,value) = (total, x) into red-black tree
arbitrary distribution
uniform distribution

Example
Distribution that models our system (e.g., arrival time):
Resulting histogram file:
1 22 23 54 155 246 357 198 99 210 0
24
15
35
5
1 2 3 4 5 6 7 8 9 10

Example (con’t.)
Histogram file:
1 22 23 54 155 246 357 198 99 210 0
Create red-black Treetotal ← 0Do following for each line of histogram file
Get x and y valuetotal ← total + yinsert (key,value) = (total, x) into red-blackTree
2 14 29 324 448 583 6102 7111 8113 9113 10
Resulting (key, value)
pairs:x y

Example (con’t.)
(key, value) pairs: Resulting Red-black tree:
2 14 29 324 448 583 6102 7111 8113 9113 10
31
2
4
6
5 8
710
9

Example (con’t.)When you want a random # according to original distribution:
Generate random number from uniform distribution between 0 and total (i.e., uniform distribution with mean total/2)Find node in red-black Tree with next greater valueReturn value of this node (this will be your rand. # from orig. distribution)
31
2
4
6
5 8
710
9
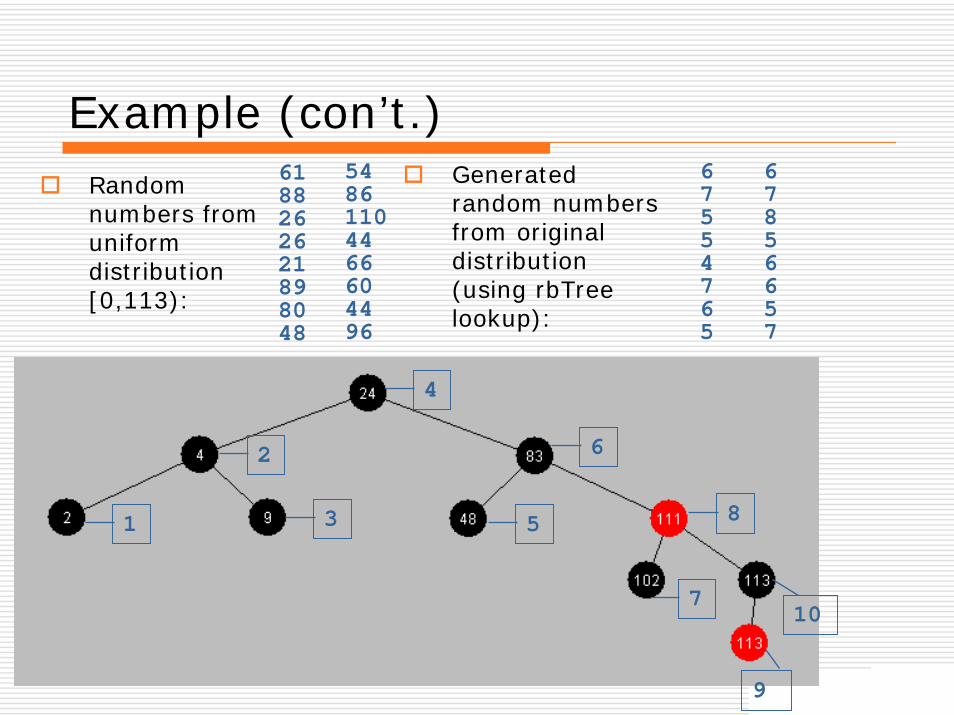
Example (con’t.)Random numbers from uniform distribution [0,113):
31
2
4
6
5 8
710
9
6188262621898048
Generated random numbers from original distribution (using rbTree lookup):
67554765
54861104466604496
67856657
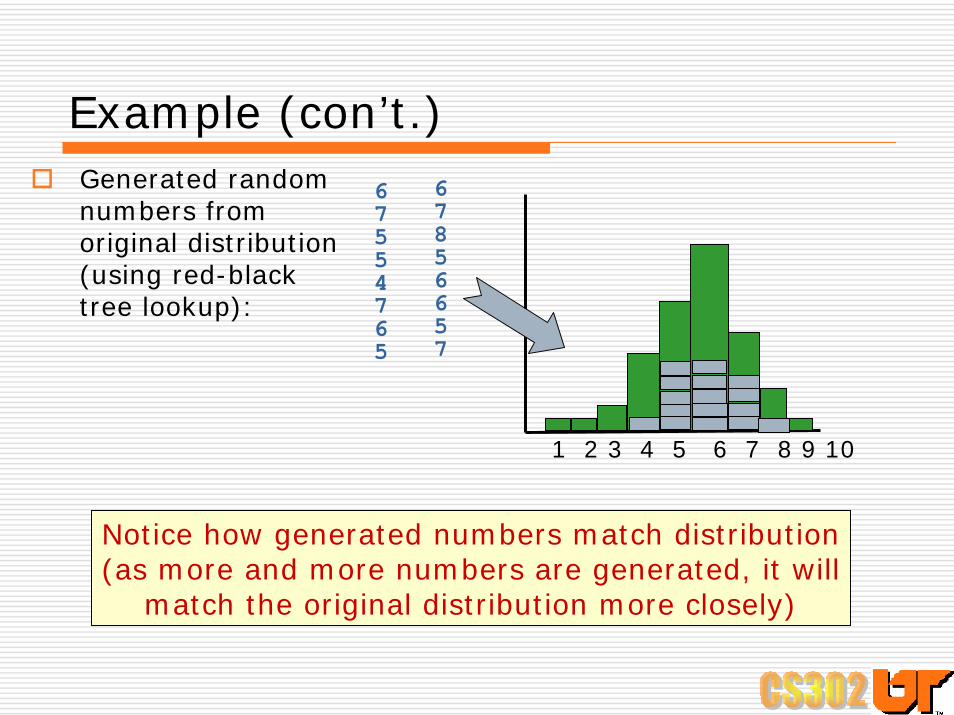
Example (con’t.)Generated random numbers from original distribution (using red-black tree lookup):
67856657
67554765
1 2 3 4 5 6 7 8 9 10
Notice how generated numbers match distribution(as more and more numbers are generated, it will
match the original distribution more closely)

Summarizing histogram random number generator…Step 1 – Generate histogram file:
Evaluate function describing distribution at discrete values (representing center of bins)Output bin-number and function value to a file
Step 2 – Create red-black tree:total ← 0Do following for each line of histogram file
Get x and y valuetotal ← total + yinsert (key,value) = (total, x) into red-black tree
Step 3 – Generate random numbers:Generate random number from uniform distribution between 0 and total (i.e., uniform distribution with mean total/2)Find node in red-black tree with next greater valueReturn value of this node (this will be your random number from the original distribution)

Another example
Here is original distribution:
What are values in histogram file?
1 22 403 154 25 26 87 408 89 210 2
x y
1 2 3 4 5 6 7 8 9 10
24
15
40
8

Another example, con’t.
2 142 257 359 461 569 6109 7117 8119 9121 10
What are resulting (key, value) pairs?
Histogram
file:1 22 403 154 25 26 87 408 89 210 2
What do we do next?
Put into a red-black tree

Another example, con’t.
1
2
3
4
5
6
7
8
9
10
What next?Generate random number from uniform distribution in what range?
[0,121)
Lookup next greater value in red-black treeValue = new random number

Another example, con’t.Random numbers from uniform distribution [0,121):
Generated random numbers from original distribution (using red-black Tree lookup):
1
2
3
4
5
6
7
8
9
10
4989106417241105118
37727279

Another example, con’t.
Compare to original distribution:
Generated random numbers from original distribution (using red-black Tree lookup):
37727279
1 2 3 4 5 6 7 8 9 10
Again, notice how generated numbers match distribution(as more and more numbers are generated, it will
match the original distribution more closely)

Keep in mind howthis histogram generator works
arbitrary distributionGeneral idea:Come up with a mapping from a uniform distributionto our arbitrary distributionBigger “chunks” of uniform distribution map to numbers that are more likely to occur in our arbitrary distribution
uniform distribution