CS 2401 IV/VII CSE TABLE OF CONTENTS - The Kavery ... 2401 IV/VII CSE 3 K UMA MAHESWARI 2015-2016...
91
CS 2401 IV/VII CSE 1 K UMA MAHESWARI 2015-2016 TABLE OF CONTENTS S.No DATE TOPIC PAGE No UNIT-I 2D PRIMITIVES 1 Output primitives 4 2 Line, Circle and Ellipse drawing algorithms 4 3 Attributes of output primitives 11 4 Two dimensional Geometric transformation 13 5 Two dimensional viewing 14 6 Line, Polygon, Curve and Text clipping algorithms 15 UNIT-II 3D CONCEPTS 7 Parallel and Perspective projections 18 8 Three dimensional object representation 20 9 Polygons, Curved lines, Splines, Quadric Surfaces 20 10 Visualization of data sets 24 11 3D transformations 25 12 Viewing -Visible surface identification. 29 UNIT-III GRAPHICS PROGRAMMING 13 Color Models 37 14 RGB, YIQ, CMY, HSV 38 15 Animations 41 16 General Computer Animation, Raster, Keyframe 42 17 Graphics programming using OPENGL 44 18 Basic graphics primitives 48 19 Drawing three dimensional objects 49 20 Drawing three dimensional scenes 49 UNIT IV-RENDERING 21 Introduction to Shading models 51 22 Flat and Smooth shading 54 23 Adding texture to faces 56 24 Adding shadows of objects 57 25 Building a camera in a program 59 26 Creating shaded objects 60 27 Rendering texture 60 28 Drawing Shadows. 60
Transcript of CS 2401 IV/VII CSE TABLE OF CONTENTS - The Kavery ... 2401 IV/VII CSE 3 K UMA MAHESWARI 2015-2016...

CS 2401 IV/VII CSE
1 K UMA MAHESWARI 2015-2016
TABLE OF CONTENTSS.No DATE TOPIC PAGE No
UNIT-I 2D PRIMITIVES1 Output primitives 4
2Line, Circle and Ellipse drawingalgorithms 4
3 Attributes of output primitives 11
4Two dimensional Geometrictransformation 13
5 Two dimensional viewing 14
6Line, Polygon, Curve and Text clippingalgorithms 15
UNIT-II 3D CONCEPTS7 Parallel and Perspective projections 188 Three dimensional object representation 20
9Polygons, Curved lines, Splines,Quadric Surfaces 20
10 Visualization of data sets 2411 3D transformations 2512 Viewing -Visible surface identification. 29
UNIT-III GRAPHICS PROGRAMMING13 Color Models 3714 RGB, YIQ, CMY, HSV 3815 Animations 41
16General Computer Animation, Raster,Keyframe 42
17 Graphics programming using OPENGL 4418 Basic graphics primitives 4819 Drawing three dimensional objects 4920 Drawing three dimensional scenes 49
UNIT IV-RENDERING21 Introduction to Shading models 5122 Flat and Smooth shading 5423 Adding texture to faces 5624 Adding shadows of objects 5725 Building a camera in a program 5926 Creating shaded objects 6027 Rendering texture 6028 Drawing Shadows. 60

CS 2401 IV/VII CSE
2 K UMA MAHESWARI 2015-2016
UNIT-V FRACTALS29 Fractals and Self similarity 6230 Peano curves 6331 Creating image by iterated functions 6332 Mandelbrot sets 6433 Julia Sets 66
34Random Fractals – Overview of RayTracing 67
35 Intersecting rays with other primitives 6836 Adding Surface texture 68
37Reflections and Transparency – Booleanoperations on Objects 70
APPENDICESA Glossary 73B Question bank 74C Previous year question papers 89
CS 2401 IV/VII CSE
3 K UMA MAHESWARI 2015-2016
SYLLABUS
CS2401 COMPUTER GRAPHICS L T P C 3 0 0 3
UNIT I2D PRIMITIVES 9output primitives – Line, Circle and Ellipse drawing algorithms - Attributes of outputprimitives –Two dimensional Geometric transformation - Two dimensional viewing –Line, Polygon, Curveand Text clipping algorithms
UNIT II3D CONCEPTS 9Parallel and Perspective projections - Three dimensional object representation –Polygons,Curved lines, Splines, Quadric Surfaces,- Visualization of data sets - 3Dtransformations –Viewing -Visible surface identification.
UNIT IIIGRAPHICS PROGRAMMING 9Color Models – RGB, YIQ, CMY, HSV – Animations – General Computer Animation,Raster,Keyframe - Graphics programming using OPENGL – Basic graphics primitives –Drawing threedimensional objects - Drawing three dimensional scenes
UNIT IVRENDERING 9Introduction to Shading models – Flat and Smooth shading – Adding texture to faces –Addingshadows of objects – Building a camera in a program – Creating shaded objects– Renderingtexture – Drawing Shadows.
UNIT VFRACTALS 9Fractals and Self similarity – Peano curves – Creating image by iterated functions –Mandelbrotsets – Julia Sets – Random Fractals – Overview of Ray Tracing –Intersecting rays with otherprimitives – Adding Surface texture – Reflections andTransparency – Boolean operations onObjectsTOTAL = 45
TEXT BOOKS:1. Donald Hearn, Pauline Baker, Computer Graphics – C Version, second edition,Pearson Education,2004.2. F.S. Hill, Computer Graphics using OPENGL, Second edition, PearsonEducation, 2003.REFERENCES:1. James D. Foley, Andries Van Dam, Steven K. Feiner, John F. Hughes, ComputerGraphics- Principles and practice, Second Edition in C, Pearson Education, 2007.UNIT I
CS 2401 IV/VII CSE
4 K UMA MAHESWARI 2015-2016
UNIT-I 2D PRIMITIVES
Output primitives – Line, Circle and Ellipse drawing algorithms - Attributes of output primitives –Two dimensional Geometric transformation - Two dimensional viewing – Line, Polygon, Curve andText clipping algorithms
PREREQUISITE DISCUSSION:
In this unit we discuss about drawing algorithms, clipping algorithms, How to find out a pixel pointsIn between line path and circle.
1.1.OUTPUT PRIMITIVES
CONCEPT:
A picture is completely specified by the set of intensities for the pixel positions in the display.Shapes and colors of the objects can be described internally with pixel arrays into the frame buffer or withthe set of the basic geometric – structure such as straight line segments and polygon color areas. Todescribe structure of basic object is referred to as output primitives. Each output primitive is specifiedwith input co-ordinate data and other information about the way that objects is to be displayed. Additionaloutput primitives that can be used to constant a picture include circles and other conic sections, quadricsurfaces, Spline curves and surfaces, polygon floor areas and character string.
1.2.POINTS AND LINES POINT PLOTTING
It is accomplished by converting a single coordinate position furnished by an application programinto appropriate operations for the output device.With a CRT monitor, for example, the electron beam is turned on to illuminate the screen phosphor at theselected location Line drawing is accomplished by calculating intermediate positions along the line pathbetween two specified end points positions.
An output device is then directed to fill in these positions between the end points Digital devicesdisplay a straight line segment by plotting discrete points between the two end points. Discrete coordinatepositions along the line path are calculated from the equation of the line.
For a raster video display, the line color (intensity) is then loaded into the frame buffer at thecorresponding pixel coordinates. Reading from the frame buffer, the video controller then plots “thescreen pixels”. Pixel positions are referenced according to scan-line number and column number (pixelposition across a scan line).
Scan lines are numbered consecutively from 0, starting at the bottom of the screen; and pixelcolumns are numbered from 0, left to right across each scan line Figure : Pixel Postions reference by scanline number and column number To load an intensity value into the frame buffer at a positioncorresponding to column x along scan line y, setpixel (x, y) To retrieve the current frame buffer intensitysetting for a specified location we use a low level function getpixel (x, y)
SIGNIFICANCE:
It is used to plot the points and lines within the coordinates.

CS 2401 IV/VII CSE
5 K UMA MAHESWARI 2015-2016
LINE DRAWING ALGORITHMS
CONCEPT:
Digital Differential Analyzer (DDA) Algorithm Bresenham‟s Line Algorithm Parallel Line Algorithm
The Cartesian slope-intercept equation for a straight line is y = m . x + b (1) Where m as slope of the lineand b as the y intercept
(x2,y2) as in figure we can determine the values for the slope m and y intercept b with the followingcalculations
Line Path between endpoint positions (x1,y1) and (x2,y2)m = Δy / Δx = y2-y1 / x2 - x1 (2)b= y1 - m . x1 (3) For any given x interval Δx along a line, we can compute the corresponding y intervalΔ y Δy= m Δx (4) We can obtain the x interval Δx corresponding to a specified Δy as Δ x = Δ y/m (5) Forlines with slope magnitudes |m| < 1, Δx can be set proportional to a small horizontal deflection voltageand the corresponding vertical deflection is then set proportional to Δy as calculated from Eq (4). Forlines whose slopes have magnitudes |m | >1 , Δy can be set proportional to a small vertical deflectionvoltage with the corresponding horizontal deflection voltage set proportional to Δx, calculated from Eq(5) For lines with m = 1, Δx = Δy and the horizontal and vertical deflections voltage are equal . Figure :Straight line Segment with five sampling positions along the x axis between x1 and x2
Digital Differential Analyzer (DDA) Algortihm
The digital differential analyzer (DDA) is a scan-conversion line algorithm based on calculationeither Δy or Δx The line at unit intervals in one coordinate and determine corresponding integer valuesnearest the line path for the other coordinate.
A line with positive slop, if the slope is less than or equal to 1, at unit x intervals (Δx=1) andcompute each successive y values as yk+1 = yk + m (6) Subscript k takes integer values starting from 1for the first point and increases by 1 until the final endpoint is reached. m can be any real numberbetween 0 and 1 and, the calculated y values must be rounded to the nearest integer For lines with apositive slope greater than 1 we reverse the roles of x and y, (Δy=1) and calculate each succeeding xvalue as xk+1 = xk + (1/m) (7) Equation (6) and (7) are based on the assumption that lines are to beprocessed from the left endpoint to the right endpoint.
If this processing is reversed, Δx=-1 that the starting endpoint is at the right yk+1 = yk – m (8) When theslope is greater than 1 and Δy = -1 with xk+1 = xk-1(1/m) (9) If the absolute value of the slope is lessthan 1 and the start endpoint is at the left, we set Δx = 1 and calculate y values with Eq. (6) When the startendpoint is at the right (for the same slope), we set Δx = -1 and obtain y positions from Eq. (8). Similarly,

CS 2401 IV/VII CSE
6 K UMA MAHESWARI 2015-2016
when the absolute value of a negative slope is greater than 1, we use Δy = -1 and Eq. (9) or we use Δy = 1and Eq. (7).
Algorithm
#define ROUND(a) ((int)(a+0.5))void lineDDA(int xa, int ya, int xb, int yb){ int dx = xb - xa, dy = yb - ya, steps, k; float xIncrement, yIncrement, x = xa, y = ya; if (abs (dx) > abs(dy) steps = abs (dx) ; else steps = abs dy); xIncrement = dx / (float) steps; yIncrement = dy / (float) stepssetpixel (ROUND(x), ROUND(y) ) : for (k=0; k<steps; k++){ x += xIncrement; y += yIncrement; setpixel (ROUND(x), ROUND(y)); } } Algorithm Description:
Step 1 : Accept Input as two endpoint pixel positionsStep 2: Horizontal and vertical differences between the endpoint positions are assigned to parameters dxand dy (Calculate dx=xb-xa and dy=yb-ya).Step 3: The difference with the greater magnitude determines the value of parameter steps.Step 4 : Starting with pixel position (xa, ya), determine the offset needed at each step to generate the nextpixel position along the line path.Step 5: loop the following process for steps number of timesa. Use a unit of increment or decrement in the x and y directionb. if xa is less than xb the values of increment in the x and y directions are 1 and mc. if xa is greater than xb then the decrements -1 and – m are used.
Advantages of DDA Algorithm
1. It is the simplest algorithm2. It is a is a faster method for calculating pixel positions
Disadvantages of DDA Algorithm
1. Floating point arithmetic in DDA algorithm is still time-consuming2. End point accuracy is poor
Bresenham’s Line Algorithm
An accurate and efficient raster line generating algorithm developed by Bresenham, that usesonly incremental integer calculations. In addition, Bresenham s line algorithm can be adapted to displaycircles and other curves. To illustrate Bresenham's approach, we- first consider the scan-conversionprocess for lines with positive slope less than 1. Pixel positions along a line path are then determined bysampling at unit x intervals. Starting from the left endpoint (x0,y0) of a given line, we step to eachsuccessive column (x position) and plot the pixel whose scan-line y value is closest to the line path.
To determine the pixel (xk,yk) is to be displayed, next to decide which pixel to plot the columnxk+1=xk+1.(xk+1,yk) and .(xk+1,yk+1).
At sampling position xk+1, we label vertical pixel separations from the mathematical line path asd1 and d2. The y coordinate on the mathematical line at pixel column position xk+1 is calculated as y=m(xk+1)+b (1) Then d1 = y-yk = m(xk+1)+b-yk d2 = (yk+1)-y = yk+1-m(xk+1)-b To determine

CS 2401 IV/VII CSE
7 K UMA MAHESWARI 2015-2016
which of the two pixel is closest to the line path, efficient test that is based on the difference between thetwo pixel separations d1- d2 = 2m(xk+1)-2yk+2b-1 (2) A decision parameter Pk for the kth step in theline algorithm can be obtained by rearranging equation (2).
By substituting m=Δy/Δx where Δx and Δy are the vertical and horizontal separations of theendpoint positions and defining the decision parameter as pk = Δx (d1- d2) = 2Δy xk.-2Δx. yk + c (3) Thesign of pk is the same as the sign of d1- d2,since Δx>0
Parameter C is constant and has the value 2Δy + Δx(2b-1) which is independent of the pixelposition and will be eliminated in the recursive calculations for Pk. If the pixel at yk is “closer” to the linepath than the pixel at yk+1 (d1< d2) than decision parameter Pk is negative.
In this case, plot the lower pixel, otherwise plot the upper pixel. Coordinate changes along theline occur in unit steps in either the x or y directions. To obtain the values of successive decisionparameters using incremental integer calculations.
At steps k+1, the decision parameter is evaluated from equation (3) as Pk+1 = 2Δy xk+1-2Δx.yk+1 +c Subtracting the equation (3) from the preceding equation Pk+1 - Pk = 2Δy (xk+1 - xk) -2Δx(yk+1 - yk) But xk+1= xk+1 so that Pk+1 = Pk+ 2Δy-2Δx(yk+1 - yk) (4) Where the term yk+1-yk iseither 0 or 1 depending on the sign of parameter Pk
This recursive calculation of decision parameter is performed at each integer x position, startingat the left coordinate endpoint of the line. The first parameter P0 is evaluated from equation at the startingpixel position (x0,y0) and with m evaluated as Δy/Δx P0 = 2Δy-Δx (5) Bresenham s line drawing for aline with a positive slope less than 1 in the following outline of the algorithm. The constants 2Δy and2Δy-2Δx are calculated once for each line to be scan converted. Bresenham’s line Drawing Algorithmfor |m| < 11. Input the two line endpoints and store the left end point in (x0,y0)2. load (x0,y0) into frame buffer, ie. Plot the first point.3. Calculate the constants Δx, Δy, 2Δy and obtain the starting value for the decision parameter as P0 =2Δy-Δx4. At each xk along the line, starting at k=0 perform the following test
If Pk < 0, the next point to plot is(xk+1,yk) and Pk+1 = Pk + 2Δy otherwise, the next point to plot is(xk+1,yk+1) and Pk+1 = Pk + 2Δy - 2Δx 5. Perform step4 Δx times.
Implementation of Bresenham Line drawing Algorithm
void lineBres (int xa,int ya,int xb, int yb){int dx = abs( xa – xb) , dy = abs (ya - yb); int p = 2 * dy – dx;int twoDy = 2 * dy, twoDyDx = 2 *(dy - dx);int x , y, xEnd; /* Determine which point to use as start, which as end * /if (xa > x b ) { x = xb; y = yb; xEnd = xa; }else { x = xa; y = ya; xEnd = xb; }setPixel(x,y); while(x<xEnd) { x++; if (p<0) p+=twoDy;{ y++; p+=twoDyDx;}
setPixel(x,y);}

CS 2401 IV/VII CSE
8 K UMA MAHESWARI 2015-2016
}
Advantages
Algorithm is FastUses only integer calculations
Disadvantages
It is meant only for basic line drawing.
Circle-Generating Algorithms
General function is available in a graphics library for displaying various kinds of curves,including circles and ellipses.
Properties of a circle
A circle is defined as a set of points that are all the given distance (xc,yc). This distancerelationship is expressed by the pythagorean theorem in Cartesian coordinates as(x – xc)2 + (y – yc) 2 = r2 (1) Use above equation to calculate the position of points on a circlecircumference by stepping along the x axis in unit steps from xc-r to xc+r and calculating thecorresponding y values at each position as y = yc +(- ) (r2 – (xc –x )2)1/2 (2)
This is not the best method for generating a circle for the following reason Considerable amountof computation Spacing between plotted pixels is not uniform To eliminate the unequal spacing is tocalculate points along the circle boundary using polar coordinates r and θ.
Expressing the circle equation in parametric polar from yields the pair of equations x = xc + rcosθ y = yc + rsin θ When a display is generated with these equations using a fixed angular step size, a circleis plotted with equally spaced points along the circumference.
To reduce calculations use a large angular separation between points along the circumference andconnect the points with straight line segments to approximate the circular path. Set the angular step size at1/r. This plots pixel positions that are approximately one unit apart. The shape of the circle is similar ineach quadrant.
To determine the curve positions in the first quadrant, to generate he circle section in the secondquadrant of the xy plane by nothing that the two circle sections are symmetric with respect to the y axisand circle section in the third and fourth quadrants can be obtained from sections in the first and secondquadrants by considering symmetry between octants.
\Circle sections in adjacent octants within one quadrant are symmetric with respect to the 450 line
dividing the two octants. Where a point at position (x, y) on a one-eight circle sector is mapped into theseven circle points in the other octants of the xy plane.
To generate all pixel positions around a circle by calculating only the points within the sectorfrom x=0 to y=0. the slope of the curve in this octant has an magnitude less than of equal to 1.0. at x=0,the circle slope is 0 and at x=y, the slope is -1.0.

CS 2401 IV/VII CSE
9 K UMA MAHESWARI 2015-2016
Midpoint circle Algorithm:
In the raster line algorithm at unit intervals and determine the closest pixel position to thespecified circle path at each step for a given radius r and screen center position (xc,yc) set up ouralgorithm to calculate pixel positions around a circle path centered at the coordinate position byadding xc to x and yc to y.
To apply the midpoint method we define a circle function as fcircle(x,y) = x2+y2-r2 Anypoint (x,y) on the boundary of the circle with radius r satisfies the equation fcircle (x,y)=0. If thepoint is in the interior of the circle, the circle function is negative. And if the point is outside thecircle the, circle function is positive fcircle (x,y) <0, if (x,y) is inside the circle boundary =0, if(x,y) is on the circle boundary >0, if (x,y) is outside the circle boundary
The tests in the above eqn are performed for the midposition sbteween pixels near thecircle path at each sampling step. The circle function is the decision parameter in the midpointalgorithm.
Ellipse-Generating Algorithms
An ellipse is an elongated circle. Therefore, elliptical curves can be generated by modifyingcircle-drawing procedures to take into account the different dimensions of an ellipse along the major andminor axes.
Properties of ellipses
An ellipse can be given in terms of the distances from any point on the ellipse to two fixedpositions called the foci of the ellipse. The sum of these two distances is the same values for all points onthe ellipse. If the distances to the two focus positions from any point p=(x,y) on the ellipse are labeled d1and d2, then the general equation of an ellipse can be stated as
d1+d2=constant

CS 2401 IV/VII CSE
10 K UMA MAHESWARI 2015-2016
Midpoint ellipse Algorithm
The midpoint ellipse method is applied throughout the first quadrant in two parts. The belowfigure show the division of the first quadrant according to the slope of an ellipse with rx<ry. In the xdirection where the slope of the curve has a magnitude less than 1 and unit steps in the y direction wherethe slope has a magnitude greater than 1. Region 1 and 2 can be processed in various ways1. Start at position (0,ry) and step clockwise along the elliptical path in the first quadrant shifting fromunit steps in x to unit steps in y when the slope becomes less than -12. Start at (rx,0) and select points in a counter clockwise order. 2.1 Shifting from unit steps in y to unitsteps in x when the slope becomes greater than -1.0 2.2 Using parallel processors calculate pixel positionsin the two regions simultaneously3. Start at (0,ry) step along the ellipse path in clockwise order throughout the first quadrant ellipsefunction (xc,yc)=(0,0)fellipse (x,y)=ry2x2+rx2y2 –rx2 ry2 which has the following properties: fellipse (x,y) <0, if (x,y) is insidethe ellipse boundary =0, if(x,y) is on ellipse boundary >0, if(x,y) is outside the ellipse boundary Thus, theellipse functionfellipse (x,y) serves as the decision parameter in the midpoint algorithm. Starting at (0,ry): Unit steps inthe x direction until to reach the boundary between region 1 and region 2. Then switch to unit steps in they direction over the remainder of the curve in the first quadrant. At each step to test the value of the slopeof the curve. The ellipse slope is calculated dy/dx= -(2ry2x/2rx2y) At the boundary between region 1 andregion 2 dy/dx = -1.0 and 2ry2x=2rx2y to more out of region 1 whenever 2ry2x>=2rx2y
To determine the next position along the ellipse path by evaluating the decision parameter at thismid point P1k = fellipse (xk+1,yk-1/2) = ry2 (xk+1)2 + rx2 (yk-1/2)2 – rx2 ry2 if P1k <0,The midpoint is inside the ellipse and the pixel on scan line yk is closer to the ellipse boundary.Otherwise the midpoint is outside or on the ellipse boundary and select the pixel on scan line yk-1 At the

CS 2401 IV/VII CSE
11 K UMA MAHESWARI 2015-2016
next sampling position (xk+1+1=xk+2) the decision parameter for region 1 is calculated as p1k+1 =fellipse(xk+1 +1,yk+1 -½ ) =ry2[(xk +1) + 1]2 + rx2 (yk+1 -½)2 - rx2 ry2
Mid point Ellipse Algorithm1. Input rx,ry and ellipse center (xc,yc) and obtain the first point on an ellipse centered on the origin as
(x0,y0) = (0,ry)2. Calculate the initial value of the decision parameter in region 1 as
P10=ry2-rx2ry +(1/4)rx23. At each xk position in region1 starting at k=0 perform the following test. If P1k<0, the next point alongthe ellipse centered on (0,0) is (xk+1, yk) and
p1k+1 = p1k +2 ry2xk +1 + ry2 Otherwise the next point along the ellipse is (xk+1, yk-1) and p1k+1 =p1k +2 ry2xk +1 - 2rx2 yk+1 + ry2 with 2 ry2xk +1 = 2 ry2xk + 2ry2 2 rx2yk +1 = 2 rx2yk + 2rx2 Andcontinue until 2ry2 x>=2rx2 y4. Calculate the initial value of the decision parameter in region 2 using the last point (x0,y0) is the lastposition calculated in region 1.
p20 = ry2(x0+1/2)2+rx2(yo-1)2 – rx2ry25. At each position yk in region 2, starting at k=0 perform the following test, If p2k>0 the next pointalong the ellipse centered on (0,0) is (xk,yk-1) and
p2k+1 = p2k – 2rx2yk+1+rx2 Otherwise the next point along the ellipse is (xk+1,yk-1) andp2k+1 = p2k + 2ry2xk+1 – 2rxx2yk+1 + rx2 Using the same incremental calculations for x any y as inregion 1.6. Determine symmetry points in the other three quadrants.7. Move each calculate pixel position (x,y) onto the elliptical path centered on (xc,yc) and plot thecoordinate valuesx=x+xc, y=y+yc8. Repeat the steps for region1 unit 2ry2x>=2rx2y
SIGNIFICANCE:
Draw a circle ,lines and ellipse using Differant types of algorithms.
1.3.ATTRIBUTES OF OUTPUT PRIMITIVES
CONCEPT:
Any parameter that affects the way a primitive is to be displayed is referred to as an attribute parameter.1. Line Attributes2. Curve Attributes3. Color and Grayscale Levels4. Area Fill Attributes5. Character Attributes6. Bundled Attributes

CS 2401 IV/VII CSE
12 K UMA MAHESWARI 2015-2016
Line Attributes
Basic attributes of a straight line segment are its type, its width, and its color. In some graphicspackages, lines can also be displayed using selected pen or brush optionsLine TypeLine WidthPen and Brush OptionsLine Color
Line typePossible selection of line type attribute includes solid lines, dashed lines and dotted lines. To set
line type attributes in a PHIGS application program, a user invokes the function
setLinetype (lt)
Line width
Implementation of line width option depends on the capabilities of the output device to set theline width attributes.setLinewidthScaleFactor(lw)
Line CapWe can adjust the shape of the line ends to give them a better appearance by adding line caps.
There are three types of line cap. They are
Butt capRound capProjecting square cap
Pen and Brush Options
With some packages, lines can be displayed with pen or brush selections. Options in this categoryinclude shape, size, and pattern. Some possible pen or brush shapessetPolylineColourIndex (lc)
Curve attributes
Parameters for curve attribute are same as those for line segments. Curves displayed with varyingcolors, widths, dot –dash patterns and available pen or brush options
Area fill Attributes
Options for filling a defined region include a choice between a solid color or a pattern fill andchoices for particular colors and patterns Fill Styles Areas are displayed with three basic fill styles:hollow with a color border, filled with a solid color, or filled with a specified pattern or design. A basicfill style is selected in a PHIGS program with the function
Character Attributes

CS 2401 IV/VII CSE
13 K UMA MAHESWARI 2015-2016
The appearance of displayed character is controlled by attributes such as font, size, color andorientation. Attributes can be set both for entire character strings (text) and for individual charactersdefined as marker symbols
Text Attributes
The choice of font or type face is set of characters with a particular design style as courier,Helvetica, times roman, and various symbol groups.
SIGNIFICANCE:
Different types of functions used to implement line circle.
1.4.TWO DIMENSIONAL GEOMETRIC TRANSFORMATIONS
CONCEPTS:
Changes in orientations, size and shape are accomplished with geometric transformations thatalter the coordinate description of objects. Basic transformationTranslationT(tx, ty)Translation distances ScaleS(sx,sy)Scale factors RotationR()Rotation angle
Translation
A translation is applied to an object by representing it along a straight line path from onecoordinate location to another adding translation distances, tx, ty to original coordinate position (x,y) tomove the point to a new position (x ,y ) to x’ = x + tx, y’ = y + ty The translation distance point (tx,ty)is called translation vector or shift vector. Translation equation can be expressed as single matrix equationby using column vectors to represent the coordinate.

CS 2401 IV/VII CSE
14 K UMA MAHESWARI 2015-2016
Rotations:
A two-dimensional rotation is applied to an object by repositioning it along a circular path on xyplane. To generate a rotation, specify a rotation angle θ and the position (xr,yr) of the rotation point (pivotpoint) about which the object is to be rotated.
Scaling :
A scaling transformation alters the size of an object. This operation can be carried out forpolygons by multiplying the coordinate values (x,y) to each vertex by scaling factor Sx & Sy to producethe transformed coordinates (x ,y ).
SIGNIFICANCE:
This concept is used to implement a object transformation,resize and rotating in different angle.
1.5.TWO DIMENSIONAL VIEWING
CONCEPT:
The viewing pipeline
A world coordinate area selected for display is called a window. An area on a display device towhich a window is mapped is called a view port. The window defines what is to be viewed the view portdefines where it is to be displayed. The mapping of a part of a world coordinate scene to devicecoordinate is referred to as viewing transformation. The two dimensional viewing transformation isreferred to as window to view port transformation of windowing transformation.

CS 2401 IV/VII CSE
15 K UMA MAHESWARI 2015-2016
The viewing transformation in several steps, as indicated in Fig. First, we construct the scene inworld coordinates using the output primitives. Next to obtain a particular orientation for the window, wecan set up a two-dimensional viewing-coordinate system in the world coordinate plane, and define awindow in the viewing-coordinate system.
The viewing- coordinate reference frame is used to provide a method for setting up arbitraryorientations for rectangular windows. Once the viewing reference frame is established, we can transformdescriptions in world coordinates to viewing coordinates.
We then define a viewport in normalized coordinates (in the range from 0 to 1) and map theviewing-coordinate description of the scene to normalized coordinates. At the final step all parts of thepicture that lie outside the viewport are clipped, and the contents of the viewport are transferred to devicecoordinates.
SIGNIFICANCE:
Changing the position of the viewport, we can view objects at different positions on the displayarea of an output device.
1.6.CLIPPING OPERATION
CONCEPT
Point clippingLine clipping (Straight-line segment)Area clippingCurve clippingText clipping
Point Clipping
Clip window is a rectangle in standard position. A point P=(x,y) for display, if followinginequalities are satisfied: xwmin <= x <= xwmaxywmin <= y <= ywmax
Line Clipping
A line clipping procedure involves several parts. First we test a given line segment whether it liescompletely inside the clipping window. If it does not we try to determine whether it lies completelyoutside the window . Finally if we can not identify a line as completely inside or completely outside, weperform intersection calculations with one or more clipping boundaries.

CS 2401 IV/VII CSE
16 K UMA MAHESWARI 2015-2016
All other lines cross one or more clipping boundaries. For a line segment with end points (x1,y1)and (x2,y2) one or both end points outside clipping rectangle, the parametric representation could be usedto determine values of u for an intersection with the clipping boundary coordinates.
If the value of u for an intersection with a rectangle boundary edge is outside the range of 0 to 1,the line does not enter the interior of the window at that boundary. If the value of u is within the rangefrom 0 to 1, the line segment does indeed cross into the clipping area. This method can be applied to eachclipping boundary edge in to determined whether any part of line segment is to displayed.
Cohen-Sutherland Line Clipping
This is one of the oldest and most popular line-clipping procedures. The method speeds up theprocessing of line segments by performing initial tests that reduce the number of intersections that mustbe calculated. Every line endpoint in a picture is assigned a four digit binary code called a region codethat identifies the location of the point relative to the boundaries of the clipping rectangle.
POLYGON CLIPPING
To clip polygons, we need to modify the line-clipping procedures. A polygon boundary processedwith a line clipper may be displayed as a series of unconnected line segments (Fig.), depending on theorientation of the polygon to the clipping window.

CS 2401 IV/VII CSE
17 K UMA MAHESWARI 2015-2016
Sutherland – Hodgeman polygon clipping:A polygon can be clipped by processing the polygon boundary as a whole against each window
edge. This could be accomplished by processing all polygon vertices against each clip rectangleboundary. There are four possible cases when processing vertices in sequence around the perimeter of apolygon. As each point of adjacent polygon vertices is passed to a window boundary clipper, make thefollowing tests:1. If the first vertex is outside the window boundary and second vertex is inside, both the intersectionpoint of the polygon edge with window boundary and second vertex are added to output vertex list.2. If both input vertices are inside the window boundary, only the second vertex is added to the outputvertex list.3. If first vertex is inside the window boundary and second vertex is outside only the edge intersectionwith window boundary is added to output vertex list.4. If both input vertices are outside the window boundary nothing is added to the output list.
Curve Clipping
Curve-clipping procedures will involve nonlinear equations, and this requires more processing than forobjects with linear boundaries. The bounding rectangle for a circle or other curved object can be used firstto test for overlap with a rectangular clip window
TEXT CLIPPING
An alternative to rejecting an entire character string that overlaps a window boundary is to use the all-or-none character-clipping strategy. Here we discard only those characters that are not completely insidethe window .In this case, the boundary limits of individual characters are compared to the window. Anycharacter that either overlaps or is outside a window boundary is clipped.
Exterior clipping:
Procedure for clipping a picture to the interior of a region by eliminating everything outside theclipping region. By these procedures the inside region of the picture is saved. To clip a picture to the

CS 2401 IV/VII CSE
18 K UMA MAHESWARI 2015-2016
exterior of a specified region. The picture parts to be saved are those that are outside the region. This iscalled as exterior clipping.
SIGNIFICANCE:
A line clipping procedure involves several parts. First we test a given line segment whether it liescompletely inside the clipping window.
APPLICATIONS:
1.Implement Line,circle,ellipse drawing algorithm.2.Implement clipping algorithms.3.Implementation of Transformations
CS 2401 IV/VII CSE
19 K UMA MAHESWARI 2015-2016
UNIT - II THREE-DIMENSIONAL CONCEPTS
Parallel and Perspective projections-Three-Dimensional Object Representations – Polygons,Curved lines,Splines, Quadric Surfaces- Visualization of data sets- Three- Transformations –Three-Dimensional Viewing –Visible surface identification.
PREREQUISITE DISCUSSION:
This we discuss about three dimensional concepts and object design.
2.1.PARALLEL AND PERSPECTIVE PROJECTIONS
CONCEPT:
Parallel Projection:
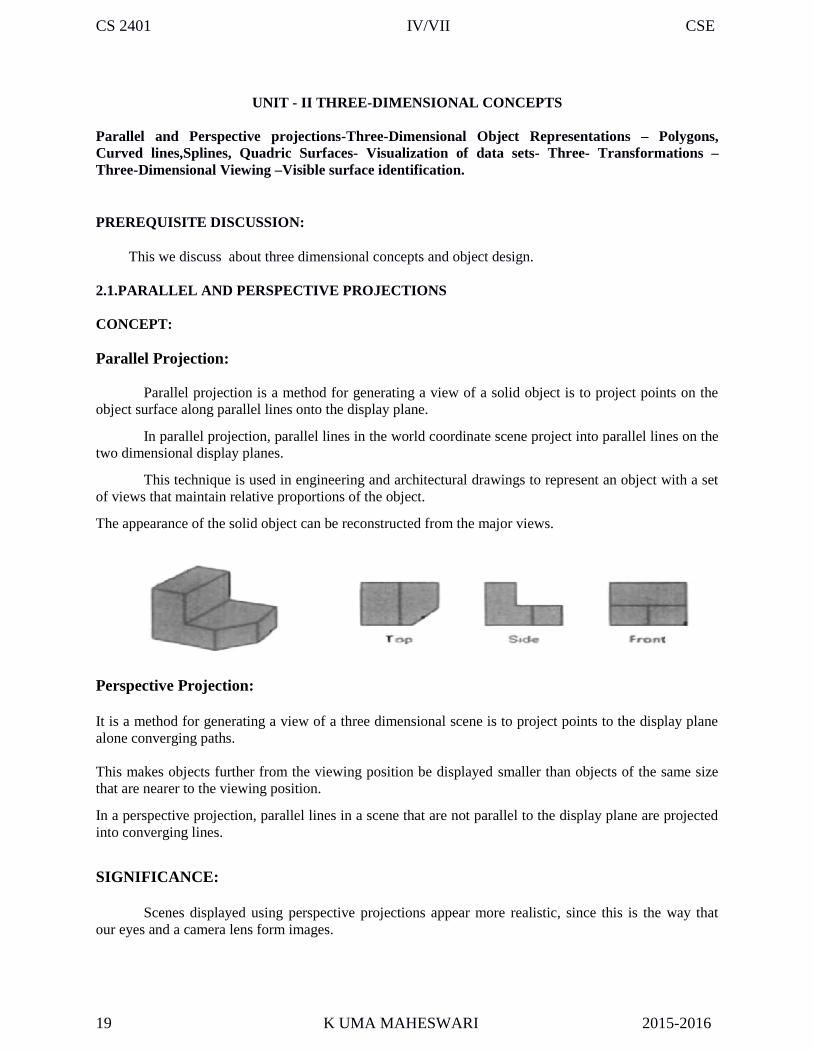
Parallel projection is a method for generating a view of a solid object is to project points on theobject surface along parallel lines onto the display plane.
In parallel projection, parallel lines in the world coordinate scene project into parallel lines on thetwo dimensional display planes.
This technique is used in engineering and architectural drawings to represent an object with a setof views that maintain relative proportions of the object.
The appearance of the solid object can be reconstructed from the major views.
Perspective Projection:
It is a method for generating a view of a three dimensional scene is to project points to the display planealone converging paths.
This makes objects further from the viewing position be displayed smaller than objects of the same sizethat are nearer to the viewing position.
In a perspective projection, parallel lines in a scene that are not parallel to the display plane are projectedinto converging lines.
SIGNIFICANCE:
Scenes displayed using perspective projections appear more realistic, since this is the way thatour eyes and a camera lens form images.

CS 2401 IV/VII CSE
20 K UMA MAHESWARI 2015-2016
2.2.THREE-DIMENSIONAL OBJECT REPRESENTATIONS
CONCEPT
Three Dimensional Object Representations
Representation schemes for solid objects are divided into two categories as follows:1. Boundary Representation ( B-reps)It describes a three dimensional object as a set of surfaces that separate the object interior from theenvironment. Examples are polygon facets and spline patches.2. Space Partitioning representation
Eg: Octree Representation
SIGNIFICANCE:
It Describes The Interior Properties, By Partitioning The Spatial Region Containing An ObjectInto A Set Of Small, Nonoverlapping, Contiguous Solids(Usually Cubes).
2.3.POLYGON SURFACES
CONCEPT
Polygon surfaces are boundary representations for a 3D graphics object is a set of polygons that enclosethe object interior. Polygon TablesThe polygon surface is specified with a set of vertex coordinates and associated attribute parameters.
For each polygon input, the data are placed into tables that are to be used in the subsequent processing.
Polygon data tables can be organized into two groups: Geometric tables and attribute tables.
Geometric Tables
Contain vertex coordinates and parameters to identify the spatial orientation of the polygonsurfaces. Attribute tables Contain attribute information for an object such as parameters specifying thedegree of transparency of the object and its surface reflectivity and texture characteristics.
CS 2401 IV/VII CSE
21 K UMA MAHESWARI 2015-2016
Vertex table Edge Table Polygon surface table V1 : X1, Y1, Z1 E1 : V1, V2 S1 : E1, E2, E3 V2 : X2,Y2, Z2 E2 : V2, V3 S2 : E3, E4, E5, E6 V3 : X3, Y3, Z3 E3 : V3, V1 V4 : X4, Y4, Z4 E4 : V3, V4 V5 :X5, Y5, Z5 E5 : V4, V5 E6 : V5, V1Listing the geometric data in three tables provides a convenient reference to the individual components(vertices, edges and polygons) of each object.
The object can be displayed efficiently by using data from the edge table to draw the component lines.
Extra information can be added to the data tables for faster information extraction. For instance, edgetable can be expanded to include forward points into the polygon table so that common edges betweenpolygons can be identified more rapidly.
vertices are input, we can calculate edge slopes and we can scan the coordinate values to identify theminimum and maximum x, y and z values for individual polygons.
The more information included in the data tables will be easier to check for errors.
Some of the tests that could be performed by a graphics package are:
1. That every vertex is listed as an endpoint for at least two edges.
2. That every edge is part of at least one polygon.
3. That every polygon is closed.
4. That each polygon has at least one shared edge.
5. That if the edge table contains pointers to polygons, every edge referenced by a polygon pointer has areciprocal pointer back to the polygon.
Plane Equations:
To produce a display of a 3D object, we must process the input data representation for the object throughseveral procedures such as,- Transformation of the modeling and world coordinate descriptions to viewing coordinates.
- Then to device coordinates:
- Identification of visible surfaces
- The application of surface-rendering procedures.For these processes, we need information about the spatial orientation of the individual surfacecomponents of the object. This information is obtained from the vertex coordinate value and the equationsthat describe the polygon planes.
The equation for a plane surface is Ax + By+ Cz + D = 0 ----(1) Where (x, y, z) is any point on the plane,and the coefficients A,B,C and D are constants describing the spatial properties of the plane.
Polygon Meshes
A single plane surface can be specified with a function such as fillArea. But when object surfaces are tobe tiled, it is more convenient to specify the surface facets with a mesh function.
One type of polygon mesh is the triangle strip.A triangle strip formed with 11 triangles connecting 13vertices.

CS 2401 IV/VII CSE
22 K UMA MAHESWARI 2015-2016
This function produces n-2 connected triangles given the coordinates for n vertices.
Curved Lines and Surfaces
Displays of three dimensional curved lines and surface can be generated from an input set ofmathematical functions defining the objects or from a set of user specified data points.
When functions are specified, a package can project the defining equations for a curve to thedisplay plane and plot pixel positions along the path of the projected function.
For surfaces, a functional description in decorated to produce a polygon-mesh approximation tothe surface.
Quadric Surfaces
The quadric surfaces are described with second degree equations (quadratics).
They include spheres, ellipsoids, tori, parabolids, and hyperboloids.
Sphere
In Cartesian coordinates, a spherical surface with radius r centered on the coordinates origin is defined asthe set of points (x, y, z) that satisfy the equation.
x2 + y2 + z2 = r2
Ellipsoid
Ellipsoid surface is an extension of a spherical surface where the radius in three mutuallyperpendicular directions can have different values
Spline Representations
A Spline is a flexible strip used to produce a smooth curve through a designated set of points.
Several small weights are distributed along the length of the strip to hold it in position on the draftingtable as the curve is drawn.
The Spline curve refers to any sections curve formed with polynomial sections satisfyingspecified continuity conditions at the boundary of the pieces.
A Spline surface can be described with two sets of orthogonal spline curves.
Splines are used in graphics applications to design curve and surface shapes, to digitize drawingsfor computer storage, and to specify animation paths for the objects or the camera in the scene. CADapplications for splines include the design of automobiles bodies, aircraft and spacecraft surfaces, andship hulls.

CS 2401 IV/VII CSE
23 K UMA MAHESWARI 2015-2016
Interpolation and Approximation Splines
Spline curve can be specified by a set of coordinate positions called control points whichindicates the general shape of the curve.These control points are fitted with piecewise continuous parametric polynomial functions in one of thetwo ways.When polynomial sections are fitted so that the curve passes through each control point the resultingcurve is said to interpolate the set of control points.
A set of six control points interpolated with piecewise continuous polynomial sections
When the polynomials are fitted to the general control point path without necessarily passingthrough any control points, the resulting curve is said to approximate the set of control points.
A set of six control points approximated with piecewise continuous polynomial sections
Interpolation curves are used to digitize drawings or to specify animation paths.
Approximation curves are used as design tools to structure object surfaces.
A spline curve is designed , modified and manipulated with operations on the control points.The curvecan be translated, rotated or scaled with transformation applied to the control points.
The convex polygon boundary that encloses a set of control points is called the convex hull.
The shape of the convex hull is to imagine a rubber band stretched around the position of the controlpoints so that each control point is either on the perimeter of the hull or inside it.
Parametric Continuity Conditions
For a smooth transition from one section of a piecewise parametric curve to the next variouscontinuity conditions are needed at the connection points.
If each section of a spline in described with a set of parametric coordinate functions or the form
x = x(u), y = y(u), z = z(u), u1<= u <= u2
Zero order parametric continuity referred to as C0 continuity, means that the curves meet. (i.e) thevalues of x,y, and z evaluated at u2 for the first curve section are equal. Respectively, to the value of x,y,and z evaluated at u1 for the next curve section.
First order parametric continuity referred to as C1 continuity means that the first parametricderivatives of the coordinate functions in equation (a) for two successive curve sections are equal at theirjoining point.
Second order parametric continuity, or C2 continuity means that both the first and secondparametric derivatives of the two curve sections are equal at their intersection.Geometric Continuity ConditionsTo specify conditions for geometric continuity is an alternate method for joining two successive curvesections.
The parametric derivatives of the two sections should be proportional to each other at their commonboundary instead of equal to each other.
CS 2401 IV/VII CSE
24 K UMA MAHESWARI 2015-2016
Zero order Geometric continuity referred as G0 continuity means that the two curves sections must havethe same coordinate position at the boundary point.
First order Geometric Continuity referred as G1 continuity means that the parametric first derivatives areproportional at the interaction of two successive sections.
Second order Geometric continuity referred as G2 continuity means that both the first and secondparametric derivatives of the two curve sections are proportional at their boundary. Here the curvatures oftwo sections will match at the joining position.
SIGNIFICANCE:
A spline curve is designed , modified and manipulated with operations on the control points.Thecurve can be translated, rotated or scaled with transformation applied to the control points.
2.4.VISUALIZATION OF DATA SETS
CONCEPT:
The use of graphical methods as an aid in scientific and engineering analysis is commonlyreferred to as scientific visualization.
This involves the visualization of data sets and processes that may be difficult or impossible toanalyze without graphical methods. Example medical scanners, satellite and spacecraft scanners.
Visualization techniques are useful for analyzing process that occur over a long period of time orthat cannot observed directly. Example quantum mechanical phenomena and special relativity effectsproduced by objects traveling near the speed of light.
Scientific visualization is used to visually display , enhance and manipulate information to allowbetter understanding of the data.
Similar methods employed by commerce , industry and other nonscientific areas are sometimesreferred to as business visualization.
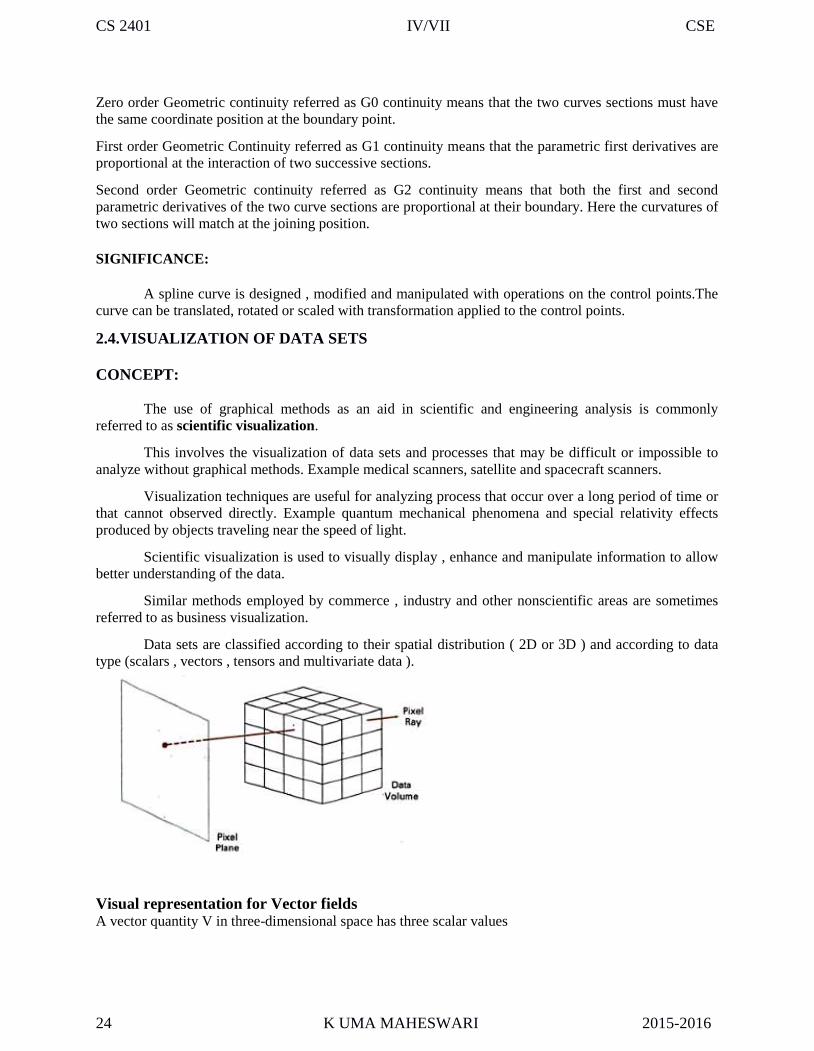
Data sets are classified according to their spatial distribution ( 2D or 3D ) and according to datatype (scalars , vectors , tensors and multivariate data ).
Visual representation for Vector fieldsA vector quantity V in three-dimensional space has three scalar values
CS 2401 IV/VII CSE
25 K UMA MAHESWARI 2015-2016
( Vx , Vy,Vz, ) one for each coordinate direction, and a two-dimensional vector has two components (Vx,Vy,). Another way to describe a vector quantity is by giving its magnitude IV I and its direction as a unitvector u. As with scalars, vector quantities may be functions of position, time, and other parameters.Some examples of physical vector quantities are velocity, acceleration, force, electric fields, magneticfields, gravitational fields, and electric current.
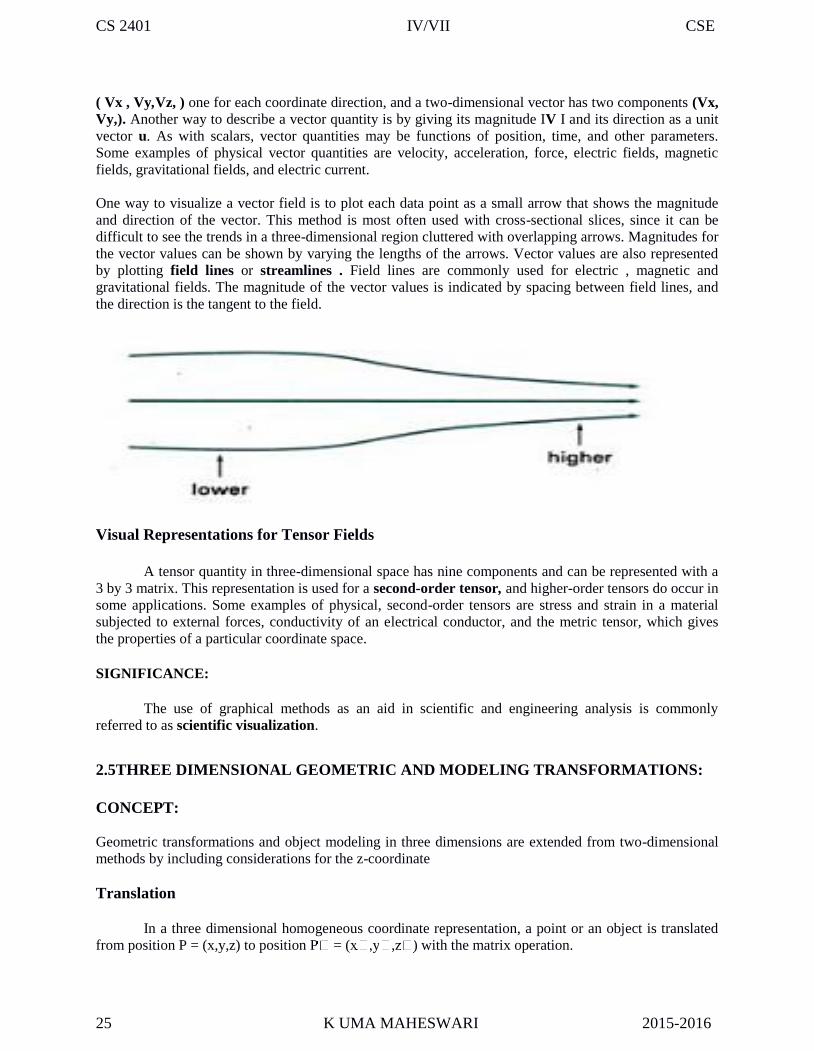
One way to visualize a vector field is to plot each data point as a small arrow that shows the magnitudeand direction of the vector. This method is most often used with cross-sectional slices, since it can bedifficult to see the trends in a three-dimensional region cluttered with overlapping arrows. Magnitudes forthe vector values can be shown by varying the lengths of the arrows. Vector values are also representedby plotting field lines or streamlines . Field lines are commonly used for electric , magnetic andgravitational fields. The magnitude of the vector values is indicated by spacing between field lines, andthe direction is the tangent to the field.
Visual Representations for Tensor Fields
A tensor quantity in three-dimensional space has nine components and can be represented with a3 by 3 matrix. This representation is used for a second-order tensor, and higher-order tensors do occur insome applications. Some examples of physical, second-order tensors are stress and strain in a materialsubjected to external forces, conductivity of an electrical conductor, and the metric tensor, which givesthe properties of a particular coordinate space.
SIGNIFICANCE:
The use of graphical methods as an aid in scientific and engineering analysis is commonlyreferred to as scientific visualization.
2.5THREE DIMENSIONAL GEOMETRIC AND MODELING TRANSFORMATIONS:
CONCEPT:
Geometric transformations and object modeling in three dimensions are extended from two-dimensionalmethods by including considerations for the z-coordinate
Translation
In a three dimensional homogeneous coordinate representation, a point or an object is translatedfrom position P = (x,y,z) to position P = (x ,y ,z ) with the matrix operation.

CS 2401 IV/VII CSE
26 K UMA MAHESWARI 2015-2016
Rotation
To generate a rotation transformation for an object an axis of rotation must be designed to rotatethe object and the amount of angular rotation is also be specified.
Positive rotation angles produce counter clockwise rotations about a coordinate axis.
Co-ordinate Axes Rotations
The 2D z axis rotation equations are easily extended to 3D.x = x cos θ – y sin θ

CS 2401 IV/VII CSE
27 K UMA MAHESWARI 2015-2016
Scaling
The matrix expression for the scaling transformation of a position P = (x,y,.z)
Scaling an object changes the size of the object and repositions the object relatives to the coordinateorigin.
If the transformation parameters are not equal, relative dimensions in the object are changed.
The original shape of the object is preserved with a uniform scaling (sx = sy= sz) .
Scaling with respect to a selected fixed position (x f, yf, zf) can be represented with the followingtransformation sequence:1. Translate the fixed point to the origin. 2. Scale the object relative to the coordinate origin
Other Transformations
Reflections
A 3D reflection can be performed relative to a selected reflection axis or with respect to a selectedreflection plane.
Reflection relative to a given axis are equivalent to 1800 rotations about the axis.
Reflection relative to a plane are equivalent to 1800 rotations in 4D space.
When the reflection plane in a coordinate plane ( either xy, xz or yz) then the transformation can be aconversion between left-handed and right-handed systems.
Shears
Shearing transformations are used to modify object shapes.
They are also used in three dimensional viewing for obtaining general projections transformations.
The following transformation produces a z-axis shear.

CS 2401 IV/VII CSE
28 K UMA MAHESWARI 2015-2016
Composite Transformation
Composite three dimensional transformations can be formed by multiplying the matrixrepresentation for the individual operations in the transformation sequence.
This concatenation is carried out from right to left, where the right most matrixes is the firsttransformation to be applied to an object and the left most matrix is the last transformation.
A sequence of basic, three-dimensional geometric transformations is combined to produce asingle composite transformation which can be applied to the coordinate definition of an object.
Three Dimensional Transformation Functions
Some of the basic 3D transformation functions are: translate ( translateVector, matrixTranslate)rotateX(thetaX, xMatrixRotate) rotateY(thetaY, yMatrixRotate) rotateZ(thetaZ, zMatrixRotate) scale3(scaleVector, matrixScale)Each of these functions produces a 4 by 4 transformation matrix that can be used to transform coordinatepositions expressed as homogeneous column vectors.
Parameter translate Vector is a pointer to list of translation distances tx, ty, and tz.
Parameter scale vector specifies the three scaling parameters sx, sy and sz.
Rotate and scale matrices transform objects with respect to the coordinate origin.
Composite transformation can be constructed with the following functions:
composeMatrix3 buildTransformationMatrix3 composeTransformationMatrix3The order of the transformation sequence forthe buildTransformationMarix3 and composeTransfomationMarix3 functions, is the same as in 2dimensions:1. scale
2. rotate
3. translateOnce a transformation matrix is specified, the matrix can be applied to specified points with
transformPoint3 (inPoint, matrix, outpoint)The transformations for hierarchical construction can be set using structures with the function

CS 2401 IV/VII CSE
29 K UMA MAHESWARI 2015-2016
setLocalTransformation3 (matrix, type) where parameter matrix specifies the elements of a 4 by 4transformation matrix and parameter type can be assigned one of the values of: Preconcatenate,Postconcatenate, or replace.
SIGNIFICANCE:
A 3D reflection can be performed relative to a selected reflection axis or with respect to aselected reflection plane.
2.6.THREE-DIMENSIONAL VIEWING
CONCEPT:
In three dimensional graphics applications,- we can view an object from any spatial position, from the front, from above or from the back.
- We could generate a view of what we could see if we were standing in the middle of a group of objectsor inside object, such as a building.
Viewing Pipeline:
In the view of a three dimensional scene, to take a snapshot we need to do the following steps.1. Positioning the camera at a particular point in space.
2. Deciding the camera orientation (i.e.,) pointing the camera and rotating it around the line of right to setup the direction for the picture.
3. When snap the shutter, the scene is cropped to the size of the „window of the camera and light fromthe visible surfaces is projected into the camera film.
In such a way the below figure shows the three dimensional transformation pipeline, from modelingcoordinates to final device coordinate.
Processing Steps
1. Once the scene has been modeled, world coordinates position is converted to viewing coordinates.
2. The viewing coordinates system is used in graphics packages as a reference for specifying the observerviewing position and the position of the projection plane.
3. Projection operations are performed to convert the viewing coordinate description of the scene tocoordinate positions on the projection plane, which will then be mapped to the output device.
A viewplane or projection plane is set-up perpendicular to the viewing Zv axis.
World coordinate positions in the scene are transformed to viewing coordinates, then viewing coordinatesare projected to the view plane.
The view reference point is a world coordinate position, which is the origin of the viewing coordinatesystem. It is chosen to be close to or on the surface of some object in a scene.

CS 2401 IV/VII CSE
30 K UMA MAHESWARI 2015-2016
Then we select the positive direction for the viewing Zv axis, and the orientation of the view plane byspecifying the view plane normal vector, N. Here the world coordinate position establishes the directionfor N relative either to the world origin or to the viewing coordinate origin.
Transformation from world to viewing coordinatesBefore object descriptions can be projected to the view plane, they must be transferred to viewingcoordinate. This transformation sequence is,1. Translate the view reference point to the origin of the world coordinate system.
2. Apply rotations to align the xv, yv and zv axes with the world xw,yw and zw axes respectively.If the view reference point is specified at world position(x0,y0,z0) this point is translated to the worldorigin with the matrix transformation.
Another method for generation the rotation transformation matrix is to calculate unit uvn vectors andform the composite rotation matrix directly.
Given vectors N and V, these unit vectors are calculated asn = N / (|N|) = (n1, n2, n3) u = (V*N) / (|V*N|) = (u1, u2, u3) v = n*u = (v1, v2, v3)This method automatically adjusts the direction for v, so that v is perpendicular to n.
The composite rotation matrix for the viewing transformation is
u1 u2 u3 0 R = v1 v2 v3 0 n1 n2 n3 0 0 0 0 1which transforms u into the world xw axis, v onto the yw axis and n onto the zw axis
ProjectionsOnce world coordinate descriptions of the objects are converted to viewing coordinates, we can projectthe 3 dimensional objects onto the two dimensional view planes.
There are two basic types of projection.

CS 2401 IV/VII CSE
31 K UMA MAHESWARI 2015-2016
1. Parallel Projection - Here the coordinate positions are transformed to the view plane along parallellines.Parallel projection of an object to the view plan
SIGNIFICANCE:
In three dimensional graphics applications, we can view an object from any spatial position, fromthe front, from above or from the back.
2.7.VISIBLE SURFACE IDENTIFICATION
CONCEPT
A major consideration in the generation of realistic graphics displays is identifying those parts ofa scene that are visible from a chosen viewing position.
Classification of Visible Surface Detection Algorithms
These are classified into two types based on whether they deal with object definitions directly orwith their projected images
1. Object Space Methods:
compares objects and parts of objects to each other within the scene definition to determine whichsurfaces as a whole we should label as visible.
2. Image space methods:

CS 2401 IV/VII CSE
32 K UMA MAHESWARI 2015-2016
visibility is decided point by point at each pixel position on the projection plane. Most VisibleSurface Detection Algorithms use image space methods.
Back Face Detection
A point (x, y,z) is "inside" a polygon surface with plane parameters A, B, C, and D if Ax + By + Cz + D <0 ----------------(1 ) When an inside point is along the line of sight to the surface, the polygon must be aback face .
Depth Buffer Method
A commonly used image-space approach to detecting visible surfaces is the depth-buffer method,which compares surface depths at each pixel position on the projection plane.
This procedure is also referred to as the z-buffer method. Each surface of a scene is processedseparately, one point at a time across the surface. The method is usually applied to scenes containing onlypolygon surfaces, because depth values can be computed very quickly and the method is easy toimplement.
But the mcthod can be applied to nonplanar surfaces. With object descriptions converted toprojection coordinates, each (x, y, z) position on a polygon surface corresponds to the orthographicprojection point (x, y) on the view plane.

CS 2401 IV/VII CSE
33 K UMA MAHESWARI 2015-2016
We can implement the depth-buffer algorithm in normalized coordinates, so that z values rangefrom 0 at the back clipping plane to Zmax at the front clipping plane.
Two buffer areas are required.A depth buffer is used to store depth values for each (x, y)position as surfaces are processed, and the refresh buffer stores the intensity values for each position.
Initially,all positions in the depth buffer are set to 0 (minimum depth), and the refresh buffer isinitialized to the background intensity. We summarize the steps of a depth-buffer algorithm as follows:1. Initialize the depth buffer and refresh buffer so that for all buffer positions (x, y), depth (x, y)=0,refresh(x , y )=Ibackgnd 2. For each position on each polygon surface, compare depth values topreviously stored values in the depth buffer to determine visibility.Calculate the depth z for each (x, y) position on the polygon.
If z > depth(x, y), then set
depth ( x, y)=z , refresh(x,y)= Isurf(x, y)
A- BUFFER METHOD
An extension of the ideas in the depth-buffer method is the A-buffer method. The A buffermethod represents an antialiased, area-averaged, accumulation-buffer method developed byLucasfilm for implementation in the surface-rendering system called REYES (an acronym for "RendersEverything You Ever Saw"). A drawback of the depth-buffer method is that it can only find one visiblesurface at each pixel position. The A-buffer method expands

CS 2401 IV/VII CSE
34 K UMA MAHESWARI 2015-2016
SCAN-LINE METHOD
This image-space method for removing hidden surfaces is an extension of the scan-line algorithmfor filling polygon interiors. As each scan line is processed, all polygon surfaces intersecting that line areexamined to determine which are visible. Across each scan line, depth calculations are made for eachoverlapping surface to determine which is nearest to the view plane. When the visible surface has beendetermined, the intensity value for that position is entered into the refresh buffer.
We assume that tables are set up for the various surfaces, which include both an edge table and apolygon table. The edge table contains coordinate endpoints for each line in-the scene, the inverse slopeof each line, and pointers into the polygon table to identify the surfaces bounded by each line. Thepolygon table contains coefficients of the plane equation for each surface, intensity information for thesurfaces, and possibly pointers into the edge table.
To facilitate the search for surfaces crossing a given scan line, we can set up an active list ofedges from information in the edge table. This active list will contain only edges that cross the currentscan line, sorted in order of increasing x. In addition, we define a flag for each surface that is set on or offto indicate whether a position along a scan line is inside or outside of the surface. Scan lines are processedfrom left to right. At the leftmost boundary of a surface, the surface flag is turned on; and at the rightmostboundary, it is turned off.

CS 2401 IV/VII CSE
35 K UMA MAHESWARI 2015-2016
BSP-Tree Method A binary space-partitioning (BSP) tree is an efficient method fordetermining object visibility by painting surfaces onto the screen from back to front, as in the painter'salgorithm. The BSP tree is particularly useful when the view reference point changes, but the objects in ascene are at fixed positions. Applying a BSP tree to visibility testing involves identifying surfaces that are"inside" and "outside" the partitioning plane at each step of the space subdivision, relative to the viewingdirection. The figure(a) illustrates the basic concept in this algorithm.

CS 2401 IV/VII CSE
36 K UMA MAHESWARI 2015-2016
Area – Subdivision Method
This technique for hidden-surface removal is essentially an image-space method ,butobject-space operations can be used to accomplish depth ordering of surfaces. The area-subdivisionmethod takes advantage of area coherence in a scene by locating those view areas that represent part of asingle surface. We apply this method by successively dividing the total viewing area into smaller andsmaller rectangles until each small area is the projection of part of a single visible surface or no surface atall.
octree methods
When an octree representation is used for the viewing volume, hidden-surface elimination isaccomplished by projecting octree nodes onto the viewing surface in a front-to-back order. In the belowFig. the front face of a region of space (the side toward the viewer) is formed with octants 0, 1, 2, and 3.Surfaces in the front of these octants are visible to the viewer. Any surfaces toward the re in the backoctants (4,5,6, and 7) may be hidden by the front surfaces.
When an octree representation is used for the viewing volume, hidden-surface elimination isaccomplished by projecting octree nodes onto the viewing surface in a front-to-back order. In the belowFig. the front face of a region of space (the side toward the viewer) is formed with octants 0, 1, 2, and 3.Surfaces in the front of these octants are visible to the viewer. Any surfaces toward the re in the backoctants (4,5,6, and 7) may be hidden by the front surfaces.
SIGNIFICANCE:
This technique for hidden-surface removal is essentially an image-space method ,butobject-space operations can be used to accomplish depth ordering of surfaces.
APPLICATIONS:
1.Real time 3D magic
2.Implement 3D transformations
3.Correct view about 3D

CS 2401 IV/VII CSE
37 K UMA MAHESWARI 2015-2016
UNIT III - GRAPHICS PROGRAMMING
Color Models – RGB, YIQ, CMY, HSV – Animations – General Computer Animation, Raster,Keyframe - Graphics programming using OPENGL – Basic graphics primitives –Drawing threedimensional objects - Drawing three dimensional scenes
PREREQUISITE DISCUSSION:
In this unit going to discuss about graphics color models and general computer animationand three dimensional object scenes.
3.1.COLOR MODELS
CONCEPTS:
Color Model is a method for explaining the properties or behavior of color within some particularcontext. No single color model can explain all aspects of color, so we make use of different models tohelp describe the different perceived characteristics of color.
Properties of Light
Light is a narrow frequency band within the electromagnetic system.
Other frequency bands within this spectrum are called radio waves, micro waves, infrared wavesand x-rays. The below fig shows the frequency ranges for some of the electromagnetic bands.
Each frequency value within the visible band corresponds to a distinct color.
At the low frequency end is a red color (4.3*104 Hz) and the highest frequency is a violet color (7.5 *1014Hz)
Spectral colors range from the reds through orange and yellow at the low frequency end togreens, blues and violet at the high end.

CS 2401 IV/VII CSE
38 K UMA MAHESWARI 2015-2016
Since light is an electro magnetic wave, the various colors are described in terms of either thefrequency for the wave length λ of the wave.
The wave length ad frequency of the monochromatic wave are inversely proportional to eachother, with the proportionality constants as the speed of light C where C = λ f
A light source such as the sun or a light bulb emits all frequencies within the visible range toproduce white light. When white light is incident upon an object, some frequencies are reflected and someare absorbed by the object. The combination of frequencies present in the reflected light determines whatwe perceive as the color of the object.
If low frequencies are predominant in the reflected light, the object is described as red. In thiscase, the perceived light has the dominant frequency at the red end of the spectrum. The dominantfrequency is also called the hue, or simply the color of the light.
Brightness is another property, which in the perceived intensity of the light.
Intensity in the radiant energy emitted per limit time, per unit solid angle, and per unit projected area ofthe source.
Radiant energy is related to the luminance of the source.
The next property in the purity or saturation of the light.- Purity describes how washed out or how pure the color of the light appears.
- Pastels and Pale colors are described as less pure.The term chromaticity is used to refer collectively to the two properties, purity and dominant frequency.
SIGNIFICANCE:
Color Model is a method for explaining the properties or behavior of color within some particularcontext.
3.2.STANDARD PRIMARIES
CONCEPTS
XYZ COLOR MODEL
The set of primaries is generally referred to as the XYZ or (X,Y,Z) color model where X,Y and Zrepresent vectors in a 3D, additive color space.
Any color Cλ is expressed asCλ = XX + YY + ZZ -------------(1) Where X,Y and Z designates the amounts of the standard primariesneeded to match Cλ.It is convenient to normalize the amount in equation (1) against luminance (X + Y+ Z). Normalizedamounts are calculated as,
x = X/(X+Y+Z), y = Y/(X+Y+Z), z = Z/(X+Y+Z) with x + y + z = 1
CS 2401 IV/VII CSE
39 K UMA MAHESWARI 2015-2016
Any color can be represented with just the x and y amounts. The parameters x and y are called thechromaticity values because they depend only on hue and purity.
RGB Color Model
Based on the tristimulus theory of our eyes perceive color through the stimulation of three visualpigments in the cones on the retina.
These visual pigments have a peak sensitivity at wavelengths of about 630 nm (red), 530 nm(green) and 450 nm (blue).
By comparing intensities in a light source, we perceive the color of the light.
This is the basis for displaying color output on a video monitor using the 3 color primaries, red, green,and blue referred to as the RGB color model.
The sign represents black, and the vertex with coordinates (1,1,1) in white.
Vertices of the cube on the axes represent the primary colors, the remaining vertices represents thecomplementary color for each of the primary colors.
The RGB color scheme is an additive model. (i.e.,) Intensities of the primary colors are added to produceother colors.
Each color point within the bounds of the cube can be represented as the triple (R,G,B) where values forR, G and B are assigned in the range from 0 to1.
The color Cλ is expressed in RGB component asCλ = RR + GG + B
YIQ Color Model
The National Television System Committee (NTSC) color model for forming the compositevideo signal in the YIQ model.
In the YIQ color model, luminance (brightness) information in contained in the Y parameter, chromaticityinformation (hue and purity) is contained into the I and Q parameters.
A combination of red, green and blue intensities are chosen for the Y parameter to yield the standardluminosity curve.
Since Y contains the luminance information, black and white TV monitors use only the Y signal.
Parameter I contain orange-cyan hue information that provides the flash-tone shading and occupies abandwidth of 1.5 MHz.
Parameter Q carries green-magenta hue information in a bandwidth of about 0.6 MHz.
An RGB signal can be converted to a TV signal

CS 2401 IV/VII CSE
40 K UMA MAHESWARI 2015-2016
CMY Color Model
A color model defined with the primary colors cyan, magenta, and yellow (CMY) in useful fordescribing color output to hard copy devices.
It is a subtractive color model (i.e.,) cyan can be formed by adding green and blue light. When white lightis reflected from cyan-colored ink, the reflected light must have no red component. i.e., red light isabsorbed or subtracted by the link.
Magenta ink subtracts the green component from incident light and yellow subtracts the blue component.
In CMY model, point (1,1,1) represents black because all components of the incident light are subtracted.
The origin represents white light.
Equal amounts of each of the primary colors produce grays along the main diagonal of the cube.
A combination of cyan and magenta ink produces blue light because the red and green components of theincident light are absorbed.
The printing process often used with the CMY model generates a color point with a collection of 4 inkdots; one dot is used for each of the primary colors (cyan, magenta and yellow) and one dot in black.
HSV Color Model
The HSV model uses color descriptions that have a more interactive appeal to a user.
Color parameters in this model are hue (H), saturation (S), and value (V).
The 3D representation of the HSV model is derived from the RGB cube. The outline of the cube has thehexagon shape.

CS 2401 IV/VII CSE
41 K UMA MAHESWARI 2015-2016
HLS Color Model
HLS model is based on intuitive color parameters used by Tektronix.
It has the double cone representation shown in the below figure. The 3 parameters in this model are calledHue (H), lightness (L) and saturation (s).
SIGNIFICANCE:
Different types of color models provide how the color displays in different form.
3.3.ANIMATION
CONCEPT :
Computer animation refers to any time sequence of visual changes in a scene.
Computer animations can also be generated by changing camera parameters such as position, orientationand focal length.
Applications of computer-generated animation are entertainment, advertising, training and education.

CS 2401 IV/VII CSE
42 K UMA MAHESWARI 2015-2016
Example : Advertising animations often transition one object shape into another. Frame-by-Frameanimation Each frame of the scene is separately generated and stored. Later, the frames can be recodedon film or they can be consecutively displayed in "real-time playback" mode Design of AnimationSequences An animation sequence in designed with the following steps:Story board layout
Object definitions
Key-frame specifications
Generation of in-between frames.
Story board
The story board is an outline of the action.
It defines the motion sequences as a set of basic events that are to take place.
Depending on the type of animation to be produced, the story board could consist of a set of roughsketches or a list of the basic ideas for the motion.
Object DefinitionAn object definition is given for each participant in the action.
Objects can be defined in terms of basic shapes such as polygons or splines.
The associated movements of each object are specified along with the shape.
SIGNIFICANCE:Computer animation refers to any time sequence of visual changes in a scene.
3.4.KEY FRAME
CONCEPT
A key frame is detailed drawing of the scene at a certain time in the animation sequence.
Within each key frame, each object is positioned according to the time for that frame.
Some key frames are chosen at extreme positions in the action; others are spaced so that the time intervalbetween key frames is not too much.
Computer Animation Languages
Animation functions include a graphics editor, a key frame generator and standard graphics routines.
The graphics editor allows designing and modifying object shapes, using spline surfaces, constructivesolid geometry methods or other representation schemes.

CS 2401 IV/VII CSE
43 K UMA MAHESWARI 2015-2016
Scene description includes the positioning of objects and light sources defining the photometricparameters and setting the camera parameters.
Action specification involves the layout of motion paths for the objects and camera.
Keyframe systems are specialized animation languages designed dimply to generate the in-betweens fromthe user specified keyframes.
Parameterized systems allow object motion characteristics to be specified as part of the object definitions.The adjustable parameters control such object characteristics as degrees of freedom motion limitationsand allowable shape changes.
Scripting systems allow object specifications and animation sequences to be defined with a user inputscript. From the script, a library of various objects and motions can be constructed.
Keyframe Systems
Each set of in-betweens are generated from the specification of two keyframes.
For complex scenes, we can separate the frames into individual components or objects called cells, anacronym from cartoon animation.
Morphing
Transformation of object shapes from one form to another is called Morphing.
Morphing methods can be applied to any motion or transition involving a change in shape. The exampleis shown in the below figure.The general preprocessing rules for equalizing keyframes in terms of either the number of vertices to beadded to a keyframe.
Suppose we equalize the edge count and parameters Lk and Lk+1 denote the number of line segments intwo consecutive frames. We define,Lmax = max (Lk, Lk+1) Lmin = min(Lk , Lk+1) Ne = Lmax mod Lmin Ns = int (Lmax/Lmin)The preprocessing is accomplished by
1. Dividing Ne edges of keyframemin into Ns+1 section.2. Dividing the remaining lines of keyframemin into Ns sections.
For example, if Lk = 15 and Lk+1 = 11, we divide 4 lines of keyframek+1 into 2 sections each. Theremaining lines of keyframek+1 are left infact.
If the vector counts in equalized parameters Vk and Vk+1 are used to denote the number of vertices in thetwo consecutive frames. In this case we define
Vmax = max(Vk,Vk+1), Vmin = min( Vk,Vk+1) and Nls = (Vmax -1) mod (Vmin – 1) Np = int ((Vmax– 1)/(Vmin – 1 ))Preprocessing using vertex count is performed by
1. Adding Np points to Nls line section of keyframemin.

CS 2401 IV/VII CSE
44 K UMA MAHESWARI 2015-2016
2. Adding Np-1 points to the remaining edges of keyframemin.
Simulating Accelerations
Curve-fitting techniques are often used to specify the animation paths between key frames. Given thevertex positions at the key frames, we can fit the positions with linear or nonlinear paths. Figure illustratesa nonlinear fit of key-frame positions. This determines the trajectories for the in-betweens. To simulateaccelerations, we can adjust the time spacing for the in-betweens.
Goal Directed Systems
We can specify the motions that are to take place in general terms that abstractly describe the actions.
These systems are called goal directed. Because they determine specific motion parameters given thegoals of the animation.
Eg., To specify an object to „walk or to „run to a particular distance.
Kinematics and Dynamics
With a kinematics description, we specify the animation by motion parameters (position, velocity andacceleration) without reference to the forces that cause the motion.
For constant velocity (zero acceleration) we designate the motions of rigid bodies in a scene by giving aninitial position and velocity vector for each object.
We can specify accelerations (rate of change of velocity ), speed up, slow downs and curved motionpaths.
An alternative approach is to use inverse kinematics; where the initial and final positions of the object arespecified at specified times and the motion parameters are computed by the system.
SIGNIFICANCE:
Transformation of object shapes from one form to another
3.5.GRAPHICS PROGRAMMING USING OPENGL
CONCEPT:
OpenGL is a software interface that allows you to access the graphics hardware without takingcare of the hardware details or which graphics adapter is in the system.
OpenGL is a low-level graphics library specification. It makes available to the programmer asmall set of geomteric primitives - points, lines, polygons, images, and bitmaps.
OpenGL provides a set of commands that allow the specification of geometric objects in two or threedimensions, using the provided primitives, together with commands that control how these objects arerendered (drawn).

CS 2401 IV/VII CSE
45 K UMA MAHESWARI 2015-2016
LibrariesOpenGL Utility Library (GLU) contains several routines that use lower-level OpenGL commands toperform such tasks as setting up matrices for specific viewing orientations and projections and renderingsurfaces.OpenGL Utility Toolkit (GLUT) is a window-system-independent toolkit, written by Mark Kilgard, tohide the complexities of differing window APIs.
Include Files
For all OpenGL applications, you want to include the gl.h header file in every file. Almost allOpenGL applications use GLU, the aforementioned OpenGL Utility Library, which also requiresinclusion of the glu.h header file. So almost every OpenGL source file begins with: #include <GL/gl.h>#include <GL/glu.h> If you are using the OpenGL Utility Toolkit (GLUT) for managing your windowmanager tasks, you should include: #include <GL/glut.h> The following files must be placed in theproper folder to run a OpenGL Program. Libraries (place in the lib\ subdirectory of Visual C++)opengl32.libglu32.lib
Working with OpenGL Opening a window for Drawing
The First task in making pictures is to open a screen window for drawing. The following fivefunctions initialize and display the screen window in our program.1. glutInit(&argc, argv)The first thing we need to do is call the glutInit() procedure. It should be called before any other GLUTroutine because it initializes the GLUT library. The parameters to glutInit() should be the same as those tomain(), specifically main(int argc, char** argv) and glutInit(&argc, argv).2. glutInitDisplayMode(GLUT_SINGLE | GLUT_RGB)The next thing we need to do is call the glutInitDisplayMode() procedure to specify the display mode fora window.
We must first decide whether we want to use an RGBA (GLUT_RGB) or color-index(GLUT_INDEX) color model. The RGBA mode stores its color buffers as red, green, blue, and alphacolor components. Color-index mode, in contrast, stores color buffers in indicies. And for special effects,such as shading, lighting, and fog, RGBA mode provides more flexibility. In general, use RGBA modewhenever possible. RGBA mode is the default.
Another decision we need to make when setting up the display mode is whether we want to usesingle buffering (GLUT_SINGLE) or double buffering (GLUT_DOUBLE). If we aren't usingannimation, stick with single buffering, which is the default.3. glutInitWindowSize(640,480)We need to create the characteristics of our window. A call to glutInitWindowSize() will be used tospecify the size, in pixels, of our inital window. The arguments indicate the height and width (in pixels) ofthe requested window.4. glutInitWindowPosition(100,15)Similarly, glutInitWindowPosition() is used to specify the screen location for the upper-left corner of ourinitial window. The arguments, x and y, indicate the location of the window relative to the entire display. This functionpositioned the screen 100 pixels over from the left edge and 150 pixels down from the top.5. glutCreateWindow(“Example”)To create a window, the with the previously set characteristics (display mode, size, location, etc), theprogrammer uses the glutCreateWindow() command. The command takes a string as a parameter whichmay appear in the title bar.

CS 2401 IV/VII CSE
46 K UMA MAHESWARI 2015-2016
6. glutMainLoop()The window is not actually displayed until the glutMainLoop() is entered.
The very last thing is we have to call this function Event Driven Programming The method ofassociating a call back function with a particular type of event is called as event driven programming.OpenGL provides tools to assist with the event management.
Example//the following code plots three dotsglBegin(GL_POINTS);
glVertex2i(100, 50);
glVertex2i(100, 130);
glVertex2i(150, 130);
glEnd( ); // the following code draws a triangle
glBegin(GL_TRIANGLES);
glVertex3f(100.0f, 100.0f, 0.0f);
glVertex3f(150.0f, 100.0f, 0.0f);

CS 2401 IV/VII CSE
47 K UMA MAHESWARI 2015-2016
glVertex3f(125.0f, 50.0f, 0.0f); glEnd( ); // the following code draw a lines
glBegin(GL_LINES);
glVertex3f(100.0f, 100.0f, 0.0f); // origin of the line
glVertex3f(200.0f, 140.0f, 5.0f); // ending point of the line
glEnd( );
OpenGl State
OpenGl keeps track of many state variables, such as current size of a point, the current color of adrawing, the current background color, etc. The value of a state variable remains active until new value isgiven. glPointSize() : The size of a point can be set with glPointSize(), which takes one floating pointargument Example : glPointSize(4.0); glClearColor() : establishes what color the window will becleared to. The background color is set with glClearColor(red, green, blue, alpha), where alpha specifies adegree of transparency Example : glClearColor (0.0, 0.0, 0.0, 0.0); //set black background color
Drawing Aligned Rectangles.
A special case of a polygon is the aligned rectangle, so called because its sides are aligned with thecoordinate axes.OpenGL provides the ready-made function:glRecti(GLint x1, GLint y1, GLint x2, GLint y2); // draw a rectangle with opposite corners (x1, y1) and
(x2, y2); // fill it with the current color;glClearColor(1.0,1.0,1.0,0.0); // white backgroundglClear(GL_COLOR_BUFFER_BIT); // clear the windowglColor3f(0.6,0.6,0.6); // bright grayglRecti(20,20,100,70); glColor3f(0.2,0.2,0.2); //
gray glRecti(70, 50, 150, 130);ratio = width/height; Polygons Polygons are the areas enclosed by single closed loops of line segments,where the line segments are specified by the vertices at their endpoints Polygons are typically drawn byfilling in all the pixels enclosed within the boundary, but you can also draw them as outlined polygons orsimply as points at the vertices. A filled polygon might be solidly filled, or stippled with a certain patternOpenGL also supports filling more general polygons with a pattern or color.
The following list explains the function of each of the five constants:GL_TRIANGLES: takes the listed vertices three at a time, and draws a separate triangle for each;GL_QUADS: takes the vertices four at a time and draws a separate quadrilateral for eachGL_TRIANGLE_STRIP: draws a series of triangles based on triplets of vertices: v0, v1, v2, then v2, v1,v3, then v2, v3, v4, etc. (in an order so that all triangles are “traversed” in the same way;e.g.counterclockwise).GL_TRIANGLE_FAN: draws a series of connected triangles based on triplets of vertices: v0, v1, v2, thenv0, v2, v3, then v0, v3, v4, etc. GL_QUAD_STRIP: draws a series of quadrilaterals based on foursomes ofvertices: first v0, v1, v3, v2, then v2, v3, v5, v4, then v4, v5, v7, v6 (in an order so that all quadrilateralsare “traversed” in the same way; e.g. counterclockwise).

CS 2401 IV/VII CSE
48 K UMA MAHESWARI 2015-2016
Working With Material Properties In OpenGL
The effect of a light source can be seen only when light reflects off an object s surface. OpenGLprovides methods for specifying the various reflection coefficients. The coefficients are set withvariations of the function glMaterial and they can be specified individually for front and back faces. Thecode: Glfloat myDiffuse[]={0.8, 0.2, 0.0, 1.0 }; glMaterialfv(GL_FRONT,GL_DIFFUSE,myDiffuse);sets the diffuse reflection coefficients( ρdr , ρdg ,ρdb) equal to (0.8, 0.2, 0.0) for all specified front faces.The first parameter of glMaterialfv() can take the following values: GL_FRONT:Set the reflectioncoefficient for front faces. GL_BACK:Set the reflection coefficient for back faces.GL_FRONT_AND_BACK:Set the reflection coefficient for both front and back faces. The secondparameter can take the following values:GL_AMBIENT: Set the ambient reflection coefficients. GL_DIFFUSE: Set the diffuse reflectioncoefficients. GL_SPECULAR: Set the specular reflection coefficients. GL_AMBIENT_AND_DIFFUSE:Set both the ambient and the diffuse reflection coefficients to the same values. GL_EMISSION: Set theemissive color of the surface. The emissive color of a face causes it to “glow” in the specified color,independently of any light source.
Shading of Scenes specified by SDL
The scene description language SDL supports the loading of material properties into objects sothat they can be shaded properly. light 3 4 5 .8 .8 ! bright white light at (3,4,5) background 1 1 1 ! whitebackground globalAmbient .2 .2 .2 ! a dark gray global ambient light ambient .2 .6 0 diffuse .8 .2 1 ! redmaterial specular 1 1 1 ! bright specular spots – the color of the source specularExponent 20 !set thephong exponent scale 4 4 4 sphere
SIGNIFICANCE:
OpenGL is a low-level graphics library specification. It makes available to the programmer a smallset of geomteric primitives - points, lines, polygons, images, and bitmaps.
3.6.BASIC GRAPHICS PRIMITIVES
CONCEPTS:
OpenGL Provides tools for drawing all the output primitives such as points, lines, triangles,polygons, quads etc and it is defined by one or more vertices.To draw such objects in OpenGL we pass it a list of vertices. The list occurs between the two OpenGLfunction calls glBegin() and glEnd(). The argument of glBegin() determine which object is drawn.These functions are glBegin(int mode); glEnd( void ); The parameter mode of the function glBegin can beone of the following:GL_POINTS GL_LINES
GL_LINE_STRIP
GL_LINE_LOOP
GL_TRIANGLES

CS 2401 IV/VII CSE
49 K UMA MAHESWARI 2015-2016
GL_TRIANGLE_STRIP
GL_TRIANGLE_FAN GL_QUADS
glFlush() :
ensures that the drawing commands are actually executed rather than stored in a buffer awaiting (ie)Force all issued OpenGL commands to be executed
glMatrixMode(GL_PROJECTION) : For orthographic projection
glLoadIdentity() : To load identity matrix
SIGNIFICANCE:
Different types of graphics OPENGL functions are used to implement line,polygon.
3.7.DRAWING THREE DIMENSIONAL OBJECTS & DRAWING THREEDIMENSIONAL SCENES
CONCEPTS:
OpenGL has separate transformation matrices for different graphics features
glMatrixMode(GLenum mode), where mode is one of:
GL_MODELVIEW - for manipulating model in sceneGL_PROJECTION - perspective orientationGL_TEXTURE - texture map orientation
glLoadIdentity(): loads a 4-by-4 identity matrix into the current matrixglPushMatrix() : push current matrix stackglPopMatrix() : pop the current matrix stackglMultMatrix () : multiply the current matrix with the specified matrixglViewport() : set the viewport Example : glViewport(0, 0, width, height);gluPerspective() : function sets up a perspective projection matrix.Format : gluPerspective(angle, asratio, ZMIN, ZMAX);Example : gluPerspective(60.0, width/height, 0.1, 100.0);gluLookAt() - view volume that is centered on a specified eyepointExample : gluLookAt(3.0, 2.0, 1.0, 0.0, 0.0, 0.0, 0.0, 1.0, 0.0);glutSwapBuffers () : glutSwapBuffers swaps the buffers of the current window if double buffered.
Example for drawing three dimension Objects glBegin(GL_QUADS);
// Start drawing a quad primitive

CS 2401 IV/VII CSE
50 K UMA MAHESWARI 2015-2016
glVertex3f(-1.0f, -1.0f, 0.0f); // The bottom left corner glVertex3f(-1.0f, 1.0f, 0.0f); // The top left cornerglVertex3f(1.0f, 1.0f, 0.0f); // The top right corner glVertex3f(1.0f, -1.0f, 0.0f); // The bottom right cornerglEnd(); // Triangle
// Quads in different colours
glBegin(GL_QUADS);
glColor3f(1,0,0); //red
glVertex3f(-0.5, -0.5, 0.0);
glColor3f(0,1,0); //green
glVertex3f(-0.5, 0.5, 0.0);
glColor3f(0,0,1); //blue
glVertex3f(0.5, 0.5, 0.0);
glColor3f(1,1,1); //white
glVertex3f(0.5, -0.5, 0.0); glEnd();
SIGNIFICANCE:
It used to make a realistic scenes and structures
APPLICATIONS:
1.Implement a color models.
2.Implement a realistic scenes and objects
3.OPENGL is a easy way to make a real objects.

CS 2401 IV/VII CSE
51 K UMA MAHESWARI 2015-2016
UNIT IV – RENDERING
Introduction to shading models – Flat and smooth shading – Adding texture to faces – Addingshadows of objects – Building a camera ina program – Creating shaded objects – Rendering texture– Drawing shadows.
PREREQUISITE DISCUSSION:
This uint give a discussion about shading and textures to a pictures.
4.1 INTRODUCTION TO SHADING MODELS
CONCEPTS:
The mechanism of light reflection from an actual surface is very complicated it depends on manyfactors. Some of these factors are geometric and others are related to the characteristics of the surface. Ashading model dictates how light is scattered or reflected from a surface.The shading models described here focuses on achromatic light.Achromatic light has brightness and no color, it is a shade of gray so it is described by a single value itsintensity.
A shading model uses two types of light source to illuminate the objects in a scene : point light sourcesand ambient light. Incident light interacts with the surface in three different ways:
Some is absorbed by the surface and is converted to heat.Some is reflected from the surfaceSome is transmitted into the interior of the object
Geometric Ingredients For Finding Reflected Light We need to find three vectors in order to computethe diffuse and specular components. The below fig. shows three principal vectors ( s, m and v) requiredto find the amount of light that reaches the eye from a point P.

CS 2401 IV/VII CSE
52 K UMA MAHESWARI 2015-2016
1. The normal vector , m , to the surface at P.2. The vector v from P to the viewer s eye.3. The vector s from P to the light source.The angles between these three vectors form the basis of computing light intensities. These angles arenormally calculated using world coordinates.
Therefore the strength of the diffuse component: Id = Is ρd Is is the intensity of the light sourceand ρd is the diffuse reflection coefficient.
If the facet is aimed away from the eye this dot product is negative so we need to evaluate Id to 0. A moreprecise computation of the diffuse component is : Id = Is ρd max ms m s.0 , .ms m sThe reflection coefficient ρd depends on the wavelength of the incident light , the angle θ and variousphysical properties of the surface.
Specular Reflection
Real objects do not scatter light uniformly in all directions and so a specular component is addedto the shading model. Specular reflection causes highlights which can add reality to a picture whenobjects are shinny.
The behavior of specular light can be explained with Phong model. Phong Model It is easy toapply and the highlights generated by the phong model given an plasticlike appearance , so the phongmodel is good when the object is made of shinny plastic or glass.
The Phong model is less successful with objects that have a shinny metallic surface. Fig a) showsa situation where light from a source impinges on a surface and is reflected in different directions.
In this model we discuss the amount of light reflected is greatest in the direction of perfect mirrorreflection , r, where the angle of incidence θ equals the angle of reflection. This is the direction in whichall light would travel if the surface were a perfect mirror

CS 2401 IV/VII CSE
53 K UMA MAHESWARI 2015-2016
The Role of Ambient Light and Exploiting Human Perception
The diffuse and specular components of reflected light are found by simplifying the rules by whichphysical light reflects from physical surfaces. The dependence of these components on the relativeposition of the eye , model and light sources greatly improves the reality of a picture. The simplereflection model does not perfectly renders a scene. An example: shadows are unrealistically deep andharsh, to soften these shadows we add a third light component called ambient light.
To Add Color
Colored light can be constructed by adding certain amounts of red, green and blue light. Whendealing with colored sources and surfaces we calculate each color component individually and simply addthem to from the final color of the reflected light.
Shading and the Graphics Pipeline

CS 2401 IV/VII CSE
54 K UMA MAHESWARI 2015-2016
SIGNIFICANCE:
A shading model uses two types of light source to illuminate the objects in a scene : point lightsources and ambient light. Incident light interacts with the surfaces.
4.2.FLAT SHADING AND SMOOTH SHADING
CONCEPTS:
Different objects require different shading effects. In the modeling process we attached a normalvector to each vertex of each face.
If a certain face is to appear as a distinct polygon, we attach the same normal vector to all of itsvertices; the normal vector chosen is that indicating the direction normal to the plane of the face. If theface is approximate an underlying surface, we attach to each vertex the normal to the underlying surfaceat that plane.
The information obtained from the normal vector at each vertex is used to perform different kindsof shading.
The main distinction is between a shading method that accentuates the individual polygons (flatshading) and a method that blends the faces to de-emphasize the edges between them (smooth shading).
The screen coordinates of each vertex is noted. The lowest and highest points on the face are ybottand ytop. The tiler first fills in the row at y= ybott , then at ybott + 1, etc. At each scan line ys, there is aleftmost pixel xleft and a rightmost pixel xright. The toler moves from xleft to xright, placing the desiredcolor in each pixel. The tiler is implemented as a simple double loop:
Flat Shading
When a face is flat, like a roof and the light sources are distant , the diffuse light component varieslittle over different points on the roof. In such cases we use the same color for every pixel covered by theface. OpenGL offers a rendering mode in which the entire face is drawn with the same color. In thismode, although a color is passed down the pipeline as part of each vertex of the face, the paintingalgorithm uses only one color value. So the command
find the color c for this pixel is not inside the loops, but appears before the loop, setting c to the colorof one of the vertices. Flat shading is invoked in OpenGL using the command

CS 2401 IV/VII CSE
55 K UMA MAHESWARI 2015-2016
glShadeModel(GL_FLAT);
Smooth ShadingSmooth shading attempts to de-emphasize edges between faces by computing colors at more
points on each face. The two types of smooth shadingGouraud shadingPhong shading
Gouraud Shading
Gouraud shading computes a different value of c for each pixel. For the scan line ys in the fig. , itfinds the color at the leftmost pixel, colorleft, by linear interpolation of the colors at the top and bottom ofthe left edge of the polygon. For the same scan line the color at the top is color4, and that at the bottom iscolor1, so colorleft will be calculated as
colorleft = lerp(color1, color4,f), ----------(1) where the fraction varies between 0 and 1 as ys varies fromybott to y4.
The eq(1) involves three calculations since each color quantity has a red, green and blue component.Colorright is found by interpolating the colors at the top and bottom of the right edge. The tiler then fillsacross the scan line , linearly interpolating between colorleft and colorright to obtain the color at pixel x:C(x) = lerp To increase the efficiency of the fill, this color is computed incrementally at each pixel . thatis there is a constant difference between c(x+1) and c(x) so that.
Phong Shading
Highlights are better reproduced using Phong Shading. Greater realism can be achieved with regardto highlights on shiny objects by a better approximation of the normal vector to the face at each pixel thistype of shading is called as Phong Shading.
SIGNIFICANCE:
Different objects require different shading effects. In the modeling process we attached anormal vector to each vertex of each face.

CS 2401 IV/VII CSE
56 K UMA MAHESWARI 2015-2016
4.3.ADDING TEXTURE TO FACES
CONCEPTS:
various faces of a mesh object.The basic technique begins with some texture function, texture(s,t) in texture space , which has twoparameters s and t. The function texture(s,t) produces a color or intensity value for each value of s and tbetween 0(dark)and 1(light). The two common sources of textures areBitmap TexturesProcedural Textures
Bitmap Textures
Textures are formed from bitmap representations of images, such as digitized photo.
Such a representation consists of an
array txtr[c][r] of color values. If the array has C columns and R rows, the indices c and r vary from 0 toC-1 and R-1 resp.,.
The function texture(s,t) accesses samples in the array as in the code: Color3 texture (float s, float t) {return txtr[ (int) (s * C)][(int) (t * R)]; } Where Color3 holds an RGB triple.
Adding Texture Coordinates to Mesh Objects
A mesh objects has three listsThe vertex listThe normal vector listThe face list
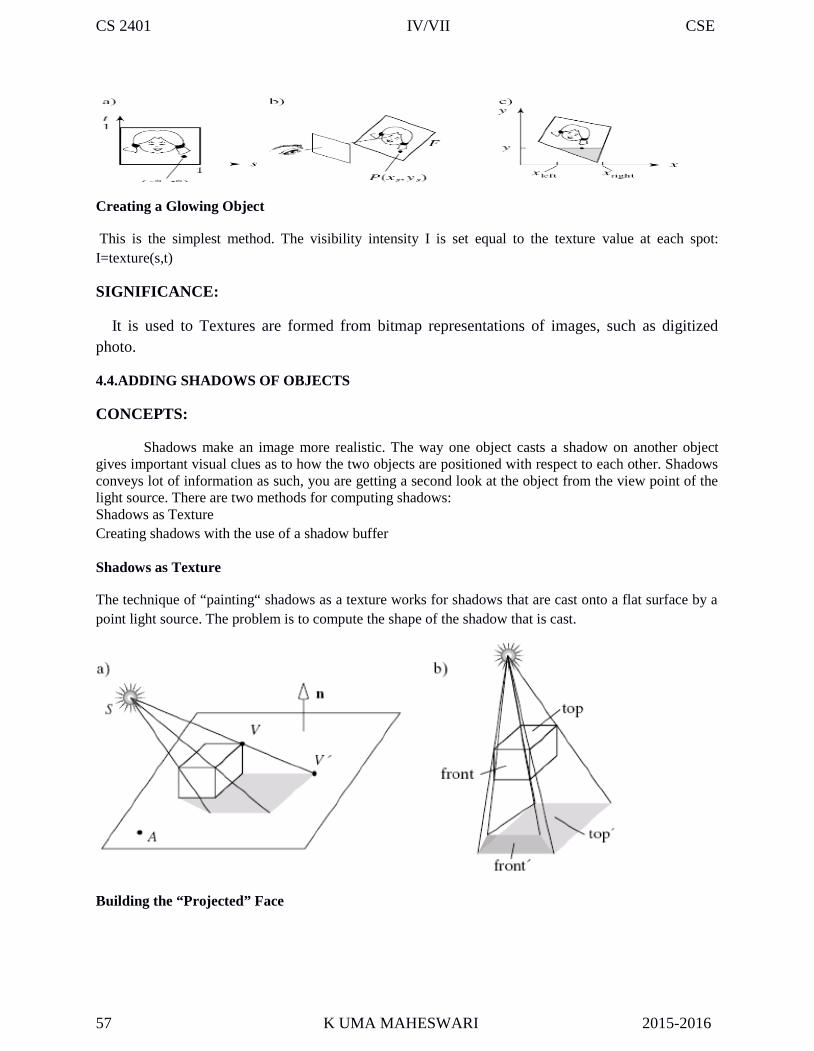
CS 2401 IV/VII CSE
57 K UMA MAHESWARI 2015-2016
Creating a Glowing Object
This is the simplest method. The visibility intensity I is set equal to the texture value at each spot:I=texture(s,t)
SIGNIFICANCE:
It is used to Textures are formed from bitmap representations of images, such as digitizedphoto.
4.4.ADDING SHADOWS OF OBJECTS
CONCEPTS:
Shadows make an image more realistic. The way one object casts a shadow on another objectgives important visual clues as to how the two objects are positioned with respect to each other. Shadowsconveys lot of information as such, you are getting a second look at the object from the view point of thelight source. There are two methods for computing shadows:Shadows as TextureCreating shadows with the use of a shadow buffer
Shadows as Texture
The technique of “painting“ shadows as a texture works for shadows that are cast onto a flat surface by apoint light source. The problem is to compute the shape of the shadow that is cast.
Building the “Projected” Face

CS 2401 IV/VII CSE
58 K UMA MAHESWARI 2015-2016
To make the new face F produced by F, we project each of the vertices of F onto the plane. Supposethat the plane passes through point A and has a normal vector n. Consider projecting vertex V, producingV . V is the point where the ray from source at S through V hits the plane, this point is
Creating Shadows with the use of a Shadow buffer
This method uses a variant of the depth buffer that performs the removal of hidden surfaces. An auxiliarysecond depth buffer called a shadow buffer is used for each light source. This requires lot of memory.This method is based on the principle that any points in a scene that are hidden from the light source mustbe in shadow. If no object lies between a point and the light source, the point is not in shadow. Theshadow buffer contains a depth picture of the scene from the point of view of the light source. Each of theelements of the buffer records the distance from the source to the closest object in the associateddirection. Rendering is done in two stages:
1) Loading the shadow buffer
The shadow buffer is initialized with 1.0 in each element, the largest pseudodepth possible.Then through a camera positioned at the light source, each of the scene is rasterized but only thepseudodepth of the point on the face is tested. Each element of the shadow buffer keeps track of thesmallest pseudodepth seen so far. ).( ) .( ) ( ' SV n S A n S V S V
2) Rendering the scene
Each face in the scene is rendered using the eye camera. Suppose the eye camera sees point Pthrough pixel p[c][r]. When rendering p[c][r], we need to findthe pseudodepth D from the source to pthe index location [i][j] in the shadow buffer that is to be tested andthe value d[i][j] stored in the shadow buffer
SIGNIFICANCE:
Shadows make an image more realistic. The way one object casts a shadow on another object givesimportant visual clues as to how the two objects are positioned with respect to each other.

CS 2401 IV/VII CSE
59 K UMA MAHESWARI 2015-2016
4.5.BUILDING A CAMERA IN A PROGRAM
CONCEPTS:
To have a finite control over camera movements, we create and manipulate our own camera in a program.After each change to this camera is made, the camera tells OpenGL what the new camera is. We create aCamera class that does all things a camera does. In a program we create a Camera object called cam, andadjust it with functions such as the following:
cam.set(eye, look, up); //
initialize the camera cam.slide(-1, 0, -2); //slide the camera forward and to the
left cam.roll(30); // roll it through 30 degree cam.yaw(20); // yaw it through 20 degree
Flying the cameraThe user flies the camera through a scene interactively by pressing keys or clicking the mouse.
For instance,pressing u will slide the camera up some amountpressing y will yaw the camera to the leftpressing f will slide the camera forwardThe user can see different views of the scene and then changes the camera to a better view and produce apicture. Or the user can fly around a scene
taking different snapshots. If the snapshots are stored and then played back, an animation is producedof the camera flying around the scene. There are six degrees of freedom for adjusting a camera: It can beslid in three dimensions and it can be rotated about any of three coordinate axes.
Sliding the Camera
Sliding the camera means to move it along one of its own axes that is, in the u, v and n directionwithout rotating it. Since the camera is looking along the negative n axis, movement along n is forward orback. Movement along u is left or right and along v is up or down. To move the camera a distance Dalong its u axis, set eye to eye + Du. For convenience ,we can combine the three possible slides in a singlefunction: slide(delU, delV, delN) slides the camera amount delU along u, delV along v and delN along n.The code is as follows:
void Camera : : slide(float delU, float delV, float delN)
{ eye.x += delU * u.x + delV * v.x + delN * n.x; eye.y += delU * u.y + delV * v.y + delN * n.y; eye.z +=delU * u.z + delV * v.z + delN * n.z; setModelViewMatrix(); }
Two new axes are formed u and v that lie in the same plane as u and v, and have been rotated throughthe angle α radians. We form u as the appropriate linear combination of u and v and similarly for v :u = cos (α)u + sin(α)v ; v = -sin (α)u + cos(α)v
CS 2401 IV/VII CSE
60 K UMA MAHESWARI 2015-2016
SIGNIFICANCE:
we create and manipulate our own camera in a program. After each change to this camera ismade, the camera tells OpenGL
4.6.RENDERING TEXTURES
CONCEPTS:
A simple method for adding surface detail is the model structure and patterns with polygon facets.For large scale detail, polygon modeling can give good results. Also we could model an irregular surfacewith small, randomly oriented polygon facets, provided the facets were not too small.
Surface pattern polygons are generally overlaid on a larger surface polygon and are processed withthe parent s surface.
Only the parent polygon is processed by the visible surface algorithms, but the illuminationparameters for the surfac3e detail polygons take precedence over the parent polygon. When fine surfacedetail is to be modeled, polygon are not practical.
4.7.CREATING SHADED OBJECTS & DRAWING SHADOWS
CONCEPTS:
To find where the ray S + ct intersects the surface, we substitute S + ct for P in F(P) (the explicit form ofthe shape) d(t) = f(S + ct) This function ispositive at these values of t for which the ray is outside the object.zero when the ray coincides with the surface of the object andnegative when the ray is inside the surface.
The generic torus has the implicit function as F(P) = (Px2+Py2 ) - d)2 + Pz2 – 1
Creating An Image By Means of Iterative Function Systems
Another way to approach infinity is to apply a transformation to a picture again and again andexamine the results. This technique also provides an another method to create fractal shapes.
An Experimental Copier
We take an initial image I0 and put it through a special photocopier that produces a new image I1. I1is not a copy of I0 rather it is a superposition of several reduced versions of I0. We then take I1 and feed itback into the copier again, to produce image I2. This process is repeated , obtaining a sequence of imagesI0, I1, I2,… called the orbit of I0. Making new copies from old
Underlying Theory of the Copying Process
Each lens in the copier builds an image by transforming every point in the input image and drawing iton the output image. A black and white image I can be described simply as the set of its black points: I =set of all black points = { (x,y) such that (x,y) is colored black }

CS 2401 IV/VII CSE
61 K UMA MAHESWARI 2015-2016
I is the input image to the copier.Then the ith lens characterized by transformation Ti, builds a new set of points we denote as Ti(I) andadds them to the image being produced at the current iteration. Each added set Ti(I) is the set of alltransformed pointsI: Ti(I) = { (x’,y’) such that (x’,y’) = Ti(P) for some point P in I } Upon superposing the three
transformed images, we obtain the output image as the union of the outputs from the three lenses:Output image = T1(I) U T2(I) U T3(I)
The overall mapping from input image to output image as W(.). It maps one set of points – oneimage – into another and is given by:W(.)=T1(.) U T2(.) U T3(.)
For instance the copy of the first image I0 is the set W(I0). Each affine map reduces the size of its imageat least slightly, the orbit converge to a unique image called the attractor of the IFS. We denote theattractor by the set A, some of its important properties are:1. The attractor set A is a fixed point of the mapping W(.), which we write as W(A)=A. That is putting Athrough the copier again produces exactly the same image A.
The iterates have already converged to the set A, so iterating once more makes no difference.2. Starting with any input image B and iterating the copying process enough times, we find that the orbitof images always converges to the same A.
If Ik = W (k)(B) is the kth iterate of image B, then as k goes to infinity Ik becomes indistinguishable fromthe attractor A.
Drawing the kth Iterate
We use graphics to display each of the iterates along the orbit. The initial image I0 can be set, buttwo choices are particularly suited to the tools developed:I0 is a polyline. Then successive iterates are collections of polylines.I0 is a single point. Then successive iterates are collections of points.
Using a polyline for I0 has the advantage that you can see how each polyline is reduced in size ineach successive iterate. But more memory and time are required to draw each polyline and finally eachpolyline is so reduced as to be indistinguishable from a point. Using a single point for I0 causes eachiterate to be a set of points, so it is straight forward to store these in a list. Then if IFS consists of N affinemaps, the first iterate I1 consists of N points, image I2 consists of N2 points, I3 consists of N3 points, etc.
SIGNIFICANCE:
It is used to create a shaded realistic images and objects
APPLICATIONS:
1.To make a camera
2.To implement Real objects

CS 2401 IV/VII CSE
62 K UMA MAHESWARI 2015-2016
UNIT V FRACTALS
Fractals and Self similarity – Peano curves – Creating image by iterated functions –Mandelbrotsets – Julia Sets – Random Fractals – Overview of Ray Tracing –Intersecting rays with otherprimitives – Adding Surface texture – Reflections and Transparency – Boolean operations onObjects
PREREQUISITE DISCUSSION:
This unit give brief explanation about fractals, Peanocurves, and ray tracing
5.1.FRACTALS AND SELF-SIMILARITY
CONCEPTS:Many of the curves and pictures have a particularly important property called self-similar. This meansthat they appear the same at every scale: No matter how much one enlarges a picture of the curve, it hasthe same level of detail. Some curves are exactly self-similar, whereby if a region is enlarged theenlargement looks exactly like the original. Other curves are statistically self-similar, such that thewiggles and irregularities in the curve are the same “on the average”, no matter how many times thepicture is enlarged. Example: Coastline.
Successive Refinement of Curves
A complex curve can be fashioned recursively by repeatedly “refining” a simple curve. The simplestexample is the Koch curve, discovered in1904 by the Swedish mathematician Helge von Koch. The curveproduces an infinitely long line within a region of finite area. Successive generations of the Koch curveare denoted K0, K1, K2….The zeroth generation shape K0 is a horizontal line of length unity
To create K1 , divide the line K0 into three equal parts and replace the middle section with atriangular bump having sides of length 1/3. The total length of the line is 4/3. The second order curve K2,is formed by building a bump on each of the four line segments of K1. To form Kn+1 from Kn: Subdivideeach segment of Kn into three equal parts and replace the middle part with a bump in the shape of anequilateral triangle.In this process each segment is increased in length by a factor of 4/3, so the total length of the curve is 4/3larger than that of the previous generation. Thus Ki has total length of (4/3)i , which increases as iincreases. As i tends to infinity, the length of the curve becomes infinite..

CS 2401 IV/VII CSE
63 K UMA MAHESWARI 2015-2016
SIGNIFICANCE:
It gives the clear view of particular picture.
5.2.PEANO CURVES
CONCEPTS:
UNDERLYING THEORY OF THE COPYING PROCESS :
Each lens in the copier builds an image by transforming every point in the input image and drawing it onthe output image. A black and white image I can be described simply as the set of its black points: I = setof all black points = { (x,y) such that (x,y) is colored black } I is the input image to the copier. Then theith lens characterized by transformation Ti, builds a new set of points we denote as Ti(I) and adds them tothe image being produced at the current iteration. Each added set Ti(I) is the set of all transformed pointsI: Ti(I) = { (x’,y’) such that (x’,y’) = Ti(P) for some point P in I } Upon superposing the threetransformed images, we obtain the output image as the union of the outputs from the three lenses: Outputimage = T1(I) U T2(I) U T3(I) The overall mapping from input image to output image as W(.). It mapsone set of points – one image – into another and is given by: W(.)=T1(.) U T2(.) U T3(.) For instance thecopy of the first image I0 is the set W(I0).
1. The attractor set A is a fixed point of the mapping W(.), which we write as W(A)=A. That is putting Athrough the copier again produces exactly the same image A.The iterates have already converged to the set A, so iterating once more makes no difference.2. Starting with any input image B and iterating the copying process enough times, we find that the orbitof images always converges to the same A.
If Ik = W (k)(B) is the kth iterate of image B, then as k goes to infinity Ik becomes indistinguishable fromthe attractor A.
5.3.CREATING IMAGE BY ITERATED FUNCTIONS
CONCEPTS:
Another way to approach infinity is to apply a transformation to a picture again and again and examinethe results. This technique also provides an another method to create fractal shapes.
An Experimental Copier
We take an initial image I0 and put it through a special photocopier that produces a new image I1. I1is not a copy of I0 rather it is a superposition of several reduced versions of I0. We then take I1 and feed itback into the copier again, to produce image I2. This process is repeated , obtaining a sequence of imagesI0, I1, I2,… called the orbit of I0. Making new copies from old
CS 2401 IV/VII CSE
64 K UMA MAHESWARI 2015-2016
Underlying Theory of the Copying Process
Each lens in the copier builds an image by transforming every point in the input image anddrawing it on the output image. A black and white image I can be described simply as the set of its blackpoints: I = set of all black points = { (x,y) such that (x,y) is colored black } I is the input image to thecopier. Then the ith lens characterized by transformation Ti, builds a new set of points we denote as Ti(I)and adds them to the image being produced at the current iteration. Each added set Ti(I) is the set of alltransformed pointsI: Ti(I) = { (x’,y’) such that (x’,y’) = Ti(P) for some point P in I } Upon superposing the threetransformed images, we obtain the output image as the union of the outputs from the three lenses:Output image = T1(I) U T2(I) U T3(I) The overall mapping from input image to output image as W(.).It maps one set of points – one image – into another and is given by: W(.)=T1(.) U T2(.) U T3(.) Forinstance the copy of the first image I0 is the set W(I0). Each affine map reduces the size of its image atleast slightly, the orbit converge to a unique image called the attractor of the IFS. We denote the attractorby the set A, some of its important properties are:1. The attractor set A is a fixed point of the mapping W(.), which we write as W(A)=A. That is putting Athrough the copier again produces exactly the same image A.
The iterates have already converged to the set A, so iterating once more makes no difference.2. Starting with any input image B and iterating the copying process enough times, we find that the orbitof images always converges to the same A.
If Ik = W (k)(B) is the kth iterate of image B, then as k goes to infinity Ik becomes indistinguishable fromthe attractor A.
Drawing the kth Iterate
We use graphics to display each of the iterates along the orbit. The initial image I0 can be set, but twochoices are particularly suited to the tools developed:I0 is a polyline. Then successive iterates are collections of polylines.I0 is a single point. Then successive iterates are collections of points.
Using a polyline for I0 has the advantage that you can see how each polyline is reduced in size in eachsuccessive iterate. But more memory and time are required to draw each polyline and finally eachpolyline is so reduced as to be indistinguishable from a point. Using a single point for I0 causes eachiterate to be a set of points, so it is straight forward to store these in a list. Then if IFS consists of N affinemaps, the first iterate I1 consists of N points, image I2 consists of N2 points, I3 consists of N3 points, etc.Copier Operation pseudocode(recursive version)
SIGNIFICANCE:
This technique also provides an another method to create fractal shapes.
5,.4.THE MANDELBROT SET
CONCEPTS:Graphics provides a powerful tool for studying a fascinating collection of sets that are the most
complicated objects in mathematics. Julia and Mandelbrot sets arise from a branch of analysis known as

CS 2401 IV/VII CSE
65 K UMA MAHESWARI 2015-2016
iteration theory, which asks what happens when one iterates a function endlessly. Mandelbrot usedcomputer graphics to perform experiments.
A view of the Mandelbrot set is shown in the below figure. It is the black inner portion, whichappears to consist of a cardoid along with a number of wartlike circles glued to it.
The IFS uses the simple function f(z) = z2 + c -------------------------------(1) where c is someconstant. The system produces each output by squaring its input and adding c. We assume that the processbegins with the starting value s, so the system generates the sequence of values or orbit d1= (s)2 + c d2=((s)2 + c)2 + c d3= (((s)2 + c)2 + c)2 + c d4= ((((s)2 + c)2 + c)2 + c)2 + c ------------------------------(2)The orbit depends on two ingredientsthe starting point sthe given value of c
Given two values of s and c how do points dk along the orbit behaves as k gets larger and larger?Specifically, does the orbit remain finite or explode. Orbits that remain finite lie in their correspondingJulia or Mandelbrot set, whereas those that explode lie outside the set.When s and c are chosen to be complex numbers , complex arithmetic is used each time the function is
applied.
The Mandelbrot and Julia sets live in the complex plane – plane of complex numbers.The IFS works well with both complex and real numbers.Both s and c are complex numbers and at each iteration we square the previous result and add c. Squaringa complex number z = x + yi yields the new complex number: ( x + yi)2 = (x2 – y2) + (2xy)i ----------------------------------(3) having real part equal to x2 – y2 and imaginary part equal to 2xy.
Some Notes on the Fixed Points of the System It is useful to examine the fixed points of the system f(.)=(.)2 + c . The behavior of the orbits depends on these fixed points that is those complex numbers z thatmap into themselves, so that z2 + c = z. This gives us the quadratic equation z2 – z + c = 0 and the fixedpoints of the system are the two solutions of this equation, given by p+, p- = --------------------------------(4) If an orbit reaches a fixed point, p its gets trapped there forever. The fixed point can be characterizedas attracting or repelling. If an orbit flies close to a fixed point p, the next point along the orbit will be forced c 41 21closer to p if p is an attracting fixed pointfarther away from p if p is a repelling a fixed point.
If an orbit gets close to an attracting fixed point, it is sucked into the point. In contrast, a repelling fixedpoint keeps the orbit away from it.
Defining the Mandelbrot Set
The Mandelbrot set considers different values of c, always using the starting point s =0. For eachvalue of c, the set reports on the nature of the orbit of 0, whose first few values are as follows: orbit of 0:0, c, c2+c, (c2+c)2+c, ((c2+c)2+c)2 +c,…….. For each complex number c, either the orbit is finite so thathow far along the orbit one goes, the values remain finite or the orbit explodes that is the values get largerwithout limit. The Mandelbrot set denoted by M, contains just those values of c that result in finite orbits:The point c is in M if 0 has a finite orbit.The point c is not in M if the orbit of 0 explodes.

CS 2401 IV/VII CSE
66 K UMA MAHESWARI 2015-2016
5.5.JULIA SETS
CONCEPTS:Like the Mandelbrot set, Julia sets are extremely complicated sets of points in the complex plane. There isa different Julia set, denoted Jc for each value of c. A closely related variation is the filled-in Julia set,denoted by Kc, which is easier to define.
The Filled-In Julia Set Kc
In the IFS we set c to some fixed chosen value and examine what happens for different starting points. We ask how the orbit of starting point s behaves. Either it explodes or it doesn t. If it is finite , we saythe starting point s is in Kc, otherwise s lies outside of Kc. Definition: The filled-in Julia set at c, Kc, isthe set of all starting points whose orbits are finite. When studying Kc, one chooses a single value for cand considers different starting points. Kc should be always symmetrical about the origin, since the orbitsof s and –s become identical after one iteration.
Drawing Filled-in Julia Sets
A starting point s is in Kc, depending on whether its orbit is finite or explodes, the process ofdrawing a filled-in Julia set is almost similar to Mandelbrot set. We choose a window in the complexplane and associate pixels with points in the window.
The pixels correspond to different values of the starting point s. A single value of c is chosen andthen the orbit for each pixel position is examined to see if it explodes and if so, how quickly does itexplodes.
Pseudocode for drawing a region of the Filled-in Julia set for(j=0; j<rows; j++) for(i=0; i<cols;i++) { find the corresponding s value in equation (5)
estimate the dwell of the orbit find Color determined by estimated dwell setPixel( j , k, Color); } Thedwell() must be passed to the starting point s as well as c.
Making a high-resolution image of a Kc requires a great deal of computer time, since a complexcalculation is associated with every pixel. 5.5.3 Notes on Fixed Points and Basins of Attraction
If an orbit starts close enough to an attracting fixed point, it is sucked into that point. If it startstoo far away, it explodes. The set of points that are sucked in forms a so called basin of attraction for thefixed point p. The set is the filled-in Julia set Kc.
The fixed point which lies inside the circle |z|= ½ is the attracting point. All points inside Kc,have orbits that explode. All points inside Kc, have orbits that spiral or plunge into the attracting fixedpoint. If the starting point is inside Kc, then all of the points on the orbit must also be inside Kc and theyproduce a finite orbit. The repelling fixed point is on the boundary of Kc.Kc for Two Simple Cases
The set Kc is simple for two values of c: 1. c=0: Starting at any point s, the orbit is simply s,s2,s4,…….,s2k,…, so the orbit spirals into 0 if |s|<1 and explodes if |s|>1. Thus K0 is the set of allcomplex numbers lying inside the unit circle, the circle of radius 1 centered at the origin. 2. c = -2: in thiscase it turns out that the filled-in Julia set consists of all points lying on the real axis between -2 and 2.For all other values of c, the set Kc, is complex. It has been shown that each Kc is one of the two types:Kc is connected or

CS 2401 IV/VII CSE
67 K UMA MAHESWARI 2015-2016
Kc is a Cantor set
A theoretical result is that Kc is connected for precisely those values of c that lie in theMandelbrot set.
The Julia Set Jc Julia Set Jc is for any given value of c; it is the boundary of Kc. Kc is the set ofall starting points that have finite orbits and every point outside Kc has an exploding orbit. We say thatthe points just along the boundary of Kc and “on the fence”.
Inside the boundary all orbits remain finite; just outside it, all orbits goes to infinity.
Preimages and Fixed Points If the process started instead at f(s), the image of s, then the twoorbits would be: s, f(s), f2(s), f3(s),…. (orbit of s) or f(s), f2(s), f3(s), f4(s),…. (orbit of f(s)) which havethe same value forever. If the orbit of s is finite, then so is the orbit of its image f(s).
All of the points in the orbit , if considered as starting points on their own, have orbits with thewsame behavior: They all are finite or they all explode. Any starting point whose orbit passes through s hasthe same behavior as the orbit that start at s: The two orbits are identical forever. The point “just before”s in the sequence is called the preimage of s and is the inverse of the function f(.) = (.)2 + c. The inverseof f(.) is , so we have two preimages of z are given by ------------------(6) c z c z
5.6.RANDOM FRACTALS
CONCEPTS:
Fractal is the term associated with randomly generated curves and surfaces that exhibit a degreeof self-similarity. These curves are used to provide “naturalistic” shapes for representing objects such ascoastlines, rugged mountains, grass and fire.
Fractalizing a Segment
The simplest random fractal is formed by recursively roughening or fractalizing a line segment.At each step, each line segment is replaced with a “random elbow”. The figure shows this process appliedto the line segment S having endpoints A and B. S is replaced by the two segments from A to C and fromC to B. For a fractal curve, point C is randomly chosen along the perpendicular bisector L of S. Theelbow lies randomly on one or the other side of the “parent” segment AB.
Three stages are required in the fractalization of a segment. In the first stage, the midpoint of AB isperturbed to form point C. In the second stage , each of the two segment has its midpoints perturbed toform points D and E. In the third and final stage, the new points F…..I are added.
To perform fractalization in a program Line L passes through the midpoint M of segment S and isperpendicular to it. Any point C along L has the parametric form:
SIGNIFICANCE:
To Generate a fractalizing Segments in a picture.

CS 2401 IV/VII CSE
68 K UMA MAHESWARI 2015-2016
5.7.INTERSECTING RAYS WITH OTHER PRIMITIVES
CONCEPTS:
First the ray is transformed into the generic coordinates of the object and then the various intersectionwith the generic object are computed.1) Intersecting with a Square
The generic square lies in the z=0 plane and extends from -1 to 1 in both x and y. The square canbe transformed into any parallelogram positioned in space, so it is often used in scenes to provide this, flatsurfaces such as walls and windows. The function hit(1) first finds where the ray hits the generic planeand then test whether this hit spot also lies within the square.
2) Intersecting with a Tapered Cylinder
The side of the cylinder is part of an infinitely long wall with a radius of L at z=0,and a smallradius of S at z=1.This wall has the implicit form as F(x, y, z)=x2 + y2- (1 + (S - 1) z)2, for 0 < z < 1 IfS=1, the shape becomes the generic cylinder, if S=0 , it becomes the generic cone. We develop a hit ()method for the tapered cylinder, which also provides hit() method for the cylinder and cone. 3)Intersecting with a Cube (or any Convex Polyhedron) The convex polyhedron, the generic cubedeserves special attention. It is centered at the origin and has corner at (±1, ±1, ±1) using all rightcombinations of +1 and -1.Thus,its edges are aligned with coordinates axes, and its six faces lie in theplan. The generic cube is important for two reasons.A large variety of intersecting boxes can be modeled and placed in a scene by applying an affinetransformation to a generic cube. Then, in ray tracing each ray routine. can be inverse transformed intothe generic cube s coordinate system and we can use a ray with generic cube intersection
5.8.ADDING SURFACE TEXTURE
CONCEPTS:
A fast method for approximating global illumination effect is environmental mapping. Anenvironment array is used to store background intensity information for a scene. This array is thenmapped to the objects in a scene based on the specified viewing direction.
This is called as environment mapping or reflection mapping. To render the surface of an object,we project pixel areas on to surface and then reflect the projected pixel area on to the environment map topick up the surface shading attributes for each pixel. If the object is transparent, we can also refract theprojected pixel are also the environment map. The environment mapping process for reflection of aprojected pixel area is shown in figure.
Pixel intensity is determined by averaging the intensity values within the intersected region ofthe environment map. A simple method for adding surface detail is the model structure and patterns withpolygon facets. For large scale detail, polygon modeling can give good results. Also we could model anirregular surface with small, randomly oriented polygon facets, provided the facets were not too small.Surface pattern polygons are generally overlaid on a larger surface polygon and are processed with theparent s surface.

CS 2401 IV/VII CSE
69 K UMA MAHESWARI 2015-2016
Only the parent polygon is processed by the visible surface algorithms, but the illuminationparameters for the surfac3e detail polygons take precedence over the parent polygon. When fine surfacedetail is to be modeled, polygon are not practical.
Texture Mapping
A method for adding surface detail is to map texture patterns onto the surfaces of objects. Thetexture pattern may either be defined in a rectangular array or as a procedure that modifies surfaceintensity values. This approach is referred to as texture mapping or pattern mapping.
The texture pattern is defined with a rectangular grid of intensity values in a texture spacereferenced with (s,t) coordinate values. Surface positions in the scene are referenced with UV objectspace coordinates and pixel positions on the projection plane are referenced in xy Cartesian coordinates.
Texture mapping can be accomplished in one of two ways. Either we can map the texture patternto object surfaces, then to the projection plane, or we can map pixel areas onto object surfaces then totexture space. Mapping a texture pattern to pixel coordinates is sometime called texture scanning, whilethe mapping from pixel coordinates to texture space is referred to as pixel order scanning or inversescanning or image order scanning.
often specified with parametric linear functions U=fu(s,t)=au s+ but + cu V=fv(s,t)=av s+ bvt + cv Theobject to image space mapping is accomplished with the concatenation of the viewing and projectiontransformations. A disadvantage of mapping from texture space to pixel space is that a selected texturepatch usually does not match up with the pixel boundaries, thus requiring calculation of the fractional areaof pixel coverage. Therefore, mapping from pixel space to texture space is the most commonly usedtexture mapping method. This avoids pixel subdivision calculations, and allows anti aliasing proceduresto be easily applied. The mapping from image space to texture space does require calculation of theinverse viewing projection transformation mVP -1 and the inverse texture map transformation mT -1
Procedural Texturing Methods
Next method for adding surface texture is to use procedural definitions of the color variations thatare to be applied to the objects in a scene. This approach avoids the transformation calculations involvedtransferring two dimensional texture patterns to object surfaces. When values are assigned throughout aregion of three dimensional space, the object color variations are referred to as solid textures. Values fromtexture space are transferred to object surfaces using procedural methods, since it is usually impossible tostore texture values for all points throughout a region of space (e.g) Wood Grains or Marble patternsBump Mapping. Although texture mapping can be used to add fine surface detail, it is not a good methodfor modeling the surface roughness that appears on objects such as oranges, strawberries and raisins. Theillumination detail in the texture pattern usually does not correspond to the illumination direction in thescene.
A better method for creating surfaces bumpiness is to apply a perturbation function to the surfacenormal and then use the perturbed normal in the illumination model calculations. This technique is calledbump mapping. If P(u,v) represents a position on a parameter surface, we can obtain the surface normalat that point with the calculation N = Pu × Pv Where Pu and Pv are the partial derivatives of P withrespect to parameters u and v. To obtain a perturbed normal, we modify the surface position vector byadding a small perturbation function called a bump function. P’(u,v) = P(u,v) + b(u,v) n. This addsbumps to the surface in the direction of the unit surface normal n=N/|N|. The perturbed surface normal is

CS 2401 IV/VII CSE
70 K UMA MAHESWARI 2015-2016
then obtained as N'=Pu' + Pv' We calculate the partial derivative with respect to u of the perturbedposition vector as Pu' = _∂_(P + bn) ∂u = Pu + bu n + bnu Assuming the bump function b is small, we canneglect the last term and write p u' ≈ pu + bun Similarly p v'= p v + b v n. and the perturbed surfacenormal is N' = Pu + Pv + b v (Pu x n ) + bu ( n x Pv ) + bu bv (n x n). But n x n =0, so that N' = N + bv (Pu x n) + bu ( n x Pv) The final step is to normalize N' for use in the illumination model calculations.
SIGNIFICANCE:
A better method for creating surfaces bumpiness is to apply a perturbation function to the surfacenormal and then use the perturbed normal in the illumination model calculations
5.9. REFLECTIONS AND TRANSPERENCY
CONCEPTS:
The great strengths of the ray tracing method is the ease with which it can handle both reflectionand refraction of light. This allows one to build scenes of exquisite realism, containing mirrors, fishbowls,lenses and the like.
There can be multiple reflections in which light bounces off several shiny surfaces beforereaching the eye or elaborate combinations of refraction and reflection. Each of these processes requiresthe spawnins and tracing of additional rays.shows a ray emanating, from the eye in the direction dir and hitting a surface at the point Ph. when thesurface is mirror like or transparent, the light I that reaches the eye may have 5 components I=Iamb +Idiff + Ispec + Irefl + Itran The first three are the fan=miler ambient, diffuse and specular contributions.
The diffuse and specular part arise from light sources in the environment that are visible at Pn.Iraft is the reflected light component ,arising from the light , Ik that is incident at Pn along the direction –r. This direction is such that the angles of incidence and reflection are equal,so R=dir-2(dir.m)m Wherewe assume that the normal vector m at Ph has been normalized.
Similarly Itran is the transmitted light components arising from the light IT that is transmittedthorough the transparent material to Ph along the direction –t. A portion of this light passes through thesurface and in so doing is bent, continuing its travel along –dir. The refraction direction + depends onseveral factors.
I is a sum of various light contributions, IR and IT each arise from their own fine components –ambient, diffuse and so on. IR is the light that would be seen by an eye at Ph along a ray from P to Pn.To determine IR, we do in fact spawn a secondary ray from Pn in the direction r, find the first object ithits and then repeat the same computation of light component. Similarly IT is found by casting a ray inthe direction t and seeing what surface is hit first, then computing the light contributions.
The Refraction of Light
When a ray of light strikes a transparent object, apportion of the ray penetrates the object. The raywill change direction from dir to + if the speed of light is different in medium 1 than in medium 2. If theangle of incidence of the ray is θ1, Snell s law states that the angle of refraction will besin(θ2) = sin(θ1) C2 C1 where C1 is the spped of light in medium 1 and C2 is the speed of light inmedium 2. Only the ratio C2/C1 is important. It is often called the index of refraction of medium 2 withrespect to medium 1. Note that if θ1 ,equals zero so does θ2 .
CS 2401 IV/VII CSE
71 K UMA MAHESWARI 2015-2016
Light hitting an interface at right angles is not bent. In ray traving scenes that include transparentobjects, we must keep track of the medium through which a ray is passing so that we can determine thevalue C2/C1 at the next intersection where the ray either exists from the current object or enters anotherone.
This tracking is most easily accomplished by adding a field to the ray that holds a pointer to theobject within which the ray is travelling. Several design polices are used,1) Design Policy 1: No two transparent object may interpenetrate.2) Design Policy 2: Transparent object may interpenetrate.
5.10.COMPOUND OBJECTS: BOOLEAN OPERATIONS ON OBJECTS
CONCEPTS:
A ray tracing method to combine simple shapes to more complex ones is known as constructiveSolid Geometry(CSG). Arbitrarily complex shapes are defined by set operations on simpler shapes in aCSG. Objects such as lenses and hollow fish bowls, as well as objects with holes are easily formed bycombining the generic shapes. Such objects are called compound, Boolean or CSG objects. The Booleanoperators: union, intersection and difference are shown in the figure 5.17. Two compound objects buildfrom spheres. The intersection of two spheres is shown as a lens shape.
That is a point in the lens if and only if it is in both spheres. L is the intersection of the S1 and S2 iswritten as L=S1∩S2
sets A and B, denoted A-B,if it is in A and not in B.Applying the difference operation is analogous toremoving material to cutting or carrying.The bowl is specified by B=(S1-S2)-C. The solid globe, S1 ishollowed out by removing all the points of the inner sphere, S2,forming a hollow spherical shell.
The top is then opened by removing all points in the cone C. A point is in the union of two sets Aand B, denoted AUB, if it is in A or in B or in both. Forming the union of two objects is analogous togluing them together.
The union of two cones and two cylinders is shown as a rocket. R=C1 U C2 U C3 U C4. ConeC1 resets on cylinder C2.Cone C3 is partially embedded in C2 and resets on the fatter cylinder C4. 5.10.1Ray Tracing CSC objects Ray trace objects that are Boolean combinations of simpler objects.
The ray inside lens L from t3 to t2 and the hit time is t3.If the lens is opaque, the familiar shadingrules will be applied to find what color the lens is at the hit spot. If the lens is mirror like or transparentspawned rays are generated with the proper directions and are traced as shown in figure 5.18. Ray,firststrikes the bowl at t1,the smallest of the times for which it is in S1 but not in either S2 or C. Ray 2 on theother hand,first hits the bowl at t5.
Again this is the smallest time for which the ray is in S1,but in neither the other sphere nor thecone.The hits at earlier times are hits with components parts of the bowl,but not with the bowl itself.
Data Structure for Boolean objects Since a compound object is always the combination of twoother objects say obj1 OP Obj2, or binary tree structure provides a natural description. 5.10.3Intersecting Rays with Boolean Objects We need to be develop a hit() method to work each type of

CS 2401 IV/VII CSE
72 K UMA MAHESWARI 2015-2016
Boolean object.The method must form inside set for the ray with the left subtree,the inside set for the raywith the right subtree,and then combine the two sets appropriately. bool Intersection Bool::hit(ray inIntersection & inter){ Intersection lftinter,rtinter; if (ray misses the extends)return false; if (C) left−>hit(r,lftinter)||((right−>hit(r,rtinter))) return false; return (inter.numHits > 0); }Extent tests are first made to see if there is an early out.Then the proper hit() routing is called for the left subtree and unless the ray misses this subtree,the hit listrinter is formed.If there is a miss,hit() returns the value false immediately because the ray must hit dotsubtrees in order to hit their intersection.Then the hit list rtInter is formed. The code is similar for theunion Bool and DifferenceBool classes. For UnionBool::hit(),the two hits are formed using if((!left-)hit(r,lftInter))**(|right-)hit(r,rtinter))) return false; which provides an early out only if both hit lists areempty. For differenceBool::hit(),we use the code if((!left−>hit(r,lftInter)) return false;if(!right−>hit(r,rtInter)) { inter=lftInter; return true; } which gives an early out if the ray misses the leftsubtree,since it must then miss the whole object.
Building and using Extents for CSG object
The creation of projection,sphere and box extend for CSG object. During a preprocessing step,thetrue for the CSG object is scanned and extents are built for each node and stored within the node itself.During raytracing,the ray can be tested
against each extent encounted,with the potential benefit of an early out in the intersection process if itbecomes clear that the ray cannot hit the object.
SIGNIFICANCE:
Ray tracing method to combine simple shapes to more complex ones is known asconstructive Solid Geometry(CSG).
APPLICATIONS:
1.Implementing texture to a faces.
2.Implement a ray tracing method

CS 2401 IV/VII CSE
73 K UMA MAHESWARI 2015-2016
A.GLOSSARY:
DDA-DIGITAL DIFFERANSIAL ALGORITHMS
y=mx+b-Slope equations
SETPIXEL- Set the coordinates of the line
3D-Three Dimensional Transformations
Polygon Meshes -A single plane surface can be specified with a function such as fillArea.
octree-used for the viewing volume, hidden-surface elimination is accomplished by projecting
octree nodes onto the viewing surface in a front-to-back order.
edge table - contains coordinate endpoints for each line in-the scene, the inverse slope of eachlineFractals :Another way to approach infinity is to apply a transformation to a picture again and again andexamine the results. This technique also provides an another method to create fractal shapes.

CS 2401 IV/VII CSE
74 K UMA MAHESWARI 2015-2016
B.QUESTION BANKUNIT I
2D PRIMITIVES
1. Define Computer graphics.
Computer graphics remains one of the most existing and rapidly growing computerfields.Computer graphics may be defined as a pictorial representation or graphicalrepresentation of objects in a computer.
2. Define refresh buffer/frame buffer.
The memory area where in picture definition is stored is called Refreshbuffer. Thismemory area holds the set of intensity values for all the screen points. On a black andwhite system with one bit per pixel, the frame buffer is called a bitmap.
3. What is pixel?
Each screen point in a monitor is called a pixel/pel. It is also called picture element.
4. Define aspect ratio.It is a property of video monitors. This number gives the ratio of vertical points tohorizontal points necessary to produce equal-length lines in both directions on the screen.
5. What is Output Primitive?
Basic geometric structures that describe a scene are referred to as Output Primitives.Points and straight lines segments are the simplest geometric components of pictures.Additional output primitives that can be used to construct a picture include circles andother conic sections, quadric surfaces, spline curves and surfaces, polygon color areas, andcharacter strings.
6. What is DDA?
The Digital Differential Analyzer is a scan-conversion line algorithm based on calculatingeither difference in y-coordinate (dy) or difference in x-coordinate. We sample the line atunit intervals in one coordinate and determine corresponding integer values nearest theline path for the other coordinate.
7.What are the disadvantages of DDA algorithm?
Round-off error in successive additions of the floating-point increment can cause thecalculated pixel positions to drift away from the true line path for long line segments.

CS 2401 IV/VII CSE
75 K UMA MAHESWARI 2015-2016
Rounding operations and floating-point arithmetic in procedure are still time-consuming.
8. What is attribute parameter?
Any parameter that affects the way a primitive is to be displayed is referred to as anattribute parameter.
9. What are the basic line attributes?
Basic attributes of a straight line segment are its type, its width, and its color. 10. What ismeant by aliasing?
The distortion of information due to low frequency sampling (Under sampling) is calledaliasing. We can improve the appearance of displayed raster lines by applying antialiasingmethods that compensate for the under sampling process.11. Define Translation.
A translation is applied to an object by repositioning it along a straight line path from onecoordinate location to another. We translate a two-dimensional point by adding translationdistances, tx and ty, to original coordinate position (x, y) to move the point to a newposition (x', y'). x' = x + tx, y' = y + ty. The translation distance pair (tx, ty ) is called atranslation vector or shift vector.
12. Define Rotation.
A 2-D rotation is applied to an object by repositioning it \along a circular path in the xy plane.
13. Define Scaling.
A scaling transformation alters the size of an object. This operation can be carried out forpolygons by multiplying the coordinate values (x,y) of each vertex by scaling factors sxand sy to produce the transformed coordinates ( x', y' ). x' = x. sx, y' = y. sy.
14. Define Reflection.
A Reflection is a transformation that produces a mirror image of an object. The mirrorimage for a 2D reflection is generated relative to an axis of reflection by rotating theobject 180 degree about the reflection axis.
15. Define Shear.
A transformation that distorts the shape of an object such that the transformed shape

CS 2401 IV/VII CSE
76 K UMA MAHESWARI 2015-2016
appears as if the object were composed of internal layers that had been caused to slideover each other is called a shear.
16. Define Window.
A world-coordinate area selected for display is called a window
17. Define view port.
An area on a display device to which a window is mapped is called a view port.
18. What is viewing transformation?
The mapping of a part of a world-coordinate scene to device coordinates is referred to asviewing transformation.
19. Define Clipping.
Any procedure that identifies those portions of a picture that are either inside or outsideof a specified region of space is referred to as a clipping algorithm or simply clipping.The region against which an object is clipped is called a clip window.
20 What are the types of Clipping?
Point clipping
Line clipping
Area clipping
Curve clipping
Text clipping
21.What is the purpose of presentation graphics?
Presentation graphics is used to produce illustrations for reports or to generate 35-mmslides or transparencies for use with projectors. Presentation graphics is commonly usedto summarize financial, statical, mathematical, scientific, and economic data for researchreports, managerial reports, consumer information bulletins, and other types of reports.
22. What is frame buffer?

CS 2401 IV/VII CSE
77 K UMA MAHESWARI 2015-2016
Picture definition is stored in a memory area called frame buffer or refreshbuffer.
16.MARKS1. Explain DDA line drawing algorithm with Example2. Explain about midpoint ellipse drawing algorithm3.Explain about Bresenham’s and mid point circle Drawing Algorithm.4. Explain about clipping operations.
UNIT II
3D CONCEPTS1. Categorize the 3D representations?
Boundary representation (B-reps) and space-partitioning representations.
2. What Boundary representation?
It describes a 3D object as a set of surfaces that separate the object interior from theenvironment. e.g. polygon facets and spline patches.
3. What space-partitioning representation?
This is used to describe interior properties, by partitioning the spatial regioncontaining an object in to a set of small, non-overlapping, contiguous solids. e.g. octree.
4. What is Transformation?
Transformation is the process of introducing changes in the shape size and orientation ofthe object using scaling rotation reflection shearing & translation etc.
5. What is projection?
The process of displaying 3D objects on a 2D display is called as Projection.
6.What are the types of projection?Perspective projection Parallel projection
7.What is parallel projection?In a parallel projection, coordinate positions are transformed to the view plane alongparallel lines.
8. What is Perspective projection?For a perspective projection object positions are transformed to the view plane alonglines that converge to a point called the projection reference point

CS 2401 IV/VII CSE
78 K UMA MAHESWARI 2015-2016
9. Write short notes on active and passive transformations?In the active transformation the points x and x| represent different coordinates of the samecoordinate system. Here all the points are acted upon by the same transformation andhence the shape of the object is not distorted.
In a passive transformation the points x and x| represent same points in the space but in adifferent coordinate system. Here the change in the coordinates is merely due to thechange in the type of the user coordinate system.
10. What is scaling?The scaling transformations changes the shape of an object and can be carried out bymultiplying each vertex (x,y) by scaling factor Sx,Sy where Sx is the scaling factor of xand Sy is the scaling factor of y.
11. What is shearing?The shearing transformation actually slants the object along the X direction or the Ydirection as required.ie; this transformation slants the shape of an object along a requiredplane.
12. What is reflection?The reflection is actually the transformation that produces a mirror image of an object.For this use some angles and lines of reflection.
13. Distinguish between window port & view port?A portion of a picture that is to be displayed by a window is known as window port. Thedisplay area of the part selected or the form in which the selected part is viewed is knownas view port.14. Define clipping.
Clipping is the method of cutting a graphics display to neatly fit a predefined graphicsregion or the view port.
15. What is covering (exterior clipping)?
This is just opposite to clipping. This removes the lines coming inside the windows anddisplays the remaining. Covering is mainly used to make labels on the complex pictures.
16. What is the need of homogeneous coordinates?To perform more than one transformation at a time, use homogeneous coordinates ormatrixes. They reduce unwanted calculations intermediate steps saves time and memoryand produce a sequence of transformations.

CS 2401 IV/VII CSE
79 K UMA MAHESWARI 2015-2016
17. Distinguish between uniform scaling and differential scaling?When the scaling factors sx and sy are assigned to the same value, a uniform scaling isproduced that maintains relative object proportions. Unequal values for sx and sy result ina differential scaling that is often used in design application
18. What is fixed point scaling?
The location of a scaled object can be controlled by a position called the fixed point thatis to remain unchanged after the scaling transformation.
19. List out the various Text clipping?
All-or-none string clipping - if all of the string is inside a clip window, keep it otherwisediscards.
All-or-none character clipping – discard only those characters that are not completelyinside the window. Any character that either overlaps or is outside a window boundary isclipped.Individual characters – if an individual character overlaps a clip windowboundary, clip off the parts of the character that are outside the window.
20.What is the various representation schemes used in three dimensional objects?
Boundary representation (B-res) – describe the 3 dimensional objects as a set of surfacesthat separate the object interior from the environment.
Space- portioning representation – describe interior properties, by partitioning the spatialregion containing an object into a set of small, no overlapping, contiguous solids.
16 MARK QUESTIONS
1.Write a short notes on parallel and perspective projection.
2.What is viewing?Discuss their properties3.Explain in details about three dimensional Transformation4.Explain in briefly about viewing
UNIT-III

CS 2401 IV/VII CSE
80 K UMA MAHESWARI 2015-2016
COLOR MODELS1. What is color model?
A color model is a method for explaining the properties or behavior of colorwithin some context.
2,List out the properties that are perceive in a light source.
Hue
Brightness(luminance)
Purity(saturation)
3.How is the color expressed in XYZ color model? Any color is expressed as
C1=XX+YY+ZZ
X,Y, and Z represent vectors in 3D
X,Y, and Z designate the amounts of the standard primaries.
4.What is RGB color model?The RGB color model is an additive color model in which red,green andblue light is added together in various ways to reproduce a broad array of
colors.
5.How is RGB model represented?
RGB model is represented by a unit cube. The color is expressed as an RGBtriplet, each component of which can vary from 0 to 1.
6.What is YIQ color model?
YIQ is the color space used by the National Television System Committee colorTV system. It was designed to separate chrominance from luminance. The Y,I,Qcomponents are assumed to be in the [0,1] or [0,255] range.
7.How is RGB converted to CMY?
The conversion from RGB to CMY representation is done using the followingmatrix transformation.

CS 2401 IV/VII CSE
81 K UMA MAHESWARI 2015-2016
[C M Y]=[1 1 1]-[R G B]
Where [1 1 1]represents white.
8.How is CMY converted to RGB?
The conversion from CMY toRGB representation is done using the followingmatrix transformation.
[R G B]=[1 1 1]-[C M Y]
Where [1 1 1] represents black.
9.What is HSV color model?
HSV stands for Hue,Saturation and Value.Hue-The color we see(red,green,purple)Saturation-How far is the color from gray
Values(Luminance)-How bright is the color.
10.What does Computer animation refer?
Computer animation refers to any time sequence of visual changes in
scene. It display time variations in object size,color,transparency & surfacetexture.
11.What is Frame-by-Frame animation?Frame-by-Frame animation is an animation in which each frame of the scene isseparately generated and stored.12.What does story board define?The story board is an outline of the action. It defines the motion sequence as a setof basic events that are to take place.
13.What is Graphics editor?
The graphics editor allows designing and modifying object shapes, using splinesurfaces, constructive solid geometry methods,or other representation schemes.
14.What is Morphing?
Transformation of object shapes from one form to another is called morphing.

CS 2401 IV/VII CSE
82 K UMA MAHESWARI 2015-2016
15.What is OPENGL?
OpenGL stands for Open graphics library. OpenGL provides a set of commandsto render a 3D scene i.e., the data is provided in an OpenGL usable form andOpenGL will show this data on the screen.
16.Write down the Skeleton of an event driven program using OpenGL?
Void main()
{
Initialize things
Set the display mode
Create a screen window
Register the call back functions
Perhaps initialize other things
Enter the unending main loop
}17.Give the format OpenGL vertex command? The OpenGL vertex command
contains
The prefix “gl” indicates a function from the OpenGL library.
The basic command root
The number of arguments being sent to the function
The type of argument.
18.What is the use of glPointSize()?
The glPointSize() is used to set the size of a point which takes one floating pointargument.
Syntax
glPointSize(Glfloat size)
where

CS 2401 IV/VII CSE
83 K UMA MAHESWARI 2015-2016
size specifies the diameter of rasterized points the default is 1.0
19.What is the Modelview Matrix?
The modelview matrix is the CT. It combines the following 2 effects
Modelling tranformations on objects
the transformation that orients and positions the camera in space.20.What is the Viewport Matrix?
The viewport matrix maps the standard cube into a 3D viewportWhose x and y values extend across the viewport and whose z
component extends from 0 to 1.
16 mark Questions:1.Explain about various color models?2.What is OpenGL? Discuss about the event driven programming.3.Explain about computer animation?4.Explain about the basic graphics primitive of OpenGL?5.Explain about drawing 3D objects & scenes?
UNIT IV
RENDERING
1.What is the shading model?
The shading model attempts to model how light that emanates from light sources wouldinteract with objects in a scene. The shading model dictates how light is scattered orreflected from a surface
2.What is known as black body?
If all of the incident light is absorbed, the object appears black and is known as ablackbody.
3.State Lamber’s Law?
The relationship between brightness and surface orientation is called lamber’s law.
4.What are the three types of light contributions?
Diffuse

CS 2401 IV/VII CSE
84 K UMA MAHESWARI 2015-2016
Specular
Ambient
5.What are the two types of smooth shading?
The 2 types of smooth shading are
Gouraud shading
Phone shading
6.What is called Phong shading?Greater realism can be achieved, to highlights on shiny objects, by a better approximationof the normal vector to the face at each pixel. This type of shading is called phongshading.
7.What is called texels?
Textures are formed bitmap representations of images. Such representation consists of anarray, such as texture [c] [r], of color values called texels.
8.What is the use of glGetUniformLocation function?
The glGetUniformLocation function is used to retrieve the locations of some uniformvariables that are defined in the shaders.
9.Mention the types of shader?
GL_VERTEX_SHADER
GL_FRAGMENT_SHADER
GL_DELETE_SHADER
GL_ATTACH_SHADER
10.Write down the function of texture(s,t)?
The function texture (s,t) accesses “samples” in the array, as in the code,
Color3 texture(float s, float t)
{

CS 2401 IV/VII CSE
85 K UMA MAHESWARI 2015-2016
Return txtr[(int)(s*c)][(int)(t*R)];
}
11.What is the visible intensity?
The visible intensity I is set equal to the texture value at each spot.
I= texture(s,t)
12.What is the use of glTexCoord2f() function?The function glTexCoord2f() is used to associate a point in texture space, Pi=(si,ti) witheach vertex Vi of the face.
13.Write down the OpenGL command to define a quadrilateral face.glBegin(GL_QUADS);//define a quadrilateral face glTexCoord2f(0.0,0.0);glVertex3f(1.0,2.5,1.5); glTexCoord2f(0.0,0.6);glVertex3f(1.0,3.7,1.5);glTexCoord2f(0.8,0.6);glVertex(2.0,3.7,1.5);glTexCoord2f(0.8,0.0);glVertex3f(2.0,2.5,1.5); glEnd();
14.Give the basic idea of reflection Mapping.The reflection mapping can significantly improve the realism of pictures especiallyanimations. The basic idea is to see reflections in an object thet suggest the “world”surrounding thet object.
5.What is called a shadow buffer?An auxiliary second depth buffer,called a shadow buffer,is employed for each lightsource. It contains depth picture for the scene from the point of view of the light source.
16.What does sliding means?Sliding means to move the camera along one of its own axes,(ie) in the u,v or ndirections,without rotating it.
17.Write down the syntax for glFramebufferRenderbufferEXT().
Void glFramebufferRenderbufferEXT(GLenum target,GLenum attachmentPoint,
GLenum renderbufferTarget,
GLuint renderbufferId);
18.What is the function of glCheckFramebufferStatusEXT()?The glCheckFramebufferStatusEXT() validates all its attached images and framebuffer

CS 2401 IV/VII CSE
86 K UMA MAHESWARI 2015-2016
parameters on the currently bound FBO. And, this function cannot be called withinglBegin()/glEnd() pair.
19.Write down the syntax for glGetRenderbufferParameteriveEXT().
Void glGetRenderbufferParameterivEXT(GLenum target, GLenum param, Glint* value);
20.List out some of the rules of FBO completeness.The width and height of framebuffer-attachable image must be not zeroFBO must have at least one image attachedAll images attached a FBO must have the same width and heightAll images attached the color attachment points must have the same internal format.
16 mark Questions:
1.Explain about shading models?2.Explain in detail about Flat and Smooth shading?3.Explain in detail about adding texture to faces?4.Explain in detail about adding shadows of objects?5.Discuss about the process of creating shaded objects?
UNIT V
FRACTALS
1. Define FractalA fractal is an image or a geometric object with self-similar properties produced byrecursive or iterative algorithmic means .
2.List out some properties of fractal.
Self similarFormation by iterationFractional dimensionForm is extremely irregular or fragmented
3.What are three types of self-similarity found in fractals?Exactly self-similarQuasi-self-similarityStatistically self-similar
4.Give some examples of fractals.CloudsGrass

CS 2401 IV/VII CSE
87 K UMA MAHESWARI 2015-2016
ForeModeling mountains(terrain)CoastlineBranches of a treeSurface of a spongeCracks in the pavement
5.What is Koch Curve?The Koch curve is a curve that is generated by a simple geometric procedure which canbe iterated an infinite number of times by dividing a straight line segment into three equalparts and substituting the intermediate part with two segment of the same length.
6.Give the general procedure to construct Koch curve.To form Kn+1 from Kn:Subdivide each segment of Kn into three equal parts andreplace the middle part with a bump in the shape of an equivalent triangle.
Total length of Ki is (4/3)I which increases as i increases.
7.What is known as L-Systems?L-systems(also known as Lindenmayer Systems or parallel string-rewrite systems) is asimple approach to generate a large number of complex curves by refining the linesegments based on a simple set of rules.
8. What are the instructions to be followed in L-systems?An L-system works by giving the turtle a string sequence where each symbol in thesequence gives turtle instructions.
‘F’ go forward 1 step‘+’ turn right by x degrees‘-‘ turn left by x degrees
Where x is set and predetermined.
9. What is String Production Rules?String Production Rules is a rule used to generate a simple String in to the longer one thatwill generate richer curve.
10.What is Iterated Function System(IFS)?Iterated function systems or IFSs are a method of constructing fractals in which eachstring is repeatedly fed back into the same function to produce the next higher orderobject; the resulting constructions are always self-similar11.Give the rules for Dragon Curves?

CS 2401 IV/VII CSE
88 K UMA MAHESWARI 2015-2016
The rules that used X and Y for dragon curves F FX X+YF+Y -FX-Y Atom=FXF means “draw forward”- means “turn left 900”, and+ means “turn right 900”.
12.Give the parameter to represent each curves based on String production The five keyingredients for each curveAtomF-stringX-stringY-string
Angle in degree
13.What is space-filling curve?A space-filling curves in the 2D plane are commonly called Peano curves.
14.What is called Ray Tracing?Ray tracing, also called as ray casting, is a technique for generating an image by tracingthe path of light through pixels in an image plane and simulating the effects of itsencounters with virtual objects.
15.What is the state of a turtle?A turtle has a position and points in some direction, so its state consists of the values ofthe current position (CP) and current direction (CD)State of the turtle={CP,CD}
16. The hit() methods performs the following functionsThe ray is first transformed into the generic coordinates of the objectThe various intersections with the generic object are computed
17.What is known as Surface texture?Surface texture, also known as surface finish, is the characteristics of a surface in whichcomputer-generated imaged=s is made more lively and realistic by painting textures onvarious surfaces.
18.What is total internal reflection?The internal reflection is an optical phenomenon that happens when a ray of light strikesa medium boundary at an angle larger than a particular critical angle with respect to thenormal to the surface

CS 2401 IV/VII CSE
89 K UMA MAHESWARI 2015-2016
19.What is Constructive solid geometry?Constructive solid geometry (CSG) is a technique used in solid modeling. Constructivesolid geometry allows a modeler to create a complex surface or object by using Booleanoperators to combine objects.
20.What is CSG Objects?CSG objects (also called as compound or Boolean objects) is an object is constructed bycombining the primitives by means of allowable operations, which are typically Booleanoperation on sets,
Union
IntersectionDifference
16 mark Questions:1.Define Koch curve? How do you construct the Koch curve?2.Explain about Mandelbrot sets?3.Explain about Julia sets?4.Explain about Intersecting rays with other primitives?5.Explain about Boolean operation on objects?
Anna UniversityB.E./B.Tech. DEGREE EXAMINATION, November/December 2012
Seventh SemesterComputer Science and Engineering
CS2401 Computer Graphics(Regulation 2008)
Semester : 7Year : 4th yrRegulation : 2008Department : B.E CSE, B.Tech ITSubject Code : CS2401Subject Name : Computer GraphicsContent : CS2401 Computer Graphics Nov / Dec 2012 Question Paper.
PART A1.Write down the shear transformation matrix.
2.Define text clipping.3.Differentiate oblique and orthogonal projections.4.Define spline curves.5.State the difference between CMY and HSV color models.6.What are key frame systems?

CS 2401 IV/VII CSE
90 K UMA MAHESWARI 2015-2016
7.What is a shadow?8.Define texture.
9.List down the properties of piano curves.10.Write down some of boolean operations on objects.
PART B11.a.Explain the following
i.Line Drawing algorithm.ii.Line clipping algorithm.
b.With suitable examples, explain the followingi.Rotational transformation.ii.Curve Clipping Algorithm.
12.a.i.Differentiate parallel and perspective projections.ii.Write notes on 3D viewing.
b.i.With suitable examples, explain the 3D transformations.ii.Write notes on quadratic surfaces.
13.a.i.Explain RGB color model in detail.ii.Explain how 3D scenes are drawn.
b.i.Discuss the computer animation techniques.ii.Explain how 3D objects are drawn.
14.a.Differentiate flat and smooth shading models.b.Discuss the methods to draw and add shadow to objects.
15.a.i.Mandelbrot sets. ii.Julia sets.b.i.Describe the creation of images by iterated functions.
ii.Explain the method for adding surface textures.

CS 2401 IV/VII CSE
91 K UMA MAHESWARI 2015-2016
B.E./B.Tech. DEGREE EXAMINATION, NOVEMBER/DECEMBER 2011.Seventh Semester
Computer Science and EngineeringCS 2401 — COMPUTER GRAPHICS(Common to Information Technology)
(Regulation 2008)Time : Three hours Maximum : 100 marks
Answer ALL questions.PART A (10 × 2 = 20
marks)1. Write down any two line attributes.2. Differentiate window and view port.3. What are spline curves?4. Define quadric surfaces.5. What is animation?6. Define key frames.7. What do you mean by shading of objects?8. What is texture?9. Define fractals.10. Differentiate Mandelbrot and Julia sets.
PART B (5 × 16 = 80 marks)11. (a) Write down and explain the midpoint circle drawing algorithm. Assume 10 cm as theradius and co-ordinate origin as the centre of the circle. (16 marks)Or(b) Explain in detail the Cohen-Sutherland line clipping algorithm with an example. (16marks)12. (a) Differentiate parallel and perspective projections and derive their projectionmatrices. (16 marks)Or(b) With suitable examples, explain all 3D transformations. (16 marks)13. (a) Write notes on RGB and HSV color models. (16 marks)Or(b) Discuss the following:(i) Methods to draw 3D objects. (8)(ii) Basic OPENGL operations. (8)14. (a) Explain the following:(i) Adding texture to faces. (8)(ii) Adding shadows of objects. (8)Or(b) Write down and explain the details to build a camera in a program. (16 marks)