
Crystallization inhibitor properties of polymers and ...
210
Purdue University Purdue e-Pubs Open Access eses eses and Dissertations Summer 2014 Crystallization inhibitor properties of polymers and effects on the chemical and physical stability of L- ascorbic acid during preparation and storage Belinda Christina Purdue University Follow this and additional works at: hps://docs.lib.purdue.edu/open_access_theses Part of the Agriculture Commons , and the Food Science Commons is document has been made available through Purdue e-Pubs, a service of the Purdue University Libraries. Please contact [email protected] for additional information. Recommended Citation Christina, Belinda, "Crystallization inhibitor properties of polymers and effects on the chemical and physical stability of L-ascorbic acid during preparation and storage" (2014). Open Access eses. 721. hps://docs.lib.purdue.edu/open_access_theses/721
Transcript of Crystallization inhibitor properties of polymers and ...

Purdue UniversityPurdue e-Pubs
Open Access Theses Theses and Dissertations
Summer 2014
Crystallization inhibitor properties of polymers andeffects on the chemical and physical stability of L-ascorbic acid during preparation and storageBelinda ChristinaPurdue University
Follow this and additional works at: https://docs.lib.purdue.edu/open_access_theses
Part of the Agriculture Commons, and the Food Science Commons
This document has been made available through Purdue e-Pubs, a service of the Purdue University Libraries. Please contact [email protected] foradditional information.
Recommended CitationChristina, Belinda, "Crystallization inhibitor properties of polymers and effects on the chemical and physical stability of L-ascorbicacid during preparation and storage" (2014). Open Access Theses. 721.https://docs.lib.purdue.edu/open_access_theses/721

i


ii
CRYSTALLIZATION INHIBITOR PROPERTIES OF POLYMERS AND EFFECTS
ON THE CHEMICAL AND PHYSICAL STABILITY OF L-ASCORBIC ACID
DURING PREPARATION AND STORAGE
A Thesis
Submitted to the Faculty
of
Purdue University
by
Belinda Christina
In Partial Fulfillment of the
Requirements for the Degree
of
Master of Science
August 2014
Purdue University
West Lafayette, Indiana

ii
ii
Dedicated to the advancement of God’s kingdom and the welfare of human beings

iii
iii
ACKNOWLEDGEMENTS
First and foremost, I would like to thank God for providing me this opportunity and
granting me the capability to finish this study. My deepest gratitude to Dr. Lisa J. Mauer
for her guidance and support throughout my graduate study. Her guidance allowed me to
gained maturity in viewing food science and conducting research. I would also like to
thank my committee members Dr. Lynne S. Taylor and Dr. Owen Jones for their
guidance and knowledge in finishing my degree. I must also thank the Department of
Food Science for the Teaching Assistantship funding.
I am thankful for the support of faculty members, staff, and graduate students for their
assistant in my research and teaching experiences. I would like to thank Dr. Young-Hee
Cho, Dr. Fernanda San Martin, and Dr. Tameshia Ballard for guiding me throughout my
journey of being a teaching assistant. I greatly appreciate the assistant of Steve Smith,
Benjamin O’Neil, Matthias Bohn, Lindsay Wegiel, Niraj Trasi, Matthew Jackson, and
Luis Filipe for their assistant in equipment training and data analysis for both my research
study and teaching experiences. I am also very thankful for the students in my lab group,
especially Na Li, Krystin Marrs, Matt Allan, and Seda Arioglu for their assistance and
friendship.
Lastly I wanted to thank my family and my boyfriend, Martin L. Tan for their continuous
supports when I am struggling and feeling unable to continue on.

iv
iv
TABLE OF CONTENTS
Page
LIST OF TABLES……………………………………...………………………………...ix
LIST OF FIGURES ...................................................................................................... xii
ABSTRACT .............................................................................................................. xviii
CHAPTER 1. INTRODUCTION ...............................................................................1
1.1 Overview…………………………………………………..……………..1
1.2 L-Ascorbic Acid Physical Structures and Physicochemical Properties..... 2
1.3 Crystalline Compounds ........................................................................... 4
1.4 Amorphous compounds .......................................................................... 5
1.5 Tendency of Amorphous Compounds to Convert to Crystalline
Compounds ...............................................................................................................6
1.6 Formation of Amorphous Solid Dispersions............................................ 7
1.7 Effects of polymer in increasing stability of amorphous solid.................. 9
1.8 Hydrogen Bonding Interaction .............................................................. 11
1.9 Hydrogen Bonding Capability of L-Ascorbic Acid ............................... 12
1.10 Polymer: Pectin, PVP, PAA .................................................................. 15
1.11 Methods to Analyze Physical Stability of Amorphous Solid Dispersions..
............................................................................................................. 17
1.12 Chemical Stability of L-Ascorbic Acid in Foods and Solid Model
Systems ............................................................................................................. 20
1.13 L-Ascorbic Acid Oxidation Mechanisms .............................................. 21
1.14 Methods in Monitoring Chemical Stability of L-Ascorbic Acid ............ 23
1.15 Thesis Objectives .................................................................................. 24
1.16 References ............................................................................................ 26

v
v
Page
CHAPTER 2. CRYSTALLIZATION INHIBITOR PROPERTIES OF DIFFERENT
POLYMERS AND EFFECTS ON PHYSICAL STABILITY OF L-ASCORBIC ACID 34
2.1 Abstract…………………………………………………………………34
2.2 Introduction .......................................................................................... 35
2.3 Objectives ............................................................................................. 36
2.4 Experimental Design............................................................................. 37
2.5 Materials and Methods .......................................................................... 38
2.5.1 Materials……………………………………………………………38
2.5.2 Solid dispersion formation via lyophilization ................................. 38
2.5.3 Storage treatments .......................................................................... 39
2.5.4 X-ray powdered diffraction (XRPD) .............................................. 39
2.5.5 Polarized light microscope ............................................................. 39
2.5.6 Fourier transform infrared spectroscopy (FTIR) ............................. 40
2.5.7 Moisture sorption isotherm analysis ............................................... 40
2.5.8 Differential scanning calorimetry (DSC) ........................................ 41
2.6 Results and Discussion ......................................................................... 41
2.6.1 Crystallization tendency of ascorbic acid solid dispersions during
formation and storage............................................................................................. 41
2.6.2 Ascorbic acid and polymer hydrogen bond donor and acceptor
strengths ....................................................................................................... 48
2.6.3 Hydrogen bonding interactions between ascorbic acid and polymer50
2.6.4 Moisture sorption isotherm profiles ................................................ 61
2.6.5 Glass transition temperatures (Tg) of polymers and solid dispersions
....................................................................................................... 73
2.6.6 The effect of VitC-polymer interactions, hygroscopicity and Tg on
the stability of amorphous solid dispersions ........................................................... 82
2.7 Conclusion............................................................................................ 84
2.8 References ............................................................................................ 85

vi
vi
Page
CHAPTER 3. EFFECTS OF POLYMER RATIOS AND TYPES IN THE
FORMATION OF L-ASCORBIC ACID – POLYMER INTERACTION IN
DETERMINING THE PHYSICAL STABILITY OF AMORPHOUS SOLID
DISPERSION .......................................................................................................... 89
3.1 Abstract…………………………………………………..……………..89
3.2 Introduction .......................................................................................... 89
3.3 Objectives ............................................................................................. 91
3.4 Experimental Design............................................................................. 91
3.5 Materials and Methods .......................................................................... 92
3.5.1 Materials…………………………………………………..………..92
3.5.2 Solid dispersion formation ............................................................. 92
3.5.3 Storage treatment ........................................................................... 93
3.5.4 X-ray powdered diffraction (XRPD) .............................................. 93
3.5.5 Fourier transform infrared spectroscopy (FTIR) ............................. 93
3.6 Results and discussions ......................................................................... 94
3.6.1 Crystallization tendency of ascorbic acid solid dispersions formed
with different polymer types and ratios .................................................................. 94
3.6.2 Hydrogen bond capability of VitC & polymers .............................. 97
3.6.3 Structural differences between solid dispersions and physical
mixtures ..................................................................................................... 101
3.6.4 The hydrogen bond interactions between VitC and pectin with
different degree of esterification (%DE) ............................................................... 103
3.6.5 The hydrogen bond interaction between VitC and PVP ................ 115
3.6.6 Comparison between the crystallinity of the dispersion and the
formation of VitC-polymer interaction ................................................................. 121
3.7 Conclusion.......................................................................................... 123
3.8 References .......................................................................................... 124

vii
vii
Page
CHAPTER 4. CHEMICAL STABILITY OF VARIOUS FORM OF L – ASCORBIC
ACID: THE EFFECT OF PHYSICAL STATES, STORAGE TEMPERATURES, AND
RELATIVE HUMIDITES ........................................................................................... 127
4.1 Abstract………………………………………………………………..127
4.2 Introduction ........................................................................................ 128
4.3 Objectives ........................................................................................... 129
4.4 Experimental Design........................................................................... 130
4.5 Materials and Methods ........................................................................ 130
4.5.1 Materials……………………………………………………...…...130
4.5.2 Freeze dried ascorbic acid (FD VitC), ascorbic acid (VitC) – polymer
physical mixtures, and solid dispersion formation ................................................ 131
4.5.3 Storage treatment ......................................................................... 131
4.5.4 X-ray powdered diffraction (XRPD) ............................................ 132
4.5.5 Moisture sorption isotherm analysis ............................................. 132
4.5.6 Differential scanning calorimetry (DSC) ...................................... 132
4.5.7 Microplate reader assay ................................................................ 133
4.5.8 Hunter colorimeter ....................................................................... 133
4.5.9 Statistical analysis ........................................................................ 134
4.6 Results and Discussions ...................................................................... 134
4.6.1 Physical state and properties of ascorbic acid (VitC) in
differentsystems ................................................................................................... 134
4.6.2 Ascorbic acid (VitC) lost in pure system stored at at various
temperatures and %RHs overtime ........................................................................ 141
4.6.3 Inaccuracy of microplate reader in analyzing %VitC degradation . 142
4.6.4 Ascorbic acid (VitC) lost in 50:50 VitC:polymers physical mixtures
and solid dispersions stored at various temperature and %RHs overtime .............. 146
4.6.5 Discoloration of L-ascorbic acid (VitC) stored at various temperature
and %RHs overtime ............................................................................................. 156
4.6.6 The relationship between %VitC loss and discoloration ............... 173

viii
viii
Page
4.6.7 Effects of physical forms and polymer types VitC chemical stability .
..................................................................................................... 174
4.7 Conclusion.......................................................................................... 178
4.8 References .......................................................................................... 179
4.9 Appendix………………………………………………………………184
CHAPTER 5. SUMMARY AND FUTURE DIRECTIONS ................................... 185
5.1 Summary………………………………………………………………185
5.2 Future Directions ................................................................................ 187

ix
ix
LIST OF TABLES
Table ......................................................................................................................... Page
Table 1.1. Solubility of ascorbic acid at 20oC [3] .............................................................3
Table 1.2. FTIR wavenumber assignments for ascorbic acid functional groups [37] ....... 14
Table 1.3. K value and molecular weight of PVP [40].................................................... 17
Table 1.4. Techniques for characterizing amorphous solid [14] ...................................... 20
Table 2.1. Interpretation of PXRD patterns of 50:50 VitC:polymer after 7 days at 25oC
and the identified %RH. PXRD patterns that contained sharp peaks were
interpreted as having crystalline structures (C) and those that lacked distinct peaks
were interpreted as being amorphous (A). .......................................................... 47
Table 2. 2. FTIR absorbance peak shifts of pectin, 50:50 VitC:polymer dispersions in the
hydroxyl region (3000 - 3600cm-1
) at day 0 ........................................................ 57
Table 2.3. Absorbance peak shift in FTIR spectra of pectin, 50:50 VitC:polymer
dispersions in the carbonyl region (a)1500 - 1700cm-1
, and (b)1700 - 1800cm-1
at
day 0 .................................................................................................................. 59
Table 2.4. FTIR spectra absorbance maximum peak positions in the hydroxyl region
(3000 - 3600cm-1
) at day 0 ................................................................................. 61
Table 2.5. Moisture content of polymer at 90%RH measured with SPS gravimetric
analyzer ............................................................................................................. 64
Table 2.6. Measured and predicted moisture contents of 50:50 VitC:polymer physical
mixtures and 50:50 VitC:polymer dispersions at 90%RH measured with a SPS
gravimetric analyzer ........................................................................................... 66
Table 2.7. %Moisture contents (wwb) of 50:50 VitC:polymer dispersion stored at 25oC at
different storage %RHs ...................................................................................... 73

x
x
Table ......................................................................................................................... Page
Table 2.8. %Moisture content (wwb) of 50:50 VitC:polymer dispersion stored at 25oC at
different storage %RHs ...................................................................................... 73
Table 2.9. DSC methods used to identify the Tg of pectin .............................................. 76
Table 2. 10. Glass transition temperatures of FD PVP and FD PAA at different
storage %RHs .................................................................................................... 78
Table 2.11. Onset Tgs of 50:50 ascorbic acid:pectin solid dispersions at day 0............... 81
Table 2.12. Onset Tgs of 50% ascorbic acid:pectin solid dispersions after equilibration
(35 days) at 25oC and the identified RH conditions ............................................ 81
Table 2.13. Onset Tgs of 50% ascorbic acid:pectin solid dispersions after equilibration
(35 days) at 40oC and the identified RH conditions ............................................ 82
Table 3.1. The physical structure (crystalline or amorphous) of VitC-pectin solid
dispersions formed with varying ratios of the ingredients. .................................. 96
Table 3.2. The physical structure (crystalline or amorphous) of VitC-PVP solid
dispersions formed with varying ratios of the ingredients. .................................. 97
Table 3.3. Peak position of VitC-CT dispersions with various ratios ............................ 106
Table 3.4. Peak position of VitC-EST dispersions with various ratios .......................... 108
Table 3. 5. Peak position of VitC-PVP dispersion with various ratios .......................... 117
Table 4. 1. PXRD of 50:50 AA:polymer after 7 days at 25oC and the identified %RH . 136
Table 4.2. Onset Tg of 50% ascorbic acid:pectin solid dispersions after equilibration (35
days) at the identified temperature and RH conditions ...................................... 137
Table 4.3. Moisture content of 50:50 VitC:polymer dispersion stored at 25oC at different
storage %RHs .................................................................................................. 140
Table 4.4. Moisture content of 50:50 VitC:polymer dispersion stored at 40oC at different
storage %RHs .................................................................................................. 141
Table 4.5. The %VitC loss of various systems stored at 25oC and specified %RHs after
10 weeks .......................................................................................................... 152
Table 4.6. The %VitC loss of various systems stored at 25oC at specified polymer types
and %RHs after 10 ........................................................................................... 153

xi
xi
Table ......................................................................................................................... Page
Table 4.7. The %VitC loss of various systems stored at 40oC and specified %RHs after
10 weeks .......................................................................................................... 154
Table 4.8. The %VitC loss of various systems stored at 25oC at specified polymer types
and %RHs after 10 ........................................................................................... 155
Table 4.9. Change in a*values of various systems stored at 25oC and specified %RHs
after 8 weeks .................................................................................................... 165
Table 4.10. Change in a*values of various systems stored at 25oC at specified polymer
types and %RHs after 8 weeks ......................................................................... 166
Table 4.11. Change in a*values of various systems stored at 40oC and specified %RHs
after 8 weeks .................................................................................................... 167
Table 4.12. Change in a*values of various systems stored at 40oC at specified polymer
types and %RHs after 8 weeks ......................................................................... 168
Table 4.13. Change in b*values of various systems stored at 25oC and specified %RHs
after 8 weeks .................................................................................................... 169
Table 4.14. Change in b*values of various systems stored at 25oC at specified polymer
types and %RHs after 8 weeks ......................................................................... 170
Table 4.15. Change in b*values of various systems stored at 40oC and specified %RHs
after 8 weeks .................................................................................................... 171
Table 4.16. Change in b*values of various systems stored at 40oC at specified polymer
types and %RHs after 8 weeks ......................................................................... 172

xii
xii
LIST OF FIGURES
Figure ........................................................................................................................ Page
Fig 1.1 L-ascorbic acid chemical structure .......................................................................2
Fig 1.2. Schematic illustration of the change in volume or enthalpy with temperature for a
material undergoing crystallization or a glass transition. [13] [adapted from Elliott
(1983)] .................................................................................................................6
Fig 1. 3. Schematic illustration of the parameters controlling crystallization from
amorphous solid [9] [adapted from [16]] ..............................................................7
Fig 1.4. Schematic diagram of the most common ways amorphous solids are produced [9]
............................................................................................................................8
Fig 1.5. L-ascorbic acid carbon, oxygen, and hydrogen atom designation [adapted from [2]
.......................................................................................................................... 13
Fig 1.6. L-ascorbic acid hydrogen bonding for two independently determined molecules
(molecules A and B). Oxygen atoms in neighboring molecules are indicated by
triple circles. [2] ................................................................................................. 13
Fig 1.7. FTIR spectrum (transmittance) of a grown ascorbic acid crystal [37] ................ 14
Fig 1. 8. Chemical structure of (a) high methoxyl pectin, (b) low methoxyl pectin, (c)
amidated pectin. (International Pectin Producers Association, 2001) .................. 15
Fig 1.9. Structure of the polymers (a) PVP and (b) PAA ................................................ 17
Fig 1.10. Mechanisms of oxidative and anaerobic degradation of ascorbic acid [1] ........ 23
Fig 2.1. PXRD patterns of ascorbic acid and freeze dried ascorbic acid at day 0 ............ 42
Fig 2.2. Polarized light microscope images of (a) ascorbic acid, (b) freeze dried ascorbic
acid .................................................................................................................... 42
Fig 2.3. PXRD patterns of initial polymers and freeze dried ascorbic acid at day 0 ........ 42
Fig 2.4. Polarized light microscope images of initial polymers (a) CT, (b) AP, (c) EST, (d)
K, (e) PVP, and (f) PAA 43
xiii
xiii
Figure ........................................................................................................................ Page
Fig 2.5. PXRD patterns of freeze dried polymers and freeze dried ascorbic acid at day 0
.......................................................................................................................... 43
Fig 2.6. Polarized light microscope images of freeze dried polymers (a) CT, (b)AP, (c)
EST, (d) K, (e) PVP, and (f) PAA ...................................................................... 44
Fig 2.7. PXRD of 50:50 VitC:polymer dispersions and FD ascorbic acid at day 0 .......... 45
Fig 2.8. Polarized light microscope images of of 50:50 VitC dispersions with (a) CT, (b)
AP, (c) EST, (d) K, (e) PVP, (f) PAA ................................................................. 45
Fig 2.9. PXRD of 50:50 VitC: polymer dispersions at day 0 with different sample:water
ratio prior freeze drying...................................................................................... 48
Fig 2.10. PXRD pattern of 50:50 VitC:CT dispersions and physical mixtures ................ 48
Fig 2.11. FTIR Spectra of ascorbic acid and freeze dried ascorbic acid .......................... 51
Fig 2.12. FTIR spectra of polymers (a) CT and freeze dried CT, (b) PVP and freeze dried
PVP, (c) PAA and freeze dried PAA .................................................................. 52
Fig 2.13. FTIR spectra of 50:50 VitC:CT. The 50% dispersions made with other pectin
showed similar spectra ....................................................................................... 53
Fig 2.14. FTIR spectra of FD VitC (FDAA), 50:50 VitC:polymer and freeze dried (a)
PVP (b) PAA ..................................................................................................... 54
Fig 2.15. FTIR spectra of FD VitC (FDAA), 50:50 VitC:EST (day 7) at various %RH,
FD EST .............................................................................................................. 54
Fig 2.16. FTIR spectra of 50:50 VitC:polymer physical mixtures ................................... 55
Fig 2.17. FTIR spectra of 50: AA:pectin solid dispersions carbonyl stretching (1500 -
1900 cm-1
) at day 0 ............................................................................................ 58
Fig 2. 18. Moisture sorption isotherm profile SPS gravimetric analyzer of AA and FD AA
.......................................................................................................................... 62
Fig 2.19. Moisture sorption isotherm profile SPS gravimetric analyzer of unfreeze dried
polymer.............................................................................................................. 63
Fig 2.20. Moisture sorption isotherm profile from SPS gravimetric analyzer of freeze
dried polymer ..................................................................................................... 64

xiv
xiv
Figure ........................................................................................................................ Page
Fig 2.21. Moisture sorption profiles of 50:50 VitC:polymer physical mixtures with (a) CT,
(b) AP, (c) EST, (d) K, (e) PVP, (f) PAA at 25oC ............................................... 65
Fig 2.22. Moisture sorption profiles of VitC 50% dispersions with (a) CT, (b) AP, (c)
EST, (d) K, (e) PVP, and (f) PAA at 25oC .......................................................... 67
Fig 2.23. Moisture sorption profiles of VitC 50% dispersions with (a) CT, (b) AP, (c)
EST, (d) K, (e) PVP, and (f) PAA at 40oC .......................................................... 68
Fig 2.24. Moisture sorption profiles of VitC:CT 50:50 dispersions at 25oC. XRPD
patterns confirmed that there were no recrystallization events. ........................... 68
Fig 2.25. Moisture sorption profiles of VitC:K 50:50 dispersions at 25oC. XRPD patterns
confirmed that rapid crystallization occurred above 61%RH. ............................. 69
Fig 2.26. Moisture sorption profile of 50:50 VitC:polymer dispersion, 50:50
VitC:polymer physical mixtures and 50:50 VitC:polymer predicted value for
(a)CT, (b) AP, (c) EST, (d) K, (e) PVP, (f) PAA ................................................ 71
Fig 2.27. The DSC curve for a sample of pectin CT ....................................................... 77
Fig 2.28. Glass transition temperatures of freeze dried PVP and PAA at different %
moisture contents (dwb) ..................................................................................... 78
Fig 2.29. Actual and predicted onset Tg values of (a) PVP and (b) PAA. The predicted
value of Tg was obtained using the Gordon-Taylor equation .............................. 79
Fig 3.1. XRPD pattern of (a) VitC – CT dispersion, (b) VitC – EST dispersion, (c) VitC –
PVP dispersion at different ratio at day 0 ........................................................... 95
Fig 3.2. Comparison of XRPD pattern of crystalline, partially crystalline, and amorphous
VitC solid dispersion to FDAA .......................................................................... 97
Fig 3.3. Different form of VitC at various solution pH [12]............................................ 98
Fig 3.4. FTIR spectra of VitC and FD VitC ................................................................... 99
Fig 3.5. Comparison of FTIR spectra for FD CT, 50:50 VitC:CT dispersion, 50:50
Vit:CT physical mixtures, FD AA for (a) hydroxyl region, (b) carbonyl region
........................................................................................................................ 102

xv
xv
Figure ........................................................................................................................ Page
Fig 3.6. Comparison of FTIR spectra for FD EST, 50:50 VitC:CT dispersion, 50:50
VitC:EST physical mixtures, FD AA for (a) hydroxyl region, (b) carbonyl region
........................................................................................................................ 102
Fig 3.7. Comparison of FTIR spectra for FD PVP, 50:50 VitC:PVP dispersion, 50:50
Vit:PVP physical mixtures, FD AA for (a) hydroxyl region, (b) carbonyl region
........................................................................................................................ 102
Fig 3.8. Comparison of FTIR spectra for VitC stored at 25oC, 0% RH and 50:50 Vit:PVP
physical mixtures stored at 25oC, 75%RH ........................................................ 103
Fig 3.9. FTIR spectra of the hydroxyl region of molecular dispersions with CT. The
percentages refer to the amount of EST in the dispersion .................................. 105
Fig 3.10. FTIR spectra of the hydroxyl region of molecular dispersion with EST. The
percentages refer to the amount of EST in the dispersion .................................. 107
Fig 3.11. FTIR spectra of the carbonyl region of molecular dipersion with CT. The
percentages refer to the amount of CT in the dispersion.................................... 110
Fig 3.12. FTIR spectra of the carbonyl region of molecular dipersion with EST. The
percentages refer to the amount of EST in the dispersion .................................. 111
Fig 3.13. Monomer of pectin with (a)methylated carboxyl group (ester group),
(b)carboxylic acid group. High DE pectin contained higher amount of (a)
monomer while low DE pectin contained higher amount of (b). ....................... 114
Fig 3.14. FTIR spectra of the hydroxyl region of molecular dipersion with PVP. The
percentages refer to the amount of PVP in the dispersion ................................. 116
Fig 3.15. FTIR spectra of the C-N region of molecular dispersion with PVP. The
percentages refer to the amount of PVP in the dispersion ................................. 118
Fig 4.1. PXRD pattern of VitC and freeze dried VitC at day 0 ..................................... 134
Fig 4.2. PXRD pattern of 50:50 VitC:CT dispersions and physical mixtures ................ 135
Fig 4.3. PXRD of 50:50 VitC:polymer dispersions and FD ascorbic acid at day 0 ........ 136
Fig 4.4. Moisture sorption isotherm profile SPS gravimetric analyzer of AA and FD AA
........................................................................................................................ 138

xvi
xvi
Figure ........................................................................................................................ Page
Fig 4.5. Moisture sorption profile of 50:50 VitC:polymer dispersion and 50:50
VitC:polymer physical mixtures (a)CT, (b) AP, (c) EST, (d) K, (e) PVP, (f) PAA
........................................................................................................................ 139
Fig 4.6. VitC degradation overtime of unprocessed crystalline VitC stored at (a) 25oC and
(b) 40oC and freeze dried VitC stored at (c) 25
oC and (d) 40
oC......................... 142
Fig 4.7. Stability of ascorbic acid overtime stored at various temperature and %RH [4]
........................................................................................................................ 143
Fig 4.8. Reactants and products of microplate reader assay. [33] .................................. 143
Fig 4.9. Reduction mechanism of Fe(III) to Fe(1I) by AA in the presence of acid and Cl-
[adapted from [34]] .......................................................................................... 144
Fig 4.10. Mechanism of oxidative and anearobic degradation of AA [adapted from [1]]
........................................................................................................................ 145
Fig 4.11. The %VitC loss of 50:50 VitC:polymer physical mixtures stored at (a) 0%RH,
(b) 23%RH, (c) 54%RH, and (d) 75%RH and 50:50 VitC:polymer solid
dispersions stored at (a) 0%RH, (b) 23%RH, (c) 54%RH, and (d) 75%RH, storage
temperature of 25oC ......................................................................................... 150
Fig 4.12. The %VitC loss of 50:50 VitC:polymer physical mixtures stored at (a) 0%RH,
(b) 23%RH, (c) 54%RH, and (d) 75%RH and 50:50 VitC:polymer solid
dispersions stored at (a) 0%RH, (b) 23%RH, (c) 54%RH, and (d) 75%RH, storage
temperature of 40oC ......................................................................................... 151
Fig 4.13. Polarized light microscope images of (a) unprocessed crystalline VitC, (b) FD
VitC ................................................................................................................. 156
Fig 4.14. Hunter colorimeter Δa*value of unprocessed crystalline VitC stored at (a) 25oC
(b) 40oC and freeze dried VitC stored at (c) 25
oC (d) 40
oC ............................... 157
Fig 4.15. Hunter colorimeter Δb*value of unprocessed VitC stored at (a) 25oC (b) 40
oC
and freeze dried VitC stored at (c) 25oC (d) 40
oC ............................................. 157

xvii
xvii
Figure ........................................................................................................................ Page
Fig 4.16. Hunter colorimeter Δa*values of 50:50 VitC:polymer physical mixtures stored
at (a) 0%RH, (b) 23%RH, (c) 54%RH, and (d) 75%RH and 50:50 VitC:polymer
solid dispersions stored at (a) 0%RH, (b) 23%RH, (c) 54%RH, and (d) 75%RH,
storage temperature of 25oC ............................................................................. 161
Fig 4.17. Hunter colorimeter Δb*values of 50:50 VitC:polymer physical mixtures stored
at (a) 0%RH, (b) 23%RH, (c) 54%RH, and (d) 75%RH and 50:50 VitC:polymer
solid dispersions stored at (a) 0%RH, (b) 23%RH, (c) 54%RH, and (d) 75%RH,
storage temperature of 25oC ............................................................................. 162
Fig 4.18. Hunter colorimeter Δa*values of 50:50 VitC:polymer physical mixtures stored
at (a) 0%RH, (b) 23%RH, (c) 54%RH, and (d) 75%RH and 50:50 VitC:polymer
solid dispersions stored at (a) 0%RH, (b) 23%RH, (c) 54%RH, and (d) 75%RH,
storage temperature of 40oC ............................................................................. 163
Fig 4.19. Hunter colorimeter Δb*value of 50:50 VitC:polymer physical mixtures stored at
(a) 0%RH, (b) 23%RH, (c) 54%RH, and (d) 75%RH and 50:50 VitC:polymer
solid dispersions stored at (a) 0%RH, (b) 23%RH, (c) 54%RH, and (d) 75%RH,
storage temperature of 40oC ............................................................................. 164

xviii
xviii
ABSTRACT
Christina, Belinda. M.S., Purdue University, August 2014. Crystallization inhibitor
properties of polymers and effects on physical and chemical stability of L-ascorbic acid.
Major Professor: Lisa Mauer.
Crystalline L-ascorbic acid (VitC) is an essential nutrient solid that is widely used
in food applications for fortification, antioxidant, and label claim purposes. VitC is
known as one of the most unstable vitamins, and its content must be declared on food
labels. Interest has been increasing in creating amorphous solid structures for improving
the solubility and/or dissolution rates of crystalline compounds. One of the most
promising methods studied to prevent the crystallization of an amorphous solid is the use
of polymers in dispersions, although the specific polymer properties that lead to the best
physical stability for a particular type of compound have not yet been identified.
Although crystalline ascorbic acid is hydrophilic and therefore there is likely little
nutritional advantage for forming an amorphous structure, there is the possibility that
food formulation and processing treatments render the vitamin amorphous. There is little
published information on manipulating the physical structure of VitC. Thus, there is an
opportunity to not only improve the understanding of crystallization inhibitor properties
of polymers applied to VitC dispersions, but also generate valuable information about
how amorphous forms of VitC differ in their stability from the crystalline structure. The
objectives of this study were to create amorphous solid dispersions of VitC and determine
the effects of polymer types on inhibiting the crystallization of these dispersions, and to
characterize the physical and chemical stability of the VitC amorphous solid dispersions.

xix
xix
VitC amorphous solid dispersions were formed with different types of polymer
(pectin, polyacrylic acid, and polyvinylpyrrolidone) using lyophilization. Samples were
stored at different temperature (25, 40oC) and relative humidity (0, 23, 54, 75%RH)
conditions. Physical stability was monitored with powder X-ray diffraction, polarized
light microscope, Fourier transform infrared spectroscopy, differential scanning
calorimetry, and SPS moisture sorption isotherm techniques. Chemical stability was
monitored using a microplate reader assay and brown color development measured with a
Hunter colorimeter. Amorphous solid dispersions formed with pectin and
polyvinylpyrrolidone (PVP) (50% w/w) were stable for up to four months when stored at
low %RHs conditions (below 23%RH), but not above 54%RH. The dispersions formed
with polyacrylic acid (PAA) crystallized immediately upon formation. The ability of the
polymers to interact with VitC via hydrogen bonding was found to be the most important
element for forming a stable VitC amorphous dispersion, correlating better with the
dispersion stability than the Tg and the hygrosocicity of the polymers. The order of VitC
chemical stability from the highest to the lowest was the pure VitC = freeze dried VitC
(both crystalline) > crystalline VitC – amorphous polymer physical mixtures >
amorphous VitC - polymer solid dispersions. VitC amorphous dispersions were
successfully formed with polymers that were able to form strong hydrogen bond
interactions with VitC, and these dispersions were stable when stored at low RH
conditions (≤ 23 %RH). When the VitC in a dispersions recrystallized, it was less
chemically stable than its initially crystalline counterpart. The decreased stability of Vit C
upon recrystallization could account for some of its degradation in intermediate moisture
food products wherein such occurrences are possible.

1
1
CHAPTER 1. INTRODUCTION
1.1 Overview
There are different types of solid structures found in food ingredients that affect
the chemical and physical stability of the ingredients and food systems. The solids of
interest in this study are crystalline and amorphous solids. Crystalline solids have been
widely used in the food and pharmaceutical industries, primarily in the form of single
ingredients. These crystalline ingredients are combined with other ingredients to form
food and pharmaceutical products, and both formulation and processing operations have
the potential to alter the physical structure of the ingredient of interest. It is of increasing
interest to manipulate the physical structure of hydrophobic crystalline solids to form
amorphous solids. This is done in attempt to alter the physicochemical properties of the
compounds, such as solubility and bioavailability. However, it has been a challenge to
form stable amorphous solids in various common storage and processing conditions. The
formation of amorphous solid dispersions with polymers is known to increase the
physical stability of amorphous systems. However, the chemical stability of an
amorphous compound is often less than that of its crystalline counterpart. There is no
clear set of guidelines for selecting the best polymers to stabilize the amorphous form of
a compound with high crystallization tendencies, whether that compound is hydrophobic
or hydrophilic. This study focuses on the crystallization inhibitor properties of polymers,
and their effects on the chemical and physical stability of crystalline solids. The target
compound in this study is ascorbic acid (vitamin C), which is a hydrophilic crystalline
solid that is widely used in food applications for fortification, antioxidant, and label claim
purposes. Although crystalline ascorbic acid is hydrophilic and has a high bioavailability
in the body and therefore there is likely little nutritional advantage for forming an
amorphous structure, the vitamin is very unstable in foods and has a very high

2
2
crystallization tendency. Because there is the possibility that food formulation and
processing treatments render the vitamin amorphous, and there is little published
information available on manipulating the physical structure of vitamin C, there is an
opportunity to not only improve the understanding of crystallization inhibitor properties
of polymers applied to vitamin C dispersions, but also generate valuable information
about how amorphous forms of vitamin C differ in their stability from the crystalline
structure.
1.2 L-Ascorbic Acid Physical Structures and Physicochemical Properties
L-Ascorbic acid is an acidic carbohydrate – like compound with a carbon – carbon
double bond in a five membered ring [1, 2]. L-ascorbic acid has four hydroxyl groups,
one carbonyl group and one ether group which make it a highly polar molecule (Fig 1.1).
Due to its polarity, L-ascorbic acid is highly soluble in water and insoluble in less polar
solvents (Table 1.1). The functional groups present in L-ascorbic acid also allow the
formation of a strong hydrogen bond interaction with each other, creating a strong
crystalline structure
Fig 1.1 L-ascorbic acid chemical structure
3
3
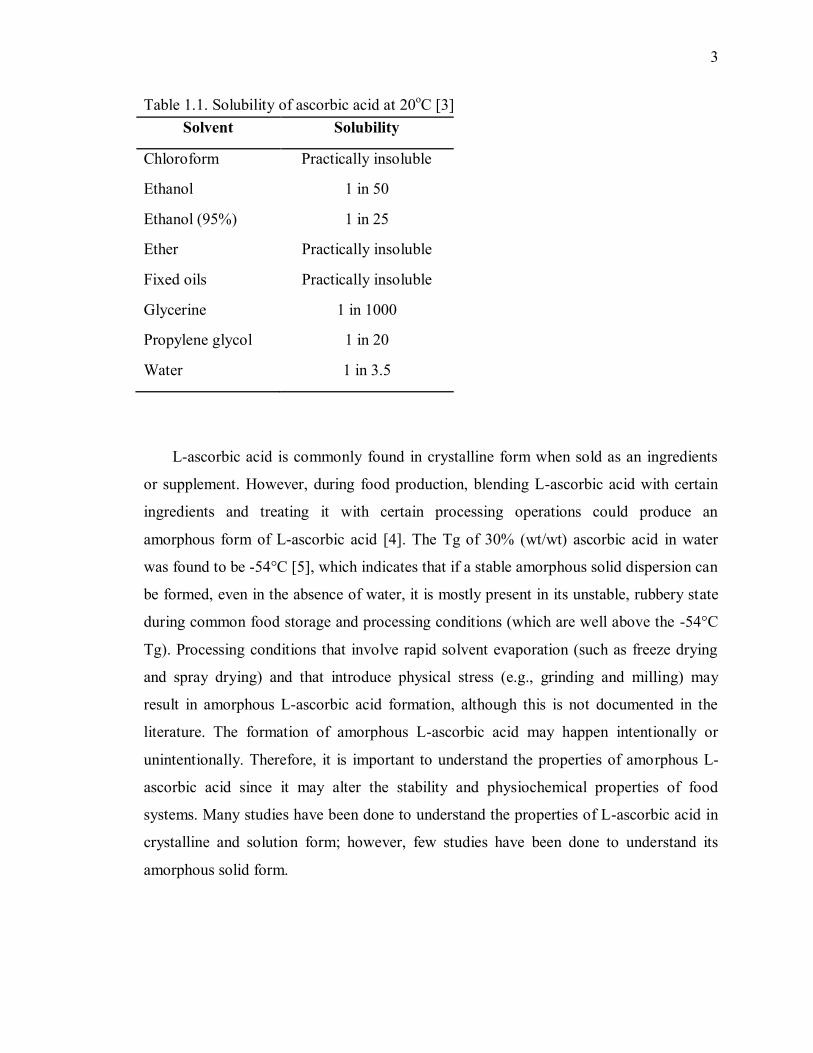
Table 1.1. Solubility of ascorbic acid at 20oC [3]
Solvent Solubility
Chloroform Practically insoluble
Ethanol 1 in 50
Ethanol (95%) 1 in 25
Ether Practically insoluble
Fixed oils Practically insoluble
Glycerine 1 in 1000
Propylene glycol 1 in 20
Water 1 in 3.5
L-ascorbic acid is commonly found in crystalline form when sold as an ingredients
or supplement. However, during food production, blending L-ascorbic acid with certain
ingredients and treating it with certain processing operations could produce an
amorphous form of L-ascorbic acid [4]. The Tg of 30% (wt/wt) ascorbic acid in water
was found to be -54°C [5], which indicates that if a stable amorphous solid dispersion can
be formed, even in the absence of water, it is mostly present in its unstable, rubbery state
during common food storage and processing conditions (which are well above the -54°C
Tg). Processing conditions that involve rapid solvent evaporation (such as freeze drying
and spray drying) and that introduce physical stress (e.g., grinding and milling) may
result in amorphous L-ascorbic acid formation, although this is not documented in the
literature. The formation of amorphous L-ascorbic acid may happen intentionally or
unintentionally. Therefore, it is important to understand the properties of amorphous L-
ascorbic acid since it may alter the stability and physiochemical properties of food
systems. Many studies have been done to understand the properties of L-ascorbic acid in
crystalline and solution form; however, few studies have been done to understand its
amorphous solid form.

4
4
In addition, there is a high interest in manipulating the physical structure of
crystalline solids to alter or tailor properties, or just improve the understanding of a
system. Hydrophobic compounds, such as many phytochemicals (eg. curcumin) and
pharmaceutical drugs have low solubility, thus low bioavailability in the human body.
The formation of a stable amorphous solid dispersion hydrophobic compound was shown
to improve the bioavailability of hydrophobic compound [6, 7] . Therefore, if a stable
amorphous solid dispersion of a compound high with crystallization tendency such as
ascorbic acid, can be formed, the similar concept can be used to produce a stable
hydrophobic compound solid dispersion. In order to understand theory in forming a
stable ascorbic acid amorphous dispersion, it is essential to understand the fundamental
concepts and properties of the crystalline solid and amorphous solid forms.
1.3 Crystalline Compounds
Crystalline solids are highly tri-dimensional ordered molecules or atoms that have
limited molecular mobility. They are arranged in a long and repeating geometrical pattern
with low intrinsic free energy [8]. Some of the crystalline solids of interest to the food
industry include sugars, salts and organic acids. There are varying degrees of solubility
exhibited by crystalline solids. Sucrose, glucose, sodium chloride, and ascorbic acid are
some examples of highly water soluble crystals. Many pharmaceutical crystals such as
indomethacin, felodopine, and bifonazole, as well as some phytochemicals (curcumin,
resveratrol) are examples of poorly water soluble crystalline solids. Crystalline solids also
exhibit varying degrees of crystallization tendency. The crystallization tendency depends
on the structures and ability to interact with other molecules. It is of interest to convert
poorly water soluble crystalline solids into amorphous solids to improve solubility,
accelerate dissolution, and increase bioavailability. The conversion of highly water
soluble crystals to amorphous compounds could enhance their dissolution rates, alter the
moisture sorption profiles, and will likely decrease the chemical stability

5
5
1.4 Amorphous compounds
Amorphous compounds are solids with short range molecular order and no well-
defined conformity. They exhibit two physical states separated by a glass transition
temperature (Tg) range. Tg is defined by IUPAC as “a second-order transition in which a
supercooled melt yields, on cooling, a glassy structure”. Tg is a temperature at which a
molecule is unable to reach a kinetic equilibrium during the loss of thermal energy within
the time scale of the experiment, which results in the change of temperature dependence
of the enthalpy and volume [9]. Therefore, an amorphous molecule is kinetically frozen
in a thermodynamically unstable state at temperatures below its Tg. At temperatures or
relative humidities (RHs) above Tg, amorphous solids exhibit a rubbery state with low
viscosity, whereas at temperatures or RHs below Tg, they exhibit a glassy-rigid property
with high viscosity. The two physical states of amorphous solids become more distinct as
the temperature moves further away from Tg. When an amorphous solid is exposed to
lower temperature or RH, it will have higher viscosity resulting in more rigid and brittle
structure. Conversely, when it is exposed to higher temperature or RH above its Tg, it
will have a rubbery characteristic until it changes to a liquid state. The chemical stability
of amorphous solids is greater below Tg than above Tg.
There are many amorphous compounds that are commonly used in the food
industry. Some of the polysaccharides such as pectin, gums, maltodextrins, and modified
starches are present as amorphous solids upon extraction and processing. Moreover, some
powdered products such as powdered milk and whey protein also exhibit amorphous
solid properties. Some examples of polymers that are commonly used to inhibit
crystallization in the pharmaceutical industry are poly(vinylpyrrolidone)(PVP) and
poly(vinylpyrrolidone-vinyl acetate) (PVPVA). The ability of an amorphous compound,
such as a polymer, to inhibit the crystallization of other ingredients will be further
discussed below. Amorphous solids are preferred compared to the crystalline form of
hydrophobic compounds in pharmaceutical manufacturing to increase solubility [10],
thus increasing the bioavailability [11, 12] of active pharmaceutical ingredients (API).
Moreover, amorphous solids can be unintentionally formed during food formulation and
processing steps, such as milling, granulating, rapid vapor evaporation, and freeze drying

6
6
[13, 14]. Therefore understanding the formulations and conditions in which a crystalline
compound can be rendered amorphous are important.
1.5 Tendency of Amorphous Compounds to Convert to Crystalline Compounds
Amorphous compounds are thermodynamically less stable than crystalline
compounds. An amorphous solid has higher molecular movement due to its short ordered
molecular structure, resulting in higher Gibbs free energy (Fig 1.2) [14]. Therefore, the
metastable amorphous compounds have a tendency to revert back to the crystalline form
after a period of time. The amount of time this conversion to a crystalline structure takes
is dependent on the mobility of the solid, which increases dramatically above the Tg.
Fig 1.2. Schematic illustration of the change in volume or enthalpy with temperature for a
material undergoing crystallization or a glass transition. [13] [adapted from Elliott (1983)]
Crystallization either from an amorphous solid or liquid follows two phases:
nucleation and growth. For crystallization to happen, crystal nuclei have to be present in
the system. The nucleation process is more favorable in the presence of an impurity or a
foreign material. Foreign materials acts as a site where molecules aggregate into a
disorder packed cluster, which is then reorganized to form nucleus resembling the final
crystal structure. The nucleation process requires higher activation energy. However,
once crystal nuclei are formed, crystal growth happens at a faster rate since it requires
less energy that nucleation
In conditions above the Tg, amorphous solids have higher mobility which enables a
rearrangement of the structure to the lowest energy state at higher temperature (closer to

7
7
Tm) which is favorable for crystal growth. If the temperature is above Tg, but closer to
Tg than Tm, the amorphous solid has a higher tendency for crystal nucleation than crystal
growth. Thus, the maximum rate of crystallization of amorphous solids occurs at a
temperature between Tg and Tm (Fig 1.3) [9]. It has been misrepresented in the food
science literature that amorphous solids are ‘stable’ below the Tg. In other fields of study,
it has been documented that many glassy materials still exhibit significant molecular
mobility and enthalpy relaxation at temperatures significantly below their Tg [15]. It is
therefore of interest, when trying to stabilize a crystalline compound in an amorphous
state, to understand the effects of storage conditions on the physical stability of the solid,
including the rate of crystallization
Fig 1. 3. Schematic illustration of the parameters controlling crystallization from
amorphous solid [9] [adapted from [16]]
1.6 Formation of Amorphous Solid Dispersions
The formation of a solid dispersion can reduce the rate of amorphous solid
crystallization. By definition, a solid dispersion is a dispersion of one or more active
ingredients in an inert carrier or matrix in the solid state [17]. The most common
methods for creating amorphous solid dispersions from a crystalline solid are: vapor
condensation, precipitation from solution, supercooling of melt, and milling and
compaction (Fig 1.4) [9]. These processes prevent molecules in the system from
rearranging into a long - range ordered crystalline structure. Instead, a short - range
ordered amorphous solid is formed. Thermodynamically, when a solution is cooled
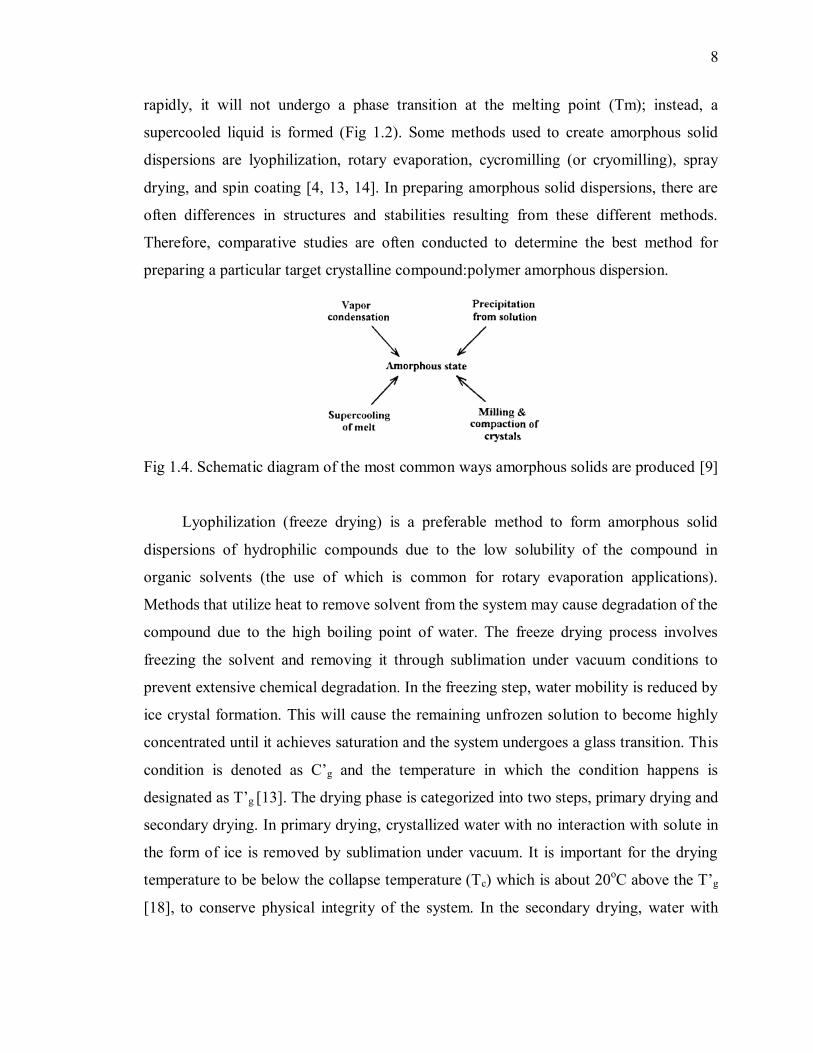
8
8
rapidly, it will not undergo a phase transition at the melting point (Tm); instead, a
supercooled liquid is formed (Fig 1.2). Some methods used to create amorphous solid
dispersions are lyophilization, rotary evaporation, cycromilling (or cryomilling), spray
drying, and spin coating [4, 13, 14]. In preparing amorphous solid dispersions, there are
often differences in structures and stabilities resulting from these different methods.
Therefore, comparative studies are often conducted to determine the best method for
preparing a particular target crystalline compound:polymer amorphous dispersion.
Fig 1.4. Schematic diagram of the most common ways amorphous solids are produced [9]
Lyophilization (freeze drying) is a preferable method to form amorphous solid
dispersions of hydrophilic compounds due to the low solubility of the compound in
organic solvents (the use of which is common for rotary evaporation applications).
Methods that utilize heat to remove solvent from the system may cause degradation of the
compound due to the high boiling point of water. The freeze drying process involves
freezing the solvent and removing it through sublimation under vacuum conditions to
prevent extensive chemical degradation. In the freezing step, water mobility is reduced by
ice crystal formation. This will cause the remaining unfrozen solution to become highly
concentrated until it achieves saturation and the system undergoes a glass transition. This
condition is denoted as C’g and the temperature in which the condition happens is
designated as T’g [13]. The drying phase is categorized into two steps, primary drying and
secondary drying. In primary drying, crystallized water with no interaction with solute in
the form of ice is removed by sublimation under vacuum. It is important for the drying
temperature to be below the collapse temperature (Tc) which is about 20oC above the T’g
[18], to conserve physical integrity of the system. In the secondary drying, water with

9
9
strong interactions with solutes is removed from the frozen concentration. Since the
temperature is usually increased to 25-60oC in the secondary drying step, it is essential to
remove all ice in the primary drying step to prevent melt-back [13].
1.7 Effects of polymer in increasing stability of amorphous solid
Many polymers have crystallization inhibition properties, thus increasing the stability of
amorphous solid dispersions when used at the ‘right’ ratio in a given preparation
technique [6, 7]. Molecular mobility is reduced in the presence of a polymer due to
interactions between the polymer and the target molecule, which leads to a coupling of
molecular motions [19]. The ability of a polymer to reduce molecular mobility of the
binary mixture prevents the target molecule from rearranging into a more ordered
crystalline structure.
The ability of polymer to inhibit the crystallization of amorphous compound
depends on the properties of both the target compound and the polymer. Acidic polymers,
such as polystyrine sulfonic acid (PSSA) and polyacrylic acid (PAA) were shown to have
better crystallization inhibitor properties for basic compounds, such us compounds with
amide groups. While for acidic target compounds, less acidic polymers, such as
hydroxypropylmethyl cellulose acetate succinate (HPMCAS), were found to have better
crystallization inhibitor properties [20]. There are several thoughts on how to select the
best polymer for a target compound, which will be summarized below.
To increase the stability of amorphous blends, it is often of interest to increase the
Tg of the blend. The addition of material with higher Tg, such as polymer, will increase
the Tg of the binary mixture (by an averaging effect of all the Tgs of the compounds in
the system, which is often estimated using the Fox or Gordon-Taylor equations) resulting
in a more stable dispersion [13]. In a study of MK-0591, a model drug with high Tg,
addition of a polymer with a Tg higher than the model drug resulted in an increase of Tg
of the solid dispersion. The increase of Tg of the binary mixture resulted in formation of
a more stable system [21]. The crystallization of food model containing sucrose, lactose,
fructose, and high amylopectin starch was highly influenced by the Tg of the system. At
temperature above the Tg, the increase of molecular mobility resulted in the structural
10
10
collapsed and stickiness of the amorphous food model[22]. However, the addition of a
small amount of polymer to an amorphous solid dispersion has the potential to create a
substantial excess free volume which would not increase the Tg of the binary system as
high as theoretically predicted [9]. This correlation between the anti-plasticization effect
of polymer and crystallization inhibition activity of bifonazole and nimelsulfide was not
observed in 5% wt/wt polymer dispersion [23]. A similar observation is seen in
indomethacin solid dispersions with 5% wt/wt poly(vinylpyrrolidone) (PVP).
Crystallization of the indomethacin dispersion is not inhibited due to molecular weight
and Tg of the polymer, instead, it is more likely due to the ability of polymer to form
hydrogen bond with indomethacin [24].
Molecular interactions between the target molecule and polymer are known to
play an essential role in inhibiting crystallization [20, 23-26]. Polymers can retard
crystallization by forming specific interactions, such as hydrogen bond interactions, with
the target molecule. The ability of polymer to interact with a target compound depends, at
least in part, on the hydrogen bond donor and acceptor strengths between the polymer
and target compound. However, the specific hydrogen interactions between a target
molecule and a polymer as well as specific properties of polymers for inhibiting
crystallization have not been clearly identified yet. In addition, the ability of polymer to
form hydrogen bonding interaction was found to influence the Tg of a compound, and
vice versa. The hydroxyl region hydrogen bond strength of various types of polymer was
shown to have linear correlation with the Tg of the polymer. Polymer with higher
molecular weight and Tg were shown to have a decreased in hydrogen bond strength and
densities[27]. Similarly, the Tg of the various sugar matrix increased as the interaction in
the hydroxyl region weakened. Moreover, good correlation was found between the
increase in Tg and the magnitude of interaction strength reduction in the hydroxyl
region[28].
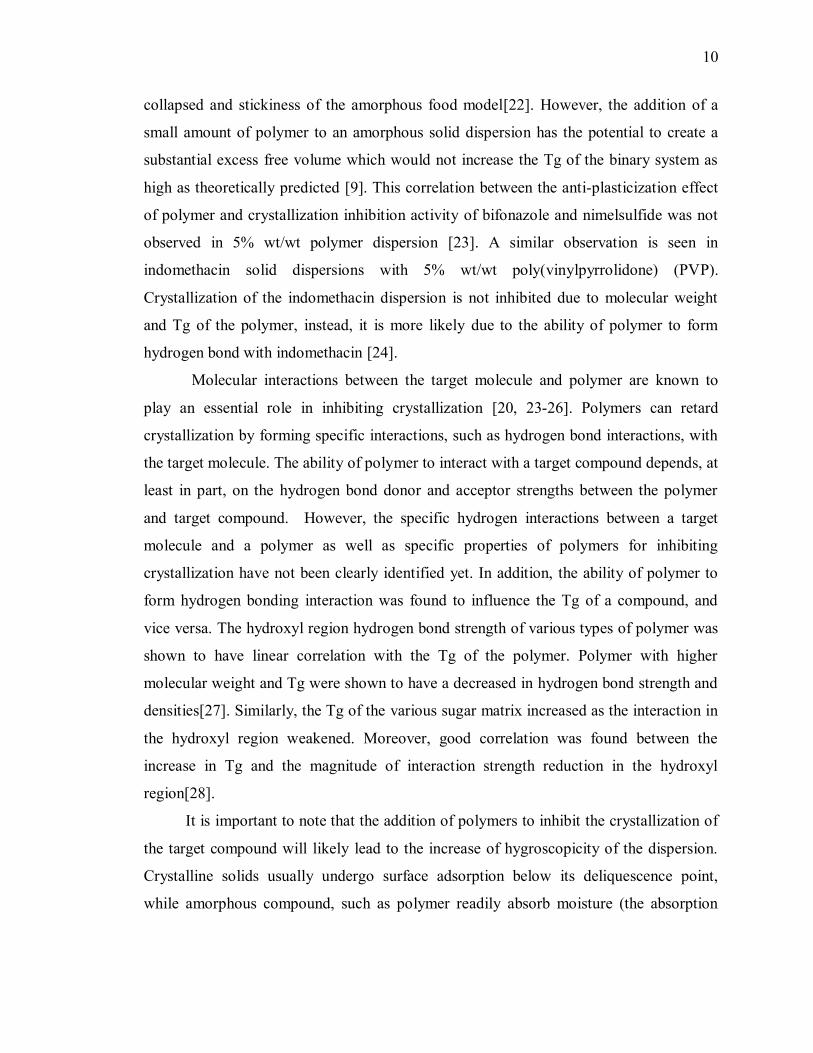
It is important to note that the addition of polymers to inhibit the crystallization of
the target compound will likely lead to the increase of hygroscopicity of the dispersion.
Crystalline solids usually undergo surface adsorption below its deliquescence point,
while amorphous compound, such as polymer readily absorb moisture (the absorption

11
11
process brings much more water into the system than surface adsorption). Moreover, the
physical alteration of crystalline solid to amorphous solid in a solid dispersion will allow
the target compound to be more hygroscopic than its crystalline counterpart [29]. Water
acts as a plasticizing agent that increases the molecular mobility of a compound leading
to an increased rate of crystallization [22, 30]. The formation of a solid dispersion of a
hydrophobic compound, felodipine, was shown to increase the hygroscopicity of the
system in comparison with amorphous felodipine. The amount of moisture absorbed
depended on the types and amount of polymer[31]. Therefore, is important to understand
the most effective ratio of polymer for inhibiting crystallization while minimizing the
hygroscopicity of a system.
1.8 Hydrogen Bonding Interaction
By definition, a hydrogen bond is the interaction between the hydrogen attached to
an electronegative atom of a molecule and another electronegative atom of either the
same molecule or a different molecule. Hydrogen bond patterns between molecules vary
depending on the strength of hydrogen bond donors and acceptors present, as well as the
conformation of the molecules. Different functional groups have clear preference for their
specific hydrogen bonding interaction. Strong proton donors (such as donors in
carboxylic acid, amides, and urea) are more preferred when forming hydrogen bonds in
comparison to less acidic protons [32]. Hydrogen bond acceptor strength can be predicted
with the pKBHX scale. The pKBHX scale is a database designed for medicinal chemists, and
it evaluates the acceptor strength for a large variety of functional groups based on the
hydrogen bond basicity. The functional groups with lower pKBHX scale have weaker
hydrogen bond acceptors. For example, functional groups with pKBHX between 1.8 and
3.0, such as amides, are considered as a strong hydrogen bond acceptors; while functional
groups with pKBHX between 0.5 and 1.8, such as ketone, ether, ester, and alcohol, are
considered as a medium hydrogen bond acceptor [33]. In addition, the best donor will
interact with the best acceptor present. [32, 34]
Intramolecular hydrogen bonds forming six-membered-rings are preferentially
formed over intermolecular hydrogen bonds [32]. The ability of a compound to form

12
12
intramolecular hydrogen bonds reduces its crystallization tendency. When an
intramolecular hydrogen bond is formed, some of the hydrogen bond donors and
acceptors are not available to form intermolecular interactions with other same molecules.
However, it will also prevent the interaction between a target molecule and polymer,
which is hypothesized to be an essential parameter in creating stable amorphous
dispersions.
Polymers with stronger hydrogen bond donors and weaker acceptors than the target
compound, or vice versa, are hypothesized to have the best properties in forming stable
amorphous solid dispersions. This system will result in the maximum interaction between
polymer and target molecule since the strongest donor will interact with the strongest
acceptor. For example, binofizole, a drug compound with a strong hydrogen bond
acceptor, was found to better interact with polymers with a strong hydrogen bond donor
and weak hydrogen bond acceptor such as PAA; while weaker interaction was formed
between binofizole and polymers with only hydrogen bond acceptors such as PVP[23].
The presence of water in the dispersion decreased the strength of target compound –
polymer interaction. The hydrogen bond interaction strength between felodipine and PVP
was dramatically decreased in the presence of moisture. The felodipine – PVP interaction
was replaced by felodipine – felodipine interaction resulting in the crystallization of the
system[35].
1.9 Hydrogen Bonding Capability of L-Ascorbic Acid
Based on its chemical structure, L-ascorbic acid consists of six hydrogen bond
acceptors and four hydrogen bond donors. The ability of those donors and acceptors to
form hydrogen bonds and the strength of the hydrogen bonds formed varies. In a single
L-ascorbic acid, three hydroxyl groups act as both donor and acceptor and one hydroxyl
group acts only as a donor [2]. The hydroxyl groups O(2)-H and O(3)-H, which is linked
with the double bond in the ring (Fig 1.5), exhibit strong acid properties and participate in
much stronger hydrogen bonding interactions than hydroxyl groups O(5)-H and O(6)-H
[36]. However, the hydroxyl group O(3)-H only acts as a hydrogen bond donor (Fig 1.6).

13
13
The oxygen in the carbonyl group O(1) only serves as a hydrogen bond acceptor. There is
no intramolecular hydrogen bond formed in L-ascorbic acid [2].
Fig 1.5. L-ascorbic acid carbon, oxygen, and hydrogen atom designation [adapted from [2]
Fig 1.6. L-ascorbic acid hydrogen bonding for two independently determined molecules
(molecules A and B). Oxygen atoms in neighboring molecules are indicated by triple
circles. [2]
Specific intermolecular interactions between crystalline ascorbic acid can be
detected by infrared spectroscopy (Fig 1.7). Each vibration, stretching, and bending trait
in each bond can be specified at a certain wavenumber. The regions that are going to be
focused in this study are the hydroxyl group stretching (3411cm-1
, 3312 cm-1
, 3022 cm-1
)
and the carbonyl group stretching (1747 cm-1
) which represent the functional groups that
participate in hydrogen bonding (Table 1.2) [37, 38].

14
14
Fig 1.7. FTIR spectrum (transmittance) of a grown ascorbic acid crystal [37]
Table 1.2. FTIR wavenumber assignments for ascorbic acid functional groups [37]
Preliminary data collected by a former graduate student in Dr. Mauer’s lab support
the observation that ascorbic acid is amorphous when present in a lyophilized
anthocyanin – rich extract:ascorbic acid blend. It is of interest to determine which
component of the fruit extract inhibited the crystallization of the ascorbic acid. It is
hypothesized that the pectin present in the extract could have contributed to this
observation. The data of the study are shown in the preliminary data section of this paper.
15
15
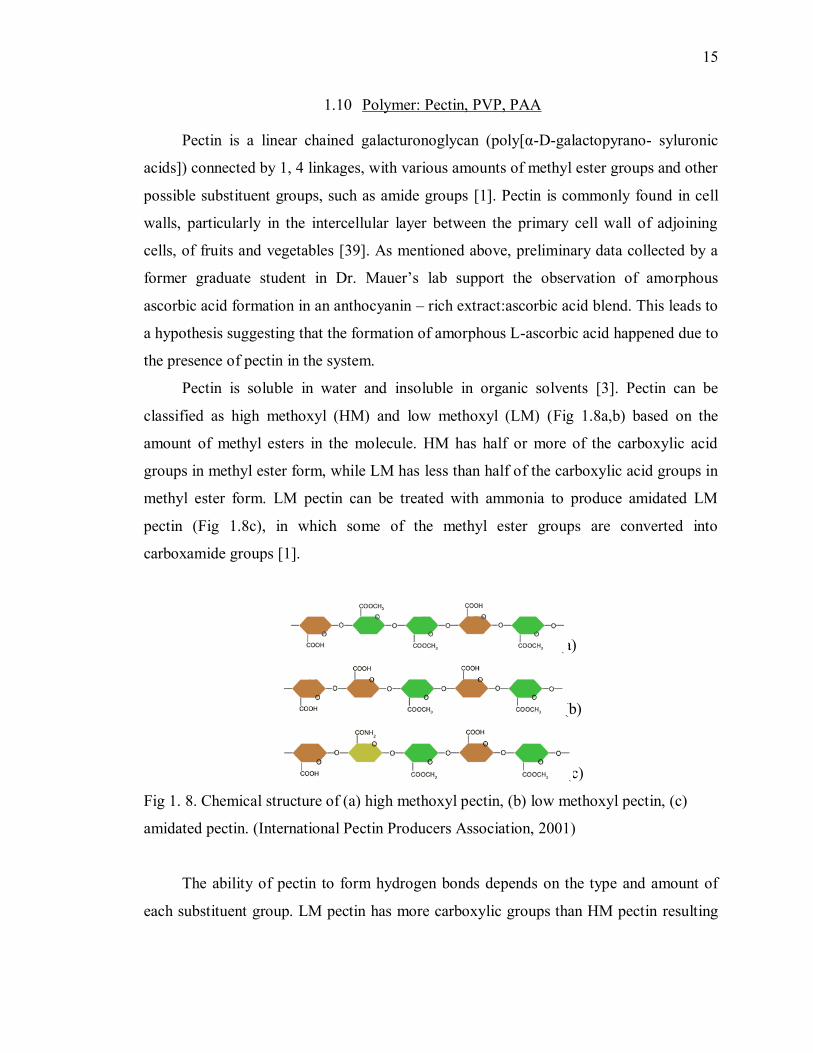
1.10 Polymer: Pectin, PVP, PAA
Pectin is a linear chained galacturonoglycan (poly[α-D-galactopyrano- syluronic
acids]) connected by 1, 4 linkages, with various amounts of methyl ester groups and other
possible substituent groups, such as amide groups [1]. Pectin is commonly found in cell
walls, particularly in the intercellular layer between the primary cell wall of adjoining
cells, of fruits and vegetables [39]. As mentioned above, preliminary data collected by a
former graduate student in Dr. Mauer’s lab support the observation of amorphous
ascorbic acid formation in an anthocyanin – rich extract:ascorbic acid blend. This leads to
a hypothesis suggesting that the formation of amorphous L-ascorbic acid happened due to
the presence of pectin in the system.
Pectin is soluble in water and insoluble in organic solvents [3]. Pectin can be
classified as high methoxyl (HM) and low methoxyl (LM) (Fig 1.8a,b) based on the
amount of methyl esters in the molecule. HM has half or more of the carboxylic acid
groups in methyl ester form, while LM has less than half of the carboxylic acid groups in
methyl ester form. LM pectin can be treated with ammonia to produce amidated LM
pectin (Fig 1.8c), in which some of the methyl ester groups are converted into
carboxamide groups [1].
(a)
(b)
(c)
Fig 1. 8. Chemical structure of (a) high methoxyl pectin, (b) low methoxyl pectin, (c)
amidated pectin. (International Pectin Producers Association, 2001)
The ability of pectin to form hydrogen bonds depends on the type and amount of
each substituent group. LM pectin has more carboxylic groups than HM pectin resulting

16
16
in a better hydrogen bond donor capability than HM pectin. If there is a difference in
intermolecular interaction between ascorbic acid and LM pectin compared to HM pectin,
the amount of hydrogen bond donor difference is essential to help understand the
interaction capability of ascorbic acid to LM pectin compared to with HM pectin.
Moreover, based on pKBHX values, the amide group is a better hydrogen acceptor group
than the ester group [33].
Polyvinylpyrrolidone (PVP) and polyacrylic acid (PAA) are synthetic polymers that are
commonly used in the pharmaceutical area as polymers for creating amorphous solid dispersions.
Unlike pectin, PVP and PAA consist of a single monomer with less functional groups that are
involved in hydrogen bonding. Therefore, the hydrogen bond between ascorbic acid and PVP or
PAA would be simpler to understand.
PVP consists of vinylpyrrolidone monomer (Fig 1.9a) and has wide range of
molecular weight from 2500 to 300000 which is classified according to the K value
(Table 1.3) [40]. PVP has good solubility in both organic solvent and water. The high
solubility of PVP in water results in increased wettability of the dispersion, thus
increasing the solubility of the dispersion in water. Generally, PVP has high a Tg.
However, the Tg of PVP depends on the molecular weight and the moisture content of
the polymer [40]. For example, the Tg of PVP K25 was observed at 155oC [40] and the
Tg of PVP K12 is at 91oC [41]. The molecular weight and sizes of PVP also influence its
solubility in aqueous solution. PVP with higher molecular weight and longer chain length
has lower solubility and produces more viscous solutions upon dissolution [40]. PVP has
no hydrogen bond donor and has a very strong hydrogen bond acceptor [41].
PAA is an acidic polymer that consists of acrylic acid monomer (Fig 1.9b).
Similar to PVP, it is soluble in both water and organic solvent. PAA has a very strong
hydrogen bond donor and medium strength acceptor [41].

17
17
Table 1.3. K value and molecular weight of PVP [40]
K Molecular weight (MW)
12 2500
15 8000
17 10000
25 30000
30 50000
60 400000
90 1000000
120 3000000
Fig 1.9. Structure of the polymers (a) PVP and (b) PAA
1.11 Methods to Analyze Physical Stability of Amorphous Solid Dispersions
The physical stability of amorphous solid dispersions can be characterized with
numerous different techniques. Some information that can be obtained through
characterization analyses are the structure and the thermodynamics of the amorphous
solid; the recrystallization rate; and the effect of a multicomponent system, such as the
presence of water and excipient [14].
Due to the structural difference between amorphous and crystalline solids, methods
that measure the diffraction of electromagnetic radiation, such as X-Ray Powdered
Diffraction (XRPD), can be used to characterize amorphous solids. Amorphous solids
lack ordered, long-range, three – dimensional order. Therefore, the diffraction of
electromagnetic radiation of amorphous materials is irregular compare to crystalline
(a) (b)

18
18
materials [9]. XRPD patterns with sharps peaks indicate the presence of crystalline
structures, while samples that lack sharp peaks in XRPD patters are amorphous solids.
Microscopy techniques, such as polarized light microscopy, can also be used to identify
the presence of amorphous material [42]. The presence of birefringence under the
microscope signifies crystalline structure. The lack of birefringence indicates amorphous
solid.
Spectroscopy techniques have high resolution in the characterization of amorphous
solids. Spectroscopy techniques that are commonly used to identify amorphous
compounds include nuclear magnetic resonance (NMR), Raman Infrared (IR), Fourier
Transform Infrared (FTIR), and electron spin resonance (ESR). Spectroscopy methods
can be used to determine Tg, and to quantify the amorphous content in semi crystalline
systems and molecular relaxation as function of temperatures [9, 43-46]. Moreover,
spectroscopy techniques such as FTIR, are commonly used to monitor the presence of
specific interactiosn between the target crystalline solid and the polymer [20, 24, 26, 41,
47]. FTIR measures the change in dipole moment, and the magnitude of the dipole
moment change determines the intensity of the peak in the spectra. Hydrogen bond
interactions between the polymer and target compound cause peak position shifts and
peak shape alternation relative to the peaks observed in the pure form in FTIR spectra [24,
26, 41]. The peak position and shape alternation correspond to the specific region in the
infrared spectra where the interaction occurred, for example the hydroxyl (3800 – 3000
cm-1
) and carbonyl (1900 - 1500 cm-1
) region. Peak shifts to a lower wavenumber
indicate more interaction in that region, whereas peak shifts to a higher wavenumber
indicate less interaction [41]. Moreover, new peaks could develop which would also
indicate the interaction between the target compound and polymer that is not present in
the pure form.
Thermal analyses, such as DSC, have been widely used to characterize amorphous
systems. DSC has been used extensively to determine the glass transition temperature of
amorphous materials [4, 13, 48]. Thermodynamic properties of amorphous materials can
be resolved using thermal analysis. One of the essential thermodynamic properties of
amorphous solids is the heat capacity (Cp). The heat capacity of an amorphous compound
19
19
in the glassy state is higher than in the rubbery state. Therefore, the difference in the rate
of heat capacity change determines its glass transition temperature [49]. Moreover, as
mentioned above, at temperatures below its Tg, an amorphous material is deemed to be
kinetically frozen in its unstable state. However, it has been shown that the molecules still
have significant molecular mobility and thus will slowly relax to the metastable
supercooled liquid. Thermal analysis can be used to determine the enthalpy change and
the relaxation time of a glassy amorphous material [15].
Moisture sorption isotherm is another method that can also be used in some cases
to qualitatively indicate the presence of amorphous materials. A deliquescent crystalline
solid undergoes adsorption and capillary condensation on the surface until it reaches its
deliquescence point, above which point which the solid dissolves [50]. In contrast,
amorphous material absorbs a relatively large amount of water as the percent relative
humidity (%RH) is increased [51]. In addition, moisture sorption isotherms can also be
used to determine whether an amorphous compound is in its glassy or rubbery state. It
has been observed that amorphous compound in glassy state absorbs less water compare
to in rubbery state [46]. Not only will this document moisture sorption profiles of the
samples of amorphous solids, but it will also reflect the stability over different moisture
contents and the extent of crystallinity. If a sample recrystallizes during the moisture
sorption analysis, moisture is often lost from the sample which would be documented as a
decrease in sample mass at that RH.
In addition to the methods that have been discussed, there are many other
techniques that can be used to characterized amorphous compounds, as shown in Table
1.4.

20
20
Table 1.4. Techniques for characterizing amorphous solid [14]
1.12 Chemical Stability of L-Ascorbic Acid in Foods and Solid Model Systems
Physical structure manipulation of ascorbic acid (VitC) will likely not only
influences the physical stability, but also the chemical stability of the system. Ascorbic
acid is an essential nutrient that is commonly fortified in food products. However,
ascorbic acid is reported to be one of the least stable vitamins, and its degradation is a
common cause of end of shelf-life. Many studies have investigated the chemical stability
of crystalline ascorbic acid and vitamin C stability in whole foods. However, no direct
comparisons of crystalline and amorphous ascorbic acid stability were found in the
literature. Identifying where ascorbic acid is amorphous and comparing the stability of
amorphous and crystalline forms could enhance the understanding of vitamin stability in
dry and intermediate moisture food products.
Crystalline ascorbic acid degradation is influenced by %RHs and temperature [52,
53]. However, it was relatively stable at a conditions below its deliquescence point.
Deliquescence is a first order phase transition of crystalline solid from solid phase to
solution phase at specific %RH (at a set temperature and pressure) [54]. Different
crystalline solids have specific %RHs, called the critical %RH (RHo), in which that
crystalline solid deliquesces. The RHo of ascorbic acid is 98% at 25oC. Minimal
degradation was observed when crystalline ascorbic acid was stored at 0-98%RH, 25oC.

21
21
However, at 98%RH, the white crystalline AA appeared as slightly yellow crystals after
weeks of storage. At 40oC, ascorbic acid was stable when stored at 0 – 85%RHs, but
significant degradation was observed in samples stored above the RHo (98%RH at 25oC
but slightly lower at 40oC)[53]. Therefore, the chemical stability of ascorbic acid is
influenced by storage temperature and %RHs as well as RHo of the crystalline solid. In a
low moisture powder system fortified with vitamin C (5.4% w.b, in the presence of
protein and carbohydrate), the chemical degradation was increased with increasing water
activity and at temperatures further away from the Tg. In these systems, Ascorbic acid
degradation was observed at water activities as low as 0.11, which is well below the RHo
of ascorbic acid [55].
Many studies have also investigated the stability of ascorbic acid in various fruits
[56-58] and beverage systems [59-64]. Storing fruits in an environment with reduced
oxygen content and elevated carbon dioxide content up to 10% could reduce the rate of
ascorbic acid degradation. Processing, such as boiling, frying, steaming, significantly
reduce the ascorbic acid content although the amount of ascorbic acid degraded varies
depending on the type of processing [56]. For example, boiling causes significantly
higher ascorbic acid degradation compared to steaming and frying [65]. Ascorbic acid
stability also varies depending on the type of the beverage system. The ascorbic acid in
fruit juices fortified with VitC was found to be less stable than fruit juices without
fortification, beer, wine, and carbonated drinks indicated by the highest content of
degradation product [63]. However, limited information was found regarding the direct
comparisons of crystalline and amorphous ascorbic acid stability found in the literature,
especially at common storage temperatures [66]. This information could enhance the
understanding of vitamin stability in dry and intermediate moisture food products.
1.13 L-Ascorbic Acid Oxidation Mechanisms
The most prominent cause of ascorbic acid degradation is the oxidation reaction.
There are different ascorbic acid oxidation pathways that result in the loss of ascorbic
acid content in a product (Fig 1.10). The general mechanism of ascorbic acid oxidation
involves the oxidation of ascorbic acid to dehydroascorbic acid (DHAA) followed by the

22
22
hydrolysis of DHAA to 2,3-diketogulonic acid (DKG). Similar to ascorbic acid, DHAA
has vitamin activity for the body as it is mainly reduced to ascorbic acid in the body.
However, the oxidation to DKG results in the loss of vitamin activity. DKG further can
oxidize, polymerize, and dehydrate to form various end products. Oxygen is the primary
cause of ascorbic acid oxidation. Oxygen reacts with ascorbic acid to produce radicals
that are reactive and ready to interact with other compounds to produce additional
radicals. The presence of metal catalyst such as iron (Fe3+
) and copper (Cu2+
) increases
the oxidation reaction by decreasing the activation energy required for oxidation.
Moreover, at pHs higher than its pKa1 (4.04), the rate of ascorbic acid degradation is
higher because the fully protonated ascorbic acid is deprotonated to form ascorbate
monoion (AH-) which readily reacts with radicals or metals [1].
In the presence of oxygen and metal catalyzers, ascorbic acid undergoes catalyzed
aerobic pathway degradation. The intermediate degradation product,
semidehydroascorbate radical (AH•), is formed from the interaction of AH- with metal
catalyst or singlet oxygen (O•). The AH• is further oxidized to form DHAA which is then
hydrolyzed to form DKG. Ascorbic acid degradation can also happen without the
presence of oxygen through the anaerobic degradation pathway. In this pathway, AH2
undergoes ketonization and is then hydrolyzed to DKG. Regardless if it was formed
through anaerobic or aerobic degradation pathway, the formation of DKG leads to the
opening of the lactone ring present in ascorbic acid resulting in the loss of vitamin C
activity. DKG can be further oxidized, polymerized, and dehydrated to form various end
products with no vitamin activity. More than 50 low molecular weight products have
been identified as ascorbic acid degradation products. The general types of vitamin C
decomposition are polymerized intermediates, unsaturated carboxylic of 5- and 6- carbon
chain, and compounds with five or fewer carbons. The intermediate products of ascorbic
acid oxidation, such as melanoidins, also lead to the formation of brown colored products
[1].

23
23
Fig 1.10. Mechanisms of oxidative and anaerobic degradation of ascorbic acid [1]
1.14 Methods in Monitoring Chemical Stability of L-Ascorbic Acid
There are many methods to monitor the chemical stability of ascorbic acid, which
include titration, UV/Vis spectroscopy, and HPLC [53, 66-68]. One of the methods that
can be used to monitor chemical stability of ascorbic acid is a microplate reader assay
that uses UV/Vis spectroscopy to quantify ascorbic acid content. The microplate reader
assay was initially developed to measure the ascorbic acid content in blood plasma [69]
and then was adapted to measure ascorbic acid content in food products such as tomato
[70]. The method is based on the reduction of ferric (Fe3+
) to ferrous (Fe2+
) by ascorbic
acid. The Fe2+
formed reacts with dipyridil to form a chelate complex that absorbs light at
550nm [69]. In this analysis, the higher ascorbic acid content in the sample results in
more Fe2+
formation and higher absorbance at 550nm.
Colorimetry techniques have also been used to monitor the chemical stability of
ascorbic acid [60, 61, 71, 72]. Correlation has been shown between ascorbic acid
degradation and the development of brown pigment [61, 71]. For example, the brown
color development in cashew apples overtime was determined to be caused by ascorbic

24
24
acid degradation [72]. The formation of 5-hydroxymethyl furfural (HMF) and furfural are
correlated with the browning of fruit juices and are used as an indicator of temperature
abuse during storage [61, 62]. Discoloration of products containing ascorbic acid was
increased with increasing storage %RHs and temperatures [52, 71]. Therefore, color
analysis can be a good indicator in monitoring ascorbic acid degradation. Monitoring the
discoloration of food is also essential to ensure acceptable appearance of food products.
Color is found to be related to the perception of other sensory attributes such as flavor
and sweetness [73, 74].
High Performance Liquid Chromatography (HPLC) is the most common method to
monitor ascorbic acid overtime as well as to identify ascorbic acid degradation products.
Due to the specific affinity of ascorbic acid to the stationary phase, ascorbic acid can be
directly measured with HPLC which is one of the advantages of using the HPLC
technique. Moreover, various degradation products of ascorbic acid such as furfural, 5-
(Hydroxymethyl) furfural (5-HMF), furfural, 2-furoic acid, 2,5-dimethyl-4-hydroxy-
3(2H)-furanone (DMHF), 2-acetylfuran, can also be evaluated with HPLC [63].
1.15 Thesis Objectives
The objective of this study was to determine the effects of polymer types on
inhibiting the crystallization of L-ascorbic acid amorphous solid dispersions at various
temperatures and relative humidities (RHs). The effects of polymers hydrogen bond
capability, glass transition temperature (Tg), and hygroscopicity were compared to
understand the specific property of polymer that resulted in the most stable L-ascorbic
acid amorphous solid dispersion. The ability of polymer to interact with L-ascorbic acid,
which was hypothesized to be the key parameter in the formation a stable of amorphous
solid dispersion, was further studied to understand the involvements of the different
functional groups in hydrogen bond interaction and the formation mechanisms of the
hydrogen bond interaction. Moreover, the chemical stability of L-ascorbic acid in the
presence and absence of polymers was studied at various temperature and RHs. The
effects of storage temperature, storage %RHs, the physical states of VitC, and the ability

25
25
of polymer to interact with VitC on the chemical stability of VitC were studied to give
better understanding on the parameters that influenced VitC chemical stability.

26
26
1.16 References
1. Fennema, O., Fennema's Food Chemistry Fourth Edition. 2006, Boca Raton:
CRC Press. 467-476.
2. Hvoslef, J., CRYSTAL STRUCTURE OF L-ASCORBIC ACID VITAMIN C .I. X-
RAY ANALYSIS. Acta Crystallographica Section B-Structural Crystallography and
Crystal Chemistry, 1968. B 24: p. 23-&.
3. Rowe, R.C., Sheskey, P. J., & Quinn, M. E., Handbook of pharmaceutical
excipients. (6th ed.). 2009, Graylake, IL: Pharmaceutical Press.
4. Islam, M.I.U., R. Sherrell, and T.A.G. Langrish, An Investigation of the
Relationship between Glass Transition Temperatures and the Crystallinity of
Spray-Dried Powders. Drying Technology, 2010. 28(3): p. 361-368.
5. Andersen, A.B. and L.H. Skibsted, Glass transition of freeze-concentrated
aqueous solution of ascorbic acid as studied by alternating differential scanning
calorimetry. Food Science and Technology-Lebensmittel-Wissenschaft &
Technologie, 1998. 31(1): p. 69-73.
6. Serajuddin, A.T.M., Solid dispersion of poorly water-soluble drugs: Early
promises, subsequent problems, and recent breakthroughs. Journal of
Pharmaceutical Sciences, 1999. 88(10): p. 1058-1066.
7. Ford, J.L., THE CURRENT STATUS OF SOLID DISPERSIONS. Pharmaceutica
Acta Helvetiae, 1986. 61(3): p. 69-88.
8. Palzer, S., The relation between material properties and supra-molecular
structure of water-soluble food solids. Trends in Food Science & Technology,
2010. 21(1): p. 12-25.
9. Hancock, B.C. and G. Zograf, Characteristics and significance of the amorphous
state in pharmaceutical systems. Journal of Pharmaceutical Sciences, 1997. 86(1):
p. 1-12.
10. Hancock, B.C. and M. Parks, What is the true solubility advantage for amorphous
pharmaceuticals? Pharmaceutical Research, 2000. 17(4): p. 397-404.

27
27
11. Kim, M.-S., et al., Preparation, characterization and in vivo evaluation of
amorphous atorvastatin calcium nanoparticles using supercritical antisolvent
(SAS) process. European Journal of Pharmaceutics and Biopharmaceutics, 2008.
69(2): p. 454-465.
12. Ambike, A.A., K.R. Mahadik, and A. Paradkar, Spray-dried amorphous solid
dispersions of simvastatin, a low T-g drug: In vitro and in vivo evaluations.
Pharmaceutical Research, 2005. 22(6): p. 990-998.
13. Craig, D.Q.M., et al., The relevance of the amorphous state to pharmaceutical
dosage forms: glassy drugs and freeze dried systems. International Journal of
Pharmaceutics, 1999. 179(2): p. 179-207.
14. Yu, L., Amorphous pharmaceutical solids: preparation, characterization and
stabilization. Advanced Drug Delivery Reviews, 2001. 48(1): p. 27-42.
15. Hancock, B.C., S.L. Shamblin, and G. Zografi, MOLECULAR MOBILITY OF
AMORPHOUS PHARMACEUTICAL SOLIDS BELOW THEIR GLASS-
TRANSITION TEMPERATURES. Pharmaceutical Research, 1995. 12(6): p. 799-
806.
16. Jolley, J.E., MICROSTRUCTURE OF PHOTOGRAPHIC GELATIN BINDERS.
Photographic Science and Engineering, 1970. 14(3): p. 169-&.
17. Chiou, W.L. and Riegelma.S, PHARMACEUTICAL APPLICATIONS OF SOLID
DISPERSION SYSTEMS. Journal of Pharmaceutical Sciences, 1971. 60(9): p.
1281-&.
18. Sun, W.Q., Temperature and viscosity for structural collapse and crystallization
of amorphous carbohydrate solutions. Cryoletters, 1997. 18(2): p. 99-106.
19. Shamblin, S.L. and G. Zografi, Enthalpy relaxation in binary amorphous mixtures
containing sucrose. Pharmaceutical Research, 1998. 15(12): p. 1828-1834.
20. Van Eerdenbrugh, B. and L.S. Taylor, Small Scale Screening To Determine the
Ability of Different Polymers To Inhibit Drug Crystallization upon Rapid Solvent
Evaporation. Molecular Pharmaceutics, 2010. 7(4): p. 1328-1337.

28
28
21. Khougaz, K. and S.D. Clas, Crystallization inhibition in solid dispersions of MK-
0591 and poly(vinylpyrrolidone) polymers. Journal of Pharmaceutical Sciences,
2000. 89(10): p. 1325-1334.
22. Roos, Y.H. and M. Karel, PLASTICIZING EFFECT OF WATER ON THERMAL-
BEHAVIOR AND CRYSTALLIZATION OF AMORPHOUS FOOD MODELS.
Journal of Food Science, 1991. 56(1): p. 38-43.
23. Kestur, U.S., B. Van Eerdenbrugh, and L.S. Taylor, Influence of polymer
chemistry on crystal growth inhibition of two chemically diverse organic
molecules. Crystengcomm, 2011. 13(22): p. 6712-6718.
24. Matsumoto, T. and G. Zografi, Physical properties of solid molecular dispersions
of indomethacin with poly(vinylpyrrolidone) and poly(vinylpyrrolidone-co-
vinylacetate) in relation to indomethacin crystallization. Pharmaceutical Research,
1999. 16(11): p. 1722-1728.
25. Van Eerdenbrugh, B. and L.S. Taylor, An ab initio polymer selection methodology
to prevent crystallization in amorphous solid dispersions by application of crystal
engineering principles. Crystengcomm, 2011. 13(20): p. 6171-6178.
26. Taylor, L.S. and G. Zografi, Spectroscopic characterization of interactions
between PVP and indomethacin in amorphous molecular dispersions.
Pharmaceutical Research, 1997. 14(12): p. 1691-1698.
27. Wolkers, W.F., et al., A fourier-transform infrared spectroscopy study of sugar
glasses. Carbohydrate Research, 2004. 339(6): p. 1077-1085.
28. Imamura, K., et al., Temperature scanning FTIR analysis of hydrogen bonding
states of various saccharides in amorphous matrixes below and above their glass
transition temperatures. Journal of Physical Chemistry B, 2006. 110(31): p.
15094-15099.
29. Ahlneck, C. and G. Zografi, THE MOLECULAR-BASIS OF MOISTURE
EFFECTS ON THE PHYSICAL AND CHEMICAL-STABILITY OF DRUGS IN
THE SOLID-STATE. International Journal of Pharmaceutics, 1990. 62(2-3): p. 87-
95.

29
29
30. Salekigerhardt, A. and G. Zografi, NONISOTHERMAL AND ISOTHERMAL
CRYSTALLIZATION OF SUCROSE FROM THE AMORPHOUS STATE.
Pharmaceutical Research, 1994. 11(8): p. 1166-1173.
31. Konno, H. and L.S. Taylor, Ability of different polymers to inhibit the
crystallization of amorphous felodipine in the presence of moisture.
Pharmaceutical Research, 2008. 25(4): p. 969-978.
32. Etter, M.C., ENCODING AND DECODING HYDROGEN-BOND PATTERNS OF
ORGANIC-COMPOUNDS. Accounts of Chemical Research, 1990. 23(4): p. 120-
126.
33. Laurence, C., et al., The pK(BHX) Database: Toward a Better Understanding of
Hydrogen-Bond Basicity for Medicinal Chemists. Journal of Medicinal Chemistry,
2009. 52(14): p. 4073-4086.
34. Etter, M.C., HYDROGEN-BONDS AS DESIGN ELEMENTS IN ORGANIC-
CHEMISTRY. Journal of Physical Chemistry, 1991. 95(12): p. 4601-4610.
35. Marsac, P.J., et al., Effect of Temperature and Moisture on the Miscibility of
Amorphous Dispersions of Felodipine and Poly(vinyl pyrrolidone). Journal of
Pharmaceutical Sciences, 2010. 99(1): p. 169-185.
36. Falk, M. and M.J. Wojcik, EFFECT OF TEMPERATURE AND HYDROGEN-
BOND STRENGTH ON THE IR ABSORPTION OF ISOLATED OH
OSCILLATORS - CRYSTALLINE L-ASCORBIC-ACID. Spectrochimica Acta Part
a-Molecular and Biomolecular Spectroscopy, 1979. 35(10): p. 1117-1123.
37. Srinivasan, K. and K.V. Devi, Characterization of L-ascorbic acid single crystals
grown from solution with different solvents. Crystal Research and Technology,
2010. 45(9): p. 946-952.
38. Nath, M., et al., New organotin(IV) ascorbates: synthesis, spectral
characterization, biological and potentiometric studies. Spectrochimica Acta Part
a-Molecular and Biomolecular Spectroscopy, 2005. 61(1-2): p. 77-86.
39. Thakur, B.R., R.K. Singh, and A.K. Handa, Chemistry and uses of pectin - A
review. Critical Reviews in Food Science and Nutrition, 1997. 37(1): p. 47-73.

30
30
40. Leuner, C. and J. Dressman, Improving drug solubility for oral delivery using
solid dispersions. European Journal of Pharmaceutics and Biopharmaceutics,
2000. 50(1): p. 47-60.
41. Wegiel, L.A., et al., Crystallization of amorphous solid dispersions of resveratrol
during preparation and storage-Impact of different polymers. Journal of
Pharmaceutical Sciences, 2013. 102(1): p. 171-184.
42. Gupta, M.K., A. Vanwert, and R.H. Bogner, Formation of physically stable
amorphous drugs by milling with neusilin. Journal of Pharmaceutical Sciences,
2003. 92(3): p. 536-551.
43. Glotin, M. and L. Mandelkern, A RAMAN-SPECTROSCOPIC STUDY OF THE
MORPHOLOGICAL STRUCTURE OF THE POLYETHYLENES. Colloid and
Polymer Science, 1982. 260(2): p. 182-192.
44. Yoshimura, Y. and H. Kanno, RAMAN AND DIFFERENTIAL THERMAL-
ANALYSIS STUDIES OF AQUEOUS CSF SOLUTION IN THE GLASSY STATE.
Journal of Solution Chemistry, 1995. 24(7): p. 633-639.
45. Strobl, G.R. and W. Hagedorn, RAMAN-SPECTROSCOPIC METHOD FOR
DETERMINING CRYSTALLINITY OF POLYETHYLENE. Journal of Polymer
Science Part B-Polymer Physics, 1978. 16(7): p. 1181-1193.
46. Oksanen, C.A. and G. Zografi, MOLECULAR MOBILITY IN MIXTURES OF
ABSORBED WATER AND SOLID POLY(VINYLPYRROLIDONE).
Pharmaceutical Research, 1993. 10(6): p. 791-799.
47. Taylor, L.S. and G. Zografi, The quantitative analysis of crystallinity using FT-
Raman spectroscopy. Pharmaceutical Research, 1998. 15(5): p. 755-761.
48. Hancock, B.C. and G. Zografi, THE RELATIONSHIP BETWEEN THE GLASS-
TRANSITION TEMPERATURE AND THE WATER-CONTENT OF
AMORPHOUS PHARMACEUTICAL SOLIDS. Pharmaceutical Research, 1994.
11(4): p. 471-477.
31
31
49. Tsukushi, I., O. Yamamuro, and H. Suga, HEAT-CAPACITIES AND GLASS
TRANSITIONS OF GROUND AMORPHOUS SOLID AND LIQUID-
QUENCHED GLASS OF TRI-O-METHYL-BETA-CYCLODEXTRIN. Journal of
Non-Crystalline Solids, 1994. 175(2-3): p. 187-194.
50. Mauer, L.J. and L.S. Taylor, Deliquescence of pharmaceutical systems.
Pharmaceutical Development and Technology, 2010. 15(6): p. 582-594.
51. Santanu, B., U.S. Shivhare, and S. Muley, Moisture adsorption isotherms and
glass transition temperature of pectin. Journal of Food Science and Technology,
2013. 50(3): p. 585-589.
52. Lee, S.H. and T.P. Labuza, DESTRUCTION OF ASCORBIC-ACID AS A
FUNCTION OF WATER ACTIVITY. Journal of Food Science, 1975. 40(2): p.
370-373.
53. Hiatt, A.N., L.S. Taylor, and L.J. Mauer, Influence of Simultaneous Variations in
Temperature and Relative Humidity on Chemical Stability of Two Vitamin C
Forms and Implications for Shelf Life Models. Journal of Agricultural and Food
Chemistry, 2010. 58(6): p. 3532-3540.
54. Mauer, L.J. and L.S. Taylor, Water-Solids Interactions: Deliquescence, in Annual
Review of Food Science and Technology, Vol 1, M.P. Doyle and T.R.
Klaenhammer, Editors. 2010, Annual Reviews: Palo Alto. p. 41-63.
55. Sablani, S.S., et al., Evaluating stability of vitamin C in fortified formula using
water activity and glass transition. International Journal of Food Properties, 2007.
10(1): p. 61-71.
56. Lee, S.K. and A.A. Kader, Preharvest and postharvest factors influencing vitamin
C content of horticultural crops. Postharvest Biology and Technology, 2000.
20(3): p. 207-220.
57. Castro, I., et al., Ohmic heating of strawberry products: electrical conductivity
measurements and ascorbic acid degradation kinetics. Innovative Food Science
& Emerging Technologies, 2004. 5(1): p. 27-36.
58. Santos, P.H.S. and M.A. Silva, Retention of Vitamin C in Drying Processes of
Fruits and VegetablesA Review. Drying Technology, 2008. 26(12): p. 1421-1437.

32
32
59. Robertson, G.L. and C.M.L. Samaniego, EFFECT OF INITIAL DISSOLVED-
OXYGEN LEVELS ON THE DEGRADATION OF ASCORBIC-ACID AND THE
BROWNING OF LEMON JUICE DURING STORAGE. Journal of Food Science,
1986. 51(1): p. 184-&.
60. Cortes, C., M.J. Esteve, and A. Frigola, Color of orange juice treated by High
Intensity Pulsed Electric Fields during refrigerated storage and comparison with
pasteurized juice. Food Control, 2007. 19(2): p. 151-158.
61. Rodrigo, D., et al., Physicochemical characteristics and quality of refrigerated
Spanish orange-carrot juices and influence of storage conditions. Journal of Food
Science, 2003. 68(6): p. 2111-2116.
62. Nagy, S. and V. Randall, USE OF FURFURAL CONTENT AS AN INDEX OF
STORAGE TEMPERATURE ABUSE IN COMMERCIALLY PROCESSED
ORANGE JUICE. Journal of Agricultural and Food Chemistry, 1973. 21(2): p.
272-275.
63. Yuan, J.P. and F. Chen, Separation and identification of furanic compounds in
fruit juices and drinks by high-performance liquid chromatography photodiode
array detection. Journal of Agricultural and Food Chemistry, 1998. 46(4): p.
1286-1291.
64. Ozkan, M., A. Kirca, and B. Cemeroglu, Effects of hydrogen peroxide on the
stability of ascorbic acid during storage in various fruit juices. Food Chemistry,
2004. 88(4): p. 591-597.
65. Masrizal, M.A., D.W. Giraud, and J.A. Driskell, Retention of vitamin C, iron, and
beta-carotene in vegetables prepared using different cooking methods. Journal of
Food Quality, 1997. 20(5): p. 403-418.
66. Hung, L.H., et al., Decomposition and discoloration of L-ascorbic acid freeze-
dried with saccharides. Innovative Food Science & Emerging Technologies, 2007.
8(4): p. 500-506.
67. Lipasek, R.A., et al., Effect of temperature on the deliquescence properties of food
ingredients and blends. Journal of agricultural and food chemistry, 2013. 61(38):
p. 9241-50.
33
33
68. Bode, A.M., L. Cunningham, and R.C. Rose, SPONTANEOUS DECAY OF
OXIDIZED ASCORBIC-ACID (DEHYDRO-L-ASCORBIC ACID) EVALUATED
BY HIGH-PRESSURE LIQUID-CHROMATOGRAPHY. Clinical Chemistry, 1990.
36(10): p. 1807-1809.
69. Okamura, M., AN IMPROVED METHOD FOR DETERMINATION OF L-
ASCORBIC-ACID AND L-DEHYDROASCORBIC ACID IN BLOOD-PLASMA.
Clinica Chimica Acta, 1980. 103(3): p. 259-268.
70. Stevens, R., et al., Technique for rapid, small-scale analysis of vitamin C levels in
fruit and application to a tomato mutant collection. Journal of Agricultural and
Food Chemistry, 2006. 54(17): p. 6159-6165.
71. Shephard, A.B., S.C. Nichols, and A. Braithwaite, Moisture induced solid phase
degradation of L-ascorbic acid - Part 1. a kinetic study using tristimulus
colorimetry and a quantitative HPLC assay. Talanta, 1999. 48(3): p. 585-593.
72. Damaseeno, L.F., et al., Non-enzymatic browning in clarified cashew apple juice
during thermal treatment: Kinetics and process control. Food Chemistry, 2008.
106(1): p. 172-179.
73. Calvo, C., A. Salvador, and S.M. Fiszman, Influence of colour intensity on the
perception of colour and sweetness in various fruit-flavoured yoghurts. European
Food Research and Technology, 2001. 213(2): p. 99-103.
74. Tepper, B.J., Effects of a slight color variation on consumer acceptance of orange
juice. Journal of Sensory Studies, 1993. 8(2): p. 145-154.
75. West, M.E. and L.J. Mauer, Color and Chemical Stability of a Variety of
Anthocyanins and Ascorbic Acid in Solution and Powder Forms. Journal of
Agricultural and Food Chemistry, 2013. 61(17): p. 4169-4179.
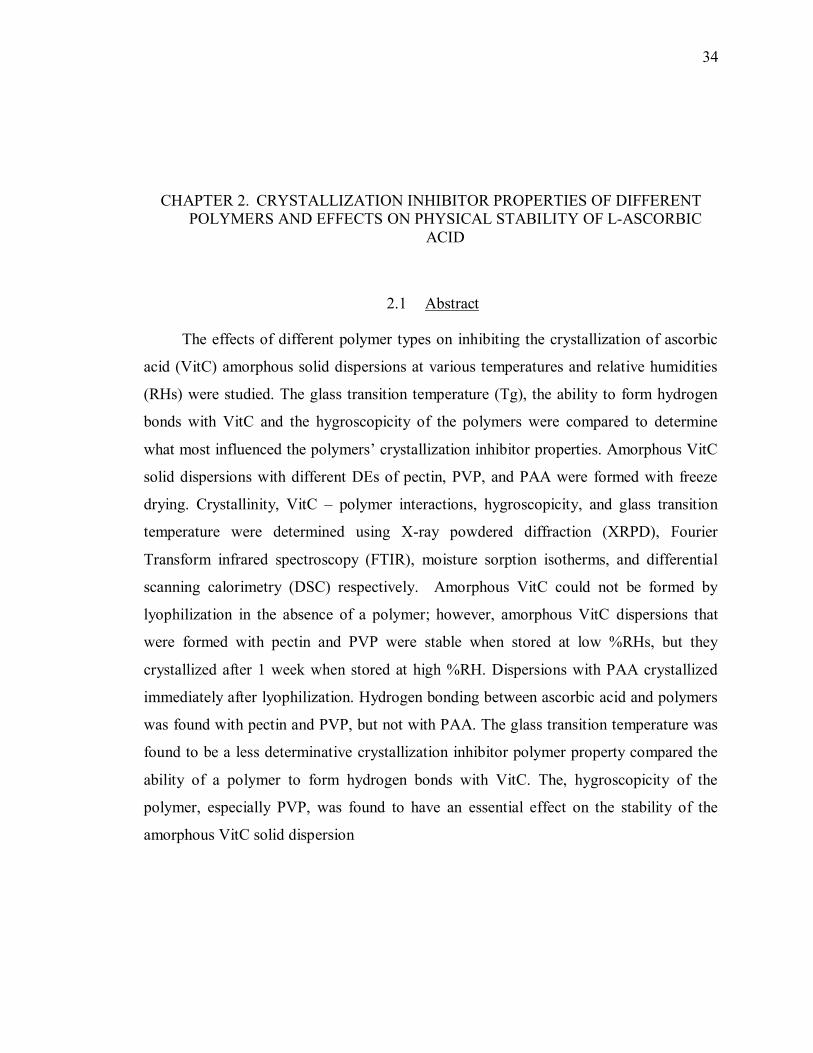
34
CHAPTER 2. CRYSTALLIZATION INHIBITOR PROPERTIES OF DIFFERENT
POLYMERS AND EFFECTS ON PHYSICAL STABILITY OF L-ASCORBIC
ACID
2.1 Abstract
The effects of different polymer types on inhibiting the crystallization of ascorbic
acid (VitC) amorphous solid dispersions at various temperatures and relative humidities
(RHs) were studied. The glass transition temperature (Tg), the ability to form hydrogen
bonds with VitC and the hygroscopicity of the polymers were compared to determine
what most influenced the polymers’ crystallization inhibitor properties. Amorphous VitC
solid dispersions with different DEs of pectin, PVP, and PAA were formed with freeze
drying. Crystallinity, VitC – polymer interactions, hygroscopicity, and glass transition
temperature were determined using X-ray powdered diffraction (XRPD), Fourier
Transform infrared spectroscopy (FTIR), moisture sorption isotherms, and differential
scanning calorimetry (DSC) respectively. Amorphous VitC could not be formed by
lyophilization in the absence of a polymer; however, amorphous VitC dispersions that
were formed with pectin and PVP were stable when stored at low %RHs, but they
crystallized after 1 week when stored at high %RH. Dispersions with PAA crystallized
immediately after lyophilization. Hydrogen bonding between ascorbic acid and polymers
was found with pectin and PVP, but not with PAA. The glass transition temperature was
found to be a less determinative crystallization inhibitor polymer property compared the
ability of a polymer to form hydrogen bonds with VitC. The, hygroscopicity of the
polymer, especially PVP, was found to have an essential effect on the stability of the
amorphous VitC solid dispersion

35
2.2 Introduction
Interest has been increasing in creating amorphous solid structures for improving
the solubility and/or dissolution rates of crystalline compounds. Although many studies
have attempted to produce stable amorphous solid dispersions, it has been a challenge to
prevent the crystallization of amorphous solid dispersions in various common storage and
processing conditions since amorphous compounds are thermodynamically less stable
than crystalline compounds. To prevent the crystallization and improve the physical
stability of amorphous solid dispersions, polymers are often added to the target
compound [1, 2]. Many of these studies have focused on creating amorphous dispersions
of hydrophobic crystalline solids (such as active pharmaceutical ingredients or
phytochemicals including curcumin) wherein the solubility advantage of the amorphous
structure is expected to enhance the bioavailability of the active compound. However, it
is also of interest to create amorphous forms of hydrophilic compounds to tailor
dissolution traits or better understand reactions occurring during formulation, processing,
and storage.
Crystalline ascorbic acid (VitC) is an essential nutrient that is widely used in food
fortification and dietary supplements, and is also commonly used as an antioxidant to
promote the stability of foods. Although VitC exists mainly in its crystalline form,
blending L-ascorbic acid with certain ingredients, such as polymers, and treating it with
certain processing operations could produce an amorphous form of VitC [3]. In a study of
lyophilized ascorbic acid fortified anthocyanin-rich extract powders, both XRPD and
moisture sorption profiles indicated that Vitamin C was likely amorphous in the
powder[4]. Vitamin C is known as one of the most unstable vitamins, and its content
must be declared on food labels. The stability of vitamin C is often linked to product
shelf-life and quality. A byproduct of vitamin C degradation is the formation of brown
colors. Because amorphous solids are often less stable than their crystalline counterparts,
it is of interest to better understand the conditions in which amorphous vitamin C might
be created as well as the stability traits of the amorphous form.

36
Many studies have been done in attempt to understand the specific properties of
polymers that are most influential in creating a stable amorphous solid dispersion, and
different types of polymers have been shown to have different crystallization inhibition
properties for a specific crystalline solid [1].. Typically, polymers possess a higher glass
transition temperature (Tg) than the crystalline compound. The antiplasticization effect of
the polymer by increasing the Tg of solid dispersions has been correlated to the
crystallization inhibition properties of the polymer [5, 6]. However, the relationship
between the anti-plasticization effect and crystallization inhibition activity of polymers
was not observed when used at small polymer concentrations in some systems [7, 8]. The
ability of polymers to interact with the crystalline compound via hydrogen bonding has
also been suggested as the primary mechanism of polymer inhibition of recrystallization
of solid dispersions [8-10]. A potential drawback of the usage of a polymer in producing
an amorphous solid is its hygroscopicity. Moisture acts as a plasticizer that both
decreases the Tg of a system [11] and disrupts the crystalline compound-polymer
hydrogen bond interaction [12]. Better understanding the interrelationship between Tg,
hydrogen bonding, and hygroscopicity could enhance the selection of polymers to inhibit
crystallization as well as the understanding of systems in which amorphous structures are
created during formulation and processing.
2.3 Objectives
The objectives of this study were to first understand the effect of polymer types on
inhibiting the crystallization of VitC amorphous solid dispersions at various temperatures
and relative humidities (RHs). The specific properties of polymer such as Tg, ability to
form hydrogen bond with VitC and hygroscopicity were then compared to determine
which of these properties most influenced the crystallization inhibitor properties of
polymer.
Pectins were selected as a food grade polymers to form a stable VitC amorphous
solid dispersion because preliminary data from a previous study indicated that an
amorphous ascorbic acid blend was formed in presence of pectin-rich purple corn extract.
The degree of esterification of pectin (DE) was also investigated to better understand the

37
specific properties of pectin that lead to a stable amorphous solid dispersion. PVP and
PAA, synthetic polymers commonly used in pharmaceutical area to form amorphous
solid dispersions, were also selected due to their diverse physical properties, such as glass
transition temperature (Tg) and functional groups that are available to form hydrogen
bonds.
2.4 Experimental Design
Compound Polymer Ratios Method Relative
Humiditi
es (%)
Temp
(°C)
Time
Analysis
Ascorbic
acid
Pectin from
apple
Pectin from
citrus peel
Pectin from
citrus fruit
Pectin,
esterified with
potassium
from citrus
fruit
Polyvinyl-
pyrrolidone
Polyacrylic
acid
50:50
AA:
polymer
(w/w)
Lyophili-
zation
0.22g
solid/ml
water
0
23
54
75
22
40
Extended
until
crystallizati
on occur
Analysis
on the
following
days: 0, 7,
14, 21, 28,
35, 42, 49
X-Ray
diffraction
Fourier
transform
infrared
spectroscop
y
Polarized
light
microscope
SPS
moisture
sorption
isotherm
Different
ial
scanning
colorimeter

38
2.5 Materials and Methods
2.5.1 Materials
Ascorbic acid and polymers were obtained from Sigma – Aldrich Inc. (St. Louis,
MO). The polymers used were pectin with different degrees of esterification (DE) [pectin
from citrus peel (CT, DE=~61%), pectin from apple (AP, DE=70-75%), esterified pectin
from citrus (EST, DE>=85%), and esterified potassium salt pectin from citrus (K, DE=
55-70%, potassium = 4.1-6.4%)]; polyvinylpyrrolidone (PVP, 40000MW); and
polyacrylic acid (PAA, 450000MW). Salts were used to achieve specific %RHs in
desiccators for the storage study. Drierite (0%RH) was obtained from W.A. Hammond
Drierite Company, LTD (Xenia, OH). Potassium acetate (CH3CO2K, 23%RH at 25°C)
was obtained from Acros Organic (NJ). Magnesium sulfate (Mg2SO4, 54%RH at 25°C)
and sodium chloride (NaCl, 75%RH at 25°C) were obtained from Sigma – Aldrich Inc.
(St. Louis, MO). The sample types studied were: initial crystalline VitC, freeze dried
VitC (FD VitC), initial individual polymers, freeze dried individual polymers, physical
blends (1:1) of the initial VitC and initial each polymers, and freeze dried solid
dispersions (1:1) of VitC and each polymer.
2.5.2 Solid dispersion formation via lyophilization
To prepare solid dispersions, approximately 0.25g of VitC and 0.25g of polymer
to total of 0.5g (50/50 w/w) of solid was dissolved with 45ml of water in a 50ml
centrifuge tube. The solution was mixed thoroughly to ensure that the polymer was fully
dissolved. A preliminary study also used 1g of 50/50 (w/w) VitC and polymer blend in
total in 45 mL of water, but this approach was discontinued for further study when it was
discovered that these dispersion were less stable than those formed using 0.5g. Systems
containing only ascorbic acid or polymer were also prepared by dissolving 0.5g of the
compound with 45mL of water. The solutions were then frozen at -20oC for at least 24
hours prior to freeze drying. Freeze drying was performed using a VirTis Genesis 25 ES
(VirTis, Gardiner, NY) for at least 90 hours to ensure that water was completely removed

39
from the sample. The samples were then quickly transferred to 20 ml glass vials to be
stored at various temperatures and %RHs or to be analyzed for day 0 data collection.
2.5.3 Storage treatments
The lyophilized samples were stored at room temperature (22±3oC) and 40
oC in
desiccators at various %RH: 0, 23, 54, and 75%RH. Water jacketed incubators (Forma
Scientific, Inc., Marietta, OH) were used to achieve the 40 o
C incubation temperature.
Samples were analyzed periodically throughout the 130 days storage streatment to assess
crystallinity. The mass change was monitored over time until samples reached
equilibrium (±0.001mg) to document moisture sorption at each storage condition. The
Tgs of the samples were measured after the samples reached equilibrium.
2.5.4 X-ray powdered diffraction (XRPD)
To characterize the physical structure immediately after freeze drying, the
samples were analyzed using a Shimadzu LabX XRD-6000 (Shimadzu Corporation,
Kyoto, Japan) equipped with a Cu-Kα source set in Bragg-Brentano geometry between 5o
and 35o 2θ angle at 4
o/min with a 0.04
o step size. A silicon standard was used to calibrate
the equipment prior to each analysis. Samples were packed into the well of the aluminum
sample holder and surface of the powder was smoothen with glass slide. Samples were
also monitored weekly throughout 130 days of storage using XRPD to assess when
changes in crystallinity occurred, if any.
2.5.5 Polarized light microscope
An Omano OM349P Polarization Microscope (The Microscope Store, LLC,
Roanoke, VA) was used to visually analyze the crystallinitiy of the samples immidately
after freeze drying. The microscope was equipped with Plan achromatic objectives and
magnification of 40X was used. Pictures were taken with a detachable OptixCam
Microscope Camera (The Microscope Store, LLC, Roanoke, VA). The sample was
placed on a microscope slide during the analysis.

40
2.5.6 Fourier transform infrared spectroscopy (FTIR)
Spectra of the starting materials and lyophilized samples over time were obtained
using a Bio-Rad FTS 6000 (Bio-Rad Laboratories, Hercules, California) equipped with a
globar IR source, KBr beamsplitter, and DTGS detector. The scan range was set from
4000 to 400cm-1
and 128 scans were recorded. Enough sample was placed to evenly
cover the surface of the ATR crystal and then compacted with a clamp to ensure good
optical contact with the crystal. The specific spectral regions of interest were the
hydroxyl group stretching (3800 – 3000 cm-1
) and the carbonyl group stretching (1900 -
1500 cm-1
) wavenumber regions to monitor interactions between the ascorbic acid and
polymer. The FTIR measurements were only done for the samples that were stored at
0%RH to minimize the interference of moisture to the FTIR spectra. An exception were
done in the dispersion formed with esterified pectin from citrus (EST) where analysis
were done at 54% and 75%RH, 25oC to determine the effect of moisture in hydrogen
bonding interaction of recrystallized solid dispersions.
2.5.7 Moisture sorption isotherm analysis
Moisture sorption isotherm profiles and weight gain of starting materials and
lyophilized samples at different RHs were determined using a SPSx-1μ Dynamic Vapor
Sorption Analyzer (Projekt Messtechnik, Ulm, Germany). Samples (900 – 1100mg) were
loaded into aluminum pans in a 24-ring sample holder, the equilibrium criterion was a
weight change of 0.01% in 15 minutes with a maximum step time of 10 hours, and a
minimum step time of 50 min. The samples were equilibrated at 5oC for 3 hours and then
analyzed at 25oC from 5 - 90% RH in a 16 RH steps cycle, 6% increments. The weight
changes of the solid dispersions were also monitored by storing samples at 0%, 23% 54%,
and 75%RH, 25oC and 49
oC. The samples were determined to have reached equilibrium
when less than 0.01g weight changes were observed.

41
2.5.8 Differential scanning calorimetry (DSC)
Thermal analysis was performed using a TA Q2000 DSC (TA Instruments, New
Castle, Delaware). Nitrogen was used as the purge gas. Following storage treatment,
samples (2.5 – 4mg) were weighed into aluminum Tzero pans (TA Instruments) and
hermetically sealed. The glass transition temperature (Tg) was determined by heating the
samples at least 50oC higher than the Tg, then quickly cooling to -80
oC, and then
reheating to at least 100oC to determine the onset Tg. The first heating cycle was used to
determine the Tg of freeze dried PVP and PAA and their dispersions. The scanning rates
of all the steps were 10oC/min. DSC heating curves were analyzed using Universal
Analysis 2000 software (TA Instruments).
2.6 Results and Discussion
2.6.1 Crystallization tendency of ascorbic acid solid dispersions during formation and
storage
In the absence of a polymer, lyophilized VitC (FD VitC) retained the presence of
sharp peaks in XRPD patterns indicating the presence of crystalline structures, although
the intensity varied between the peaks of the initial crystalline VitC and the FD VitC,
(Fig 2.1). Both the initial VitC and FD VitC also exhibited birefringence under the
polarized light microscope, again indicative of crystallinity (Fig 2.2). Although retaining
crystalline traits, the FD VitC did exhibit a change in crystal shape compared to the initial
VitC (Fig 2b). In contrast, all of the polymers used in this study were initially amorphous
(Fig 2.3, Fig 2.4) and remained amorphous after freeze drying (Fig 2.5, Fig 2.6) when
analyzed both with XRPD and polarized light microscopy. The freeze drying process
caused the polymers to have more opened structure with some visibly broken pectin
strands forming porous structures (Fig 2.6).
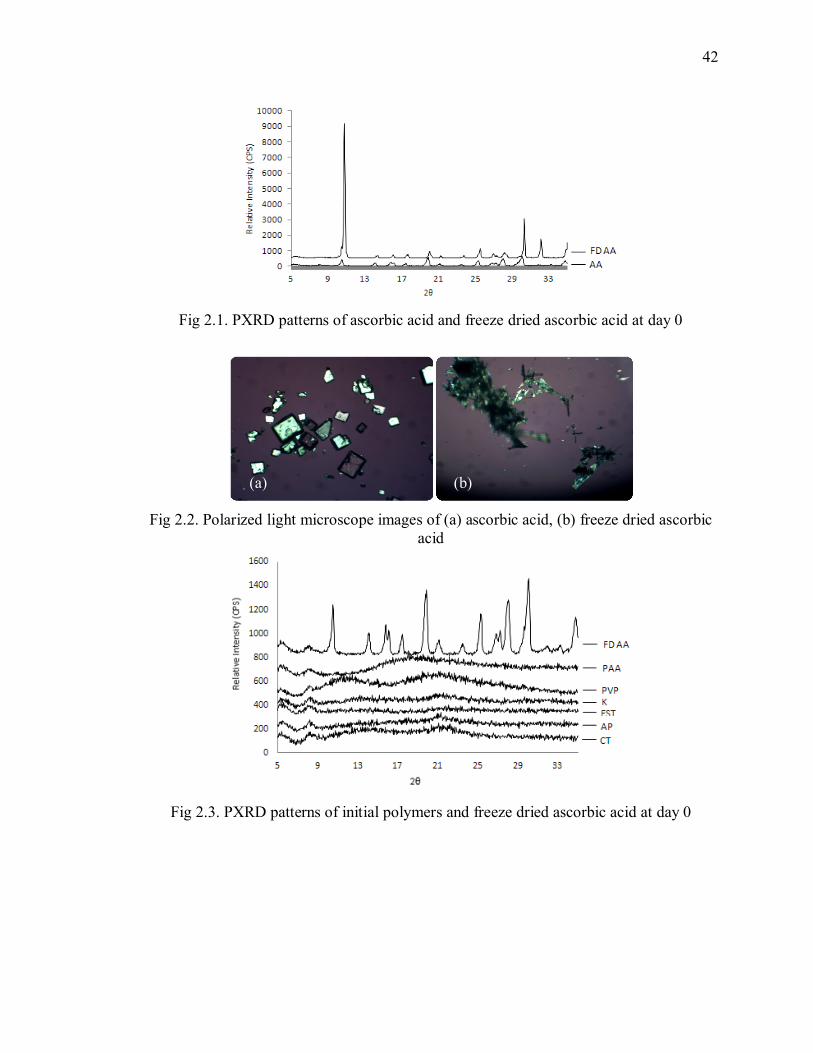
42
Fig 2.1. PXRD patterns of ascorbic acid and freeze dried ascorbic acid at day 0
Fig 2.2. Polarized light microscope images of (a) ascorbic acid, (b) freeze dried ascorbic
acid
Fig 2.3. PXRD patterns of initial polymers and freeze dried ascorbic acid at day 0
(a) (b)

43
Fig 2.4. Polarized light microscope images of initial polymers (a) CT, (b) AP, (c) EST, (d)
K, (e) PVP, and (f) PAA
Fig 2.5. PXRD patterns of freeze dried polymers and freeze dried ascorbic acid at day 0
(e)
(a) (b) (c)
(d) (f)
(c)
(f)

44
Fig 2.6. Polarized light microscope images of freeze dried polymers (a) CT, (b)AP, (c)
EST, (d) K, (e) PVP, and (f) PAA
The presence of some polymer types was able to inhibit the crystallization of
amorphous VitC upon formation, as observed in another study [13]. Stable amorphous
VitC was formed in solid dispersions with specific polymers at a 50% wt/wt ratio.
Immediately after freeze drying (day 0), the solid dispersions made with all types of
pectin and PVP were XRPD amorphous while the dispersion with PAA was XRPD
crystalline (Fig 2.7). Moreover the dispersions that were XRPD amorphous lacked
birefringence under the microscope while birefringence was observed in the dispersions
that were XRPD crystalline (Fig 2.8). The data confirmed that different polymers have
different abilities to prevent or inhibit the crystallization of VitC [1, 2]. Although both
pectin and PAA were acidic polymers, PAA appeared to have worse crystallization
inhibitor properties for VitC than pectin. Thus, another trait beyond acidity of the
polymer is influencing the disruption of crystallinity. Another study found that the
crystallization inhibitor properties of PAA for acidic drugs, such as flurbiprofen and
chlorpropamide, were very poor. More basic polymers such as
hydroxypropylmethylcelloluse (HPMC), had a better crystallization inhibitor properties
for acidic drugs. The study concluded that basic polymers have better crystallization
inhibitor properties for acidic compounds and vice versa [1]. Therefore, future study
(a) (b)
(d) (e)
(c)
(f)

45
comparing the ability of basic polymers to inhibit the crystallization of ascorbic acid
would be interesting.
Fig 2.7. PXRD of 50:50 VitC:polymer dispersions and FD ascorbic acid at day 0
Fig 2.8. Polarized light microscope images of of 50:50 VitC dispersions with (a) CT, (b)
AP, (c) EST, (d) K, (e) PVP, (f) PAA
To explore the storage stability of the amorphous solid dispersions, VitC
amorphous solid dispersions containing pectin and PVP were stored at 25oC and 40
oC;
(e) (f)
(a) (b) (c)
(d)

46
and at 0%, 23%, 54% and 75%RH. The 50:50 VitC:pectin and PVP dispersions remain
amorphous at day 130 when stored at 0% and 23%RH at both temperatures (Table 1).
However, the dispersions crystallized after 1 week when stored at higher RHs (54% and
75%RH) at both temperatures. Interestingly, no differences in crystallization inhibition
were found between the different types of pectin (different degrees of esterification). The
rate of crystallization of the amorphous solid depended on the storage %RH. When
moisture is absorbed, the molecular mobility of the amorphous solids increase and can
result in crystallization events [11, 14, 15]. Storage temperature is also known to increase
molecular mobility, thereby decreasing the stability of amorphous solids [12, 16]. The
rate of crystallization of 50:50 VitC:pectin and PVP dispersions was influenced more by
storage RH than storage temperature, within the experimental space. All dispersions
remained amorphous when stored at 0 and 23%RH and crystallized when stored at 54%
and 75% RH regardless of the storage temperature. Similar observations were noted for
resveratrol-PVP dispersions where the dispersion was more influenced by %RHs than
temperature. Partial crystallization of resveratrol-PVP (40/60 w/w) dispersions was found
when samples were stored at 90oC, but these dispersions remained amorphous when
stored at 50oC for 100 days [9]. Similarly, no crystalline – amorphous phase separation
was observed in dispersions of felodipine and PVP at room temperature and at 125oC,
showing the limited effect of temperature on crystallization of these systems [12].

47
Table 2.1. Interpretation of PXRD patterns of 50:50 VitC:polymer after 7 days at 25oC
and the identified %RH. PXRD patterns that contained sharp peaks were interpreted as
having crystalline structures (C) and those that lacked distinct peaks were interpreted as
being amorphous (A).
Polymer types
used to create the
VitC dispersion
Temp
(oC)
PXRD amorphous (A) or crystalline (C)
following storage at the identified %RH
0%RH 23%RH 54%RH 75%RH
CT 25 A A C C
40 A A C C
AP 25 A A C C
40 A A C C
EST 25 A A C C
40 A A C C
K 25 A A C C
40 A A C C
PVP 25 A A C C
40 A A C C
PAA 25 C C C C
40 C C C C
It is important to note that the amount water added to the sample prior to freeze
drying was important to form an amorphous solid dispersion. Amorphous solid
dispersions were able to be formed when 0.011g of 50:50 VitC:pectin blend/ml of water
was used. However, the dispersion crystallized immediately after freeze drying when
0.022g of 50:50 VitC:pectin blend/ml of water was used (Fig 2.9). The solution with the
higher solids concentration crystallized upon freeze drying, which was likely due to the
lack of water to fully hydrate the pectin and facilitate molecular movement to allow VitC-
pectin interactions. In addition, physically mixing the VitC and polymer did not lead to a
physical change of the VitC, as shown by the presence of sharp peaks in the XRPD (Fig

48
2.10). Therefore, the formation of amorphous solid dispersion by blending the VitC with
a polymer followed by freeze drying was required to form amorphous VitC.
Fig 2.9. PXRD of 50:50 VitC: polymer dispersions at day 0 with different sample:water
ratio prior freeze drying
Fig 2.10. PXRD pattern of 50:50 VitC:CT dispersions and physical mixtures
2.6.2 Ascorbic acid and polymer hydrogen bond donor and acceptor strengths
The ability of ascorbic acid to form hydrogen bonds with polymers is
hypothesized to be the key element in inhibiting the recrystallization of amorphous solid
dispersions [1, 2, 7, 8, 10]. Polymers with stronger hydrogen bond donors (HBD) and
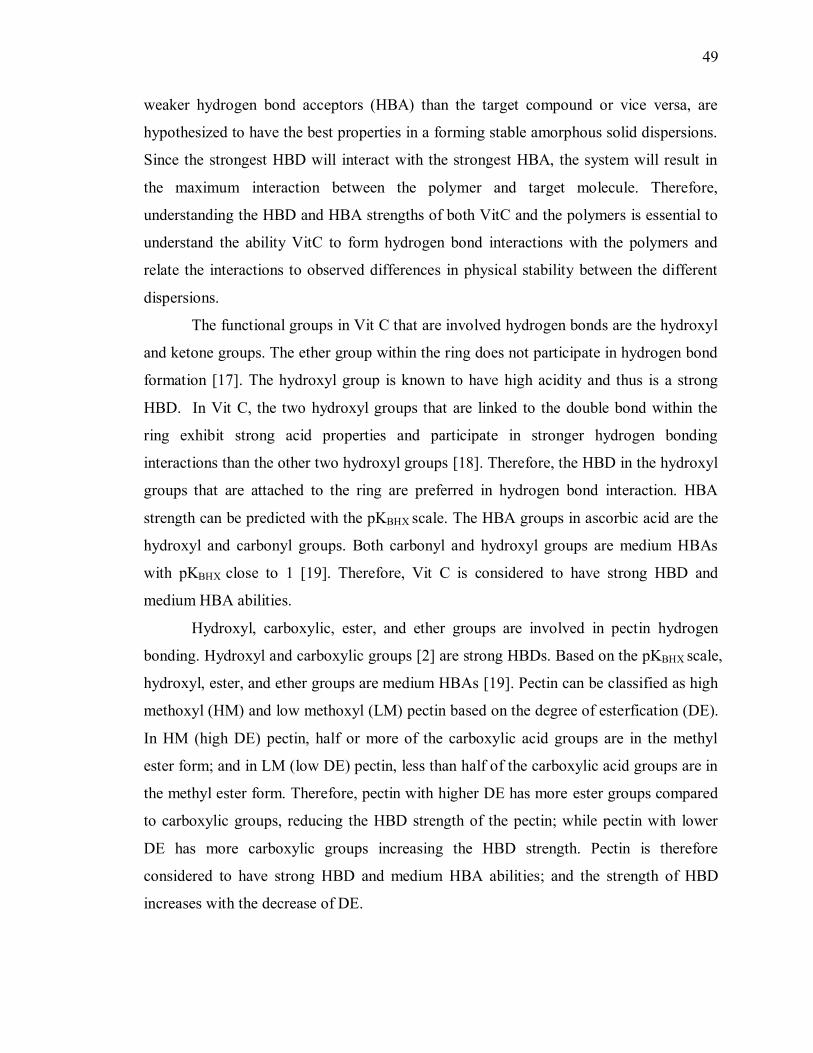
49
weaker hydrogen bond acceptors (HBA) than the target compound or vice versa, are
hypothesized to have the best properties in a forming stable amorphous solid dispersions.
Since the strongest HBD will interact with the strongest HBA, the system will result in
the maximum interaction between the polymer and target molecule. Therefore,
understanding the HBD and HBA strengths of both VitC and the polymers is essential to
understand the ability VitC to form hydrogen bond interactions with the polymers and
relate the interactions to observed differences in physical stability between the different
dispersions.
The functional groups in Vit C that are involved hydrogen bonds are the hydroxyl
and ketone groups. The ether group within the ring does not participate in hydrogen bond
formation [17]. The hydroxyl group is known to have high acidity and thus is a strong
HBD. In Vit C, the two hydroxyl groups that are linked to the double bond within the
ring exhibit strong acid properties and participate in stronger hydrogen bonding
interactions than the other two hydroxyl groups [18]. Therefore, the HBD in the hydroxyl
groups that are attached to the ring are preferred in hydrogen bond interaction. HBA
strength can be predicted with the pKBHX scale. The HBA groups in ascorbic acid are the
hydroxyl and carbonyl groups. Both carbonyl and hydroxyl groups are medium HBAs
with pKBHX close to 1 [19]. Therefore, Vit C is considered to have strong HBD and
medium HBA abilities.
Hydroxyl, carboxylic, ester, and ether groups are involved in pectin hydrogen
bonding. Hydroxyl and carboxylic groups [2] are strong HBDs. Based on the pKBHX scale,
hydroxyl, ester, and ether groups are medium HBAs [19]. Pectin can be classified as high
methoxyl (HM) and low methoxyl (LM) pectin based on the degree of esterfication (DE).
In HM (high DE) pectin, half or more of the carboxylic acid groups are in the methyl
ester form; and in LM (low DE) pectin, less than half of the carboxylic acid groups are in
the methyl ester form. Therefore, pectin with higher DE has more ester groups compared
to carboxylic groups, reducing the HBD strength of the pectin; while pectin with lower
DE has more carboxylic groups increasing the HBD strength. Pectin is therefore
considered to have strong HBD and medium HBA abilities; and the strength of HBD
increases with the decrease of DE.

50
PVP has no hydrogen bond donor and has a strong hydrogen bond acceptor. The
amide carbonyl of PVP is the strong HBA with pKBHX more than 2 [19]. Therefore, PVP
is hypothesized to form a strong hydrogen bond with VitC since PVP has a stronger HBA
than VitC and no HBD to compete with the HBD in VitC. PAA has a strong HBD and
medium HBA, both from its carboxylic acid group [2]. The strengths of HBD and HBA
groups in PAA are similar with the strengths of the HBD and HBA of VitC. Therefore,
there is a possibility that VitC-PAA hydrogen bonds were not preferable when these
dispersions were formed.
2.6.3 Hydrogen bonding interactions between ascorbic acid and polymer
The hydrogen bond interaction between VitC and polymer can be determined by
monitoring the peak shape as well as peak shift in the hydroxyl and carbonyl regions of
FTIR spectra [8-10]. Peak shifts to a lower wavenumber indicate an increase in
interaction in that region, while shifts to a higher wavenumber show less interaction [9].
The hydroxyl region in VitC was characterized with three distinct peaks instead of
a broad peak that is more often observed in other compounds (Fig. 2.11). The steric
hindrance from the carbon ring of VitC results in a specific bond vibration associated as
the three hydroxyl peaks [20]. The three hydroxyl peaks of VitC and FD VitC were
observed at the same wavenumbers of 3520, 3397 and 3300 cm-1
, which were similar to
other reported values [20, 21]. The carbonyl peaks of VitC were observed at 1647 and
1751 cm-1
; whereas the carbonyl peaks for freeze dried VitC were observed at 1651 and
1753 cm-1
, which were again similar to other reported values [20, 21]. The FTIR spectra
of polymers followed the typical single broad peak in the hydroxyl region [22, 23]. Two
peaks were observed in the carbonyl region of pectin, while a single peak was observed
in PVP and PAA spectra (Fig 2.12). The two carbonyl peaks in pectin were associated
with different groups than those involved in hydrogen bond interactions. The peak
position of 1599 – 1638 cm-1
(Table 2.3) was the carboxylic carbonyl stretching band and
the ester carbonyl stretch, which were very similar to the values reported in other studies
[24, 25]. The carboxylic and ester carbonyl stretching bands overlapped with each other,
which was observed at 1730cm-1
and 1740 cm-1
, respectively. Due to the overlapping

51
bands, free acid would need to be converted into ions to fully understand the different
effects of the degrees of esterfication on the interactions in the carboxyl region [25]. The
carbonyl peak position at 1730 – 1736 cm-1
(Table 2.3) was the ionized carboxylate
(COO-) stretching band. Moreover, the presence of potassium salt in the pectin with
93%DE was found to have limited effect on the carbonyl peak position.
Fig 2.11. FTIR Spectra of ascorbic acid and freeze dried ascorbic acid
(a)

52
Fig 2.12. FTIR spectra of polymers (a) CT and freeze dried CT, (b) PVP and freeze dried
PVP, (c) PAA and freeze dried PAA
Immediately after the 50:50 VitC:pectin and PVP dispersions were formed (day
0), the three peaks in the hydroxyl region associated with crystalline ascorbic acid were
not observed (Fig 2.13, Fig 2.14a), but they were apparent in the dispersions formed with
PAA (Fig 2.14b). The loss of the three peaks in the dispersions with pectin and PVP
indicate the loss of VitC - VitC interactions in the system and thus VitC was likely
dispersed between the polymers. However, dispersions made with PAA were not able to
prevent the interactions between VitC itself. Strong hydrogen bonding interactions
between VitC and a polymer is therefore an important factor to ensure that VitC remained
(b)
(c)

53
dispersed within the polymer and prevent the formation of VitC – VitC interactions that
lead to recrystallization.
The trends in crystalline or amorphous structures, as interpreted by the presence
or absence of three peaks in the hydroxyl region in the FTIR spectra, were consistent with
the XRPD results. The dispersions made with pectin and PVP were XRPD amorphous at
day 0 while the dispersion made with PAA was crystalline. This corresponded to the loss
of the three peaks in pectin and PVP dispersion and the presence of those peaks in PAA
dispersion immediately after freeze drying. Moreover, after the dispersion with pectin
was stored at various %RHs for 1 week, the FTIR spectra showed that the dispersion that
was stored at 0%RH continued to lack the three hydroxyl region peaks while those peaks
developed when the dispersions were stored at 54% and 75%RH (Fig 2.15). Again, this
trend was consistent with the XRPD patterns in which the dispersions of pectin remained
amorphous when stored at 0% and 23% RH and recrystallized when stored at 54% and
75%RH. In addition, when crystalline VitC was physically mixed with polymers, the
FTIR spectra confirmed that there was no peak shape alternation or peak position shift in
these samples (Fig 2.16). Therefore, the formation of amorphous solid dispersions (eg.
with freeze drying) was needed to facilitate the formation of VitC-polymer hydrogen
bonds.
Fig 2.13. FTIR spectra of 50:50 VitC:CT. The 50% dispersions made with other pectin
showed similar spectra
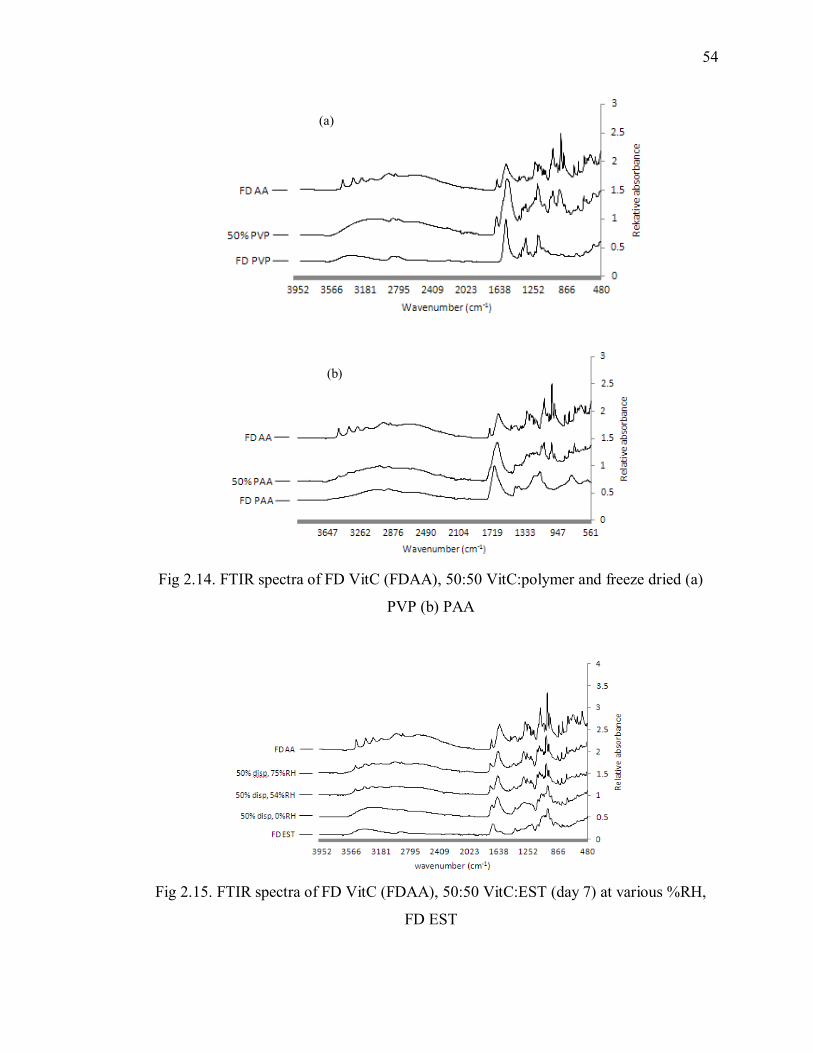
54
Fig 2.14. FTIR spectra of FD VitC (FDAA), 50:50 VitC:polymer and freeze dried (a)
PVP (b) PAA
Fig 2.15. FTIR spectra of FD VitC (FDAA), 50:50 VitC:EST (day 7) at various %RH,
FD EST
(a)
(b)

55
Fig 2.16. FTIR spectra of 50:50 VitC:polymer physical mixtures
2.6.3.1 FTIR spectra hydroxyl regions of 50:50 VitC: pectin and PVP amorphous solid
dispersions
The peak shifts in the hydroxyl and carbonyl regions in FTIR spectra were
another indicator of VitC - polymer interactions. The peak shifts to a lower wavenumber
in the hydroxyl region of pectin and PVP dispersions (Table 2.2) showed the presence of
interactions between VitC and the polymers.
Although the peak position of the hydroxyl region for the dispersions formed with
all types of pectin shifted to a lower wavenumber, the width of the peak shift differed
between the types of pectin. Different types of pectin have different degrees of
esterification (DE) that determine the ability of pectin to form hydrogen bonds. The DEs
of the pectin used in this study were in the order EST>AP>CT and the DE of pectin K
was in the range of pectin CT and AP (refer to materials and methods section in Chapter
1). Pectin with the highest DE (EST) resulted in the largest peak shift to a lower
wavenumber in the dispersion; and the lowest DE (CT) resulted in the smallest peak shift.
This indicated that higher DE of pectin (EST) resulted in more interactions between
hydroxyl groups of pectin and ascorbic acid.
A possible explanation of why pectin with the highest degree of esterification
(EST) resulted in the strongest VitC-pectin interaction in the hydroxyl region was due to
the ratio of HBD and HBA groups in the pectin. It is hypothesized that polymers with
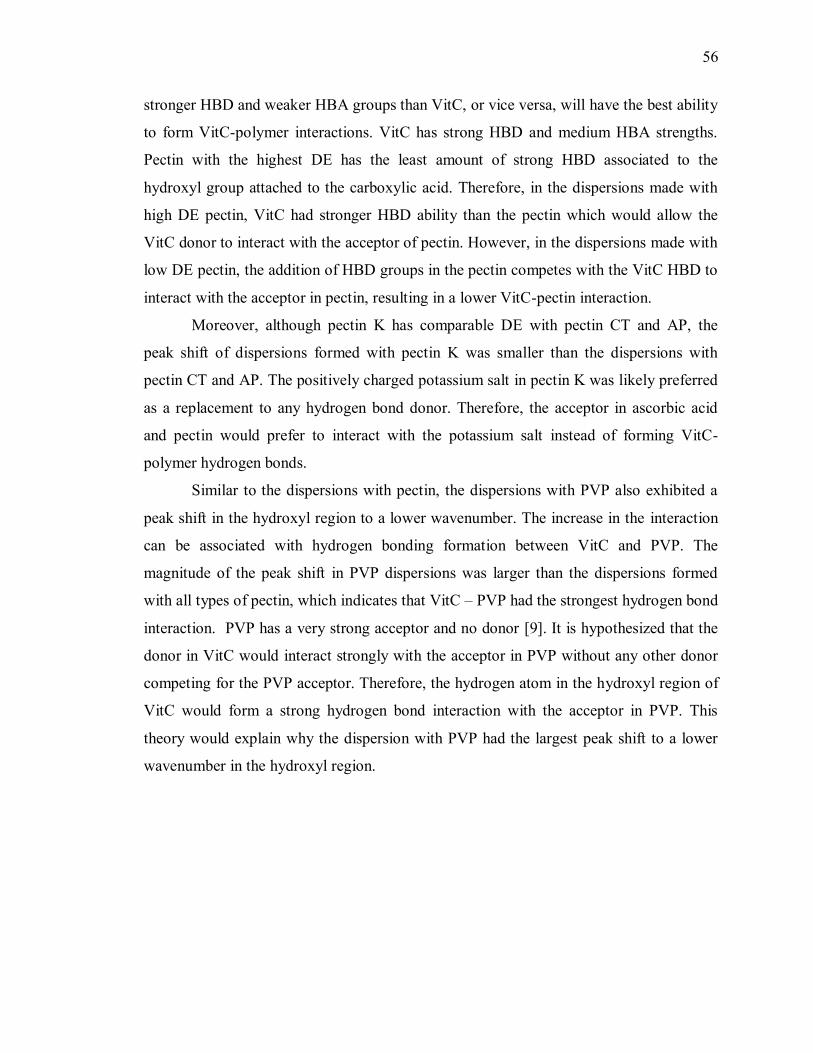
56
stronger HBD and weaker HBA groups than VitC, or vice versa, will have the best ability
to form VitC-polymer interactions. VitC has strong HBD and medium HBA strengths.
Pectin with the highest DE has the least amount of strong HBD associated to the
hydroxyl group attached to the carboxylic acid. Therefore, in the dispersions made with
high DE pectin, VitC had stronger HBD ability than the pectin which would allow the
VitC donor to interact with the acceptor of pectin. However, in the dispersions made with
low DE pectin, the addition of HBD groups in the pectin competes with the VitC HBD to
interact with the acceptor in pectin, resulting in a lower VitC-pectin interaction.
Moreover, although pectin K has comparable DE with pectin CT and AP, the
peak shift of dispersions formed with pectin K was smaller than the dispersions with
pectin CT and AP. The positively charged potassium salt in pectin K was likely preferred
as a replacement to any hydrogen bond donor. Therefore, the acceptor in ascorbic acid
and pectin would prefer to interact with the potassium salt instead of forming VitC-
polymer hydrogen bonds.
Similar to the dispersions with pectin, the dispersions with PVP also exhibited a
peak shift in the hydroxyl region to a lower wavenumber. The increase in the interaction
can be associated with hydrogen bonding formation between VitC and PVP. The
magnitude of the peak shift in PVP dispersions was larger than the dispersions formed
with all types of pectin, which indicates that VitC – PVP had the strongest hydrogen bond
interaction. PVP has a very strong acceptor and no donor [9]. It is hypothesized that the
donor in VitC would interact strongly with the acceptor in PVP without any other donor
competing for the PVP acceptor. Therefore, the hydrogen atom in the hydroxyl region of
VitC would form a strong hydrogen bond interaction with the acceptor in PVP. This
theory would explain why the dispersion with PVP had the largest peak shift to a lower
wavenumber in the hydroxyl region.

57
Table 2. 2. FTIR absorbance peak shifts of pectin, 50:50 VitC:polymer dispersions in the
hydroxyl region (3000 - 3600cm-1
) at day 0
Polymer
types
Peak position of FD polymer and 50:50 VitC:polymer
and their peak shifts in hydroxyl region (cm-1
)
FD polymer 50:50 VitC:polymer Peak shift
CT 3348 3285 64
AP 3358 3271 87
EST 3404 3287 118
K 3318 3279 39
PVP 3420 3179 241
2.6.3.2 FTIR spectra carbonyl region of 50:50 VitC: pectin and PVP amorphous solid
dispersions
In the carbonyl region of FTIR spectra, the peak of 50:50 VitC:pectin dispersions
shifted to a higher wavenumber compared to the polymer alone (Table 2.3), which
indicated that there was less interaction in the carbonyl region. Although the hydroxyl,
ether, and ester groups in pectin are all medium HBA, the data indicated that most VitC-
pectin hydrogen bond interactions in the 50% dispersions were formed with the hydroxyl
group oxygen as a HBA instead of the carbonyl carboxylic acid and ester carbonyl.
Therefore, the carbonyl group was less involved in hydrogen bonding between VitC and
pectin. A possible explanation on the loss of interaction in the carbonyl region was likely
due to the interactions of the pectin carbonyl HBA in pectin-pectin interactions being
replaced by the interactions of the pectin hydroxyl HBA in VitC-pectin interactions.
However, the carbonyl region was still involved in VitC-pectin hydrogen bonding
to some extent based on the magnitude of the peak shifts. The dispersions formed with
pectin EST, which had the most VitC-polymer interaction based on the FTIR hydroxyl
region results, had the smallest peak shift to a higher wavenumber in the carbonyl region.
There are two possible explanations for the peak shift trend in the carbonyl region. First,
in the dispersion where VitC was more capable of interacting with the HBD in pectin (the
dispersion with EST as shown in the hydroxyl region interaction), although the pectin -

58
pectin carbonyl interaction was lost, some of the pectin carbonyl group was involved in
VitC-pectin interactions. The VitC-EST interactions in the carbonyl region were
overshadowed by the loss of EST-EST interactions, resulting in a peak shift to a higher
wavenumber, but at a smaller magnitude compared to other types of pectin. The second
possible explanation was that the presence of VitC had a very limited effect on disrupting
the pectin-pectin interactions, resulting in the least interaction loss in the dispersion
formed with highest DE pectin (EST). Pectin – pectin interaction disruption was essential
to have before the VitC-EST interaction could formed. More studies would need to be
done to confirm the two possible theories due to the complex structure and the large
amount of functional groups that are involved in pectin hydrogen bonding.
A new peak (1600cm-1
) was observed in the 50:50 VitC:K dispersions that was
not observed in the dispersions formed with any other types of pectin (Fig 2.17). The new
peak development could be associated with the interaction between the potassium salt
and carbonyl group.
Fig 2.17. FTIR spectra of 50: AA:pectin solid dispersions carbonyl stretching (1500 -
1900 cm-1
) at day 0

59
Table 2.3. Absorbance peak shift in FTIR spectra of pectin, 50:50 VitC:polymer
dispersions in the carbonyl region (a)1500 - 1700cm-1
, and (b)1700 - 1800cm-1
at day 0
(a)
Polymer
types
Peak position of FD polymer and 50:50 VitC:polymer
and their peak shifts in carbonyl region (cm-1
)
FD polymer 50:50 VitC:polymer Peak shift
CT 1599 1674 -75
AP 1611 1672 -62
EST 1638 1670 -33
K 1599 1672 -73
PVP 1649 1638 11
(b)
Polymer
types
Peak position of FD polymer and 50:50 VitC:polymer
and their peak shifts in carbonyl region (cm-1
)
FD polymer 50:50 VitC:polymer Peak shift
CT 1732 1748 -15
AP 1732 1749 -17
EST 1730 1751 -21
K 1736 1748 -12
PVP N/A 1757 N/A
In the carbonyl region, FD PVP had a single peak centered at 1649cm-1
. The
spectra of the VitC:PVP 50% dispersions had two peaks in the carbonyl region (1638 cm-
1, 1757 cm
-1). The spectra profiles of the 50% PVP dispersions were similar to the FTIR
spectra of VitC in which two peaks were observed (1651 cm-1
, 1753 cm-1
). The carbonyl
peak in the 1600cm-1
wavenumber region for the 50% dispersions shifted to a lower
wavenumber compared to both the FD PVP and FD VitC peaks. This indicated that there
was an additional interaction in the region which was correlated with the interaction
between VitC and PVP. Peak shifts to a lower wavenumber in the carbonyl region of
50:50 VitC:PVP were expected because the amide carbonyl of PVP is a strong HBA [19]
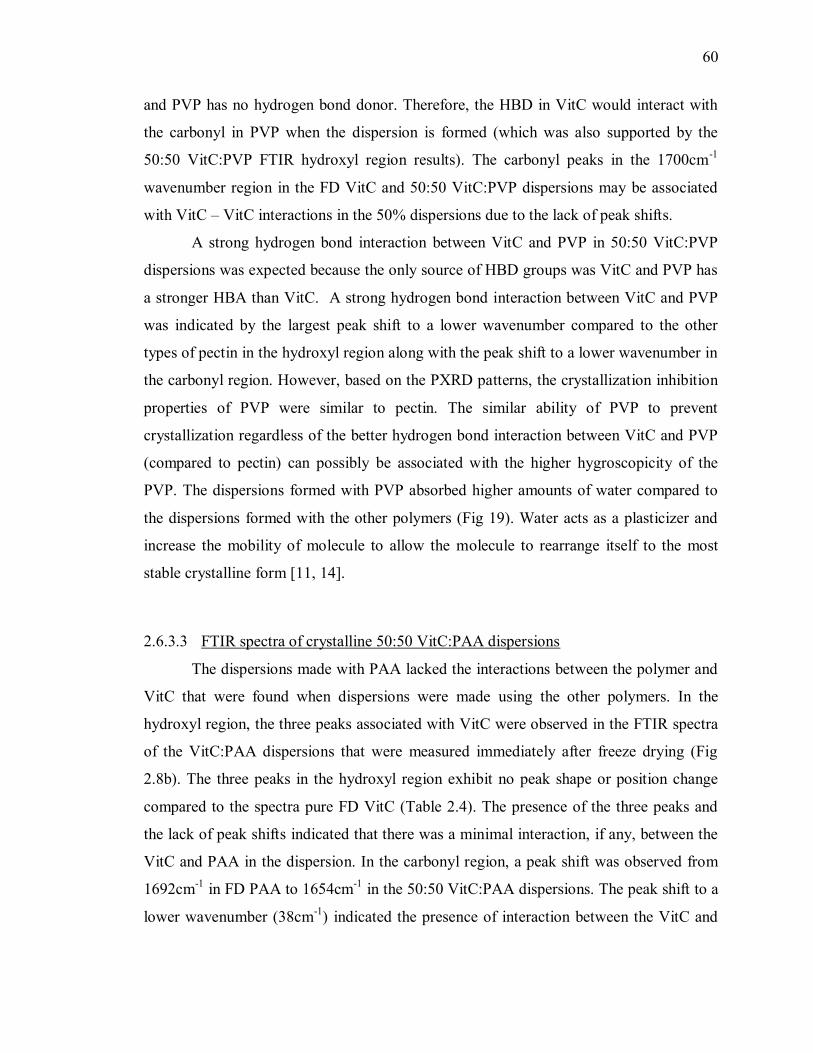
60
and PVP has no hydrogen bond donor. Therefore, the HBD in VitC would interact with
the carbonyl in PVP when the dispersion is formed (which was also supported by the
50:50 VitC:PVP FTIR hydroxyl region results). The carbonyl peaks in the 1700cm-1
wavenumber region in the FD VitC and 50:50 VitC:PVP dispersions may be associated
with VitC – VitC interactions in the 50% dispersions due to the lack of peak shifts.
A strong hydrogen bond interaction between VitC and PVP in 50:50 VitC:PVP
dispersions was expected because the only source of HBD groups was VitC and PVP has
a stronger HBA than VitC. A strong hydrogen bond interaction between VitC and PVP
was indicated by the largest peak shift to a lower wavenumber compared to the other
types of pectin in the hydroxyl region along with the peak shift to a lower wavenumber in
the carbonyl region. However, based on the PXRD patterns, the crystallization inhibition
properties of PVP were similar to pectin. The similar ability of PVP to prevent
crystallization regardless of the better hydrogen bond interaction between VitC and PVP
(compared to pectin) can possibly be associated with the higher hygroscopicity of the
PVP. The dispersions formed with PVP absorbed higher amounts of water compared to
the dispersions formed with the other polymers (Fig 19). Water acts as a plasticizer and
increase the mobility of molecule to allow the molecule to rearrange itself to the most
stable crystalline form [11, 14].
2.6.3.3 FTIR spectra of crystalline 50:50 VitC:PAA dispersions
The dispersions made with PAA lacked the interactions between the polymer and
VitC that were found when dispersions were made using the other polymers. In the
hydroxyl region, the three peaks associated with VitC were observed in the FTIR spectra
of the VitC:PAA dispersions that were measured immediately after freeze drying (Fig
2.8b). The three peaks in the hydroxyl region exhibit no peak shape or position change
compared to the spectra pure FD VitC (Table 2.4). The presence of the three peaks and
the lack of peak shifts indicated that there was a minimal interaction, if any, between the
VitC and PAA in the dispersion. In the carbonyl region, a peak shift was observed from
1692cm-1
in FD PAA to 1654cm-1
in the 50:50 VitC:PAA dispersions. The peak shift to a
lower wavenumber (38cm-1
) indicated the presence of interaction between the VitC and

61
PAA. The peak shift was likely only observed in the carbonyl region and not in the
hydroxyl region because of the limited interaction between VitC and PAA as well as the
stronger vibration caused by VitC-VitC hydroxyl interactions. Any possible peak shifts or
peak shape alternation from VitC-polymer interaction in hydroxyl region could be
masked by the vibration from VitC-VitC interactions. Therefore, although there were
some hydrogen bonding interactions between the VitC and PAA in the dispersion, the
interaction was not enough to produce a stable amorphous solid dispersion.
Table 2.4. FTIR spectra absorbance maximum peak positions in the hydroxyl region
(3000 - 3600cm-1
) at day 0
Wavenumber
region
Peak position of FDVitC and 50:50
VitC:PAA in the hydroxyl region (cm-1
)
FD VitC 50:50 VitC:PAA
3588 - 3464 3250 3520
3433 - 3341 3397 3398
3310 - 3270 3298 3298
PAA has strong HBD and medium HBA ability [2] which is similar to the
hydrogen bond capability of VitC. There was a possibility that the HBD of VitC was
stronger and the HBA in PAA was stronger, or vice versa, which would allow the
formation of PAA-VitC interactions. Based on the FTIR spectra, however, the interaction
between VitC and PAA was not preferable. Therefore, the stronger HBD and HBA
groups were present in the same compound, either VitC or PAA, preventing the
formation of VitC-PAA interactions.
2.6.4 Moisture sorption isotherm profiles
Moisture sorption isotherm profiles document the relationship between water
activity (aw) and moisture content of a compound. The addition of a hygroscopic polymer
to form a stable solid dispersion can lead to the increase of moisture sorbed compared to
the pure crystalline solid, or if can be formed the amorphous target molecule alone. Water

62
acts as a plasticizer that leads to the increase of molecular mobility and can allow an
amorphous molecule to rearrange itself to the most stable crystalline form [11, 14].
Therefore, understanding the amount of moisture sorbed with the addition of different
types of polymer is of importance.
VitC and FD VitC gained a small amount of weight as the environmental RH was
increased due to moisture adsorption and capillary condensation below its deliquescence
point of 98%RH (Fig 2.18). FD VitC gained more moisture compared to VitC. Although
the FD VitC was crystalline immediately after freeze drying, the crystals were not
arranged as tightly as the initial crystalline VitC (Fig 2.2b). There appeared to be an
increase in the surface area of FD VitC which would allow more moisture to be adsorbed.
Moreover, the more disordered structure of FD VitC could cause more contact points
where capillary condensation could occur.
Fig 2. 18. Moisture sorption isotherm profile SPS gravimetric analyzer of AA and FD AA
Different types of pectin absorbed similar amounts of water at different %RHs,
and PVP absorbed more water than any of the pectins (Fig 2.19). The PAA absorbed less
moisture at lower %RHs (below 60%RH) than pectin but absorbed more moisture than
pectin at higher %RHs. The moisture content of the different types of pectin at 90%RH
was between 25 – 30% (db), while the moisture content of PVP was 54.4% and PAA was
41.8% (Table 5).
0.0
0.2
0.4
0.6
0.8
1.0
5 11 16 22 27 33 39 44 50 56 61 67 73 78 84 87 89
%W
eigh
t ch
ange
%RH
AA FD AA

63
Fig 2.19. Moisture sorption isotherm profile SPS gravimetric analyzer of unfreeze dried
polymer
When the polymers were freeze dried, the moisture content of different types of
FD pectin were higher than the initial pectin while the moisture content of FD PAA and
FD PVP was lower than the initial forms (Fig 2.20). Freeze drying caused pectin to have
a visibly more opened structure. As water sublimed from the pectin solution during the
freeze drying process, the space that was occupied by water was left empty. Moreover,
during the removal of water, some of the pectin strands were visibly broken (Figure 2.6).
Therefore, at a specific %RH, the freeze dried pectins were able to absorb more water
compared to the unfreeze-dried pectins. In contrast with the pectin samples, freeze dried
PVP and PAA absorbed less water (Table 2.5).
0
10
20
30
40
50
60
0 10 20 30 40 50 60 70 80 90 100
%W
eigh
t ch
ange
%RH
CT AP EST K PVP PAA
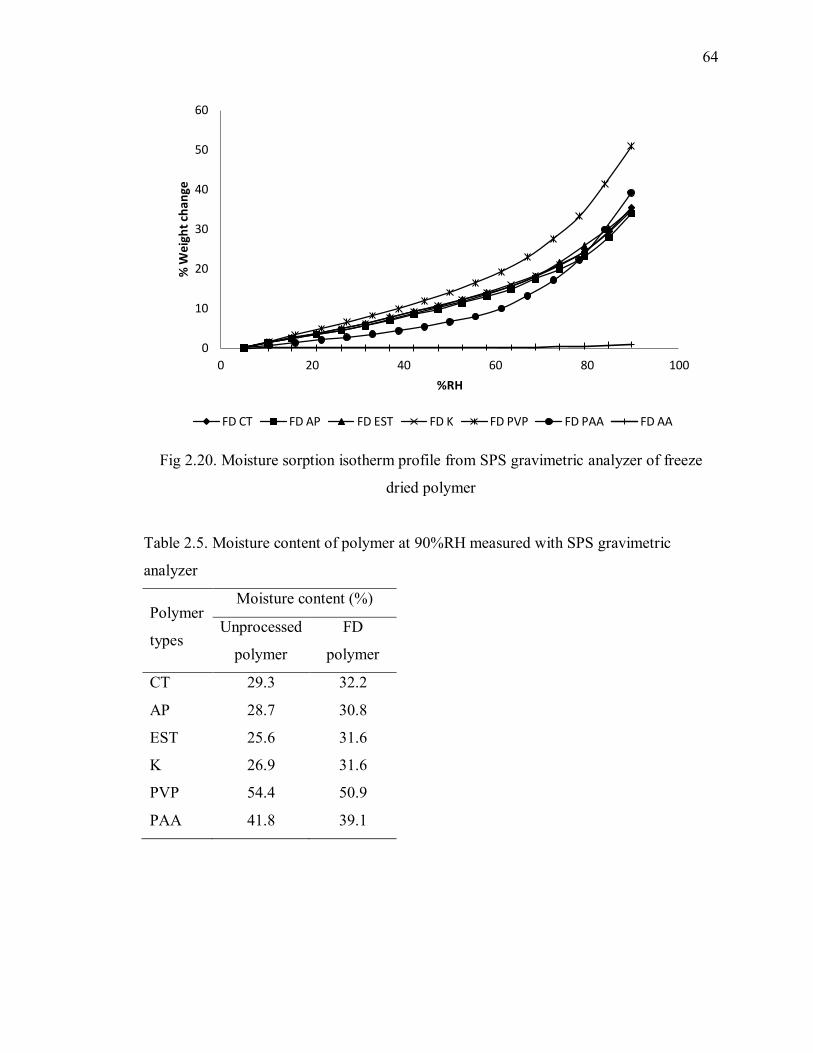
64
Fig 2.20. Moisture sorption isotherm profile from SPS gravimetric analyzer of freeze
dried polymer
Table 2.5. Moisture content of polymer at 90%RH measured with SPS gravimetric
analyzer
Polymer
types
Moisture content (%)
Unprocessed
polymer
FD
polymer
CT 29.3 32.2
AP 28.7 30.8
EST 25.6 31.6
K 26.9 31.6
PVP 54.4 50.9
PAA 41.8 39.1
0
10
20
30
40
50
60
0 20 40 60 80 100
% W
eigh
t ch
ange
%RH
FD CT FD AP FD EST FD K FD PVP FD PAA FD AA

65
Since the amount of moisture sorbed by crystalline ascorbic acid is limited below
its deliquescence point, the moisture absorbed 50:50 VitC:polymer physical mixtures was
primarily from the unprocessed pectin (Fig 2.21). Therefore, the amount of moisture
absorbed by the 50:50 AA:pectin physical mixtures was predicted to be 50% of the
moisture absorbed by the unfreeze dried-polymer because the physical mixtures
contained 50% (w/w) of the polymer (Eq 1). The amount of moisture absorbed by the
physical mix at 90%RH was also comparable with the predicted moisture absorbed,
except for PVP (Table 2.6). The PVP physical mix absorbed 4.7% moisture (db) less than
the predicted value. In physical mix, some of the polymer was in contact with AA which
reduced the surface area that can be in contact for moisture absorption. Since PVP is a
hygroscopic compound, the presence of VitC in the system was likely to have more
influence than in other polymer blends.
Eq 1. Equation used to calculate the estimated moisture sorption of 50:50 VitC:polymer
physical mixtures at specific %RHs
Fig 2.21. Moisture sorption profiles of 50:50 VitC:polymer physical mixtures with (a) CT,
(b) AP, (c) EST, (d) K, (e) PVP, (f) PAA at 25oC
0
5
10
15
20
25
30
35
5 11 16 22 27 33 39 44 50 56 61 67 73 78 84 89 95
%W
eigh
t ch
ange
%RH
PM CT PM AP PM EST PM K PM PVP PM PAA
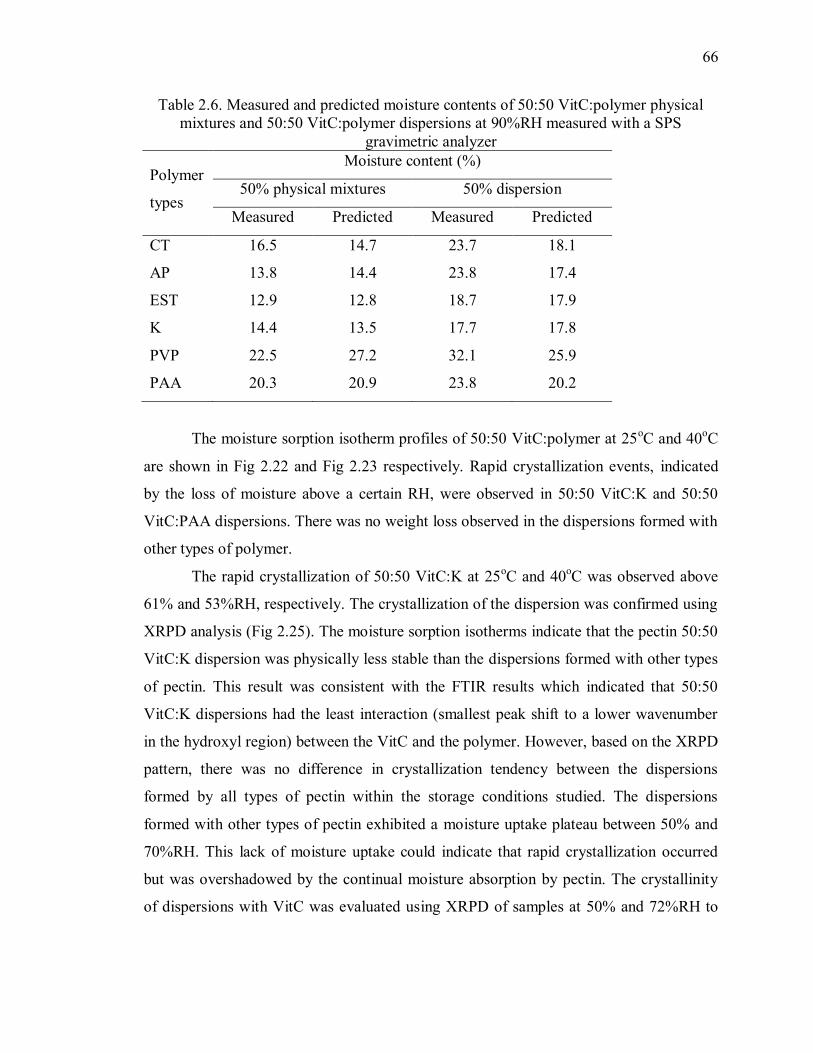
66
Table 2.6. Measured and predicted moisture contents of 50:50 VitC:polymer physical
mixtures and 50:50 VitC:polymer dispersions at 90%RH measured with a SPS
gravimetric analyzer
Polymer
types
Moisture content (%)
50% physical mixtures 50% dispersion
Measured Predicted Measured Predicted
CT 16.5 14.7 23.7 18.1
AP 13.8 14.4 23.8 17.4
EST 12.9 12.8 18.7 17.9
K 14.4 13.5 17.7 17.8
PVP 22.5 27.2 32.1 25.9
PAA 20.3 20.9 23.8 20.2
The moisture sorption isotherm profiles of 50:50 VitC:polymer at 25oC and 40
oC
are shown in Fig 2.22 and Fig 2.23 respectively. Rapid crystallization events, indicated
by the loss of moisture above a certain RH, were observed in 50:50 VitC:K and 50:50
VitC:PAA dispersions. There was no weight loss observed in the dispersions formed with
other types of polymer.
The rapid crystallization of 50:50 VitC:K at 25oC and 40
oC was observed above
61% and 53%RH, respectively. The crystallization of the dispersion was confirmed using
XRPD analysis (Fig 2.25). The moisture sorption isotherms indicate that the pectin 50:50
VitC:K dispersion was physically less stable than the dispersions formed with other types
of pectin. This result was consistent with the FTIR results which indicated that 50:50
VitC:K dispersions had the least interaction (smallest peak shift to a lower wavenumber
in the hydroxyl region) between the VitC and the polymer. However, based on the XRPD
pattern, there was no difference in crystallization tendency between the dispersions
formed by all types of pectin within the storage conditions studied. The dispersions
formed with other types of pectin exhibited a moisture uptake plateau between 50% and
70%RH. This lack of moisture uptake could indicate that rapid crystallization occurred
but was overshadowed by the continual moisture absorption by pectin. The crystallinity
of dispersions with VitC was evaluated using XRPD of samples at 50% and 72%RH to

67
identify any possible physical changes. The XRPD patterns confirmed that no
crystallization occurred and the dispersions formed with CT remained amorphous (Fig
2.24).
The rapid crystallization of 50:50 VitC:PAA dispersions at 25oC and 40
oC was
observed above 39% and 31%RH, respectively. It is important to note that the 50:50
VitC:PAA dispersion was XRPD crystalline immediately after freeze drying. Therefore,
at the start of analysis, the dispersion was at least partially crystalline with some possible
amorphous region. As the environmental RH was increased, complete crystallization
occurred at the temperature, %RH combination listed above. Below 31%RH (25oC),
additional crystallization may have occurred but was overshadowed by the moisture
absorbed by the PAA at those conditions.
Fig 2.22. Moisture sorption profiles of VitC 50% dispersions with (a) CT, (b) AP, (c)
EST, (d) K, (e) PVP, and (f) PAA at 25oC
0
10
20
30
40
50
60
5 11 16 22 28 33 39 44 50 56 61 67 72 78 84 90 95
% W
eigh
t ch
ange
%RH disp CT disp AP disp EST disp K disp PVP disp PAA

68
Fig 2.23. Moisture sorption profiles of VitC 50% dispersions with (a) CT, (b) AP, (c)
EST, (d) K, (e) PVP, and (f) PAA at 40oC
Fig 2.24. Moisture sorption profiles of VitC:CT 50:50 dispersions at 25oC. XRPD
patterns confirmed that there were no recrystallization events.
0
5
10
15
20
25
30
35
40
45
5 10 16 21 26 32 37 42 48 53 58 64 69 75 80 85 91
%W
eigh
t ch
ange
%RH 50% CT 50% AP 50% EST 50% K 50% PVP 50% PAA

69
Fig 2.25. Moisture sorption profiles of VitC:K 50:50 dispersions at 25oC. XRPD patterns
confirmed that rapid crystallization occurred above 61%RH.
Moisture sorption isotherms of 50:50 VitC:polymer dispersions were predicted
using the moisture absorbed by FD AA and FD polymer (Eq 2) and compared to the
experimental data collected for the dispersions. In amorphous solid dispersions, the VitC
would be present as an amorphous compound that would absorb more moisture compared
to the pure crystalline - FD ascorbic acid. In 50:50 VitC:CT and 50:50 VitC:PVP
dispersions, where there were no rapid crystallization events, the moisture absorbed at
different %RHs was consistently higher than the predicted values (Fig 2.26a-d, Table 2.7).
An exception was observed in the 50:50 VitC:PVP dispersions below 50% RH in which
the dispersion absorbed less moisture than the predicted value, the physical mixtures, and
the PVP alone (Fig 2.26e). A similar explanation on why the physical mixtures absorbed
less moisture than the PVP alone can be applied to this observation. PVP is a very
hygroscopic compound. The presence of AA in the physical mixtures could have reduced

70
the ability of PVP to absorb water due to the decrease in surface area that was exposed to
moisture in the environment. When PVP was interacting with VitC in the dispersion, its
ability to absorb moisture was further reduced. However, in a high %RH condition, the
more open structure of PVP and the amorphous VitC led to more moisture absorption
than the predicted value. A similar observation was seen in another study where PVP-
resveratrol physical mixtures absorbed more moisture compared to PVP-resveratrol solid
dispersions at all %RHs below 95%RH. It was believed that the hydrogen bonding
between PVP andresveratrol suppressed the ability of the dispersion to sorb moisture [9].
Eq 2. Equation used to calculate the estimated moisture sorption of 50:50 VitC:polymer
dispersions at specific %RHs
When crystallization of a solid dispersion was noticed, the polymer in the system
remained amorphous while the VitC crystallized. Therefore,when recrystallization of a
solid dispersion occurred, such as in 50:50 VitC:PAA dispersions, the moisture absorbed
will theoretically be similar to the predicted value from amorphous polymer:crystalline
VitC physical blends. At %RHs below 31%RH, the moisture absorbed by 50:50
VitC:PAA dispersions was higher than the predicted values. This showed the VitC in the
dispersion was still partially amorphous. However, above 31%RH, the 50% dispersion
absorbed a similar amount of moisture to the predicted values, indicating that most of the
VitC had likely crystallized (Fig 2.26f, Table 2.7).
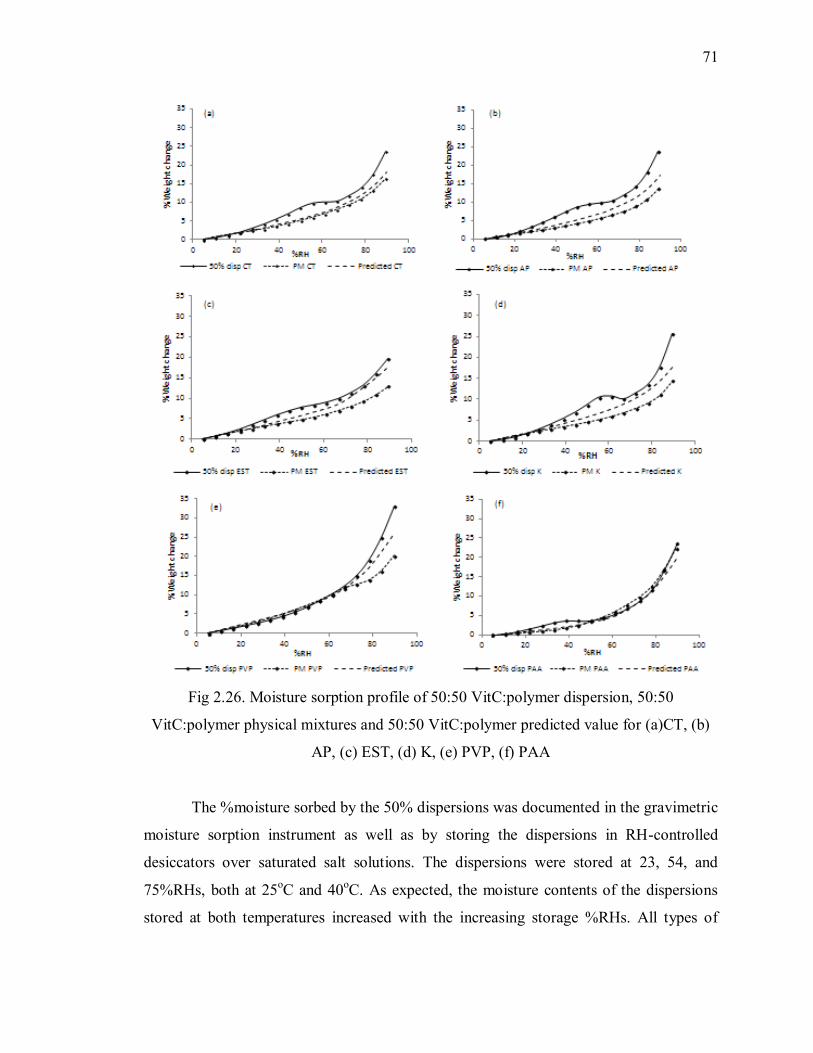
71
Fig 2.26. Moisture sorption profile of 50:50 VitC:polymer dispersion, 50:50
VitC:polymer physical mixtures and 50:50 VitC:polymer predicted value for (a)CT, (b)
AP, (c) EST, (d) K, (e) PVP, (f) PAA
The %moisture sorbed by the 50% dispersions was documented in the gravimetric
moisture sorption instrument as well as by storing the dispersions in RH-controlled
desiccators over saturated salt solutions. The dispersions were stored at 23, 54, and
75%RHs, both at 25oC and 40
oC. As expected, the moisture contents of the dispersions
stored at both temperatures increased with the increasing storage %RHs. All types of

72
dispersions absorbed less amounts of moisture when stored at 40oC compared to 25
oC. A
similar observation was seen in the moisture sorption isotherms generated with the
gravimetric SPS instrument. At higher temperatures, water has higher energy and
mobility resulting in less moisture that can be absorbed and stabilized in the dispersion at
the same environmental RH condition.
The moisture sorption behaviors of different types of dispersions at the specific
storage %RHs were similar to the results obtained with the gravimetric SPS. The
dispersions formed with different types of pectins absorbed similar amounts of moisture
at all storage temperatures and %RHs (Table 2,7, Table 2.8). At 23 and 54%RH, the
dispersions formed with PAA absorbed less moisture than the pectin dispersions.
However, the dispersions formed with PAA and pectins absorbed similar amounts of
moisture at 75%RH. The moisture sorption profiles of dispersions formed with PAA
were mostly influenced by the ability of PAA to absorb moisture across different %RHs
since FD PAA absorbed less moisture than pectin at lower %RHs and slightly higher
moisture at higher %RHs. Moreover, the dispersions formed with PAA were more likely
be more crystalline than the dispersions formed with pectin since the PAA dispersions
were already at least partially crystalline immediately after freeze drying and continued to
crystallize with increasing %RHs. Therefore, at high %RH, the completely crystalline
PAA dispersion absorbed similar amount of moisture than partially crystalline pectin. In
addition, the dispersions formed with PVP absorbed significantly more moisture than any
other types of dispersion, especially when stored at 75%RH. This further confirmed the
higher hygroscopicity of PVP in comparison to the other polymers.

73
Table 2.7. %Moisture contents (wwb) of 50:50 VitC:polymer dispersion stored at 25oC at
different storage %RHs
VitC dispersions
with the identified
polymer
%Moisture content following storage @ the
identified RH
23% RH 54% RH 75% RH
CT 4.49 ± 0.17 7.67 ± 0.05 11.28 ± 0.48
AP 4.05 ± 0.07 7.14 ± 1.11 11.07 ± 0.01
EST 4.24 ± 0.08 7.16 ± 0.47 10.99 ± 0.46
K 3.50 ± 0.11 7.00 ± 0.20 10.18 ± 0.78
PVP * * *
PAA 1.51 ± 0.88 3.34 ± 0.83 10.13 ± 0.79
*Data collection will be completed
Table 2.8. %Moisture content (wwb) of 50:50 VitC:polymer dispersion stored at 25oC at
different storage %RHs
Dispersion with
following polymer
%Moisture content following storage @ the
identified RH
23% 54% 75%
CT 3.64 ± 0.40 5.63 ± 0.22 8.82 ± 0.36
AP 4.40 ± 0.40 5.61 ± 0.56 7.87 ± 0.53
EST 4.51 ± 0.41 5.93 ± 0.46 8.44 ± 0.21
K 3.93 ± 0.06 4.47 ± 0.47 8.44 ± 1.89
PVP 2.01 ± 0.80 5.40 ± 0.32 11.12 ± 0.13
PAA 2.55 ± 0.35 2.36 ± 0.99 8.96 ± 1.02
2.6.5 Glass transition temperatures (Tg) of polymers and solid dispersions
Amorphous VitC could not be formed individually, in the absence of a polymer,
by freeze drying due to its high crystallization tendency. Other methods, such as spray
drying, have also failed to form amorphous VitC on its own [3]. One approach that can be
taken to form amorphous VitC is by heating the VitC to slightly above its melting point
74
and then quickly cooling it to a temperature below its predicted Tg using a thermal
analysis instrument such as a differential scanning calorimeter (DSC) [26]. The onset Tg
of VitC that is heated to 100oC, quickly cooled to -80
oC, and then reheated to 100
oC in
the DSC was found to be -17±2oC. However, heating VitC to a high temperature will
cause chemical instability and degradation, resulting in an inaccurate Tg measurement
that would be influenced by the degradation compounds. Therefore, it is practically
impossible to measure the Tg of VitC accurately. The Tg of a compound can be predicted
based on the melting temperature (Tm) of its crystalline structure: the Tg is typically 2/3
to 4/5 of the Tm measured in Kelvin [27-29]. The melting temperature of VitC is 190oC
or 462.15K. Therefore, the Tg of VitC was predicted to be between 284.1K and 370K or
between 10.95oC to 96.85
oC. Therefore, the Tg obtained from by heating to 100
oC in
DSC was not the Tg of pure VitC, instead some VitC degradation products interfered
with the measurement. The Tg of the pure VitC was assumed to be 10.95oC based on the
2/3 rule. The 2/3 rule were also used to predict the Tg of resveratrol as resveratrol could
not be made amorphous in the absence of polymer[9]. Moreover, study had been done
measured the Tg of freeze concentrated VitC. VitC was dissolved in water and frozen to -
100oC before the Tg was measured. The Tg of 30% (wt/wt) ascorbic acid in water was
found to be -54°C [26]. (An attempt to predict the Tg of pure VitC will be done with the
Tgs of 50:50 VitC:PVP dispersions stored at various storage %RHs once the data
collection was completed.)
The Tg of different types of pectin, both freeze dried and non-freeze dried, could
not be obtained experimentally either with DSC or modulated DSC (Table 2.9, Fig 2.27).
It was believed that although different types of esterification of pectin have a specific
range of degree of esterification, there was some fraction of the pectin that were outside
of the specification range given by the supplier. The undetectable Tg of the pectin was
likely due to the heterogeneity of the pectin samples. Once the pectin was formed into
dispersions with VitC, the Tgs of the dispersions were obtained (Table 7). This trend was
also reported in a study in which the Tg of individual pectin could not be detected, but the
Tg could be detected once a dispersion was formed with polyvinyl alcohol [30]. Other
reported Tg values for pectin vary widely, even though similar DEs of pectin were used.
75
Chien et al. reported that the Tgs of low (22% DE), intermediate (64% DE), and high
methoxyl pectin (92% DE) were 96.2, 96.4, and 93.5°C, respectively[31]. Hatakeyama et
al. reported that two low methoxyl pectin (16-30% DE, 26-36%DE) and two high
methoxyl pectin (64-68%DE, 70-74%DE) samples have similar Tgs of 37°C. However,
in this study, the pectin used was initially crystalline and was converted into an
amorphous state during the first DSC scan [32]. Therefore, there are wide ranges of Tgs
reported for pectin that likely vary greatly according to the source and the processing
used to extract and modify the pectin.

Table 2.9. DSC methods used to identify the Tg of pectin
76

77
Fig 2.27. The DSC curve for a sample of pectin CT
The pectins used in this study were believed to have Tgs close to 90°C, similar to
the reported value by Chien et al. [31]. When amorphous solid dispersions are made with
two components, a single Tg will be observed that is between the Tgs of the two pure
components [33]. The Tg of VitC was predicted to be close to 10oC. The Tgs of VitC-
pectin dispersions measured immediately after freeze drying were above 37oC (37
oC was
the reported Tg value of pectin by Hatakeyama et al [32]) (Table 10). Therefore, the Tgs
of the pectins used in this study would be well above 37oC. Moreover, unlike the pectin
reported by Hatakeyama et al [32], all types of pectin used in the study were XRPD
amorphous when received.
The onset Tgs of PVP and PAA were 157±2oC and 130±2
oC, respectively, which
were similar to previously reported values [9, 13]. The Tgs of freeze dried PVP and PAA
decreased as %RHs increased (Table 2.10, Fig 2.27). The Tgs of PVP deviated from the
Tgs predicted using the Gordon-Taylor equation at the lowest and highest storage %RHs
(Fig 2.27). The Tg of PAA measured was close to the Tgs that were predicted using
Gordon – Taylor equation.
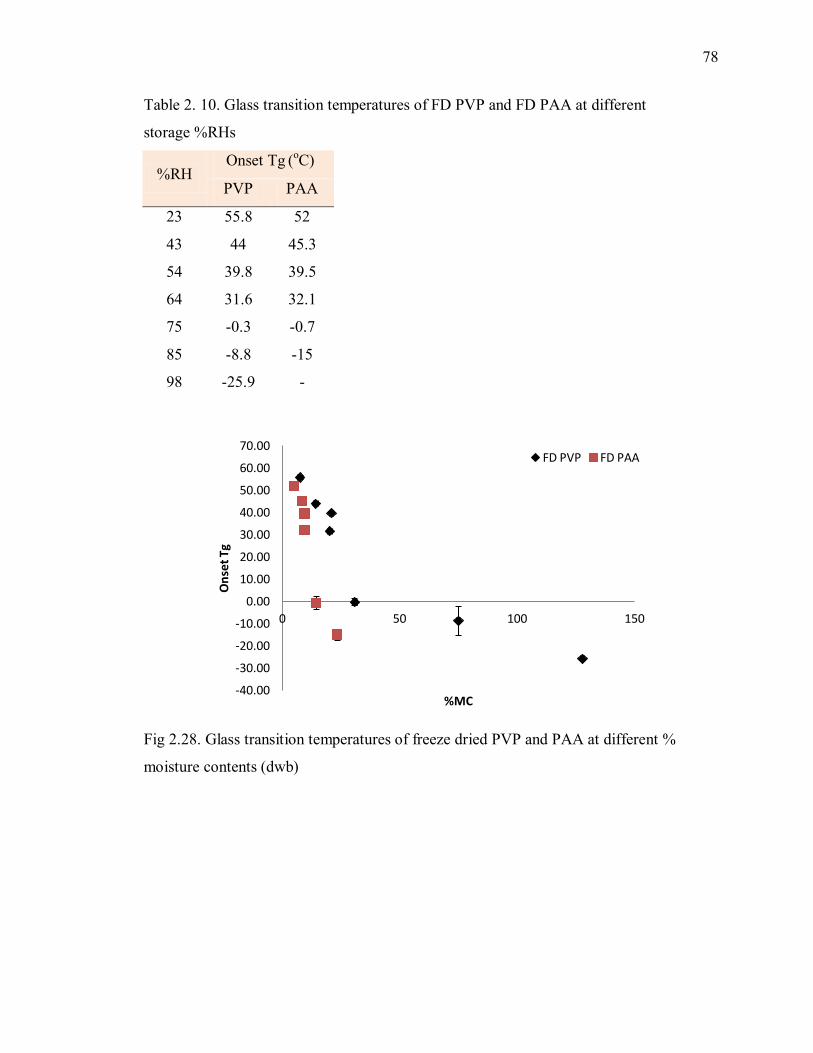
78
Table 2. 10. Glass transition temperatures of FD PVP and FD PAA at different
storage %RHs
%RH Onset Tg
(
oC)
PVP PAA
23 55.8 52
43 44 45.3
54 39.8 39.5
64 31.6 32.1
75 -0.3 -0.7
85 -8.8 -15
98 -25.9 -
Fig 2.28. Glass transition temperatures of freeze dried PVP and PAA at different %
moisture contents (dwb)
-40.00
-30.00
-20.00
-10.00
0.00
10.00
20.00
30.00
40.00
50.00
60.00
70.00
0 50 100 150
On
set
Tg
%MC
FD PVP FD PAA
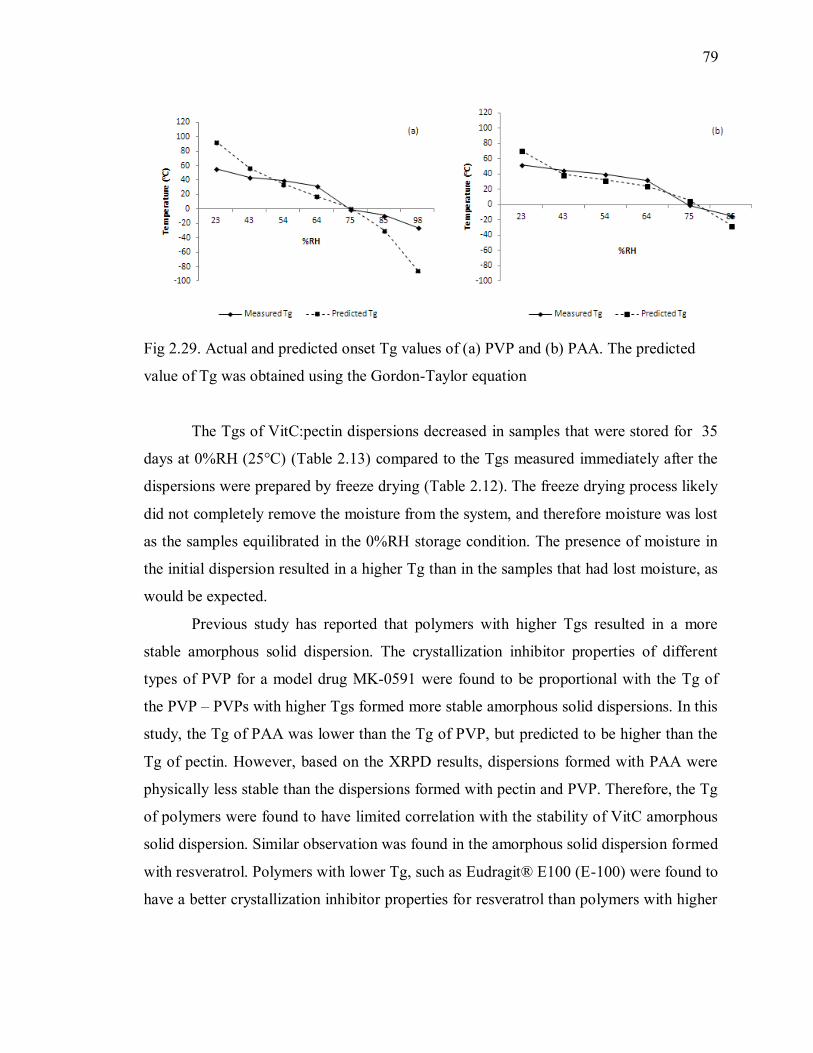
79
Fig 2.29. Actual and predicted onset Tg values of (a) PVP and (b) PAA. The predicted
value of Tg was obtained using the Gordon-Taylor equation
The Tgs of VitC:pectin dispersions decreased in samples that were stored for 35
days at 0%RH (25°C) (Table 2.13) compared to the Tgs measured immediately after the
dispersions were prepared by freeze drying (Table 2.12). The freeze drying process likely
did not completely remove the moisture from the system, and therefore moisture was lost
as the samples equilibrated in the 0%RH storage condition. The presence of moisture in
the initial dispersion resulted in a higher Tg than in the samples that had lost moisture, as
would be expected.
Previous study has reported that polymers with higher Tgs resulted in a more
stable amorphous solid dispersion. The crystallization inhibitor properties of different
types of PVP for a model drug MK-0591 were found to be proportional with the Tg of
the PVP – PVPs with higher Tgs formed more stable amorphous solid dispersions. In this
study, the Tg of PAA was lower than the Tg of PVP, but predicted to be higher than the
Tg of pectin. However, based on the XRPD results, dispersions formed with PAA were
physically less stable than the dispersions formed with pectin and PVP. Therefore, the Tg
of polymers were found to have limited correlation with the stability of VitC amorphous
solid dispersion. Similar observation was found in the amorphous solid dispersion formed
with resveratrol. Polymers with lower Tg, such as Eudragit® E100 (E-100) were found to
have a better crystallization inhibitor properties for resveratrol than polymers with higher
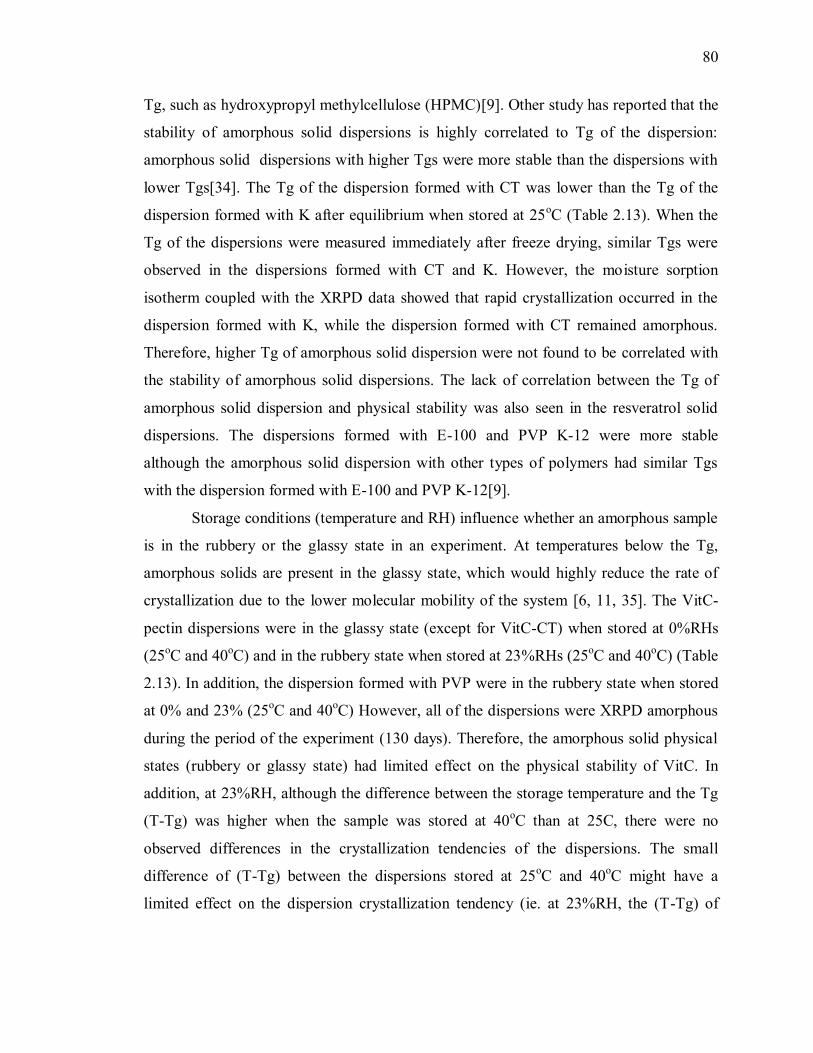
80
Tg, such as hydroxypropyl methylcellulose (HPMC)[9]. Other study has reported that the
stability of amorphous solid dispersions is highly correlated to Tg of the dispersion:
amorphous solid dispersions with higher Tgs were more stable than the dispersions with
lower Tgs[34]. The Tg of the dispersion formed with CT was lower than the Tg of the
dispersion formed with K after equilibrium when stored at 25oC (Table 2.13). When the
Tg of the dispersions were measured immediately after freeze drying, similar Tgs were
observed in the dispersions formed with CT and K. However, the moisture sorption
isotherm coupled with the XRPD data showed that rapid crystallization occurred in the
dispersion formed with K, while the dispersion formed with CT remained amorphous.
Therefore, higher Tg of amorphous solid dispersion were not found to be correlated with
the stability of amorphous solid dispersions. The lack of correlation between the Tg of
amorphous solid dispersion and physical stability was also seen in the resveratrol solid
dispersions. The dispersions formed with E-100 and PVP K-12 were more stable
although the amorphous solid dispersion with other types of polymers had similar Tgs
with the dispersion formed with E-100 and PVP K-12[9].
Storage conditions (temperature and RH) influence whether an amorphous sample
is in the rubbery or the glassy state in an experiment. At temperatures below the Tg,
amorphous solids are present in the glassy state, which would highly reduce the rate of
crystallization due to the lower molecular mobility of the system [6, 11, 35]. The VitC-
pectin dispersions were in the glassy state (except for VitC-CT) when stored at 0%RHs
(25oC and 40
oC) and in the rubbery state when stored at 23%RHs (25
oC and 40
oC) (Table
2.13). In addition, the dispersion formed with PVP were in the rubbery state when stored
at 0% and 23% (25oC and 40
oC) However, all of the dispersions were XRPD amorphous
during the period of the experiment (130 days). Therefore, the amorphous solid physical
states (rubbery or glassy state) had limited effect on the physical stability of VitC. In
addition, at 23%RH, although the difference between the storage temperature and the Tg
(T-Tg) was higher when the sample was stored at 40oC than at 25C, there were no
observed differences in the crystallization tendencies of the dispersions. The small
difference of (T-Tg) between the dispersions stored at 25oC and 40
oC might have a
limited effect on the dispersion crystallization tendency (ie. at 23%RH, the (T-Tg) of

81
50:50 VitC:AP stored at 25oC is 3
oC; at 40
oC is 9
oC). Therefore, although the storage
temperature was above the Tg, it might be important to consider (T-Tg) in understanding
crystallization kinetics.
Table 2.11. Onset Tgs of 50:50 ascorbic acid:pectin solid dispersions at day 0
Sample Onset Tg
(oC)
CT 60.5
AP 51.5
EST 55.1
K 60.91
Table 2.12. Onset Tgs of 50% ascorbic acid:pectin solid dispersions after equilibration
(35 days) at 25oC and the identified RH conditions
Dispersion with
following
polymer
Onset glass transition temperature (oC) following
storage @ the identified RH
0 23% 54% 75%
CT * 18 n.d n.d
AP 41 28 n.d n.d
EST 34 26 n.d n.d
K 42 24 n.d n.d
PVP 24 18 -1.4 *
PAA * * 34 *
*The solid dispersions were XRPD crystalline when stored at 54% and 75%RH

82
Table 2.13. Onset Tgs of 50% ascorbic acid:pectin solid dispersions after equilibration
(35 days) at 40oC and the identified RH conditions
Dispersion with
following
polymer
Onset glass transition temperature (oC) following
storage @ the identified RH
0 23% 54% 75%
CT 31 28 n.d n.d
AP 53 31 n.d n.d
EST 47 30 n.d n.d
K 56 32 n.d n.d
PVP 35 * -0.9 -34
PAA * * 17 -15
*The solid dispersions were XRPD crystalline when stored at 54% and 75%RH
2.6.6 The effect of VitC-polymer interactions, hygroscopicity and Tg on the stability of
amorphous solid dispersions
Although the Tg, hygroscopicity, and intermolecular interactions between a
polymer and target compound have been related to the physical stability of amorphous
solid dispersions, it is unclear which of these factors plays the biggest role in inhibiting
crystallization. Some reports state the Tg of the polymer is the most influential factor.
However, other reports indicate Tg is not as important as other factors. Some studies
found that the ability of a polymer to interact with the target compound, such as by
hydrogen bonding, was the determining factor in forming a stable amorphous solid
dispersion. Polymers that can form better specific interactions, ie. hydrogen bond
interaction, were found to best inhibit the crystallization of resveratrol[9], felodopine
[36], bifonazole and nimesulide [7] although the Tgs of the best polymers with the most
intermolecular interactions were lower than other polymers used in the study. Moreover,
the correlation between the anti-plasticization effect and crystallization inhibition activity
of PVP was not observed when used at small polymer concentration in indometachin
dispersion[8]. In addition, a potential drawback of the usage of polymer in producing an
amorphous solid is the polymer’s ability to absorb significantly larger amounts of
83
moisture compared to the crystalline compound. Moisture acts as a plasticizer that both
decreases the Tg of a system [11] and disrupts the crystalline compound-polymer
hydrogen bond interactions [12].
In this study of amorphous solid dispersions containing ascorbic acid and
polymers, a good agreement was found between the FTIR spectra and XRPD patterns
related to the hydrogen bonding interactions between the vitamin and polymer and the
observed crystalline or amorphous traits in the XRPD patterns. Interactions between VitC
and pectin or PVP were present in all amorphous solid dispersions, and these dispersions
remained amorphous when stored at lower %RHs (0 and 23% RH at 25 and 40°C). The
hydrogen bonding interactions between VitC and PAA were minimal or absent in the
crystallized VitC-PAA solid dispersions. Moreover, when the dispersions formed with
EST crystallized, the hydrogen bonding interactions between VitC and EST were lost,
replaced by Vit-VitC interactions shown with the presence of four VitC crystalline peaks
in the hydroxyl region and some other possible interaction with moisture. In contrast, the
addition of polymers with high Tg and the formation of amorphous solid dispersions with
high Tg were not found to increase the physical stability of the amorphous solid
dispersion. The Tg of PAA was lower than the Tg of PVP, but predicted to be higher than
the Tg of pectin. However, based on the XRPD, dispersions formed with PAA were
physically less stable than the dispersions formed with pectin and PVP. The dispersions
formed with K had higher Tg when stored at 0%RHs (25oC) than the dispersion formed
with CT. However, the dispersions formed with K were less stable than the dispersions
formed with CT when analyzed with SPS moisture sorption isotherm. Therefore, the
ability of the polymers to interact with VitC via hydrogen bonding was believed to be the
more important element to form a stable VitC amorphous dispersion than the Tg of the
polymers. The hygroscopicity of the polymer was not a key element in the formation of
stable solid dispersions. Freeze dried PAA absorbed the lowest moisture below 50%RH
based on the moisture sorption isotherm (25oC) obtained by SPS. However, the
dispersion formed with PAA crystallized immediately after freeze drying. Rapid
crystallization was also observed in the dispersion formed with PAA when analyzed with
SPS moisture sorption isotherm analyzed when other types of dispersion (except for K)

84
remained stable. Although the hygroscopity of the polymer was not the key element in
the formation of stable amorphous dispersions, it was still found to influence amorphous
solid dispersion stability. The higher hygroscopicity of PVP than pectin was thought to be
the explanation for the similar crystallization inhibitor properties of PVP and pectin at 54%
and 75%RH regardless the stronger VitC-PVP interactions. Similarly, the hygroscopicity
of PVP was shown to reduce the stability of felodipine solid dispersions at increasing
storage %RHs compared to less hygroscopic polymer, hydoxypropylmethylcellulose
acetate succinate (HPMCAS) and hydoxypropylmethyl-cellulose (HPMC) [36].
2.7 Conclusion
It is possible to form amorphous ascorbic acid in polymer dispersions; however,
amorphous ascorbic acid could not be formed by freeze-drying without the presence of a
polymeric crystallization inhibitor. The physical stability of amorphous VitC-polymer
dispersions was related to the presence of hydrogen bonding between ascorbic acid and
the polymer. Amorphous dispersions formed with PAA crystallized rapidly after freeze-
drying, likely due to the lack of hydrogen bonding interaction between PAA and ascorbic
acid. Ascorbic acid dispersions using pectin and PVP, polymers that were able to
hydrogen bond with the ascorbic acid, remained amorphous when stored at 0% and 23%
RH (at both 25oC and 40
oC) but crystallized after 1 week when stored at 54% and 75%
RH (at both 25oC and 40
oC). The addition of polymers with high Tg and the formation of
amorphous solid dispersions with higher Tg were found to have limited effects on the
physical stability of the amorphous solid dispersion. The polymers hygroscopicity was
not the key element in inhibiting the crystallization of amorphous solid but had increasing
influenced to the physical stability with increasing storage %RHs, especially for highly
hygroscopic polymer. Therefore, in order to inhibit the self-assembly of compounds with
high crystallization tendency, such as VitC, selection of polymer based on its ability to
form interaction with the target compound is essential to produce a stable amorphous
solid dispersion.
85
2.8 References
1. Van Eerdenbrugh, B. and L.S. Taylor, Small Scale Screening To Determine the
Ability of Different Polymers To Inhibit Drug Crystallization upon Rapid Solvent
Evaporation. Molecular Pharmaceutics, 2010. 7(4): p. 1328-1337.
2. Van Eerdenbrugh, B. and L.S. Taylor, An ab initio polymer selection methodology
to prevent crystallization in amorphous solid dispersions by application of crystal
engineering principles. Crystengcomm, 2011. 13(20): p. 6171-6178.
3. Islam, M.I.U., R. Sherrell, and T.A.G. Langrish, An Investigation of the
Relationship between Glass Transition Temperatures and the Crystallinity of
Spray-Dried Powders. Drying Technology, 2010. 28(3): p. 361-368.
4. West, M.E. and L.J. Mauer, Color and Chemical Stability of a Variety of
Anthocyanins and Ascorbic Acid in Solution and Powder Forms. Journal of
Agricultural and Food Chemistry, 2013. 61(17): p. 4169-4179.
5. Khougaz, K. and S.D. Clas, Crystallization inhibition in solid dispersions of MK-
0591 and poly(vinylpyrrolidone) polymers. Journal of Pharmaceutical Sciences,
2000. 89(10): p. 1325-1334.
6. Craig, D.Q.M., et al., The relevance of the amorphous state to pharmaceutical
dosage forms: glassy drugs and freeze dried systems. International Journal of
Pharmaceutics, 1999. 179(2): p. 179-207.
7. Kestur, U.S., B. Van Eerdenbrugh, and L.S. Taylor, Influence of polymer
chemistry on crystal growth inhibition of two chemically diverse organic
molecules. Crystengcomm, 2011. 13(22): p. 6712-6718.
8. Matsumoto, T. and G. Zografi, Physical properties of solid molecular dispersions
of indomethacin with poly(vinylpyrrolidone) and poly(vinylpyrrolidone-co-
vinylacetate) in relation to indomethacin crystallization. Pharmaceutical Research,
1999. 16(11): p. 1722-1728.
9. Wegiel, L.A., et al., Crystallization of amorphous solid dispersions of resveratrol
during preparation and storage-Impact of different polymers. Journal of
Pharmaceutical Sciences, 2013. 102(1): p. 171-184.

86
10. Taylor, L.S. and G. Zografi, Spectroscopic characterization of interactions
between PVP and indomethacin in amorphous molecular dispersions.
Pharmaceutical Research, 1997. 14(12): p. 1691-1698.
11. Roos, Y.H. and M. Karel, PLASTICIZING EFFECT OF WATER ON THERMAL-
BEHAVIOR AND CRYSTALLIZATION OF AMORPHOUS FOOD MODELS.
Journal of Food Science, 1991. 56(1): p. 38-43.
12. Marsac, P.J., et al., Effect of Temperature and Moisture on the Miscibility of
Amorphous Dispersions of Felodipine and Poly(vinyl pyrrolidone). Journal of
Pharmaceutical Sciences, 2010. 99(1): p. 169-185.
13. Leuner, C. and J. Dressman, Improving drug solubility for oral delivery using
solid dispersions. European Journal of Pharmaceutics and Biopharmaceutics,
2000. 50(1): p. 47-60.
14. Salekigerhardt, A. and G. Zografi, NONISOTHERMAL AND ISOTHERMAL
CRYSTALLIZATION OF SUCROSE FROM THE AMORPHOUS STATE.
Pharmaceutical Research, 1994. 11(8): p. 1166-1173.
15. Rumondor, A.C.F. and L.S. Taylor, Effect of Polymer Hygroscopicity on the
Phase Behavior of Amorphous Solid Dispersions in the Presence of Moisture.
Molecular Pharmaceutics, 2010. 7(2): p. 477-490.
16. Aso, Y., S. Yoshioka, and S. Kojima, Molecular mobility-based estimation of the
crystallization rates of amorphous nifedipine and phenobarbital in
poly(vinylpyrrolidone) solid dispersions. Journal of Pharmaceutical Sciences,
2004. 93(2): p. 384-391.
17. Hvoslef, J., CRYSTAL STRUCTURE OF L-ASCORBIC ACID VITAMIN C .I. X-
RAY ANALYSIS. Acta Crystallographica Section B-Structural Crystallography and
Crystal Chemistry, 1968. B 24: p. 23-&.
18. Falk, M. and M.J. Wojcik, EFFECT OF TEMPERATURE AND HYDROGEN-
BOND STRENGTH ON THE IR ABSORPTION OF ISOLATED OH
OSCILLATORS - CRYSTALLINE L-ASCORBIC-ACID. Spectrochimica Acta Part
a-Molecular and Biomolecular Spectroscopy, 1979. 35(10): p. 1117-1123.

87
19. Laurence, C., et al., The pK(BHX) Database: Toward a Better Understanding of
Hydrogen-Bond Basicity for Medicinal Chemists. Journal of Medicinal Chemistry,
2009. 52(14): p. 4073-4086.
20. Nath, M., et al., New organotin(IV) ascorbates: synthesis, spectral
characterization, biological and potentiometric studies. Spectrochimica Acta Part
a-Molecular and Biomolecular Spectroscopy, 2005. 61(1-2): p. 77-86.
21. Srinivasan, K. and K.V. Devi, Characterization of L-ascorbic acid single crystals
grown from solution with different solvents. Crystal Research and Technology,
2010. 45(9): p. 946-952.
22. Pandey, K.K., A study of chemical structure of soft and hardwood and wood
polymers by FTIR spectroscopy. Journal of Applied Polymer Science, 1999.
71(12): p. 1969-1975.
23. Kacurakova, M. and R.H. Wilson, Developments in mid-infrared FT-IR
spectroscopy of selected carbohydrates. Carbohydrate Polymers, 2001. 44(4): p.
291-303.
24. Chatjigakis, A.K., et al., FT-IR spectroscopic determination of the degree of
esterification of cell wall pectins from stored peaches and correlation to textural
changes. Carbohydrate Polymers, 1998. 37(4): p. 395-408.
25. Bociek, S.M. and D. Welti, QUANTITATIVE-ANALYSIS OF URONIC ACID
POLYMERS BY INFRARED SPECTROSCOPY. Carbohydrate Research, 1975.
42(2): p. 217-226.
26. Andersen, A.B. and L.H. Skibsted, Glass transition of freeze-concentrated
aqueous solution of ascorbic acid as studied by alternating differential scanning
calorimetry. Food Science and Technology-Lebensmittel-Wissenschaft &
Technologie, 1998. 31(1): p. 69-73.
27. Kerc, J. and S. Srcic, THERMAL-ANALYSIS OF GLASSY PHARMACEUTICALS.
Thermochimica Acta, 1995. 248: p. 81-95.
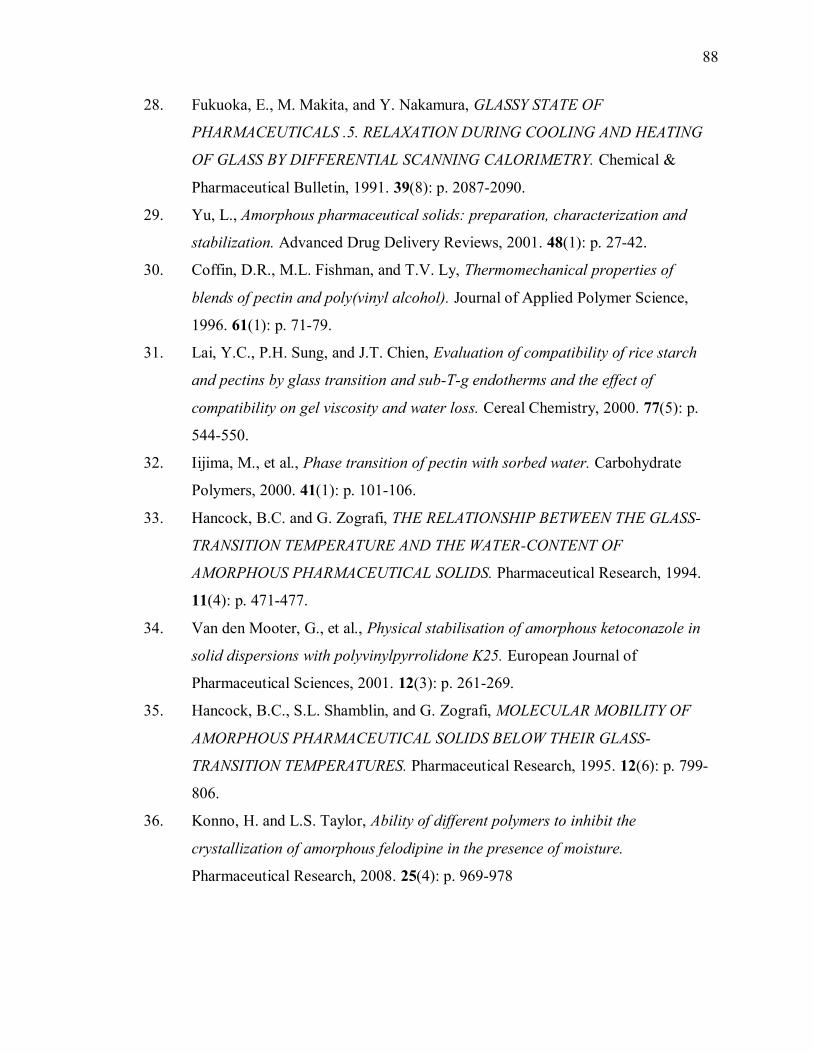
88
28. Fukuoka, E., M. Makita, and Y. Nakamura, GLASSY STATE OF
PHARMACEUTICALS .5. RELAXATION DURING COOLING AND HEATING
OF GLASS BY DIFFERENTIAL SCANNING CALORIMETRY. Chemical &
Pharmaceutical Bulletin, 1991. 39(8): p. 2087-2090.
29. Yu, L., Amorphous pharmaceutical solids: preparation, characterization and
stabilization. Advanced Drug Delivery Reviews, 2001. 48(1): p. 27-42.
30. Coffin, D.R., M.L. Fishman, and T.V. Ly, Thermomechanical properties of
blends of pectin and poly(vinyl alcohol). Journal of Applied Polymer Science,
1996. 61(1): p. 71-79.
31. Lai, Y.C., P.H. Sung, and J.T. Chien, Evaluation of compatibility of rice starch
and pectins by glass transition and sub-T-g endotherms and the effect of
compatibility on gel viscosity and water loss. Cereal Chemistry, 2000. 77(5): p.
544-550.
32. Iijima, M., et al., Phase transition of pectin with sorbed water. Carbohydrate
Polymers, 2000. 41(1): p. 101-106.
33. Hancock, B.C. and G. Zografi, THE RELATIONSHIP BETWEEN THE GLASS-
TRANSITION TEMPERATURE AND THE WATER-CONTENT OF
AMORPHOUS PHARMACEUTICAL SOLIDS. Pharmaceutical Research, 1994.
11(4): p. 471-477.
34. Van den Mooter, G., et al., Physical stabilisation of amorphous ketoconazole in
solid dispersions with polyvinylpyrrolidone K25. European Journal of
Pharmaceutical Sciences, 2001. 12(3): p. 261-269.
35. Hancock, B.C., S.L. Shamblin, and G. Zografi, MOLECULAR MOBILITY OF
AMORPHOUS PHARMACEUTICAL SOLIDS BELOW THEIR GLASS-
TRANSITION TEMPERATURES. Pharmaceutical Research, 1995. 12(6): p. 799-
806.
36. Konno, H. and L.S. Taylor, Ability of different polymers to inhibit the
crystallization of amorphous felodipine in the presence of moisture.
Pharmaceutical Research, 2008. 25(4): p. 969-978

89
CHAPTER 3. EFFECTS OF POLYMER RATIOS AND TYPES IN THE
FORMATION OF L-ASCORBIC ACID – POLYMER INTERACTION IN
DETERMINING THE PHYSICAL STABILITY OF AMORPHOUS SOLID
DISPERSION
3.1 Abstract
Amorphous solid dispersions of L-ascorbic acid (VitC) and polymers (pectins
with two different degrees of esterification (%DE) and PVP) were formed and
experiments were designed to understand the specific interactions between the
components that lead stable VitC amorphous solid dispersions. Solid dispersions with 0-
100% polymer ratios (in 10% increments) were formed using a freeze drying process and
analyzed using X-ray powder diffraction (XRPD) and Fourier Transform infrared
spectroscopy (FTIR) to determine the crystallinity and the VitC-polymer hydrogen bond
interaction formation. Pectin with lower %DE was found to have better VitC
crystallization inhibitor properties than pectin with higher DE. The better crystallization
inhibitor properties of dispersions formed with low %DE pectin (CT) was supported by
the formation of a stronger VitC-polymer interaction (evident in FTIR spectra) and the
lower concentration of pectin required to prevent crystalline VitC-VitC interactions.
Stronger VitC – PVP interactions were formed than VitC-pectin interactions, based on
shifts in the IR spectra, although a higher PVP concentration was required to form VitC
amorphous solid dispersions
3.2 Introduction
The physical alternation of crystalline solids to amorphous solids in attempt to
increase the bioavailability is of great interest [1-4]. However, the enhancement of
solubility and bioavailability was negated as recrystallization of the less

90
thermodynamically stable amorphous solid occurred. The formation of solid dispersion
with polymer was shown to increase the physical stability of amorphous solid [4-6].
Various studies have been done to understand the specific polymers properties that
allow the formation of a stable amorphous solid dispersions. Polymer with high glass
transition temperature (Tg) was often used to increase the Tg of the amorphous solid
dispersion. The addition of material with higher Tg, such as polymer, will increase the Tg
of the binary mixture resulting in more stable dispersion [7, 8]. However, the addition of
a small amount of polymer to an amorphous solid dispersion has the potential to create a
substantial excess free volume which would not increase the Tg of the binary system as
high as theoretically predicted [4]. Moreover, the correlation between the anti-
plasticization effect of polymer and crystallization inhibition activity of drug compounds
were not observed in some drug-polymer dispersion. Instead, the stability of amorphous
solid dispersion were fond to be more likely due to the ability of polymer to form
hydrogen bond with the target compound [9, 10]. Similar observation was found in
preceding study (Chapter 1) where the crystallization inhibitor properties of L-ascorbic
acid (VitC) were found to be most influenced by the ability of VitC to interact with the
polymer rather than glass transition temperature (Tg). The addition of moisture to the
dispersion played an important effect in the formation of hydrogen bond, especially when
the dispersion was formed with highly hygroscopic polymer such as PVP.
Studies have shown that molecular interactions between the target molecule and
polymer played an essential role in inhibiting crystallization [5, 6, 9-11]. Polymers can
retard crystallization by forming specific interaction, such as hydrogen bond interactions,
with the target molecule. The ability of polymer to inhibit the crystallization of
amorphous compound depends on the properties of both the target compound and the
polymer. Acidic polymer, such as polystyrine sulfonic acid (PSSA) and polyacrylic acid
(PAA) were shown to have better crystallization inhibitor propertiy for basic compounds,
such us compounds with amide group. While,less acidic polymers, such as
hydroxypropylmethyl cellulose acetate succinate (HPMCAS), were found to have better
crystallization inhibitor properties for acidic target compounds [5]. However, the specific
functional groups that could form strong hydrogen interactions between a target molecule

91
and a polymer as well as the relationship between the different functional groups in the
system in the formation of strong hydrogen bond have not been clearly identified yet.
The formation of solid dispersion with various VitC-polymer ratios could provide
further information on the types and properties of polymer that resulted in the formation
of the strongest specific interactions between VitC and polymer that leads to the
formation of stable dispersions. The types of polymer have been shown to have different
crystallization inhibition properties for a specific crystalline solid [5].The polymers that
were able to form VitC amorphous solid dispersion based on preceding study (Chapter 1)
with significantly different hydrogen bonding capability were used in this study.
3.3 Objectives
This study was aimed to further understand the effect of functional groups in
polymer in the formation of hydrogen bonding VitC. The minimum amount of different
types of polymers to inhibit the crystallization of VitC was also explored. The polymers
used in this study were two types of pectin with different degree of esterification (%DE)
and PVP. The effects of %DE in the formation of VitC-pectin hydrogen bond interaction,
that could not be identified with just 50:50 VitC:polymer ratio (Chapter 2), were further
explored. PVP was used due to its contrasting hydrogen bond formation capability and a
simpler monomer structure.
3.4 Experimental Design
Compound Polymer Ratios Meth
od
Relative
Humiditi
es (%)
Temp
(°C)
Time
Analysis
Ascorbic
acid
Pectin from
citrus peel
Pectin,
esterified
from citrus
fruit
Polyvinyl-
pyrrolidone
0-100%
Polymer
(w/w)
increment
of 10%
0.22g
solid/ml
water
Ly
ophili
zati
on
0
23
54
75
22
40
50 days
Analysis
done
weekly
X-Ray
diffraction
Fourier
transform
infrared
spectroscopy

92
3.5 Materials and Methods
3.5.1 Materials
Ascorbic acid and polymers were obtained from Sigma – Aldrich Inc. (St. Louis, MO).
The polymers used were pectin from citrus peel (CT, DE=~61%), esterified pectin from
citrus (EST, DE>=85%), and polyvinylpyrrolidone (PVP, 40000MW). Salts were used to
achieve specific %RHs in desiccators for the storage study. Drierite (0%RH) was
obtained from W.A. Hammond Drierite Company, LTD (Xenia, OH). Potassium acetate
(CH3CO2K, 23%RH at 25°C) was obtained from Acros Organic (NJ). Magnesium sulfate
(Mg2SO4, 54%RH at 25°C) and sodium chloride (NaCl, 75%RH at 25°C) were obtained
from Sigma – Aldrich Inc. (St. Louis, MO). The sample types studied were: initial freeze
dried VitC (FD VitC), freeze dried individual polymers, and freeze dried solid
dispersions of VitC and polymers.
3.5.2 Solid dispersion formation
Freeze dried ascorbic acid and freeze dried polymers were formed by dissolving
approximately 0.1g of each compound with 9ml of water in 15ml centrifuge tubes. The
solid dispersions were formed with VitC and different type of polymers at different
weight ratio from 0% to 100% polymers, in 10% polymer increments. Approximately
0.1g of total solid consisted of each VitC:polymer ratios (ie. for 10:90 VitC:polymer,
0.01g of VitC and 0.09g of polymer) was dissolved with water in 15ml centrifuge
tube.The solution was mixed thoroughly to ensure that the polymer was fully dissolved.
The solution was then frozen at -20oC for at least 24 hours prior to freeze drying. Freeze
drying was performed using a VirTis Genesis 25 ES (VirTis, Gardiner, NY) for at least
90 hours to ensure that water was completely removed from the sample. The sample were
then quickly transferred to 20 ml glass vial to be stored at various temperatures
and %RHs or analyzed for day 0 data collection.

93
3.5.3 Storage treatment
The solid dispersions were stored at room temperature (22±3oC) and 40
oC at
various %RH: 0, 23, 54 and 75%RH. Water jacketed incubator (Forma Scientific, Inc.,
Marietta, OH) was used to achieve 40 oC incubation temperature. Samples were analyzed
periodically throughout 50 days to assess crystallinity.
3.5.4 X-ray powdered diffraction (XRPD)
Immidiately after freeze drying, the samples were analyzed using a Shimadzu LabX
XRD-6000 (Shimadzu Corporation, Kyoto, Japan) equipped with a Cu-Kα source set in
Bragg-Brentano geometry between 5o and 35
o 2θ angle at 4
o/min with a 0.04
o step size. A
silicon standard was used to calibrate the equipment prior to each analysis. Samples were
packed into the well of the aluminum sample holder and surface of the powder was
smoothen with glass slide. Samples were also monitored weekly throughout 50 days of
storage using XRPD to assess when changes in crystallinity occurred, if any.
3.5.5 Fourier transform infrared spectroscopy (FTIR)
Spectra were obtained using a Thermo-Nicolet Nexus 670 FTIR ESP (Thermo Scientific,
Madison, WI) equipped with a Spectra Tech Avatar Diffuse Resistance accessory. The
scan range was set from 4000 to 400cm-1
and 128 scans were recorded. Approximately
0.05g of samples was dispersed in 0.5g of Thermo Spectra Tech FTIR grade potassium
bromide (KBr). The samples and KBr were mixed using digital Wig-L-Bug®
grinder/mixer (Sigma – Aldrich Inc., St. Louis, MO) to ensure proper mixing. The
specific spectral regions of interest were the hydroxyl group stretching (3800 – 3000 cm-1
)
and the carbonyl group stretching (1900 - 1500 cm-1
) wavenumber regions.

94
3.6 Results and discussions
3.6.1 Crystallization tendency of ascorbic acid solid dispersions formed with different
polymer types and ratios
Immediately after freeze drying, dispersions formed with 10% CT (w/w) were
amorphous while dispersions formed with 10% EST were crystalline (Fig 3.1a,b).
Therefore, more EST was required the form VitC amorphous solid dispersion. When the
different ratios of dispersions were stored at different temperatures and %RHs, the
dispersions formed with CT were observed to be more physically stable than the
dispersions formed with EST (Table 3.1). For example, the dispersions formed with 60%
and 70% CT were amorphous when stored at 25C, 75%RH, but the dispersions formed
with the same ratios of EST were partially crystalline. The dispersions were considered to
be crystalline when apparent sharp peaks developed in the XRPD spectra and were
considered as partially crystalline when small peaks were found, specifically peaks that
were located in the same positions as the peaks developed in the crystalline samples (Fig
3.2). Although the physical stability differences between CT and EST dispersions were
only differentiated by partially crystalline in the dispersions with EST and amorphous in
the dispersion with CT in some storage temperature and %RH combinations, the
dispersions with CT were physically more stable than EST.
Higher amount of PVP were required to form VitC amorphous solid dispersions
types of pectin. Immediately after freeze drying, the dispersions formed with 10% and 20%
PVP were crystalline (Fig 3.1c)..The dispersions formed with 30% PVP and above were
amorphous and no crystallization events were observed when the samples were stored at
25oC, 0% and 23%RH. The dispersions formed with 30%PVP were found to be more
stable than the dispersions formed with 30%EST when stored at 23%RH (25oC). The
dispersions stored at 54% and 75%RH were converted into sticky masses after 1 week of
storage and were not analyzed with XRPD.

95
Fig 3.1. XRPD pattern of (a) VitC – CT dispersion, (b) VitC – EST dispersion, (c) VitC –
PVP dispersion at different ratio at day 0
(a)
(b)
(c)

96
Table 3.1. The physical structure (crystalline or amorphous) of VitC-pectin solid
dispersions formed with varying ratios of the ingredients.
Sample Temp %RH
PXRD crystalline (C) or amorphous (A) at following
polymer ratio
10 20 30 40 50 60 70 80 90
CT 25 0 A A A A A A A A A
23 C C A A A A A A A
54 C C C C C A A A A
75 C C C C C A A A A
EST 25 0 C A A A A A A A A
23 C C PC A A A A A A
54 C C C C C A A A A
75 C C C C C PC PC A A
CT 40 0 C A A A A A A A A
23 C C C A A A A A A
54 C C C C C A A A A
75 C C C C C A A A A
EST 40 0 C A A A A A A A A
23 C C C PC A A A A A
54 C C C C C A A A A
75 C C C C C PC PC A A
*All observed crystallization occurred in 1 week; amorphous samples were
monitored for 50 days
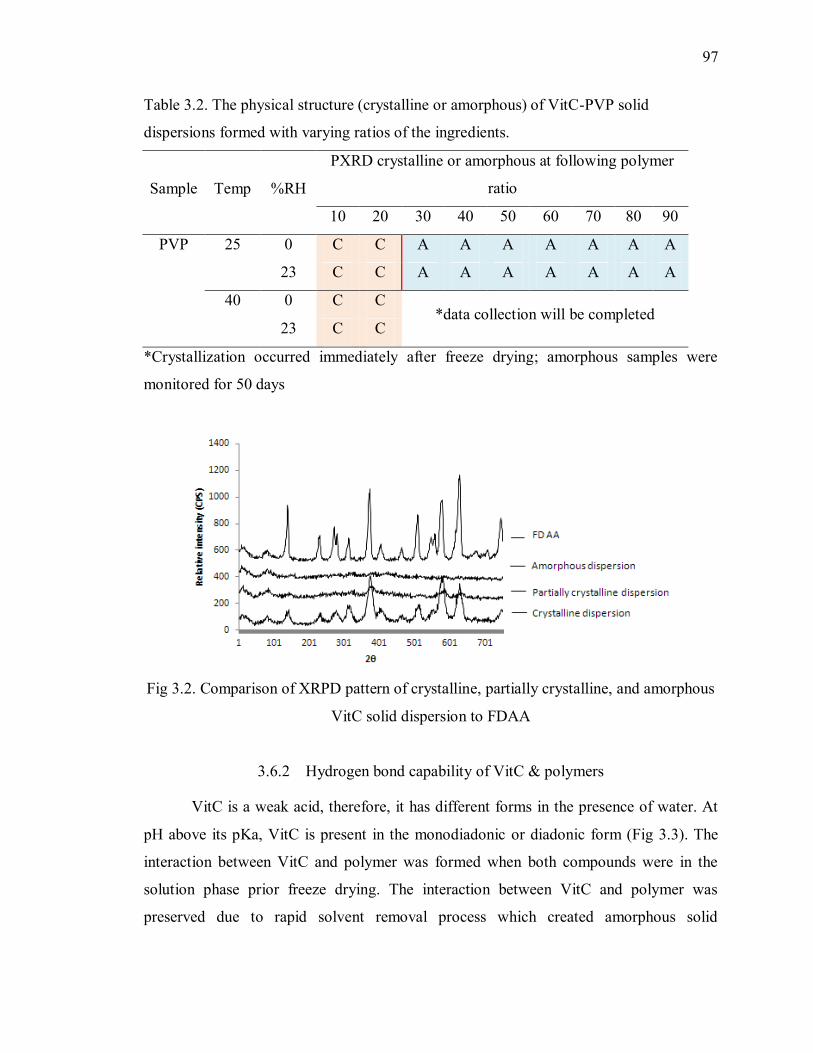
97
Table 3.2. The physical structure (crystalline or amorphous) of VitC-PVP solid
dispersions formed with varying ratios of the ingredients.
Sample Temp %RH
PXRD crystalline or amorphous at following polymer
ratio
10 20 30 40 50 60 70 80 90
PVP 25 0 C C A A A A A A A
23 C C A A A A A A A
40 0 C C *data collection will be completed
23 C C
*Crystallization occurred immediately after freeze drying; amorphous samples were
monitored for 50 days
Fig 3.2. Comparison of XRPD pattern of crystalline, partially crystalline, and amorphous
VitC solid dispersion to FDAA
3.6.2 Hydrogen bond capability of VitC & polymers
VitC is a weak acid, therefore, it has different forms in the presence of water. At
pH above its pKa, VitC is present in the monodiadonic or diadonic form (Fig 3.3). The
interaction between VitC and polymer was formed when both compounds were in the
solution phase prior freeze drying. The interaction between VitC and polymer was
preserved due to rapid solvent removal process which created amorphous solid

98
dispersions. Therefore, it is important to understand the form of VitC in solution prior
freeze drying to determine the ability of the VitC to interact with polymer. The pH of
dispersion solution prior freeze drying for CT, EST, and PVP were 3.17, 2.96, and 2.74,
respectively which is below VitC pKa1. Therefore, VitC was present as the neutral,
unprotonated form in solution prior freeze drying process.
Fig 3.3. Different form of VitC at various solution pH [12]
Although the unprotonated form of VitC has six hydrogen bond acceptors (HBA)
and four hydrogen bond donors (HBD), the ability of the HBD and HBA varies. Three
out of four hydroxyl groups acted as act as both donor and acceptor and one hydroxyl
group acts only as a donor [13]. Due to the presence of both HBA and HBD in VitC, it is
capable of forming intermolecular hydrogen bond with itself [13, 14] leading to a strong
crystalline structure with high melting point of 190oC. The hydroxyl region in VitC was
characterized with four distinct peaks arise from steric hindrance from the carbon rings
[12]. The hydroxyl peaks corresponded to the four hydroxyl groups in VitC [14]. The
four hydroxyl peaks of VitC and FD VitC were observed at the wavenumbers of 3215,
3315, 3410, and 3526 cm-1
(Fig 3.4), similar to other reported values [12, 15]. The
carbonyl peaks of VitC were observed at 1647 and 1751 cm-1
; whereas the carbonyl peak
for freeze dried VitC were observed at 1651 and 1753 cm-1
[12, 15]. The two peaks were
most likely correspond to the interaction of the carbonyl peaks with 1) the hydroxyl
group attached to the ring and 2) the hydroxyl group attached to the aliphatic
hydrocarbon. The hydroxyl group in VitC was associated as strong HBD and the
carbonyl and hydroxyl groups are a medium HBA based on pKBHX scale [16].
Manipulating the pH of the dispersion before freeze drying could affect the
interaction between VitC and polymer. As VitC was protonated in high pH solution, the
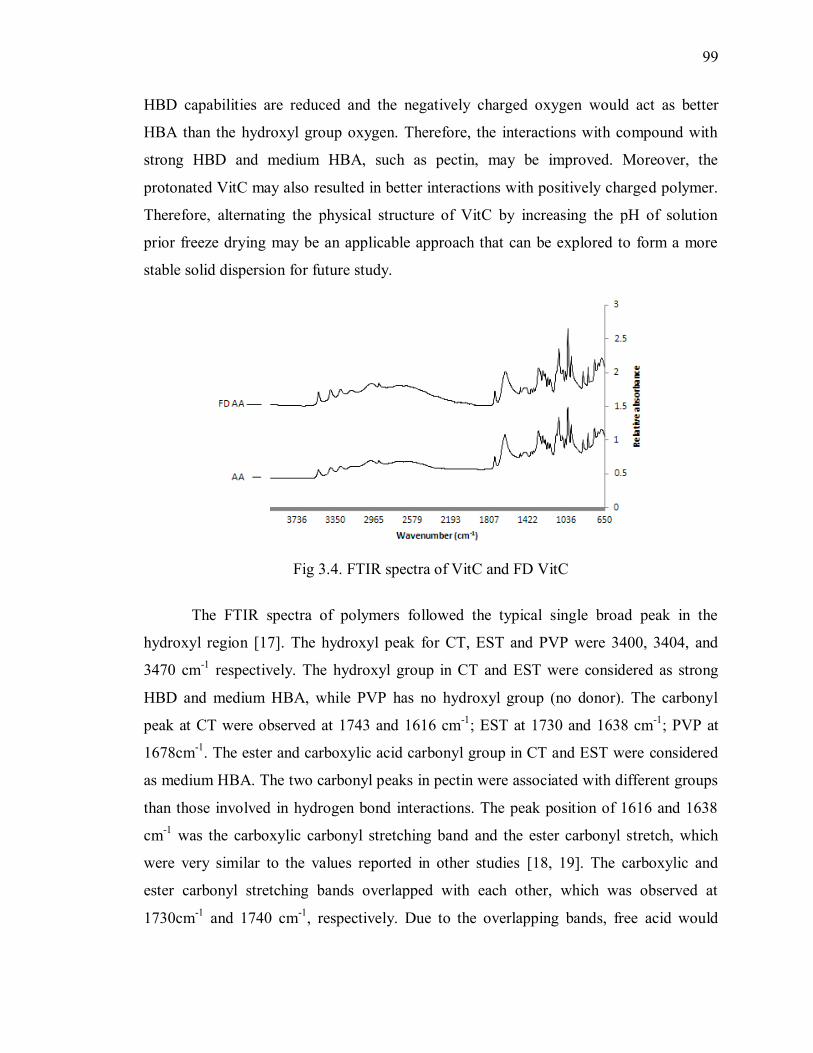
99
HBD capabilities are reduced and the negatively charged oxygen would act as better
HBA than the hydroxyl group oxygen. Therefore, the interactions with compound with
strong HBD and medium HBA, such as pectin, may be improved. Moreover, the
protonated VitC may also resulted in better interactions with positively charged polymer.
Therefore, alternating the physical structure of VitC by increasing the pH of solution
prior freeze drying may be an applicable approach that can be explored to form a more
stable solid dispersion for future study.
Fig 3.4. FTIR spectra of VitC and FD VitC
The FTIR spectra of polymers followed the typical single broad peak in the
hydroxyl region [17]. The hydroxyl peak for CT, EST and PVP were 3400, 3404, and
3470 cm-1
respectively. The hydroxyl group in CT and EST were considered as strong
HBD and medium HBA, while PVP has no hydroxyl group (no donor). The carbonyl
peak at CT were observed at 1743 and 1616 cm-1
; EST at 1730 and 1638 cm-1
; PVP at
1678cm-1
. The ester and carboxylic acid carbonyl group in CT and EST were considered
as medium HBA. The two carbonyl peaks in pectin were associated with different groups
than those involved in hydrogen bond interactions. The peak position of 1616 and 1638
cm-1
was the carboxylic carbonyl stretching band and the ester carbonyl stretch, which
were very similar to the values reported in other studies [18, 19]. The carboxylic and
ester carbonyl stretching bands overlapped with each other, which was observed at
1730cm-1
and 1740 cm-1
, respectively. Due to the overlapping bands, free acid would

100
need to be converted into ions to fully understand the different effects of the degrees of
esterfication on the interactions in the carboxyl region [19]. The carbonyl peak position at
1730 – 1743 cm-1
(Table 3) was the ionized carboxylate (COO-) stretching band.
Moreveor, the amide carbonyl of PVP was considered as strong HBA [16].
Based on the HBD and HBA strength, PVP should be able to form a stronger
interaction with VitC compared to CT and EST since PVP has no HBD to compete with
the HBD in VitC. Moreover, the VitC HBD would prefer to interact with the HBA in
PVP since PVP HBA was stronger than VitC HBA. In contrast, VitC, CT and EST have
strong HBD and medium HBA giving a possibility for the strongest HBD and HBA to
exist in the same compound (either VitC or pectin). Therefore, the formation of VitC-
VitC or pectin-pectin interaction may be preferred than VitC-pectin interaction.
Understanding the effects of different pectin DE may give a useful insight on the types of
pectin can better interact with VitC and the functional groups that can lead to a better
formation of hydrogen bond with VitC.
Although PVP did not have any hydroxyl groups, a peak was observed in the
hydroxyl region. This may be due to the presence of residual moisture sorb in the PVP.
PVP is a very hydroscopic compound, thus easily sorb the moisture from the environment
during sample preparation. Water interaction produced a broad and intense band in the
region of 3500cm-1
caused by OH stretching [20, 21] which was similar to the peak
observed in pure PVP. The hydrogen bond interaction between PVP and water also
greatly affect the peak position in carbonyl region. Increasing moisture content in PVP
led to carbonyl peak shifts to a lower wavenumber with respect to pure PVP due to the
presence of water – PVP interaction. The peak position of dry PVP was at 1680cm-1
and
it was decreased to 1652cm-1
when stored at 94%RH condition [21]. The carbonyl peak
of PVP in this study was observed at 1678cm-1
which was very close to the carbonyl peak
position of dry PVP. This indicates that only small amount of the moisture was sorb in
the PVP. Due to the strong peak from water - PVP interaction, the hydroxyl region was
not the best region to understand the interaction between VitC and polymer. In this study,
the samples were purged with nitrogen gas during analysis to minimize any moisture
101
sorbed during sample preparation. Great care will be taken when analyzing the hydroxyl
region in FTIR spectra.
3.6.3 Structural differences between solid dispersions and physical mixtures
The formation of VitC - polymer interactions was indicated by peak shifts and
peak shape alterations with respect to the pure compounds. When physical mixtures of
VitC and polymers were analyzed with FTIR, the hydroxyl and carbonyl region were
essentially the same with spectra of the pure VitC [Fig 3.5, 3.6, 3.7]. This indicated
absence of new interactions formation associated with the interaction between the VitC
and the polymer in the physical mixtures. Moreover, the same FTIR spectra obtained
from VitC and the physical mixtures indicated that the VitC hydroxyl and carbonyl group
vibration were stronger than the vibration of the same functional groups in the polymer.
Therefore, any interaction between pectin was overshadowed by the vibration from VitC-
VitC interaction.
Peak shift and peak shape alternation were observed in the VitC-polymers solid
dispersion. For example, the four peaks associated with crystalline VitC in the hydroxyl
region disappeared indicating that the VitC-VitC interaction was disrupted when the
dispersion was formed. It can be argued that the lost of the VitC crystalline peaks was
due to the interaction between VitC and water absorbed by the polymer. However, VitC-
VitC interaction vibration was observed to be stronger than any vibration caused by the
presence of water. When physical mixtures were equlibrated at 75%RH, 25oC, the four
peaks were still present although the system absorbed significant amount of moisture due
to the presence of polymer [Fig 3.8]. Therefore, the lost of the four peaks was due to the
presence of polymer in the dispersion inhibiting VitC-VitC interaction. Different FTIR
spectra were obtained in the solid dispersion formed with different types of polymers
which indicate that the ability of polymer to interact with VitC differed depending on
types of the polymers and the functional groups that were involved in hydrogen bond
interaction.
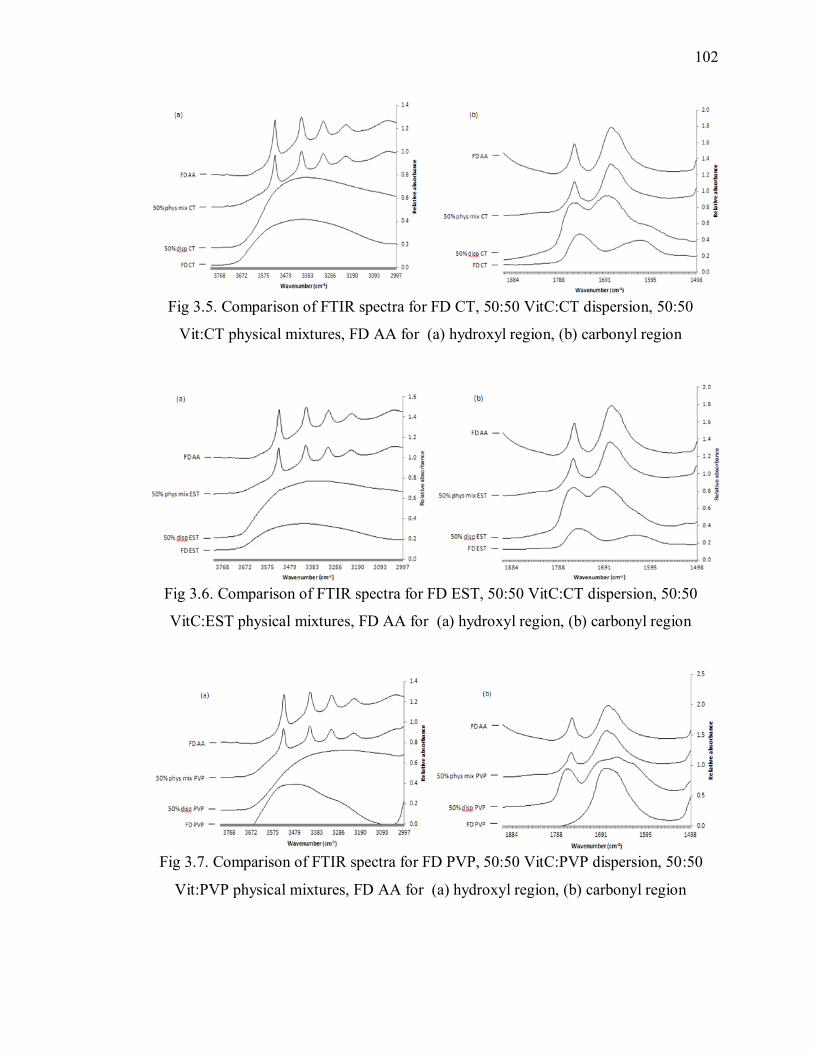
102
Fig 3.5. Comparison of FTIR spectra for FD CT, 50:50 VitC:CT dispersion, 50:50
Vit:CT physical mixtures, FD AA for (a) hydroxyl region, (b) carbonyl region
Fig 3.6. Comparison of FTIR spectra for FD EST, 50:50 VitC:CT dispersion, 50:50
VitC:EST physical mixtures, FD AA for (a) hydroxyl region, (b) carbonyl region
Fig 3.7. Comparison of FTIR spectra for FD PVP, 50:50 VitC:PVP dispersion, 50:50
Vit:PVP physical mixtures, FD AA for (a) hydroxyl region, (b) carbonyl region
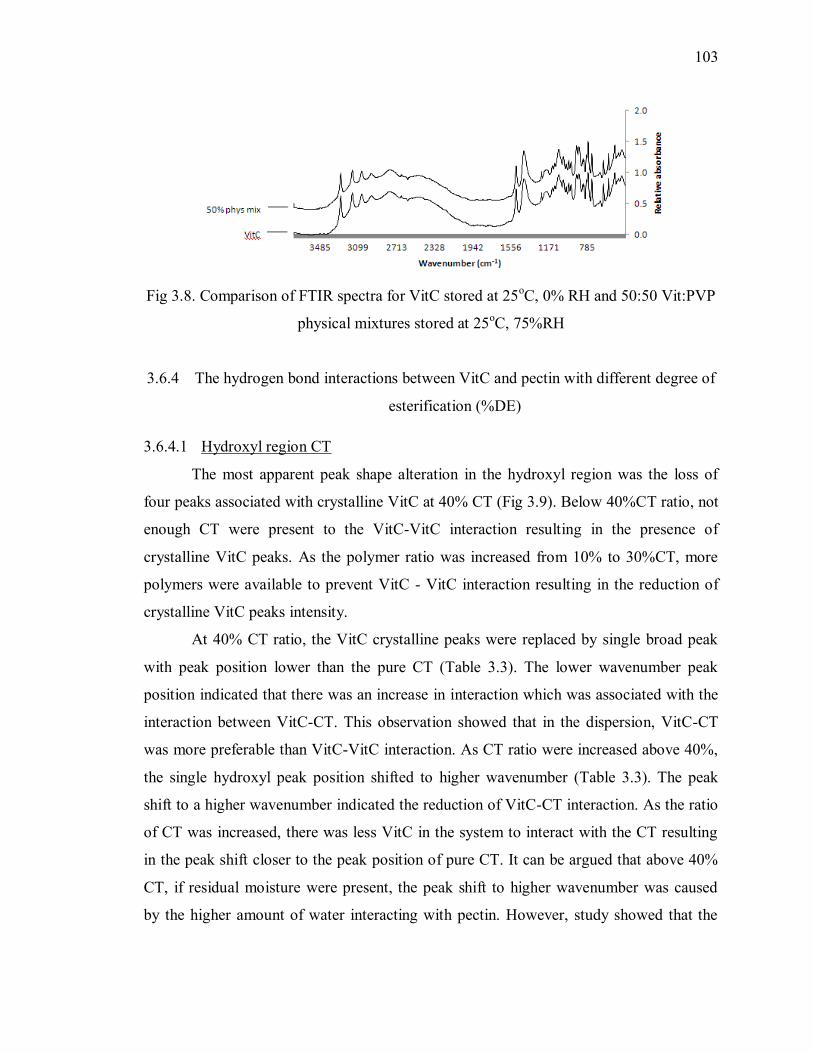
103
Fig 3.8. Comparison of FTIR spectra for VitC stored at 25oC, 0% RH and 50:50 Vit:PVP
physical mixtures stored at 25oC, 75%RH
3.6.4 The hydrogen bond interactions between VitC and pectin with different degree of
esterification (%DE)
3.6.4.1 Hydroxyl region CT
The most apparent peak shape alteration in the hydroxyl region was the loss of
four peaks associated with crystalline VitC at 40% CT (Fig 3.9). Below 40%CT ratio, not
enough CT were present to the VitC-VitC interaction resulting in the presence of
crystalline VitC peaks. As the polymer ratio was increased from 10% to 30%CT, more
polymers were available to prevent VitC - VitC interaction resulting in the reduction of
crystalline VitC peaks intensity.
At 40% CT ratio, the VitC crystalline peaks were replaced by single broad peak
with peak position lower than the pure CT (Table 3.3). The lower wavenumber peak
position indicated that there was an increase in interaction which was associated with the
interaction between VitC-CT. This observation showed that in the dispersion, VitC-CT
was more preferable than VitC-VitC interaction. As CT ratio were increased above 40%,
the single hydroxyl peak position shifted to higher wavenumber (Table 3.3). The peak
shift to a higher wavenumber indicated the reduction of VitC-CT interaction. As the ratio
of CT was increased, there was less VitC in the system to interact with the CT resulting
in the peak shift closer to the peak position of pure CT. It can be argued that above 40%
CT, if residual moisture were present, the peak shift to higher wavenumber was caused
by the higher amount of water interacting with pectin. However, study showed that the

104
peak position measured by FT-Raman shifted to lower a wavenumber with increasing
amount of moisture absorbed by a polymer, [21]. Therefore, the peak shift to a higher
wavenumber from 40%CT to 90%CT was the result of VitC-CT interaction lost instead
of CT-water interaction.
As the CT ratio was further increased to 80 & 90% CT, the peak shifted to a
higher wavenumber than the pure polymer. Since the amount of VitC was small, limited
VitC-polymer interactions were formed in the dispersion. Moreover, the presence of
small amount of VitC limits the ability of polymer-polymer interaction that would happen
in the system with just pure polymer. Therefore, there was less interaction in the
dispersion formed with low VitC ratio compared to the pure CT.
The interaction between VitC-CT was clearly observed in the hydroxyl region
from the loss of four peaks associated with crystalline VitC (40-90%CT), the peak shift
to a lower wavenumber relative to pure CT (40-70%CT), and the reduction of polymer-
polymer interaction due to the presence of VitC (80-90%CT). The minimum ratio of
polymer that can fully inhibit the VitC-VitC interaction (40% CT) in the hydroxyl region
was associated with the most efficient polymer ratio because the largest peak shift to a
lower wavenumber was also observed at that polymer ratio.

105
Fig 3.9. FTIR spectra of the hydroxyl region of molecular dispersions with CT. The
percentages refer to the amount of EST in the dispersion
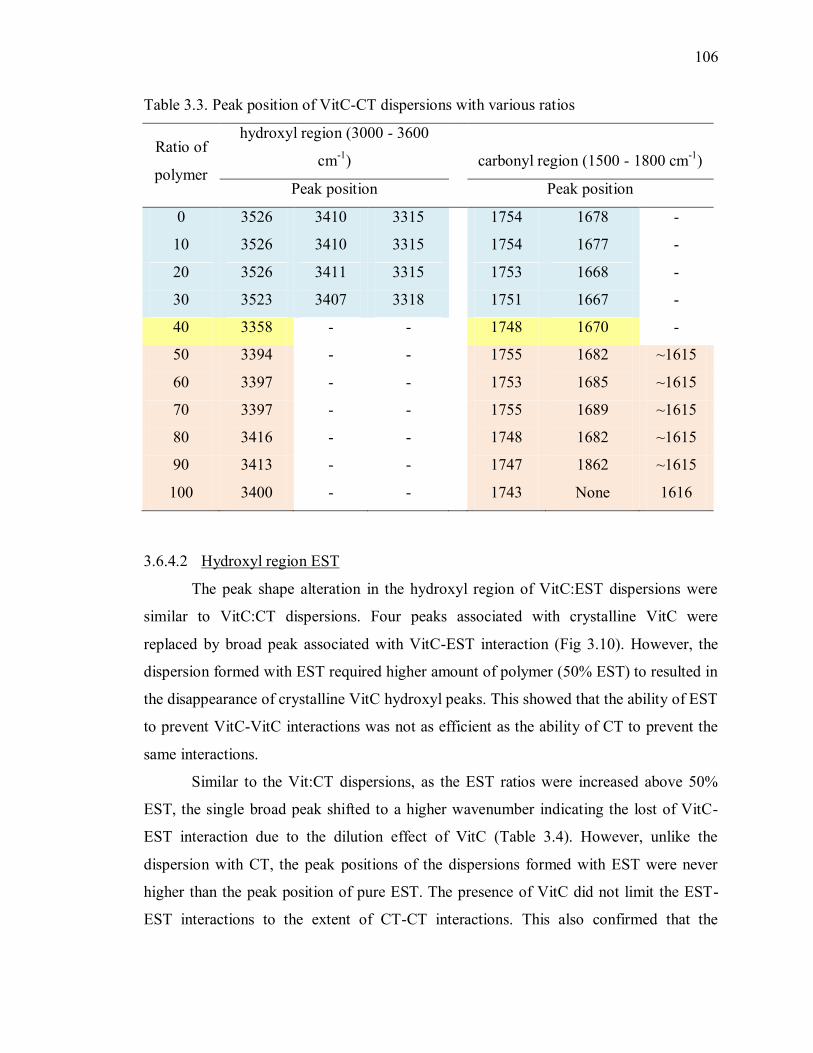
106
Table 3.3. Peak position of VitC-CT dispersions with various ratios
Ratio of
polymer
hydroxyl region (3000 - 3600
cm-1
) carbonyl region (1500 - 1800 cm-1
)
Peak position Peak position
0 3526 3410 3315
1754 1678 -
10 3526 3410 3315
1754 1677 -
20 3526 3411 3315
1753 1668 -
30 3523 3407 3318
1751 1667 -
40 3358 - -
1748 1670 -
50 3394 - -
1755 1682 ~1615
60 3397 - -
1753 1685 ~1615
70 3397 - -
1755 1689 ~1615
80 3416 - -
1748 1682 ~1615
90 3413 - -
1747 1862 ~1615
100 3400 - - 1743 None 1616
3.6.4.2 Hydroxyl region EST
The peak shape alteration in the hydroxyl region of VitC:EST dispersions were
similar to VitC:CT dispersions. Four peaks associated with crystalline VitC were
replaced by broad peak associated with VitC-EST interaction (Fig 3.10). However, the
dispersion formed with EST required higher amount of polymer (50% EST) to resulted in
the disappearance of crystalline VitC hydroxyl peaks. This showed that the ability of EST
to prevent VitC-VitC interactions was not as efficient as the ability of CT to prevent the
same interactions.
Similar to the Vit:CT dispersions, as the EST ratios were increased above 50%
EST, the single broad peak shifted to a higher wavenumber indicating the lost of VitC-
EST interaction due to the dilution effect of VitC (Table 3.4). However, unlike the
dispersion with CT, the peak positions of the dispersions formed with EST were never
higher than the peak position of pure EST. The presence of VitC did not limit the EST-
EST interactions to the extent of CT-CT interactions. This also confirmed that the
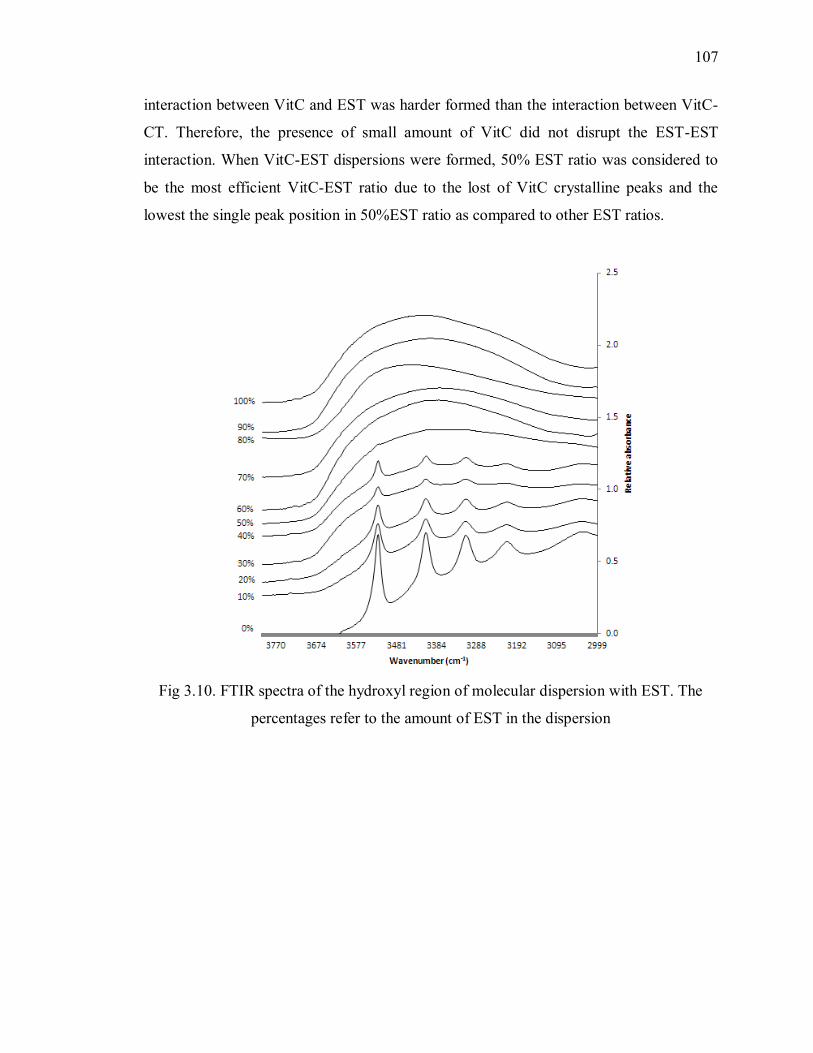
107
interaction between VitC and EST was harder formed than the interaction between VitC-
CT. Therefore, the presence of small amount of VitC did not disrupt the EST-EST
interaction. When VitC-EST dispersions were formed, 50% EST ratio was considered to
be the most efficient VitC-EST ratio due to the lost of VitC crystalline peaks and the
lowest the single peak position in 50%EST ratio as compared to other EST ratios.
Fig 3.10. FTIR spectra of the hydroxyl region of molecular dispersion with EST. The
percentages refer to the amount of EST in the dispersion

108
Table 3.4. Peak position of VitC-EST dispersions with various ratios
Ratio of
polymer
hydroxyl region (3000 - 3600
cm-1
) carbonyl region (1500 - 1800 cm-1
)
Peak position Peak position
0 3526 3410 3315 1754 1678 -
10 3526 3411 3315
1754 1674 -
20 3526 3410 3315
1753 1675 -
30 3526 3410 3315
1754 1677 -
40 3525 3408 3315
1754 1685 -
50 3319 - -
1755 1686 -
60 3340 - -
1751 1686 ~1625
70 4478 - -
1751 1899 ~1625
80 3439 - -
1751 1694 ~1625
90 3402 - -
1747 1686 ~1625
100 3415 - - 1743 None 1624
3.6.4.3 Carbonyl region of CT
VitC has two peaks in the carbonyl region located at the wavenumber of 1754 and
1678cm-1
(Fig 3.11). The two carbonyl peaks of CT were observed at 1743 and 1616cm-1
.
As solid dispersion was formed with increasing amount of CT, there were two peak
position shifts and one new peak development in the carbonyl region.
The first peak shift was observed at the wavenumber between 1728 and 1786 cm-1
.
The peak position of VitC in that region was at 1754 cm-1
. The formation of solid
dispersion with 20 – 40% CT led to peak shift to lower wavenumber with the lowest peak
position observed at the 40% CT dispersion (Table 3). The peak shift can be associated
with the increase interaction between VitC carbonyl group and the HBD of pectin. The
increased in VitC-polymer interaction in the carbonyl region was consistent with the
decrease of crystalline VitC peaks intensity in the hydroxyl region until complete lost of
crystalline VitC peaks was observed in the dispersion formed with 40%CT. This further
confirmed that the lost of VitC-VitC interaction observed in the hydroxyl region was

109
replaced by the formation of VitC-CT interaction observed in the carbonyl region. Both
the peak shifts in carbonyl and hydroxyl region indicated that the strongest interaction
between VitC and CT was formed with 40% CT. When the polymer ratio was increased
from 40% to 50% CT, the VitC-CT peak shifted to higher wavenumber. As observed in
the hydroxyl region, the presence of VitC inhibited the CT-CT interaction. At the ratio of
50% CT, VitC content was not enough to form strong interaction with CT, but high
enough to effectively prevent CT-CT interaction. Therefore, although the peak shape in
the carbonyl region was altered to become more similar to the pure CT, the peak position
was observed at higher wavenumber than pure CT. As polymer ratio was further
increased above 50% CT, the VitC were further diluted allowing more CT-CT interaction
showed by the peak shifts to lower wavenumber closer to the peak position of pure CT.
The second peak shift in the carbonyl region was observed between the wavenumber of
1640 and 1728 cm-1
. Between this wavenumber, VitC carbonyl peak was observed at
1678 cm-1
. Similar to the carbonyl region previously discussed, peak shift to a lower
wavenumber was also observed as dispersion were formed with 20 – 40%CT. The
observation further confirmed the presence of VitC-CT interaction as dispersion was
formed. Peak shift to higher wavenumber were also observed when 50%CT were used in
the dispersion. Again, this confirmed the loss of VitC-CT interaction as VitC was further
diluted in the dispersion.
Peak development was observed in carbonyl region between the wavenumber of
1610 - 1620 cm-1
. The peak was associated with the interaction of CT carbonyl peak
since the peak position was similar to the peak position of pure CT. The shoulder was
first observed in the dispersion with 50%CT and continued to grow more distinct as the
polymer concentration increased.

110
Fig 3.11. FTIR spectra of the carbonyl region of molecular dipersion with CT. The
percentages refer to the amount of CT in the dispersion
3.6.4.4 Carbonyl region of EST
Limited interaction between VitC and EST were observed in the carbonyl region
(Fig 3.12). At the wavenumber between 1728 and 1786 cm-1
, no peak shift were observed
in the VitC peak at 1754 cm-1
in the dispersion formed with 10 – 60% EST (Table 4).
Therefore, between 10 - 60% EST, there was limited VitC-EST interaction or VitC –
VitC interaction disruption. As the EST concentration increased above 60%EST, the
interaction between EST-EST started to overshadowed VitC-VitC interaction resulting in
the peak shifted to lower wavenumber closer to the pure EST.
At the carbonyl region between 1728 - 1640 cm-1
, a little peak shift to lower
wavenumber were observed in the 10 and 20%EST dispersion indicating that there was
some VitC-EST interaction formation although the interaction was weak. The interaction
between VitC-EST disappeared when the polymer concentration was increased,
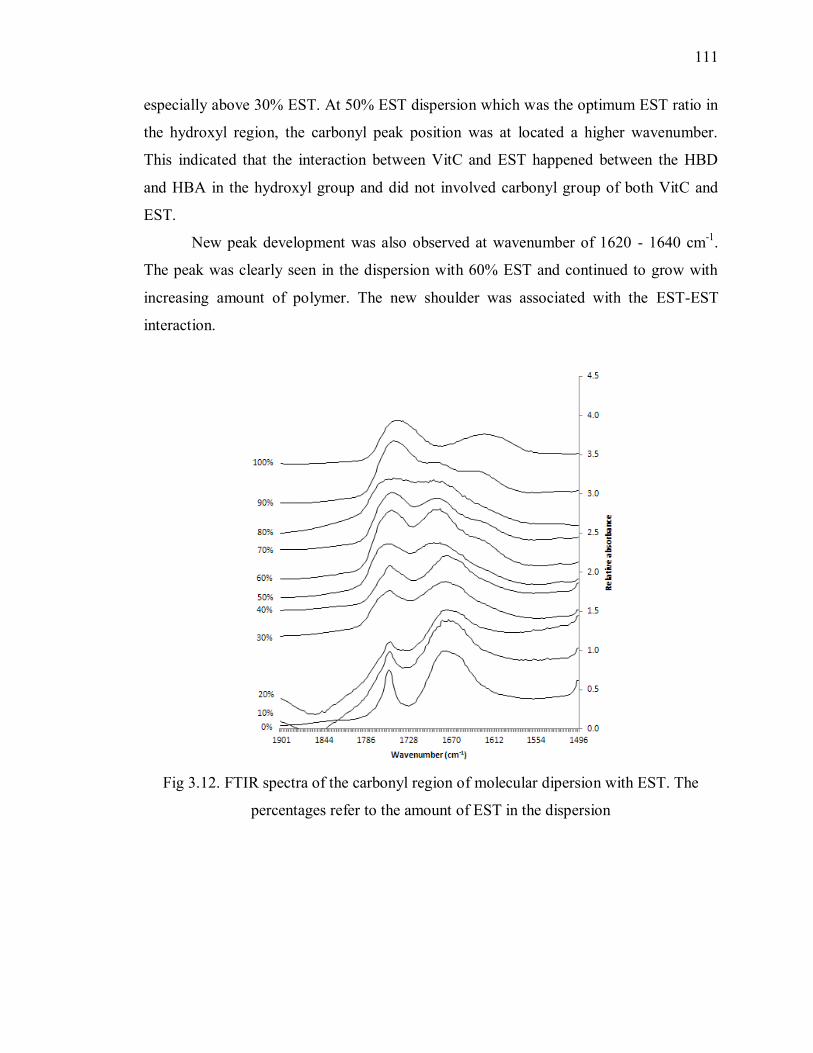
111
especially above 30% EST. At 50% EST dispersion which was the optimum EST ratio in
the hydroxyl region, the carbonyl peak position was at located a higher wavenumber.
This indicated that the interaction between VitC and EST happened between the HBD
and HBA in the hydroxyl group and did not involved carbonyl group of both VitC and
EST.
New peak development was also observed at wavenumber of 1620 - 1640 cm-1
.
The peak was clearly seen in the dispersion with 60% EST and continued to grow with
increasing amount of polymer. The new shoulder was associated with the EST-EST
interaction.
Fig 3.12. FTIR spectra of the carbonyl region of molecular dipersion with EST. The
percentages refer to the amount of EST in the dispersion

112
3.6.4.5 The effects of different %DE of pectin in interacting with VitC
In its crystalline structure, VitC molecules are interacting strongly with each other
to form a geometrically ordered structure with limited mobility. When the VitC-VitC
interaction was prevented, that ordered arrangement was disrupted leading to the
formation of amorphous VitC. Therefore, polymers that can prevent the formation of
VitC – VitC interaction were deemed to have better crystallization inhibitor properties for
VitC. Based on the hydroxyl region peak alternation, CT has a better capability to disrupt
VitC-VitC interaction compared to EST as lower ratio of CT (40%) was required to cause
the disappearance of crystalline VitC peaks compared to EST (50%).
Moreover, strong interactions between VitC and polymers were important to
maintain the disruption of VitC-VitC interaction during storage. The strength of
interaction formed between VitC-polymers corresponds to the highest peak shift to a
lower wavenumber. At the most efficient polymer ratio, EST (50% polymer) have a
larger peak shift to a lower wavenumber in the hydroxyl region than CT (40% polymer)
which was 96 and 42cm-1
, for CT and EST respectively. The most efficient ratio
resembles the minimum polymer concentration that was able to fully prevent VitC-VitC
interactions (lost of four crystalline peaks) and the polymer ratio in which the strongest
VitC-polymer interactions were formed (peak position at the lowest wavenumber
compared to other polymer ratio). The larger peak position shift to a lower wavenumber
in the dispersion formed with EST indicated that although EST was less efficient in
disrupting VitC-VitC interaction and forming the initial VitC-EST interaction, stronger
hydrogen bond interaction was produced in the hydroxyl region once the interaction were
formed. When comparing the two types of dispersion with the same polymer ratio, for
example 50% polymer ratio (as used in Chapter 2), the dispersion formed with EST also
had larger peak shifts to a lower wavenumber than the dispersion formed with CT which
is 96 and 6cm-1
, for CT and EST respectively. This further confirmed the stronger
hydrogen bond interaction formation in the hydroxyl region in the dispersion formed with
EST compared to with CT.
However, stronger VitC-CT interactions were formed in the dispersion with CT
compared to the dispersion with EST. Peak shifts to a lower wavenumber were observed

113
in the two carbonyl peaks of VitC when dispersion were formed with 10 – 40%CT. The
peak shift indicated the presence of VitC – CT interaction. Limited VitC-EST interaction
was formed in the carbonyl region of EST dispersion indicated by the no peak shifts of
VitC carbonyl peak.
Based on the hydroxyl and carbonyl peak shifts, the VitC-CT interactions were
formed in both hydroxyl and carbonyl region, while limited interaction was formed
between VitC and EST in the hydroxyl group. This provided an explanation on why the
dispersion with CT could better prevent VitC-VitC interaction although it had a weaker
interaction with VitC in the hydroxyl region. Therefore, it was essential to understand the
ability of all functional groups that can possibly be involved in the formation of hydrogen
bond interaction. If multiple functional groups can be involved in hydrogen bond,
exploring just one of functional groups may lead to incomplete or inaccurate
understanding on the ability of the compounds to form hydrogen bond interaction.
The differences between CT and EST was the degree of esterification (DE) of the
pectin where EST (>=85%) has higher DE than CT (~61%). Any differences between the
ability of CT and EST to interact with VitC were due to the different amount of
carboxylic acid and ester group in each types of pectin. It was hypothesized that polymers
with stronger HBD and weaker HBA than VitC, or vice versa, will have the best ability to
form VitC-polymer interaction. VitC has strong HBD and medium HBA.
CT has higher amount of carboxylic group attached to the sugar ring compared to
EST (Fig 3.13). Carboxyl acid hydroxyl group is strongly polarized by the adjacent
carbonyl group creating a highly positive hydroxyl hydrogen atom which acts as a strong
HBD. The hydrogen in the carboxylic acid hydroxyl group of CT competed with the
HBD of VitC resulting in a weaker VitC-CT interaction in hydroxyl compared to VitC-
EST hydroxyl interaction. However, the same hydrogen in the carboxylic acid hydroxyl
group was able to interact efficiently with the HBA (carbonyl group) of VitC. Therefore,
in the VitC-CT dispersion the stronger donor was present in the CT and the stronger
acceptor was in VitC resulting in a better ability for VitC to interact with CT. In contrast,
EST which has weaker HBD due to the less amount of carboxylic group, was not able to
efficiently interact with VitC. Although VitC-EST interaction was formed between the

114
hydroxyl group of VitC and EST, the absence of the interaction in the carbonyl group
leads to lower ability of EST to prevent VitC-VitC interaction and maintained a strong
overall VitC-EST interaction.
Fig 3.13. Monomer of pectin with (a)methylated carboxyl group (ester group),
(b)carboxylic acid group. High DE pectin contained higher amount of (a) monomer while
low DE pectin contained higher amount of (b).
Another possible explanation for the weaker VitC-EST interaction was due to
steric hindrance of the methyl group in EST. Methyl group attached to ester is larger, thus
occupied more space than hydrogen atom in carbonxyl acid group. The steric hindrance
could possibly reduce the ability of the pectin hydroxyl group attached to the ring in
forming interaction with VitC. However, based on the hydroxyl group result, EST formed
stronger interaction with the hydroxyl group in VitC indicating that steric hindrance
played a minimum role in decreasing the ability of EST to interact with VitC.
Caution had to be taken when comparing the dispersion with only one specific
ratio of VitC and polymer (eg. just 50% polymer concentrations as used in Chapter 2).
Partial data collection may lead to an inaccurate observation and data interpretation. For
example, if comparison were just made with 50% polymer concentration, dispersion with
EST could be assumed as the dispersion with stronger VitC-polymer interaction due to
higher peak shift to lower wavenumber in hydroxyl region (higher VitC-EST interaction
in hydroxyl region) and lower peak shift to higher wavenumber (less interaction lost in
carbonyl region was due to the stronger VitC-pectin interaction formation). However, in
the carbonyl region, the 50% polymer ratio was the ratio where the VitC-CT interaction
was significantly reduced due to the dilution effect of VitC and the ratio where the CT-
CT interaction most efficiently prevented by VitC. Therefore, larger peak shifts

115
magnitude to a higher wavenumber was observed in the dispersion formed with CT than
the dispersion formed with EST. While in the dispersion formed with pectin ratio below
50%, more VitC-CT interaction was observed in carbonyl region. Therefore, comparing
the interactions between various ratios of polymer was important to obtain a complete
understanding on the ability of a specific polymer to inhibit the interaction of VitC.
3.6.5 The hydrogen bond interaction between VitC and PVP
3.6.5.1 Hydroxyl region PVP
The hydroxyl peak position shift and peak shape alteration in the dispersions formed PVP
were similar to the dispersion formed with the pectin, particularly the dispersion formed
with CT. As polymer ratios were increased to 40% PVP, the four peaks associated with
crystalline VitC decreased in intensity until they disappeared in the dispersion formed
with 40% PVP (Fig 3.14). The interaction formed between VitC and PVP were the
stronger compared to other types of polymer indicated by the much lower peak position
wavenumber at 40% PVP (Table 3.5). As polymer ratio was increased above 40% PVP,
the peak shifted to higher wavenumber due to the dilution effect of VitC. Since PVP did
not have any hydroxyl group, the peak in the hydroxyl region was associated with
residual moisture interacting with PVP.
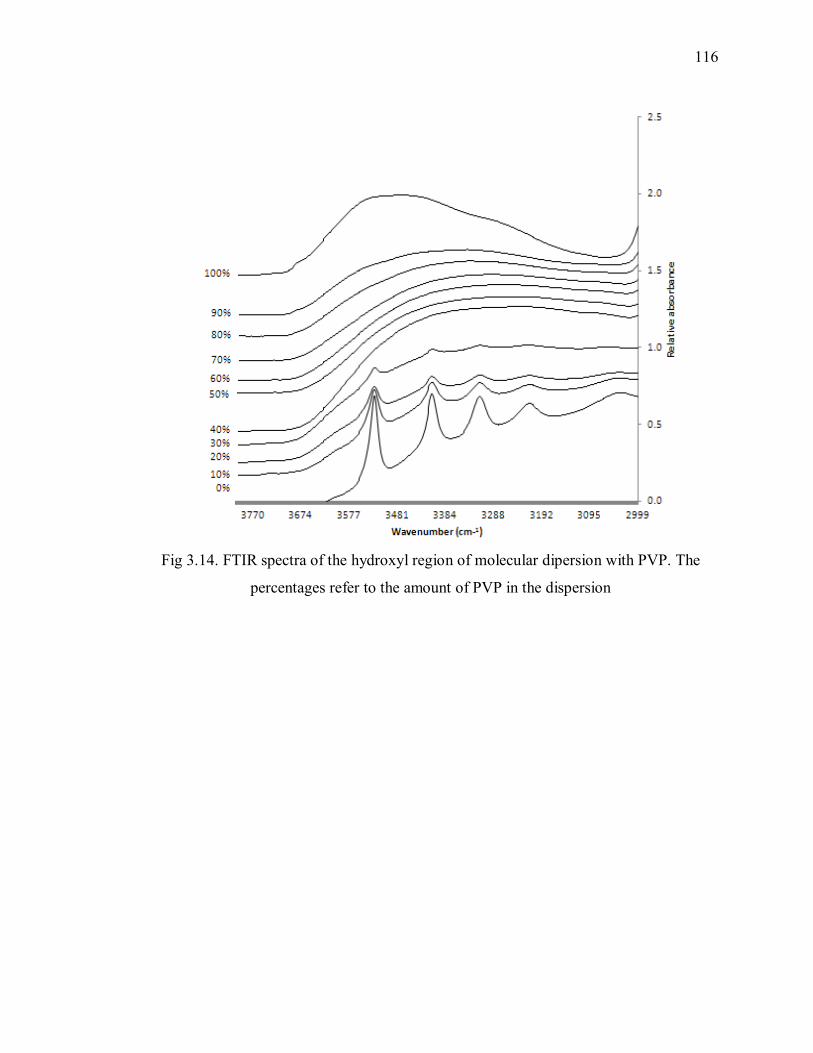
116
Fig 3.14. FTIR spectra of the hydroxyl region of molecular dipersion with PVP. The
percentages refer to the amount of PVP in the dispersion

117
Table 3. 5. Peak position of VitC-PVP dispersion with various ratios
Ratio of
polymer
hydroxyl region (3000 -
3600 cm-1
) carbonyl region (1500 - 1800 cm-1
)
Peak position Peak position
0 3526 3410 3315 1754 1678 - -
10 3526 3410 3315
1755 1674 - -
20 3526 3410 3314
1755 1672 - -
30 3525 3408 3314
1757 1677 - -
40 3237 - -
1759 1685 1654 ~1620
50 3238 - -
1762 1685 1655 ~1620
60 3277 - -
1764 - 1655 ~1620
70 3296 - -
1765 - 1659 ~1620
80 3335 - -
1765 - 1574 ~1620
90 3335 - -
1766 - 1677 -
100 3470 - - - - 1678 -
3.6.5.2 Carbonyl region of PVP
There are two possible functional groups that can act as a HBA in PVP: the
carbonyl group and the C-N groups. However, the C-N group in PVP was less favorable
in forming hydrogen bond interaction due to the steric constraints of the nitrogen in the
pyrolle ring. Any interactions in the C-N ring would be observed in at wavenumber of
1492cm-1
[22]. There was no interaction observed in the C-N region (Fig 3.15), while
interaction was observed in the carbonyl region (Fig 3.16). Similar observation was seen
in the indometachin-PVP interactions where indometachin interaction with PVP was
observed in the carbonyl region but not in the C-N region [11].
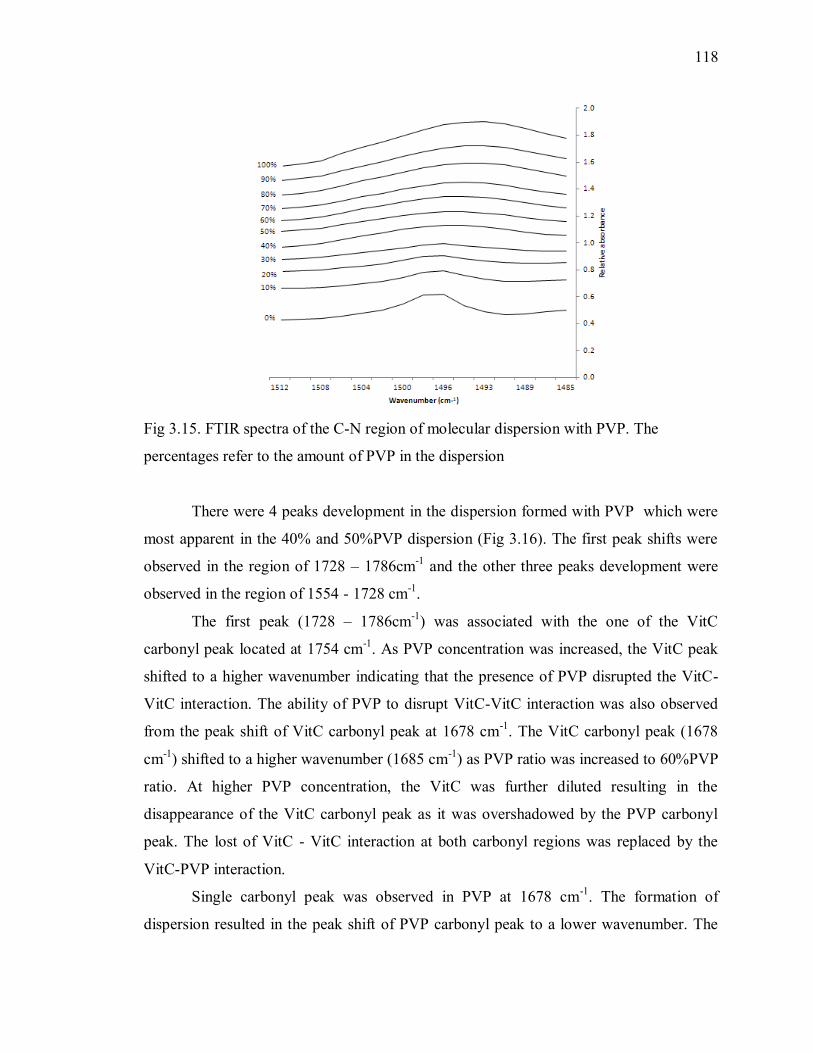
118
Fig 3.15. FTIR spectra of the C-N region of molecular dispersion with PVP. The
percentages refer to the amount of PVP in the dispersion
There were 4 peaks development in the dispersion formed with PVP which were
most apparent in the 40% and 50%PVP dispersion (Fig 3.16). The first peak shifts were
observed in the region of 1728 – 1786cm-1
and the other three peaks development were
observed in the region of 1554 - 1728 cm-1
.
The first peak (1728 – 1786cm-1
) was associated with the one of the VitC
carbonyl peak located at 1754 cm-1
. As PVP concentration was increased, the VitC peak
shifted to a higher wavenumber indicating that the presence of PVP disrupted the VitC-
VitC interaction. The ability of PVP to disrupt VitC-VitC interaction was also observed
from the peak shift of VitC carbonyl peak at 1678 cm-1
. The VitC carbonyl peak (1678
cm-1
) shifted to a higher wavenumber (1685 cm-1
) as PVP ratio was increased to 60%PVP
ratio. At higher PVP concentration, the VitC was further diluted resulting in the
disappearance of the VitC carbonyl peak as it was overshadowed by the PVP carbonyl
peak. The lost of VitC - VitC interaction at both carbonyl regions was replaced by the
VitC-PVP interaction.
Single carbonyl peak was observed in PVP at 1678 cm-1
. The formation of
dispersion resulted in the peak shift of PVP carbonyl peak to a lower wavenumber. The

119
peak shifts indicated the presence of the interaction between the PVP carbonyl group and
HBD in VitC which was not possible in pure PVP due to the absence of donor. As PVP
concentration increased, less VitC-PVP interaction present due to the dilution effect of
VitC. Moreover, a new peak was also observed at wavenumber number around 1620 cm-1
which was most apparent in the dispersion with 40% - 80%PVP. The development of the
new peak was also associated with the formation of VitC-PVP interaction. At ratio below
40%PVP, the low concentration of PVP was not sufficient to interact with VitC to be
identified as the apparent new shoulder. Above 80% PVP, the new carbonyl peak was
also disappeared due to the dilution effect of VitC.
The carbonyl shift was also in good agreement with the peak shifts and alternation
in the hydroxyl region. In the dispersion formed with 40% PVP, the crystalline VitC
peaks in hydroxyl region disappeared and the interaction in the hydroxyl was the
strongest compared to the other PVP ratio. At the same PVP ratio, the new shoulder at
1620 cm-1
in carbonyl region was the most apparent and the peak position of PVP peak
shifted to the lowest wavenumber compared to other ratio. This indicated that 40% PVP
was the minimum polymer ratio to prevent VitC-VitC interaction and the ratio that
resulted in the strongest VitC-PVP interactions. Below 40% PVP ratio, not enough PVP
was present to fully prevent VitC-VitC interaction and form a strong VitC-PVP
interaction. As the polymer concentration increase above 40%, loss of VitC-PVP
interaction was both observed in the hydroxyl and carbonyl region due to the dilution
effect of VitC.
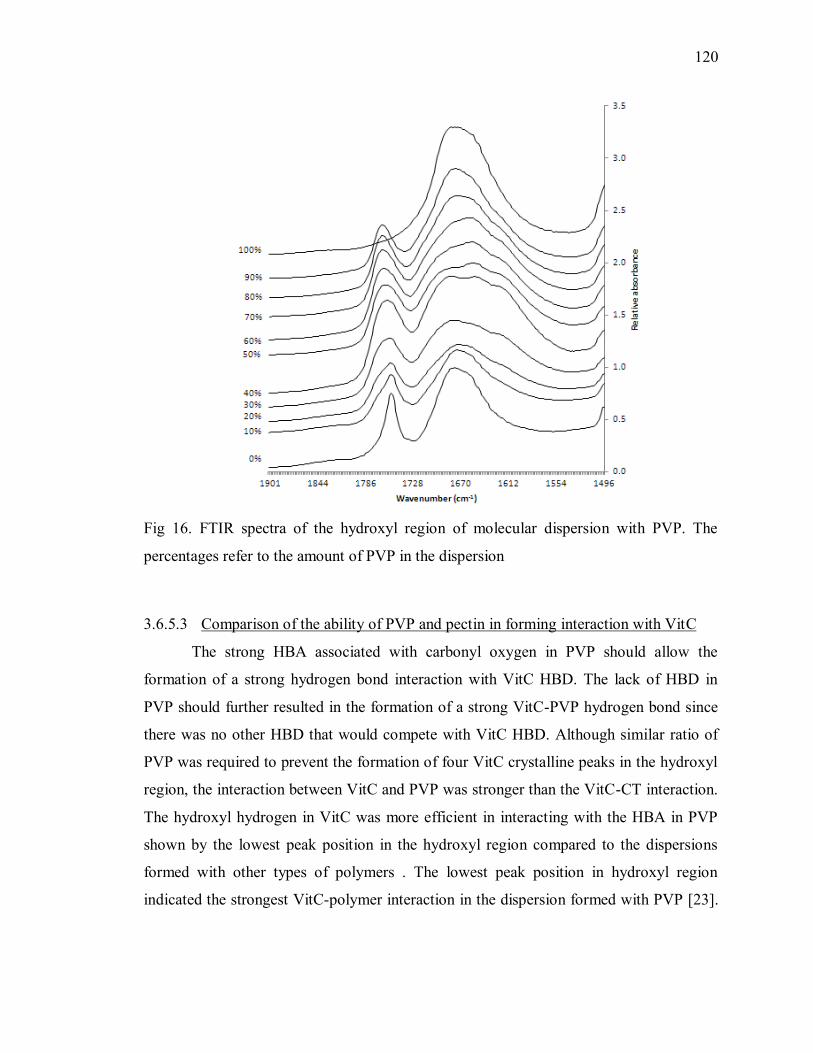
120
Fig 16. FTIR spectra of the hydroxyl region of molecular dispersion with PVP. The
percentages refer to the amount of PVP in the dispersion
3.6.5.3 Comparison of the ability of PVP and pectin in forming interaction with VitC
The strong HBA associated with carbonyl oxygen in PVP should allow the
formation of a strong hydrogen bond interaction with VitC HBD. The lack of HBD in
PVP should further resulted in the formation of a strong VitC-PVP hydrogen bond since
there was no other HBD that would compete with VitC HBD. Although similar ratio of
PVP was required to prevent the formation of four VitC crystalline peaks in the hydroxyl
region, the interaction between VitC and PVP was stronger than the VitC-CT interaction.
The hydroxyl hydrogen in VitC was more efficient in interacting with the HBA in PVP
shown by the lowest peak position in the hydroxyl region compared to the dispersions
formed with other types of polymers . The lowest peak position in hydroxyl region
indicated the strongest VitC-polymer interaction in the dispersion formed with PVP [23].
121
The interactions between PVP and VitC in the carbonyl region were also found to be
stronger than the interaction between VitC and the two types of pectin indicated by the
more pronounced peak shape alternation and peak shift position.
The ability of PVP to better interact with VitC was predictable based on its
structures and functional groups that was involved in hydrogen bonding with VitC. The
absence of HBD in PVP allowed the VitC HBD to freely interact with the PVP HBA.
The strong HBA associated with the PVP amide carbonyl further extent to probability of
VitC HBD to interact with PVP HBA. The presence of HBD and HBA in pectin resulted
competition hydrogen bond formation between VitC and multiple function groups in
pectin that were capable in forming hydrogen bond interaction. Similar observation was
found in the dispersion of bifonazole, an antifungal agent, with polyacrylic acid (PAA)
and hydroxypropyl methylcellulose acetate succinate (HPMCAS). Bifonazole which only
have HBA were found to better interact with PAA which have strong HBD associated
with the carboxylic group. In contrast, HPMCAS which has multiple HBD and HBA, was
not able to formed as strong hydrogen bond interaction due to the competition between
the hydrogen bond functional groups in bifonazole and HPMCAS[9].
3.6.6 Comparison between the crystallinity of the dispersion and the formation of VitC-
polymer interaction
The crystallization inhibitor properties of pectin were in good agreement with
their ability to form hydrogen bond interaction with VitC. The dispersion formed with CT,
which was physically more stable against crystallization, was found to have stronger
VitC-polymer interaction than EST. Multiple studies have shown that crystallization
inhibitor properties of polymer were highly influenced by the ability of the polymer to
interact with the target compound [9, 11, 23]. Interesting observation was found when the
XRPD pattern was compared with FTIR spectra in the dispersion formed with specific
types of polymer. For example, the dispersions formed with all CT ratio (as low as
10%CT) were XRPD amorphous. However, the hydroxyl region in the FTIR spectra
indicated that the four crystalline VitC peaks were still present until 40%CT dispersion
was formed..Similar observation was also found in the indometachin-PVP dispersion.

122
The dispersion formed with all concentration of PVP (0%-100% w/w) were XRPD
amorphous but cyclic dimer interaction associated with crystalline indometachin slowly
diminished between 0% and 20% PVP[11]. Therefore, the crystalline VitC interaction
may still presence in VitC amorphous solid dispersion; however, the interaction was not
enough to form crystalline solid detectable by XRPD. Grinding or milling crystal was
also found to form microcrystalline solid which passed the detection of XRPD[24].
Therefore, there was a possibility that small crystals were formed in the dispersion
formed with 40%CT which interactions were detectable by FTIR but the crystallinity was
not detectable by XPRD.
Interesting observation was also found in the dispersion formed with PVP as
compared to the dispersion formed with pectin. The FTIR spectra indicated that PVP
formed stronger interactions VitC than with pectin. However, the dispersions formed
with 10% and 20%PVP were XRPD crystalline while the dispersions formed with
10%CT and 20%EST were amorphous. Therefore, higher amount of PVP were required
to form a stable amorphous solid dispersion although stronger VitC-PVP interaction was
formed compared to the dispersion formed with pectin. Lower equilibrium constant of
PVP compared to pectin was thought to be the explanation of the observation. In absence
of steric hindrance, the carbonyl group in PVP has two sites for hydrogen bond
interaction formation. In indometachin-PVP solid dispersions, 12% weight fraction of
PVP were calculated (by mole fraction) to be sufficient to interact with all indometachin
in the system. If steric hindrance was presence and only one hydrogen bond interaction in
each PVP could be formed with indometachin,, 24% PVP was required to interact with
all indometachin in the system. However, the study found that larger amount of PVP than
predicted was required to fully form indometachin-PVP interaction. The development of
indometachin-PVP interaction (1636cm-1
) was still observed up to 50% PVP[11]. Unlike
PVP, pectin has multiple HBD and HBA groups. In spite of the competition between the
hydrogen bond groups in VitC and pectin to form hydrogen bond interactions, pectin
have more possible hydrogen bond interaction site with VitC than PVP. Therefore, less
amount of pectin in the dispersion may be required to form VitC amorphous solid
dispersion. Once sufficient PVP was present to form amorphous VitC dispersion.

123
The stronger VitC-PVP interaction observed in FTIR spectra resulted in a more stable
system compared to the dispersion formed with EST. The dispersion formed 30%PVP
remained amorphous while the dispersions formed with 30%EST were partially
crystalline following 50 days of storage at 25oC, 23%RH. The ability of polymer to
interact with target molecule clearly correlated with the formation of a stable amorphous
solid dispersion. However, other parameter need to be considered to fully understand the
minimal amount polymer required to form amorphous solid dispersion.
3.7 Conclusion
The stability of VitC amorphous solid dispersions over time was highly correlated
with the formation of VitC-polymer interactions. The dispersions formed with the lower
DE pectin (CT) were found to have stronger VitC-polymer interactions than the
dispersion formed with the higher DE pectin (EST). The stronger VitC-CT hydrogen
bond interactions were in agreement with more stable amorphous solid dispersions
formed with CT when stored at various storage temperatures and%RHs. The ability for
VitC to interact (hydrogen bond) with both the hydroxyl and carbonyl regions of CT was
believed to be the explanation for the higher ability of CT to form a stable amorphous
solid dispersion. Moreover, lower CT concentration was required to form amorphous
VitC solid dispersions after freeze drying compared to EST concentration required.. The
dispersions formed with PVP had the strongest VitC-polymer interactions and was more
stable than the dispersions formed with EST when stored at various storage temperatures
and %RHs. However, higher amount of PVP was required to form VitC amorphous solid
dispersions than both types of pectin.
124
3.8 References
1. Serajuddin, A.T.M., Solid dispersion of poorly water-soluble drugs: Early
promises, subsequent problems, and recent breakthroughs. Journal of
Pharmaceutical Sciences, 1999. 88(10): p. 1058-1066.
2. Ford, J.L., THE CURRENT STATUS OF SOLID DISPERSIONS. Pharmaceutica
Acta Helvetiae, 1986. 61(3): p. 69-88.
3. Hancock, B.C. and M. Parks, What is the true solubility advantage for amorphous
pharmaceuticals? Pharmaceutical Research, 2000. 17(4): p. 397-404.
4. Hancock, B.C. and G. Zograf, Characteristics and significance of the amorphous
state in pharmaceutical systems. Journal of Pharmaceutical Sciences, 1997. 86(1):
p. 1-12.
5. Van Eerdenbrugh, B. and L.S. Taylor, Small Scale Screening To Determine the
Ability of Different Polymers To Inhibit Drug Crystallization upon Rapid Solvent
Evaporation. Molecular Pharmaceutics, 2010. 7(4): p. 1328-1337.
6. Van Eerdenbrugh, B. and L.S. Taylor, An ab initio polymer selection methodology
to prevent crystallization in amorphous solid dispersions by application of crystal
engineering principles. Crystengcomm, 2011. 13(20): p. 6171-6178.
7. Craig, D.Q.M., et al., The relevance of the amorphous state to pharmaceutical
dosage forms: glassy drugs and freeze dried systems. International Journal of
Pharmaceutics, 1999. 179(2): p. 179-207.
8. Khougaz, K. and S.D. Clas, Crystallization inhibition in solid dispersions of MK-
0591 and poly(vinylpyrrolidone) polymers. Journal of Pharmaceutical Sciences,
2000. 89(10): p. 1325-1334.
9. Kestur, U.S., B. Van Eerdenbrugh, and L.S. Taylor, Influence of polymer
chemistry on crystal growth inhibition of two chemically diverse organic
molecules. Crystengcomm, 2011. 13(22): p. 6712-6718.
10. Matsumoto, T. and G. Zografi, Physical properties of solid molecular dispersions
of indomethacin with poly(vinylpyrrolidone) and poly(vinylpyrrolidone-co-
vinylacetate) in relation to indomethacin crystallization. Pharmaceutical Research,
1999. 16(11): p. 1722-1728.
125
11. Taylor, L.S. and G. Zografi, Spectroscopic characterization of interactions
between PVP and indomethacin in amorphous molecular dispersions.
Pharmaceutical Research, 1997. 14(12): p. 1691-1698.
12. Nath, M., et al., New organotin(IV) ascorbates: synthesis, spectral
characterization, biological and potentiometric studies. Spectrochimica Acta Part
a-Molecular and Biomolecular Spectroscopy, 2005. 61(1-2): p. 77-86.
13. Hvoslef, J., CRYSTAL STRUCTURE OF L-ASCORBIC ACID VITAMIN C .I. X-
RAY ANALYSIS. Acta Crystallographica Section B-Structural Crystallography and
Crystal Chemistry, 1968. B 24: p. 23-&.
14. Falk, M. and M.J. Wojcik, EFFECT OF TEMPERATURE AND HYDROGEN-
BOND STRENGTH ON THE IR ABSORPTION OF ISOLATED OH
OSCILLATORS - CRYSTALLINE L-ASCORBIC-ACID. Spectrochimica Acta Part
a-Molecular and Biomolecular Spectroscopy, 1979. 35(10): p. 1117-1123.
15. Srinivasan, K. and K.V. Devi, Characterization of L-ascorbic acid single crystals
grown from solution with different solvents. Crystal Research and Technology,
2010. 45(9): p. 946-952.
16. Laurence, C., et al., The pK(BHX) Database: Toward a Better Understanding of
Hydrogen-Bond Basicity for Medicinal Chemists. Journal of Medicinal Chemistry,
2009. 52(14): p. 4073-4086.
17. Pandey, K.K., A study of chemical structure of soft and hardwood and wood
polymers by FTIR spectroscopy. Journal of Applied Polymer Science, 1999.
71(12): p. 1969-1975.
18. Chatjigakis, A.K., et al., FT-IR spectroscopic determination of the degree of
esterification of cell wall pectins from stored peaches and correlation to textural
changes. Carbohydrate Polymers, 1998. 37(4): p. 395-408.
19. Bociek, S.M. and D. Welti, QUANTITATIVE-ANALYSIS OF URONIC ACID
POLYMERS BY INFRARED SPECTROSCOPY. Carbohydrate Research, 1975.
42(2): p. 217-226.
126
20. Mojet, B.L., S.D. Ebbesen, and L. Lefferts, Light at the interface: the potential of
attenuated total reflection infrared spectroscopy for understanding heterogeneous
catalysis in water. Chemical Society Reviews, 2010. 39(12): p. 4643-4655.
21. Taylor, L.S., F.W. Langkilde, and G. Zografi, Fourier transform Raman
spectroscopic study of the interaction of water vapor with amorphous polymers.
Journal of Pharmaceutical Sciences, 2001. 90(7): p. 888-901.
22. Borodko, Y., et al., Probing the interaction of poly( vinylpyrrolidone) with
platinum nanocrystals by UV-Raman and FTIR. Journal of Physical Chemistry B,
2006. 110(46): p. 23052-23059.
23. Wegiel, L.A., et al., Crystallization of amorphous solid dispersions of resveratrol
during preparation and storage-Impact of different polymers. Journal of
Pharmaceutical Sciences, 2013. 102(1): p. 171-184.
24. Yu, L., Amorphous pharmaceutical solids: preparation, characterization and
stabilization. Advanced Drug Delivery Reviews, 2001. 48(1): p. 27-42.
127
CHAPTER 4. CHEMICAL STABILITY OF VARIOUS FORM OF L – ASCORBIC
ACID: THE EFFECT OF PHYSICAL STATES, STORAGE TEMPERATURES, AND
RELATIVE HUMIDITES
4.1 Abstract
The chemical stability of L-ascorbic acid (VitC) in four different systems was
studied: pure unprocessed crystalline VitC, freeze dried VitC, crystalline VitC-
amorphous polymer physical mixtures, and VitC-polymer solid dispersions. A weight
ratio of 50/50 (wt/wt) VitC/polymer was used for physical mixtures and solid dispersions.
Freeze dried VitC and solid dispersions were formed with freeze drying. The samples
were stored at controlled temperature (40oC and 25
oC) and relative humidity (0, 23, 54
and 75%RH) conditions. Physical properties were determined using X-ray powder
diffraction (XRPD), moisture sorption isotherms, and differential scanning calorimetry
(DSC). The percent VitC loss and discoloration were monitored throughout storage using
a microplate reader assay and hunter colorimeter analysis. The general order of chemical
stability of VitC from the highest to the lowest in various systems was: pure unprocessed
VitC>freeze dried VitC>VitC-polymer physical mixtures> VitC-polymer solid
dispersions. The presence of a polymer in the physical mixtures resulted in higher VitC
loss and discoloration compared to VitC in the absence of a polymer. The formation of
solid dispersions further increased the instability especially when stored at high
temperature and %RHs. The storage temperature and %RHs were found to significantly
affect stability, while the glass transition temperature (Tg) of amorphous solid had less
effect on VitC chemical stability than other product characteristics (interactions between
the polymer and vitamin and hygroscopicity of the system).
128
4.2 Introduction
L-Ascorbic acid, vitamin C (VitC), is an essential nutrient that can only be obtained
by consumption. VitC is required to maintain normal body function such as maintaining
and repairing tissue, collagen, bones and teeth. Therefore, it is widely used in food
fortification and dietary supplements. VitC is also widely used in as water soluble
antioxidant to promote the stability of products such as liquid beverages. However,
ascorbic acid is reported to be one of the least stable vitamins, and its degradation is a
common cause of end of shelf-life. The chemical stability of VitC depends on factors
such as oxygen, light, storage temperature and water activity (aw) [1]. Many studies have
investigated the chemical stability of VitC as a pure compound [2-4], as well as in
various fruits [5-7] and beverage systems [8-13]. However, limited information was
found to understand the chemical stability of VitC in presence of other organic compound,
such as polymer, at low and intermediate moisture product.
Moreover, although VitC typically exists as crystalline solid, certain formulation
and processing conditions can lead to the formation of amorphous VitC either
intentionally or unintentionally[14]. Processing that involves rapid moisture removal,
such as freeze drying, spray drying, and fluidized bed dryer can result in the formation of
amorphous solid. Moreover, processed that introduced high stress to the crystalline
compound could also lead to the formation of amorphous solid. Amorphous solid often
recrystallized immediately after formation or during storage due to the lower physical
stability than crystalline solid [14-16]. Amorphous VitC has a high crystallization
tendency indicated by the extremely low glass transition temperature and high melting
point[17]. Therefore, amorphous VitC is most likely to recrystallized to its most stable
form immediately after formation. However, the presence of polymer was known to
create a stable amorphous solid dispersion [18, 19]. Many food products contain polymer,
such as starch and fiber, which can result in the formation of stable VitC amorphous solid
dispersion. However, limited information regarding the direct comparisons of crystalline
and amorphous VitC stability was found in the literature. This information could enhance
the understanding of VitC stability in dry and intermediate moisture food products.
129
The interest in understanding the effect of glass transition temperature (Tg) and
physical states of amorphous solid (glassy or rubbery) on the physical and chemical
stability of foods have been increasing [20-23]. Temperature, moisture and Tg of the
system were found to influenced the chemical stability of VitC during air drying and
spray drying [23-25]. VitC stability was influenced by both water activity (aw) and Tg in
fortified, low moisture powder system (in the presence of protein, carbohydrate, and 16
different vitamins and minterals). However, the specific physical state of VitC was not
identified and the Tg measured may be the Tg of the other ingredients in the powder
system instead of the Tg of VitC[20].
4.3 Objectives
The objective of this study was to understand the chemical stability of VitC in
various forms: pure unprocessed crystalline VitC, freeze dried VitC, VitC-polymer
physical mixtures, and VitC-polymer solid dispersions. The VitC loss was monitored up
to 10 weeks with microplate reader analysis and the discoloration of VitC was monitored
up to 8 weeks with a hunter colorimeter. Moreover, the effect of storage temperature,
storage %RHs, physical states, and types of polymer on the chemical stability of VitC
were studied.

130
4.4 Experimental Design
Compound Polymer Ratios Method Relative
Humidit
ies (%)
Temp
(°C)
Time Analysis
Ascorbic
acid
Pectin from
apple
Pectin from
citrus peel
Pectin from
citrus fruit
Pectin,
esterified with
potassium
from citrus
fruit
Polyvinyl-
pyrrolidone
Polyacrylic
acid
50 %
Polymer
(w/w)
Lyophi
lization
0
23
54
75
22
40
Biweek
ly until
week 10
X-Ray
diffraction
SPS
moisture
sorption
isotherm
Different
ial
scanning
colorimeter
Micropla
te reader
assay
Hunter
colorimeter
4.5 Materials and Methods
4.5.1 Materials
Ascorbic acid and polymers were obtained from Sigma – Aldrich Inc. (St. Louis,
MO). The polymer used were pectin with different degree of esterification (DE) [pectin
from citrus peel (CT, DE=~61%), pectin from apple (AP, DE=70-75%), esterified pectin
from citrus (EST, DE>=85%), and esterified potassium salt pectin from citrus (K, DE=
55-70%, potassium = 4.1-6.4%)], polyvinylpyrrolidone (PVP, 40000MW), and
polyacrylic acid (PAA, 450000MW). Salts were used to achieve specific %RH for
storage study. Drierite (0%RH) was obtained from W.A. Hammond Drierite Company,
LTD (Xenia, OH). Potassium acetate (CH3CO2K, 23%RH) was obtained from Acros
Organic (NJ). Magnesium sulfate (Mg2SO4, 54%RH) and sodium chloride (NaCl,
75%RH) were obtained from Sigma – Aldrich Inc. (St. Louis, MO). For microplate
reader analysis, phosphate monobasic and dibasic were obtained from Mallinckrodt
Baker, (Paris, KY), trichloroacetic acid and 2,2-bipyridine were obtained from
Mallinckrodt-Baker (Phillipsburg, NJ), iron chloride was from Sigma – Aldrich Inc. (St.
131
Louis, MO). The sample types studied were: initial crystalline VitC, freeze dried VitC
(FD VitC), physical blends (1:1) of the initial VitC and initial each polymers, and freeze
dried solid dispersions (1:1) of VitC and each polymer.
4.5.2 Freeze dried ascorbic acid (FD VitC), ascorbic acid (VitC) – polymer physical
mixtures, and solid dispersion formation
Freeze dried ascorbic acid (FD VitC) was prepared by dissolving 0.5g of VitC with 45mL
of water in a 50ml centrifuge tubes. To prepare solid dispersions, approximately 0.25g of
VitC and 0.25g of polymer to total of 0.5g (50/50 w/w) of solid was dissolved with 45ml
of water in a 50ml centrifuge tube. The solutions were mixed thoroughly to ensure that
the polymer was fully dissolved. The FD VitC and solid dispersion solutions were then
frozen at -20oC for at least 24 hours prior to freeze drying. Freeze drying was performed
using a VirTis Genesis 25 ES (VirTis, Gardiner, NY) for at least 90 hours to ensure that
water was completely removed from the sample. The sample were then quickly
transferred to 20 ml glass vial to be stored at various temperatures and %RHs or analyzed
for day 0 data collection. The physical mixtures were formed by dry blending
approximately 0.25g of VitC and 0.25g of polymer to total of 0.5g (50/50 w/w) of solid.
The samples were mixed using a vortex to ensure proper mixing. .
4.5.3 Storage treatment
The lyophilized samples were stored at room temperature (22±3oC) and 40
oC in
desiccators at various %RH: 0, 23, 54, and 75%RH. Water jacketed incubators (Forma
Scientific, Inc., Marietta, OH) were used to achieve the 40oC incubation temperature.
Samples were analyzed periodically throughout the 70 days storage streatment to assess
crystallinity, %VitC lost and discoloration. The mass change was monitored over time
until samples reached equilibrium (±0.001mg) to document moisture sorption at each
storage condition. The Tgs of the samples were measured after the samples reached
equilibrium.

132
4.5.4 X-ray powdered diffraction (XRPD)
To characterize the physical structure immediately after freeze drying, the samples were
analyzed using a Shimadzu LabX XRD-6000 (Shimadzu Corporation, Kyoto, Japan)
equipped with a Cu-Kα source set in Bragg-Brentano geometry between 5o and 35
o 2θ
angle at 4o/min with a 0.04
o step size. A silicon standard was used to calibrate the
equipment prior to each analysis. Samples were packed into the well of the aluminum
sample holder and surface of the powder was smoothen with glass slide. Samples were
also monitored weekly throughout 70 days of storage using XRPD to assess when
changes in crystallinity occurred, if any.
4.5.5 Moisture sorption isotherm analysis
Moisture sorption isotherm profiles and weight gain of samples at different RHs were
determined using SPSx-1μ Dynamic Vapor Sorption Analyzer (Projekt Messtechnik,
Ulm, Germany). Samples (900 – 1100mg) were loaded into aluminum pans in a 26-ring
sample holder, the equilibrium criterion was a weight change of 0.01% for 15 minutes
with a maximum step time of 10 hours, and minimum step time of 50 min. The samples
were equilibrated at 5oC for 3 hours and then analyzed at 25
oC from 5 - 90% RH for a 16
RH steps cycle. Moreover, the mass change of the solid dispersions stored in saturated
salt chamber was monitored over time until samples reach equilibrium (±0.001mg).
4.5.6 Differential scanning calorimetry (DSC)
Thermal analysis was performed using a TA Q2000 DSC (TA Instruments, New Castle,
Delaware). Nitrogen was used as the purge gas. Following storage treatment, samples
(2.5 – 4mg) were weighed into aluminum Tzero pans (TA Instruments) and hermetically
sealed. The glass transition temperature (Tg) was determined by heating the samples at
least 50oC higher than the Tg, then quickly cooling to -80
oC, and then reheating to at least
100oC to determine the onset Tg. The first heating cycle was used to determine the Tg of
freeze dried PVP and PAA and their dispersions. The scanning rates of all the steps were

133
10oC/min. DSC heating curves were analyzed using Universal Analysis 2000 software
(TA Instruments).
4.5.7 Microplate reader assay
The chemical stability of L-ascorbic acid was monitored biweekly over time using a
UV/VIS AD 340 Microplate Reader (Beckman Coulter, Inc., Brea, CA). The method of
analysis was adapted from Stevens et al. [26]. In preparing the sample, approximately
0.2g of samples was diluted with distilled water to a final volume of 50mL. Then 500µL
the dilution was further diluted to 1.5mL in 6% TCA solution and then 200µL of the
TCA diluted solution was plated on Microplate (Becton, Dickinson and Company,
Franklin Lakes, NJ). The absorbance used to detect concentration of L-ascorbic acid is
570 nm. Measurements were taken in duplicates. Results were then be compared to a
standard curve of known L-ascorbic acid concentrations [27]
4.5.8 Hunter colorimeter
Samples were analyzed with Hunter colorimeter to monitor the color change of samples
overtime. The data was indicated with CIE LAB value: L value representing whiteness
(100) and blackness (0); a* value representing redness (+) and greenness (-); b* value
representing yellowness (+) and blueness (-). L, a, b values of each sample were
measured using a Labscan XE Hunter colorimeter (Hunter Associates Laboratory, Inc.,
Reston, VA). The equipment was calibrated with black and white standard tiles.
Triplicate measurement was done to monitor the color change. The port size of 0.20” was
used with 0.125” of area view. Enough samples were placed in clear bottom sample cup
and the sample cup was cleaned with Kimwipe prior and between analysis. Samples were
analyzed in triplicates. The change in a*value and b*value overtime compared to the
initial color of the samples were used as an indicator of discoloration of VitC. The
increase in a*value (redness) and b*value (yellowness) were used as browning index.
Measurements were taken in triplicates.
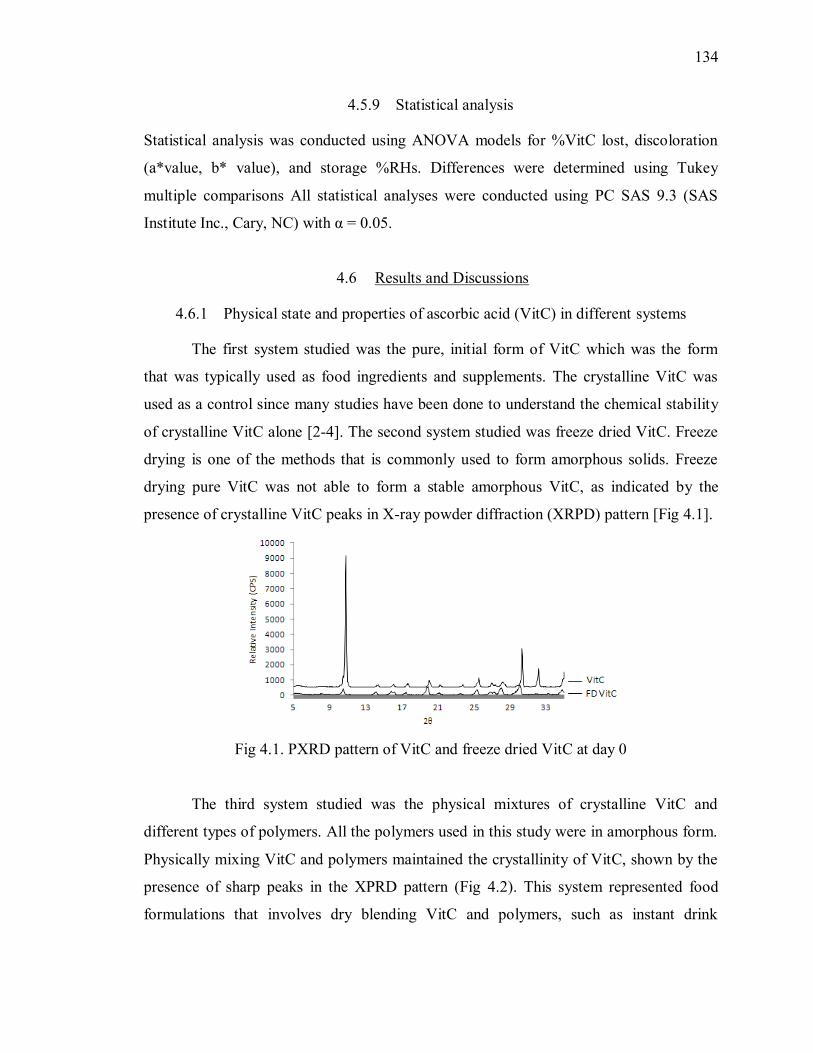
134
4.5.9 Statistical analysis
Statistical analysis was conducted using ANOVA models for %VitC lost, discoloration
(a*value, b* value), and storage %RHs. Differences were determined using Tukey
multiple comparisons All statistical analyses were conducted using PC SAS 9.3 (SAS
Institute Inc., Cary, NC) with α = 0.05.
4.6 Results and Discussions
4.6.1 Physical state and properties of ascorbic acid (VitC) in different systems
The first system studied was the pure, initial form of VitC which was the form
that was typically used as food ingredients and supplements. The crystalline VitC was
used as a control since many studies have been done to understand the chemical stability
of crystalline VitC alone [2-4]. The second system studied was freeze dried VitC. Freeze
drying is one of the methods that is commonly used to form amorphous solids. Freeze
drying pure VitC was not able to form a stable amorphous VitC, as indicated by the
presence of crystalline VitC peaks in X-ray powder diffraction (XRPD) pattern [Fig 4.1].
Fig 4.1. PXRD pattern of VitC and freeze dried VitC at day 0
The third system studied was the physical mixtures of crystalline VitC and
different types of polymers. All the polymers used in this study were in amorphous form.
Physically mixing VitC and polymers maintained the crystallinity of VitC, shown by the
presence of sharp peaks in the XPRD pattern (Fig 4.2). This system represented food
formulations that involves dry blending VitC and polymers, such as instant drink

135
mixtures and powdered formulations. Moreover, the addition of crystalline VitC to food
products post-processing can also lead to the proximity of VitC and polymers without
changing the physical form of the VitC.
Fig 4.2. PXRD pattern of 50:50 VitC:CT dispersions and physical mixtures
The last system studied was the VitC solid dispersions that were formed with
various types of polymers (50% w/w). The PXRD result showed that VitC amorphous
solid dispersions could be formed in the presence of some polymers. Amorphous 50:50
VitC:polymer dispersions were formed with all types of pectin and PVP (Fig 4.3). The
50:50 VitC:pectin and PVP dispersions remained amorphous when stored at 0% and 23%
RH (25oC and 40
oC) for 130 days, but crystallized after 1 week when stored at 54% and
75% RH (25oC and 40
oC) (Table 4.1). The 50:50 VitC:PAA dispersion recrystallized
immediately after freeze drying (Fig 4.3). The solid dispersions systems represented food
productions in which the VitC was added as one of the ingredients along with other types
of carbohydrates, such as polymer, prior to any rapid moisture removal process, such as
spray drying, freeze drying, tunnel drying, etc. The effects of polymers types that resulted
in the formation of amorphous VitC (pectins and PVP) and recrystallized VitC (PAA) in
the solid dispersion, on VitC chemical stability were studied.
.

136
Fig 4.3. PXRD of 50:50 VitC:polymer dispersions and FD ascorbic acid at day 0
Table 4. 1. PXRD of 50:50 AA:polymer after 7 days at 25oC and the identified %RH
Sample Temp
PXRD amorphous or crystalline
following storage @RH
0 23 54 75
CT 25 A A C C
40 A A C C
AP 25 A A C C
40 A A C C
EST 25 A A C C
40 A A C C
K 25 A A C C
40 A A C C
PVP 25 A A C C
40 A A C C
PAA 25 C C C C
40 C C C C
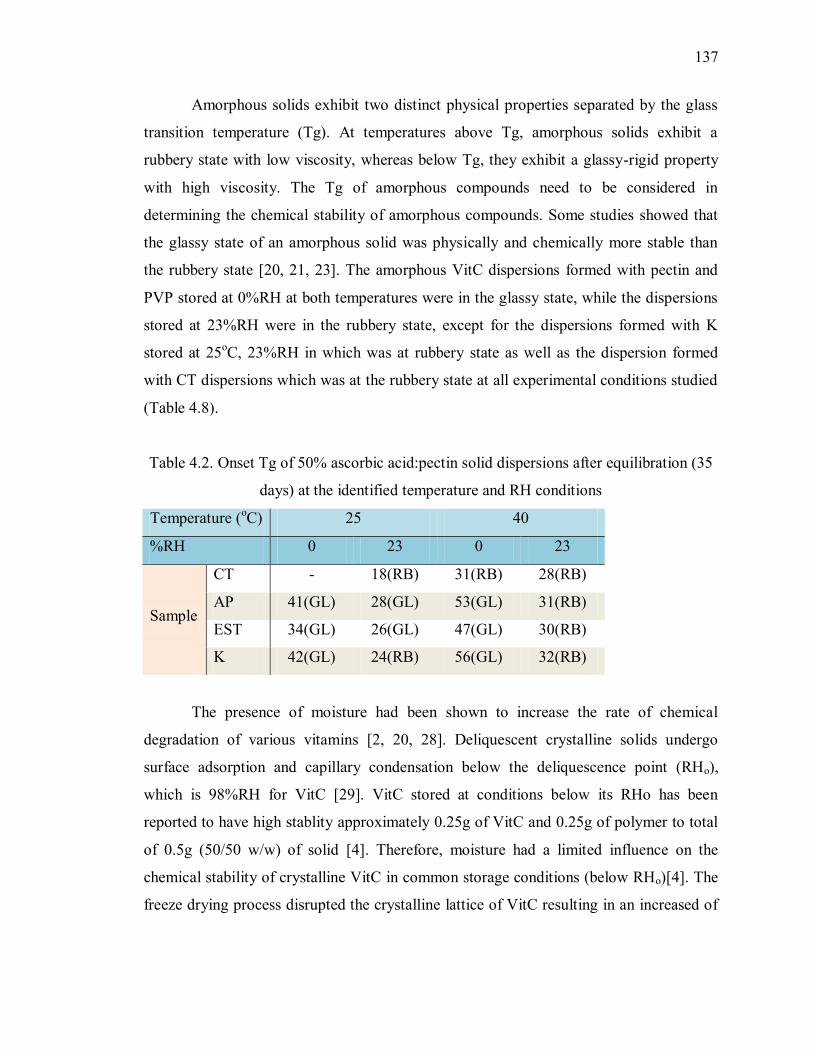
137
Amorphous solids exhibit two distinct physical properties separated by the glass
transition temperature (Tg). At temperatures above Tg, amorphous solids exhibit a
rubbery state with low viscosity, whereas below Tg, they exhibit a glassy-rigid property
with high viscosity. The Tg of amorphous compounds need to be considered in
determining the chemical stability of amorphous compounds. Some studies showed that
the glassy state of an amorphous solid was physically and chemically more stable than
the rubbery state [20, 21, 23]. The amorphous VitC dispersions formed with pectin and
PVP stored at 0%RH at both temperatures were in the glassy state, while the dispersions
stored at 23%RH were in the rubbery state, except for the dispersions formed with K
stored at 25oC, 23%RH in which was at rubbery state as well as the dispersion formed
with CT dispersions which was at the rubbery state at all experimental conditions studied
(Table 4.8).
Table 4.2. Onset Tg of 50% ascorbic acid:pectin solid dispersions after equilibration (35
days) at the identified temperature and RH conditions
Temperature (oC) 25 40
%RH 0 23 0 23
Sample
CT - 18(RB) 31(RB) 28(RB)
AP 41(GL) 28(GL) 53(GL) 31(RB)
EST 34(GL) 26(GL) 47(GL) 30(RB)
K 42(GL) 24(RB) 56(GL) 32(RB)
The presence of moisture had been shown to increase the rate of chemical
degradation of various vitamins [2, 20, 28]. Deliquescent crystalline solids undergo
surface adsorption and capillary condensation below the deliquescence point (RHo),
which is 98%RH for VitC [29]. VitC stored at conditions below its RHo has been
reported to have high stablity approximately 0.25g of VitC and 0.25g of polymer to total
of 0.5g (50/50 w/w) of solid [4]. Therefore, moisture had a limited influence on the
chemical stability of crystalline VitC in common storage conditions (below RHo)[4]. The
freeze drying process disrupted the crystalline lattice of VitC resulting in an increased of

138
surface area in FD VitC compared to the starting crystalline structure. The increase of
surface area and the more disordered structure of FD VitC led to a higher moisture
adsorption and capillary condensation (Fig 4.4). Amorphous solids, such as the polymers
studied, undergo moisture absorption which leads to the introduction of significantly
higher amounts moisture at low and intermediate RH conditions as compared to
deliquescent crystalline solids. Therefore, the addition of a polymer in the 50:50
VitC:polymers physical mixtures resulted in higher amounts of moisture sorbed
compared to the system with just VitC (Fig 4.5)[30]. The formation of 50:50
VitC:polymers solid dispersions further increased the moisture absorbed in the system,
since the VitC was in amorphous form when the dispersion was formed with pectin and
PVP (Fig 4.5) [31, 32]. The 50:50 VitC:PAA dispersions immediately crystallized (at
least partially crystalline) upon removal from the freeze drier. However, some amorphous
VitC-PAA regions were still present in these dispersions. At RHs above 31%RH,
VitC:PAA completely crystallized leading to a complete separation of the VitC
crystalline region and the PAA amorphous region. Therefore, above 31%RH, the
moisture absorbed by the dispersion and physical mixtures was the very similar.
Fig 4.4. Moisture sorption isotherm profile SPS gravimetric analyzer of AA and FD AA
0.0
0.2
0.4
0.6
0.8
1.0
5 11 16 22 27 33 39 44 50 56 61 67 73 78 84 87 89
%W
eigh
t ch
ange
%RH
AA FD AA
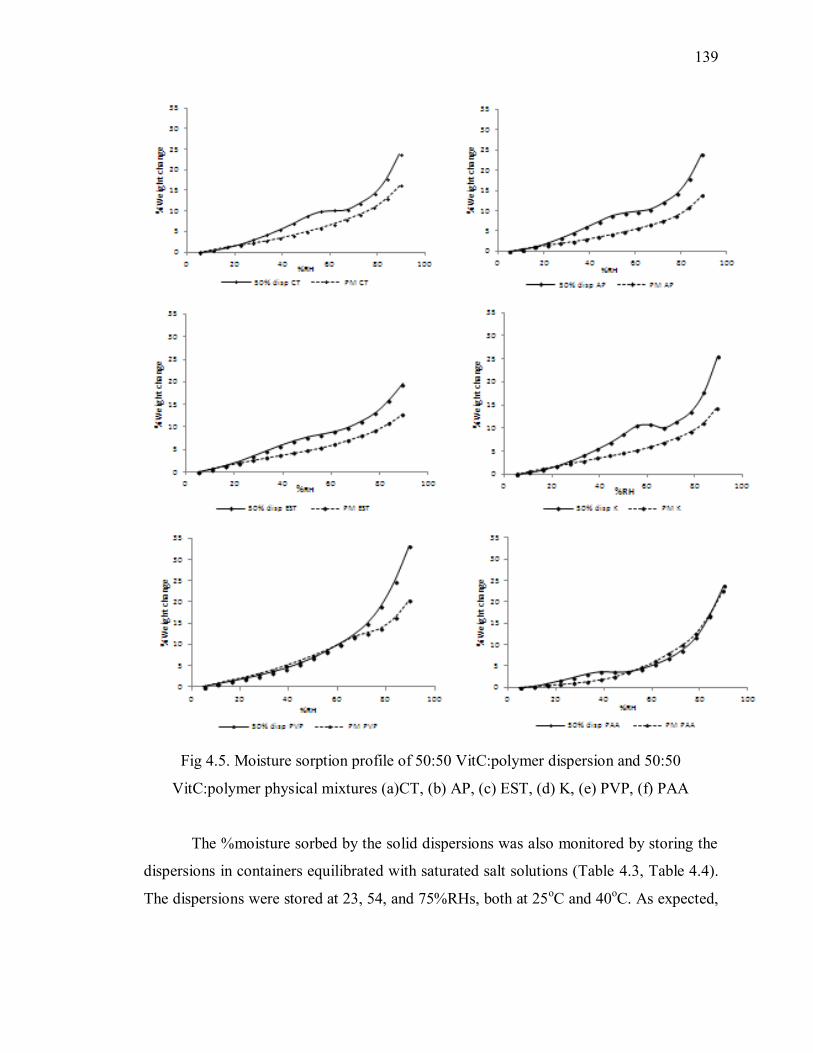
139
Fig 4.5. Moisture sorption profile of 50:50 VitC:polymer dispersion and 50:50
VitC:polymer physical mixtures (a)CT, (b) AP, (c) EST, (d) K, (e) PVP, (f) PAA
The %moisture sorbed by the solid dispersions was also monitored by storing the
dispersions in containers equilibrated with saturated salt solutions (Table 4.3, Table 4.4).
The dispersions were stored at 23, 54, and 75%RHs, both at 25oC and 40
oC. As expected,
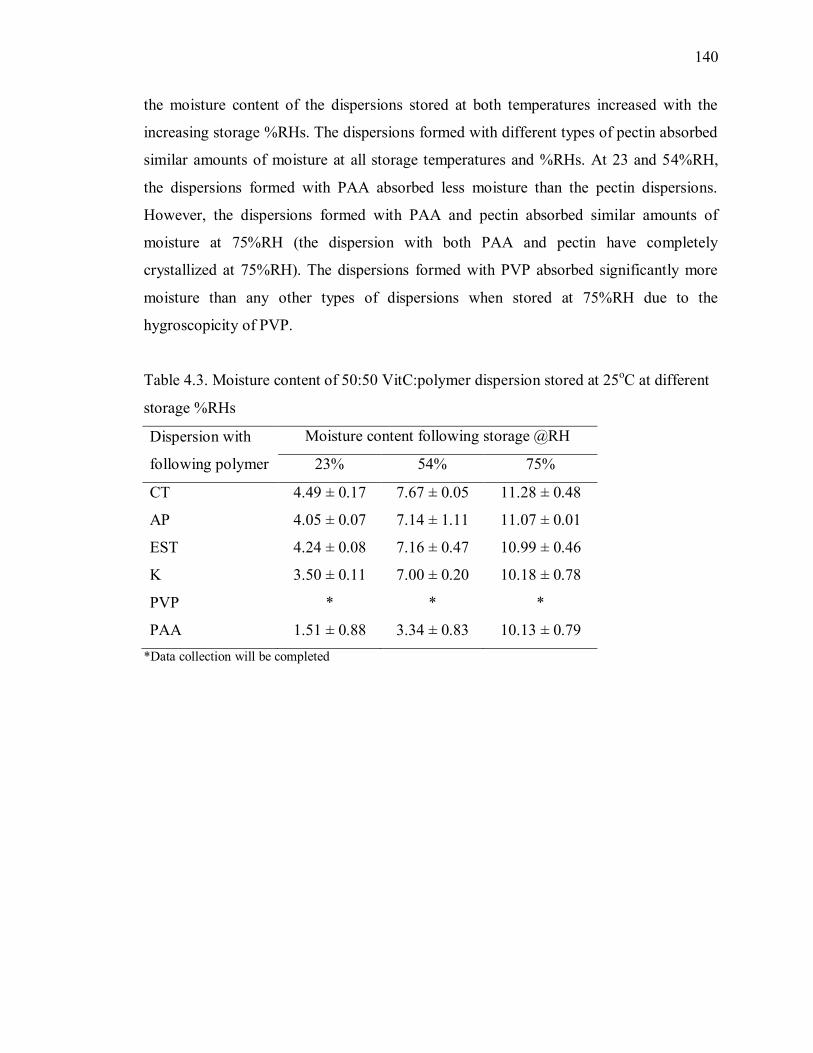
140
the moisture content of the dispersions stored at both temperatures increased with the
increasing storage %RHs. The dispersions formed with different types of pectin absorbed
similar amounts of moisture at all storage temperatures and %RHs. At 23 and 54%RH,
the dispersions formed with PAA absorbed less moisture than the pectin dispersions.
However, the dispersions formed with PAA and pectin absorbed similar amounts of
moisture at 75%RH (the dispersion with both PAA and pectin have completely
crystallized at 75%RH). The dispersions formed with PVP absorbed significantly more
moisture than any other types of dispersions when stored at 75%RH due to the
hygroscopicity of PVP.
Table 4.3. Moisture content of 50:50 VitC:polymer dispersion stored at 25oC at different
storage %RHs
Dispersion with
following polymer
Moisture content following storage @RH
23% 54% 75%
CT 4.49 ± 0.17 7.67 ± 0.05 11.28 ± 0.48
AP 4.05 ± 0.07 7.14 ± 1.11 11.07 ± 0.01
EST 4.24 ± 0.08 7.16 ± 0.47 10.99 ± 0.46
K 3.50 ± 0.11 7.00 ± 0.20 10.18 ± 0.78
PVP * * *
PAA 1.51 ± 0.88 3.34 ± 0.83 10.13 ± 0.79
*Data collection will be completed
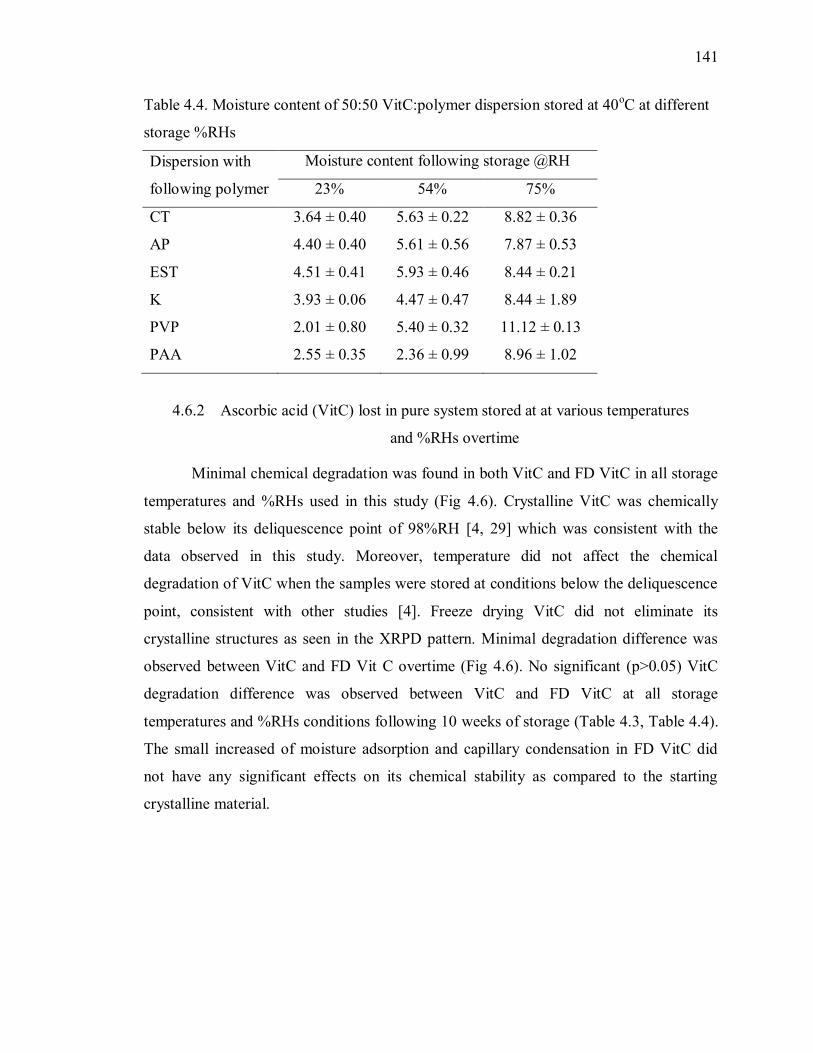
141
Table 4.4. Moisture content of 50:50 VitC:polymer dispersion stored at 40oC at different
storage %RHs
Dispersion with
following polymer
Moisture content following storage @RH
23% 54% 75%
CT 3.64 ± 0.40 5.63 ± 0.22 8.82 ± 0.36
AP 4.40 ± 0.40 5.61 ± 0.56 7.87 ± 0.53
EST 4.51 ± 0.41 5.93 ± 0.46 8.44 ± 0.21
K 3.93 ± 0.06 4.47 ± 0.47 8.44 ± 1.89
PVP 2.01 ± 0.80 5.40 ± 0.32 11.12 ± 0.13
PAA 2.55 ± 0.35 2.36 ± 0.99 8.96 ± 1.02
4.6.2 Ascorbic acid (VitC) lost in pure system stored at at various temperatures
and %RHs overtime
Minimal chemical degradation was found in both VitC and FD VitC in all storage
temperatures and %RHs used in this study (Fig 4.6). Crystalline VitC was chemically
stable below its deliquescence point of 98%RH [4, 29] which was consistent with the
data observed in this study. Moreover, temperature did not affect the chemical
degradation of VitC when the samples were stored at conditions below the deliquescence
point, consistent with other studies [4]. Freeze drying VitC did not eliminate its
crystalline structures as seen in the XRPD pattern. Minimal degradation difference was
observed between VitC and FD Vit C overtime (Fig 4.6). No significant (p>0.05) VitC
degradation difference was observed between VitC and FD VitC at all storage
temperatures and %RHs conditions following 10 weeks of storage (Table 4.3, Table 4.4).
The small increased of moisture adsorption and capillary condensation in FD VitC did
not have any significant effects on its chemical stability as compared to the starting
crystalline material.
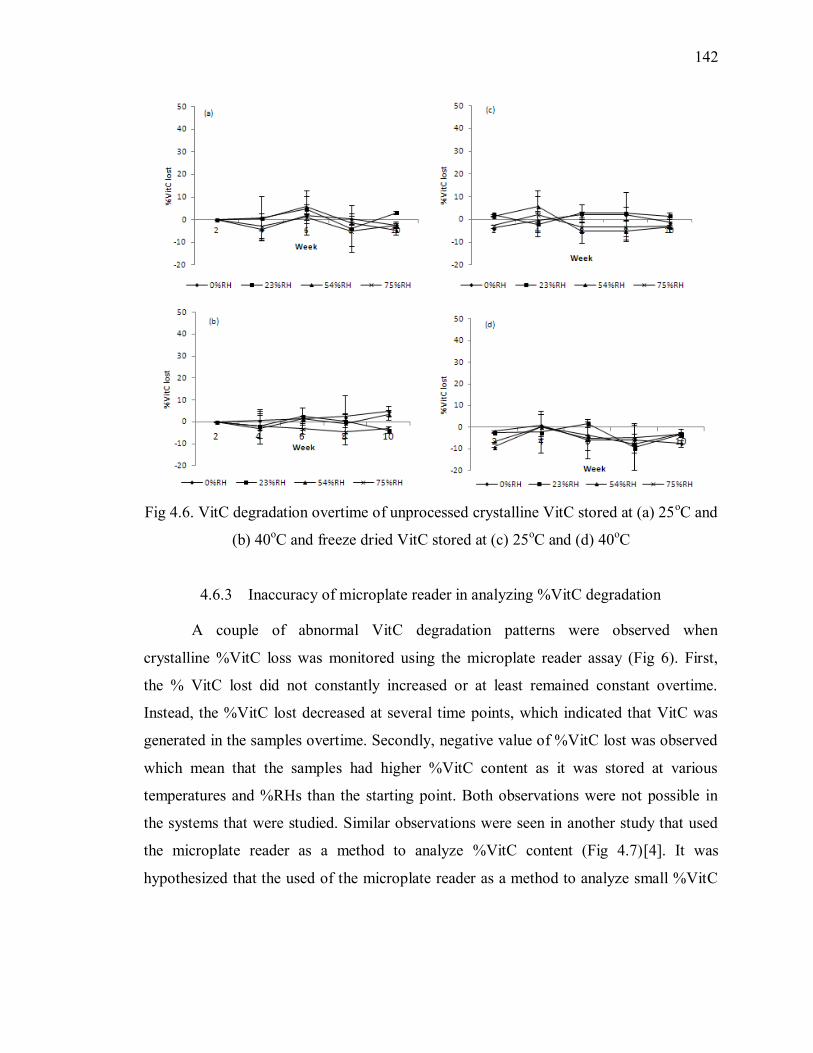
142
Fig 4.6. VitC degradation overtime of unprocessed crystalline VitC stored at (a) 25oC and
(b) 40oC and freeze dried VitC stored at (c) 25
oC and (d) 40
oC
4.6.3 Inaccuracy of microplate reader in analyzing %VitC degradation
A couple of abnormal VitC degradation patterns were observed when
crystalline %VitC loss was monitored using the microplate reader assay (Fig 6). First,
the % VitC lost did not constantly increased or at least remained constant overtime.
Instead, the %VitC lost decreased at several time points, which indicated that VitC was
generated in the samples overtime. Secondly, negative value of %VitC lost was observed
which mean that the samples had higher %VitC content as it was stored at various
temperatures and %RHs than the starting point. Both observations were not possible in
the systems that were studied. Similar observations were seen in another study that used
the microplate reader as a method to analyze %VitC content (Fig 4.7)[4]. It was
hypothesized that the used of the microplate reader as a method to analyze small %VitC
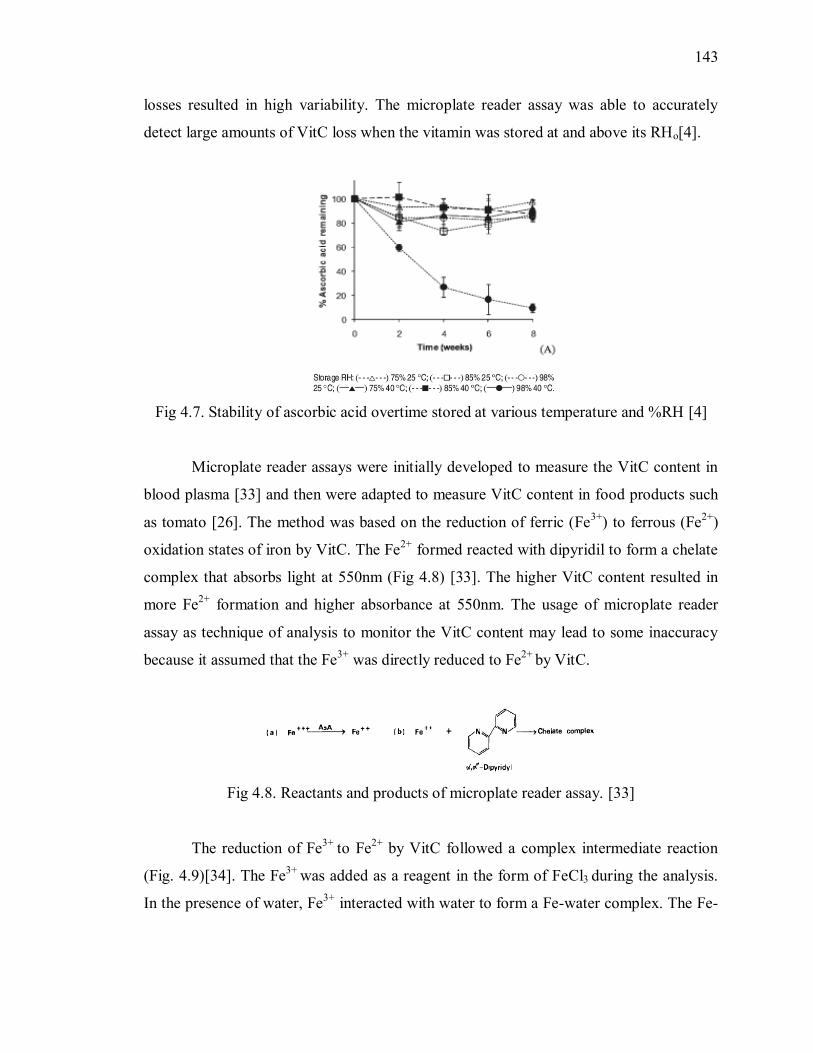
143
losses resulted in high variability. The microplate reader assay was able to accurately
detect large amounts of VitC loss when the vitamin was stored at and above its RHo[4].
Fig 4.7. Stability of ascorbic acid overtime stored at various temperature and %RH [4]
Microplate reader assays were initially developed to measure the VitC content in
blood plasma [33] and then were adapted to measure VitC content in food products such
as tomato [26]. The method was based on the reduction of ferric (Fe3+
) to ferrous (Fe2+
)
oxidation states of iron by VitC. The Fe2+
formed reacted with dipyridil to form a chelate
complex that absorbs light at 550nm (Fig 4.8) [33]. The higher VitC content resulted in
more Fe2+
formation and higher absorbance at 550nm. The usage of microplate reader
assay as technique of analysis to monitor the VitC content may lead to some inaccuracy
because it assumed that the Fe3+
was directly reduced to Fe2+
by VitC.
Fig 4.8. Reactants and products of microplate reader assay. [33]
The reduction of Fe3+
to Fe2+
by VitC followed a complex intermediate reaction
(Fig. 4.9)[34]. The Fe3+
was added as a reagent in the form of FeCl3 during the analysis.
In the presence of water, Fe3+
interacted with water to form a Fe-water complex. The Fe-
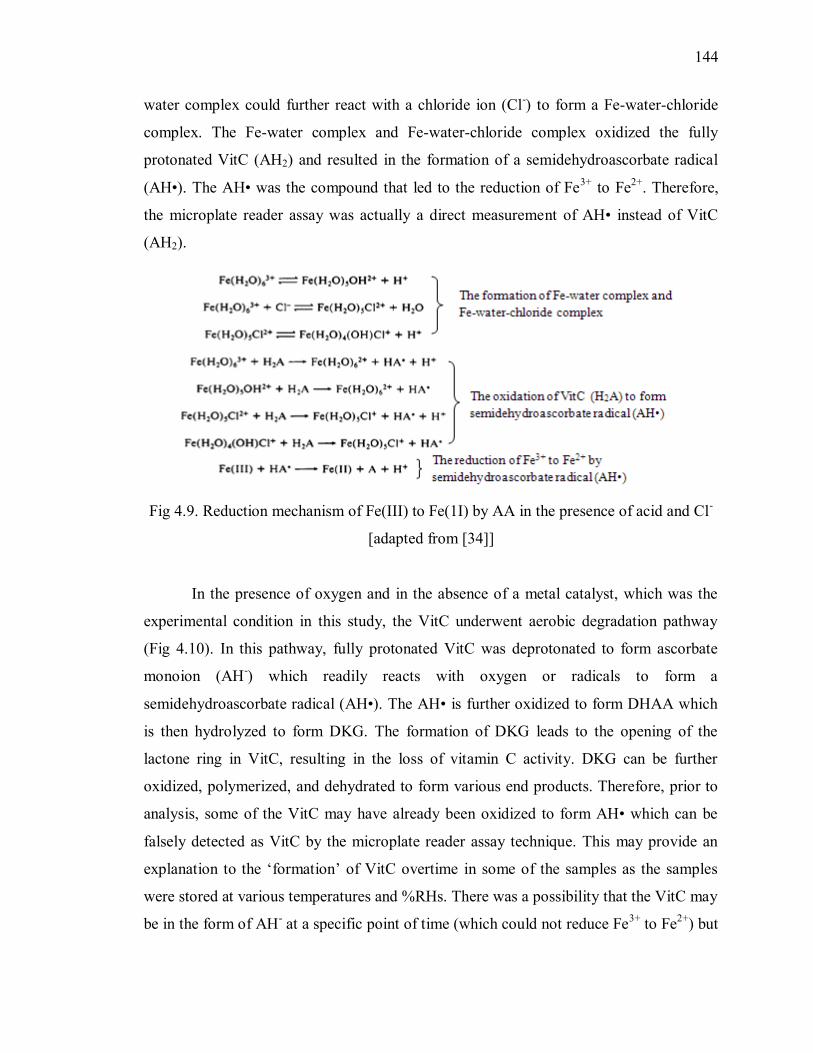
144
water complex could further react with a chloride ion (Cl-) to form a Fe-water-chloride
complex. The Fe-water complex and Fe-water-chloride complex oxidized the fully
protonated VitC (AH2) and resulted in the formation of a semidehydroascorbate radical
(AH•). The AH• was the compound that led to the reduction of Fe3+
to Fe2+
. Therefore,
the microplate reader assay was actually a direct measurement of AH• instead of VitC
(AH2).
Fig 4.9. Reduction mechanism of Fe(III) to Fe(1I) by AA in the presence of acid and Cl-
[adapted from [34]]
In the presence of oxygen and in the absence of a metal catalyst, which was the
experimental condition in this study, the VitC underwent aerobic degradation pathway
(Fig 4.10). In this pathway, fully protonated VitC was deprotonated to form ascorbate
monoion (AH-) which readily reacts with oxygen or radicals to form a
semidehydroascorbate radical (AH•). The AH• is further oxidized to form DHAA which
is then hydrolyzed to form DKG. The formation of DKG leads to the opening of the
lactone ring in VitC, resulting in the loss of vitamin C activity. DKG can be further
oxidized, polymerized, and dehydrated to form various end products. Therefore, prior to
analysis, some of the VitC may have already been oxidized to form AH• which can be
falsely detected as VitC by the microplate reader assay technique. This may provide an
explanation to the ‘formation’ of VitC overtime in some of the samples as the samples
were stored at various temperatures and %RHs. There was a possibility that the VitC may
be in the form of AH- at a specific point of time (which could not reduce Fe
3+ to Fe
2+) but
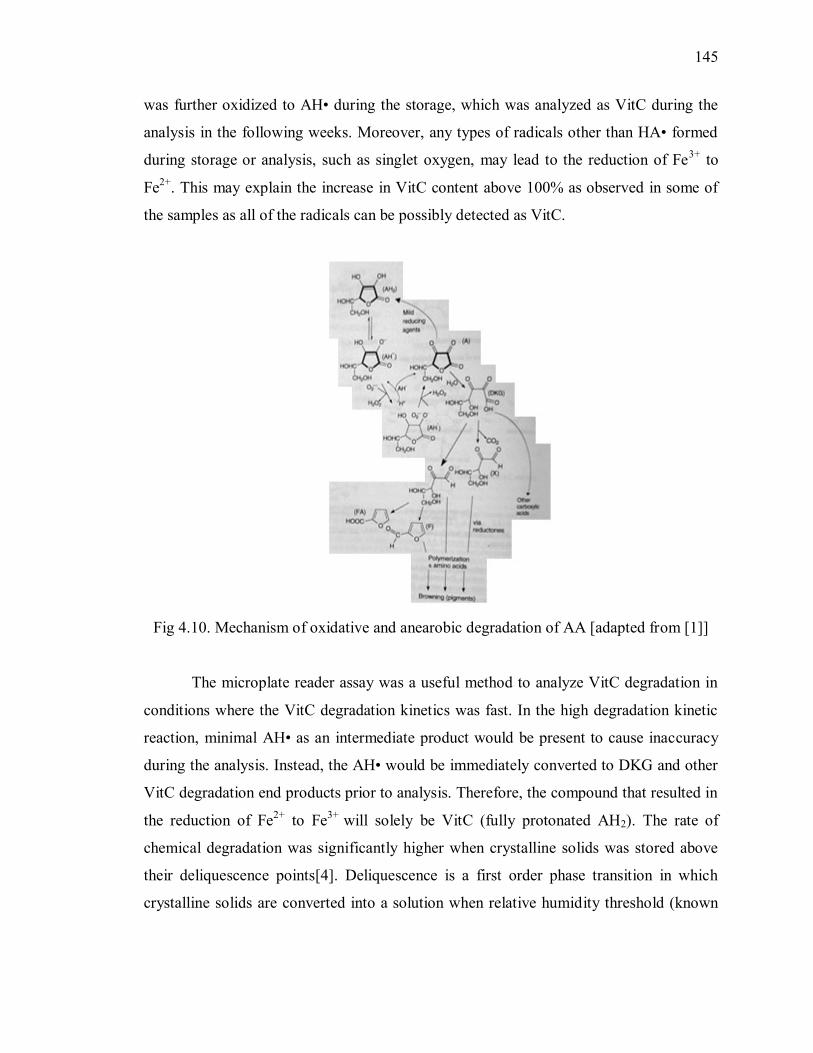
145
was further oxidized to AH• during the storage, which was analyzed as VitC during the
analysis in the following weeks. Moreover, any types of radicals other than HA• formed
during storage or analysis, such as singlet oxygen, may lead to the reduction of Fe3+
to
Fe2+
. This may explain the increase in VitC content above 100% as observed in some of
the samples as all of the radicals can be possibly detected as VitC.
Fig 4.10. Mechanism of oxidative and anearobic degradation of AA [adapted from [1]]
The microplate reader assay was a useful method to analyze VitC degradation in
conditions where the VitC degradation kinetics was fast. In the high degradation kinetic
reaction, minimal AH• as an intermediate product would be present to cause inaccuracy
during the analysis. Instead, the AH• would be immediately converted to DKG and other
VitC degradation end products prior to analysis. Therefore, the compound that resulted in
the reduction of Fe2+
to Fe3+
will solely be VitC (fully protonated AH2). The rate of
chemical degradation was significantly higher when crystalline solids was stored above
their deliquescence points[4]. Deliquescence is a first order phase transition in which
crystalline solids are converted into a solution when relative humidity threshold (known

146
as the deliquescence point, RHo) was exceeded. Samples stored in the storage conditions
above the deliquescence point would exhibit high degradation kinetics. Expected VitC
degradation pattern, in which the %VitC loss increased overtime, was obtained when the
VitC was stored above its deliquescence point (Fig 4.7). A similar observation was seen
in the degradation pattern of sodium ascorbate above its deliquescence point[4]. However,
the inaccuracy of analysis was increased in the samples with slow degradation kinetics
when the microplate reader was used as the method of analysis due to presence of
intermediate product of degradation, AH•, in the sample. Therefore, in this study, the data
obtained using microplate reader assay was used as a comparison of %VitC lost between
systems, instead of representing the exact value of %VitC lost in each type of systems.
Analytical methods that are able to monitor specific forms of VitC, as well as its
degradation intermediate and byproducts, such as HPLC, maybe more suitable to
quantify the exact amount of VitC lost in various systems.
4.6.4 Ascorbic acid (VitC) lost in 50:50 VitC:polymers physical mixtures and solid
dispersions stored at various temperature and %RHs overtime
The degradation of VitC overtime was shown to be influenced by the presence of a
polymer (Fig 4.11, Fig 4.12). When the statistical analysis were done between various
systems in a specific storage %RHs, regardless the types of polymer used to formed the
physical mixtures, the physical mixtures with CT, AP, and K underwent significantly
higher (p<0.05) VitC degradation compared to the pure crystalline VitC when stored at
40oC, 75%RH following 10 weeks of storage (Table 4.7). However, the chemical stability
of physical mixtures of VitC with all types of polymers was not significantly different
(p>0.05) compared to the pure VitC when stored at 25oC after 10 weeks of storage (Table
4.5). Although significant differences (p<0.05) between the pure VitC and physical
mixtures were only found when the samples were stored at 40oC, some physical mixtures
clearly have higher %VitC lost than pure VitC when stored at 25oC. The %VitC lost in
the physical mixtures formed with EST and K, at 25oC, 75%RH were 7.39% ± 4.35% and
8.28% ± 4.93%, respectively while the %Vit lost in pure VitC was -2.33% ± 0.87%.
Similarly, the physical mixtures stored at 40oC, 54%RH formed with all types of pectin

147
had at least 8% higher VitC lost than the pure system but no significant difference
(p>0.05) were found. Therefore, another statistical analysis was done separating the
samples based on the storage %RHs and polymer types to further confirmed whether the
present of polymer in the system reduced the VitC chemical stability. The physical
mixtures formed with all types of polymers had significantly higher (p<0.05) VitC
degradation when stored at 40oC, 75% (Table 4.8). Moreover, when stored at 40
oC, 23%
and 54%RHs, the physical mixtures formed with most types of polymer also had
significantly higher (p<0.05) than pure, initial form of VitC.
Higher VitC instability was observed with increasing storage temperature
and %RHs [35]. Significantly higher (p<0.05) chemical degradation was observed in the
physical mixtures compared to pure VitC when they were stored at the highest %RH
condition which was 75%RH (40oC) (Table 4.8). Moreover, significantly higher %VitC
losses (p<0.05) were observed in the physical mixtures formed with CT (40oC) and K
(25oC) when stored at 75%RHs compared to other lower storage %RHs (Table 4.5, Table
4.7). This further confirmed the influence of moisture on the reduction of VitC chemical
stability [20, 27, 30]. Storage temperature of 40oC was also shown to increase the VitC
degradation in the physical mixtures.
The presence of polymer resulted in higher VitC degradation when stored below,
but closer to, the deliquescence point (RHo), consistent with other studies [27, 30].
At %RHs below the RHo, sodium ascorbate was found to be less stable in the presence of
maltodextrin [30]. Similarly, the addition of anticaking agent significantly (p<0.05)
reduced the chemical stability of sodium ascorbate when stored at 75% and 85%RH. At a
higher %RH (54% and 75%RH) condition but below RHo of VitC, the presence of a
polymer resulted in moisture absorption that would not happen in the pure crystalline
VitC system. The increase of moisture sorbed by the polymer in the physical mixtures
resulted in the decrease of VitC chemical stability as observed in another study[20].
While at 0%RH storage condition, no significant (p>0.05) %VitC loss in the pure system
and the physical mixture was observed due to the absence of moisture. Above the RHo,
the additions of maltodextrin and some anticaking agents were shown to increase the
chemical stability [27, 30]. A study also showed that sugars were able to increase the
148
stability of VitC once in solution[36]. The ability of maltodextrin to improve the
chemical stability of sodium ascorbate above its RHo was associated by the liquefying of
the system which allowed the maltodextrin to reduce oxidation once in solution[30].
However, typically, the deliquescence of VitC is undesirable when VitC is used in
powdered ingredients, supplements, and in some food formulations. In the presence of a
polymer, increases in moisture uptake during storage, although the storage condition is
still well below the VitC RHo, may result in the VitC loss over time. Moreover, the
degradation was enhanced at elevated temperatures.
The formation of amorphous VitC solid dispersions with polymers further
decreased the chemical stability of VitC when stored at high %RHs. When the types of
polymer used to form the dispersion were not differentiated in the statistical analysis,
the %VitC lost was significantly higher (p<0.05) in the dispersions formed with CT, AP,
and K when stored at 40oC, 75%RH as compared to the physical mixtures (Table 4.6).
Significantly higher (p<0.05) %VitC losses were also observed in the dispersions with
EST stored at 40oC, 54%RH, and with AP stored at 25
oC, 75%RH. Trends in which the
chemical degradation of VitC in the dispersion was higher than in physical mixtures were
also observed, specifically at storage condition above 54%RHs at both 25oC and 40
oC,
although the differences were not always statistically different (p>0.05). When the
statistical analysis were grouped based on the types of polymer used and specific %RHs,
significantly higher (p<0.05) chemical degradation in the dispersion as compared to the
initial form of VitC was at 54% and 75%RHs, 40oC were clearly observed (Fig 4.8).
Moreover, significantly higher (p<0.05) VitC %lost were observed in some dispersions
when stored at 25oC (Table 4.6) compared to VitC alone. The increased chemical
degradation in the solid dispersions corresponded to the higher moisture uptakes across
different %RHs in the solid dispersions. Furthermore, higher storage temperatures
and %RHs resulted in higher chemical degradation (Fig 4.11, Fig 4.12).
The amount of moisture absorbed by the systems may seem to directly influence
the chemical stability of the VitC. However, although the solid dispersions formed with
PVP absorbed the highest amount of moisture (11.12% ± 0.13% MC) compared to other
dispersions (8-9% MC), there was no significant (p<0.05) %VitC loss observed

149
difference compared to the dispersion formed with other polymers following 10 weeks of
storage. Similar observations were seen in the physical mixtures of sodium ascorbate and
corn starch where this system absorbed the highest amount of moisture but had the least
chemical degradation of all anticaking agent-vitamin combinations studied. The low
dissolution rate of the sodium ascorbate and corn starch mixes at a specific %RH were
thought to be the explanation of the observation[27]. The chemical degradation occurred
faster when the VitC samples were in solution states instead of powder states [27, 37].
Higher VitC chemical degradation was observed in freeze dried VitC (10%w/w)
and various wall materials: soluble soybean polysaccharide, gum arabic, maltodextrin, α-
cyclodextrin, trehalose and lactose than in crystalline VitC, stored at 80oC. The VitC
degradation was observed at aw as low as 0.11 at 80oC and increased with increasing
samples aw. The %VitC remaining in the freeze dried VitC:soluble soybean
polysaccharide and VitC:gum arabic systems was less than 6% while the VitC content of
the pure system was more than 80% after 10 days of storage at 79%RH [32]. This
accelerated study at high temperature (80oC) confirmed that the formation of dispersions
with polymers significantly decreased the chemical stability of VitC. In addition,
30%VitC losses were observed in freeze dried VitC (2.5%w/w) – lactose systems after 15
days when stored at 25oC[38]. The study further confirmed the decrease of VitC chemical
stability when solid dispersions with carbohydrates were formed using freeze drying.
Food processing that involves rapid moisture removal, such as freeze drying,
spray drying, tunnel drying, fluidized bed drying, etc, as well as food processing that
involves the exposure of high stress condition such as grinding, could potentially form a
VitC amorphous solid dispersion in the presence of polymers. In rapid moisture removal
processes, a solution did not undergo a phase transition at the melting point (Tm) to form
crystalline solid; instead amorphous solid was formed [16, 31]. Physical stress applied to
crystalline solids would create a disorder in the crystal arrangement, possibly resulting
the formation of an amorphous solid [16]. The amorphous form is thermodynamically
physically less stable than the crystalline counterpart, but the presence of a polymer can
enhance the stability of the amorphous state [18, 19]. Therefore, careful consideration of

150
formulation and processing steps are required to fully understand the physical state of
VitC, and how that state affects the chemical stability of VitC in food products.
Fig 4.11. The %VitC loss of 50:50 VitC:polymer physical mixtures stored at (a) 0%RH,
(b) 23%RH, (c) 54%RH, and (d) 75%RH and 50:50 VitC:polymer solid dispersions
stored at (a) 0%RH, (b) 23%RH, (c) 54%RH, and (d) 75%RH, storage temperature of
25oC
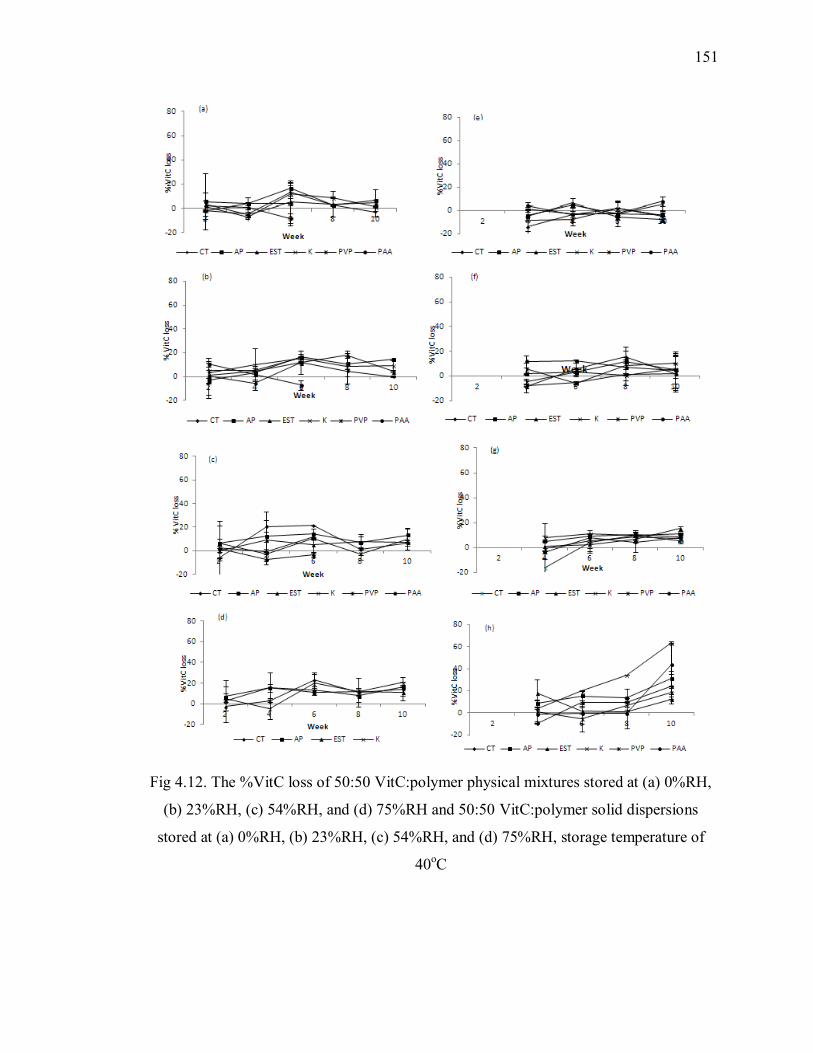
151
Fig 4.12. The %VitC loss of 50:50 VitC:polymer physical mixtures stored at (a) 0%RH,
(b) 23%RH, (c) 54%RH, and (d) 75%RH and 50:50 VitC:polymer solid dispersions
stored at (a) 0%RH, (b) 23%RH, (c) 54%RH, and (d) 75%RH, storage temperature of
40oC

Table 4.5. The %VitC loss of various systems stored at 25oC and specified %RHs after 10 weeks
Types of
polymer System
% VitC lost at specified %RHs
0 23 54 75
None Unprocessed -2.35 ± 1.57
Aa -3.71 ± 1.46
BCa -4.68 ± 1.79
Ba -2.33 ± 0.87
Ba
Freeze dried -1.312 ± 2.15Aa
1.499 ± 5.80BCa
-3.21 ± 2.87Ba
-3.12 ± 3.03Ba
CT Physical mixtures -2.07 ± 1.18
Aa -7.27 ± 3.27
Ca -2.38 ± 6.99
ABa -2.39 ± 5.86
Ba
Dispersion -4.89 ± 0.07Ab
3.08 ± 1.89ABCab
5.46 ± 2.16ABab
17.89 ± 6.84Aa
AP Physical mixtures 4.50 ± 3.39
Aa 0.20 ± 6.26
BCa 0.10 ± 7.41
ABa -3.03 ± 0.52
Ba
Dispersion 6.02 ± 1.09Aa
10.20 ± 1.38ABCa
11.56 ± 2.76ABa
14.18 ± 3.50ABa
EST Physical mixtures -3.50 ± 6.36
Aa 0.79 ± 3.14
BCa 1.30 ± 7.06
Ba 8.28 ± 4.93
ABa
Dispersion 6.44 ± 2.06Aa
10.30 ± 1.99ABa
6.55 ± 4.78ABa
6.81 ± 6.41ABa
K Physical mixtures -6.26 ± 10.10
Aa -0.19 ± 3.07
BCa -8.55 ± 2.95
Ba 7.39 ± 4.35
ABa
Dispersion 3.31 ± 1.57Ab
1.51 ± 0.74BCb
3.79 ± 0.22ABb
7.41 ± 1.35ABa
PVP Physical mixtures * * * *
Dispersion 2.29 ± 9.96Aa
12.35 ± 9.34ABa
2.89 ± 12.83ABa
15.47 ± 10.85ABa
PAA Physical mixtures * * * *
Dispersion 7.61 ± 4.31Aa
20.40 ± 4.63Aa
19.34 ± 3.36Aa
10.31 ± 1.05ABa
ab represent statistical difference between %RHs in a sample (across a row)
ABCD represent statistical difference between systems and polymer types (down a column)
Red writing represents physical mixtures or solid dispersions that statistically underwent higher VitC degradation
Yellow highlight represents solid dispersions that statistically underwent higher VitC degradation than physical mixtures
*Data collection will be completed
152

Table 4.6. The %VitC loss of various systems stored at 25oC at specified polymer types and %RHs after 10
%RH System %VitC lost in the dispersion formed with specified polymer types
CT AP EST K PVP PAA
0% Unprocessed VitC -2.35 ± 1.57A -2.35 ± 1.57A -2.35 ± 1.57A -2.35 ± 1.57A -2.35 ± 1.57 -2.35 ± 1.57
Physical mixtures -2.07 ± 1.18A 4.50 ± 3.39A -3.50 ± 6.36A -6.26 ± 10.10A * *
Dispersion -4.89 ± 0.07Aa 6.02 ± 1.09Aa 6.44 ± 2.06Aa 3.31 ± 1.57Aa 2.29 ± 9.96a 7.61 ± 4.31a
23% Unprocessed VitC -3.71 ± 1.46AB -3.71 ± 1.46A -3.71 ± 1.46A -3.71 ± 1.46A -3.71 ± 1.46 -3.71 ± 1.46
Physical mixtures -7.27 ± 3.27B 0.20 ± 6.26A 0.79 ± 3.14AB -0.19 ± 3.07A * *
Dispersion 3.08 ± 1.89Aab 10.20 ± 1.38Aab 10.30 ± 1.99Aab 1.51 ± 0.74Ab 12.35 ± 9.34ab 20.40 ± 4.63a
54% Unprocessed VitC -4.68 ± 1.79A -4.68 ± 1.79A -4.68 ± 1.79A -4.68 ± 1.79B -4.68 ± 1.79 -4.68 ± 1.79
Physical mixtures -2.38 ± 6.99A 0.10 ± 7.41A 1.30 ± 7.06A -8.55 ± 2.95B * *
Dispersion 5.46 ± 2.16Aa 11.56 ± 2.76Aa 6.55 ± 4.78Aa 3.79 ± 0.22Aa 2.89 ± 12.83a 19.34 ± 3.36a
75% Unprocessed VitC -2.33 ± 0.87A -2.33 ± 0.87B -2.33 ± 0.87A -2.33 ± 0.87A -2.33 ± 0.87 -2.33 ± 0.87
Physical mixtures -2.39 ± 5.86A -3.03 ± 0.52B 8.28 ± 4.93A 7.39 ± 4.35A * *
Dispersion 17.89 ± 6.84Aa 14.18 ± 3.50Aa 6.81 ± 6.41Aa 7.41 ± 1.35Aa 15.47 ± 10.85a 10.31 ± 1.05a
ABrepresent statistical difference between systems at specific %RHs (down a column separated by lines)
abc represent statistical difference between polymer types in the physical mixtures or dispersion (across a row)
*Data collection will be completed
153

Table 4.7. The %VitC loss of various systems stored at 40oC and specified %RHs after 10 weeks
Types of
polymer System
%VitC lost at specified %RHs
0 23 54 75
None Unprocessed 4.99 ± 2.16
Aa -3.71 ± 1.46
Ca -1.78 ± 2.22
Ca -2.89 ± 0.74
Ea
Freeze dried 1.61 ± 4.334Aa
-3.26 ± 5.32Ca
-2.75 ± 2.38Ca
-0.45 ± 3.73DEa
CT Physical mixtures -2.91 ± 3.86
Ab -0.03 ± 0.51
BCb 6.56 ± 2.32
ABCab 14.36 ± 7.00BCD
Ea
Dispersion -4.29 ± 4.91Ab
1.71 ± 6.47ACDab
9.66 ± 0.82Bab
24.82 ± 7.59BCa
AP Physical mixtures 6.52 ± 8.97
Aa 10.08 ± 1.60
Aa 13.35 ± 6.22
ABCa 16.66 ± 0.03BC
Da
Dispersion 2.17 ± 1.57Ab
2.32 ± 0.42ACDb
12.75 ± 3.43ABb
33.62 ± 6.76Ba
EST Physical mixtures 4.58 ± 2.22
Aa 4.18 ± 0.92
ABCa 6.88 ± 0.30A
BCa 10.75 ± 7.39
CDEa
Dispersion -1.87 ± 1.75Ab
-1.07 ± 1.51BCb
18.68 ± 1.62Aa
16.28 ± 4.00BCDEa
K Physical mixtures 1.25 ± 0.51
Aa 9.10 ± 4.61
ABCa 9.62 ± 8.88
ABCa 20.54 ± 4.93
BCa
Dispersion 1.00 ± 2.60Ac
3.55 ± 1.80ABCc
14.80 ± 1.2ABb
62.78 ± 1.34Aa
PVP Physical mixtures * * * *
Dispersion 5.76 ± 6.06Aa
10.57 ± 5.90ABa
7.30 ± 4.22ABCa
18.62 ± 3.96BCa
PAA Physical mixtures * * * *
Dispersion 8.03 ± 4.05Ab
4.23 ± 1.36ABCDb
5.53 ± 3.18ABCb
30.98 ± 2.44Ba
ab represent statistical difference between %RHs in a sample (across a row)
ABCD represent statistical difference between systems and polymer types (down a column)
Red writing represents physical mixtures or solid dispersions that statistically underwent higher VitC degradation
Yellow highlight represents solid dispersions that statistically underwent higher VitC degradation than physical mixtures
*Data collection will be completed
154

Table 4.8. The %VitC loss of various systems stored at 25oC at specified polymer types and %RHs after 10
%RH System %VitC lost in the dispersion formed with specified polymer types
CT AP EST K PVP PAA
0% Unprocessed VitC 4.99 ± 2.16A 4.99 ± 2.17A 4.99 ± 2.18A 4.99 ± 2.19A 4.99 ± 2.20 4.99 ± 2.21
Physical mixtures -2.91 ± 3.86A 6.52 ± 8.97A 4.58 ± 2.22A 1.25 ± 0.51A * *
Dispersion 1.61 ± 4.33Aa 2.17 ± 1.57Aa -1.87 ± 1.75Aa 1.00 ± 2.60Aa 5.76 ± 6.06a 8.03 ± 4.05a
23% Unprocessed VitC -3.71 ± 1.46A -3.71 ± 1.47C -3.71 ± 1.48B -3.71 ± 1.49B -3.71 ± 1.50 -3.71 ± 1.51
Physical mixtures -0.03 ± 0.51A 10.08 ± 1.60A 4.18 ± 0.92A 17.85 ± 4.06A * *
Dispersion 1.71 ± 6.47Aa 2.32 ± 0.42Ba -1.07 ± 1.51ABa 3.55 ± 1.80ABa 10.57 ± 5.90a 4.23 ± 1.36a
54% Unprocessed VitC -1.78 ± 2.22B -1.78 ± 2.23B -1.78 ± 2.24C -1.78 ± 2.25A -1.78 ± 2.26 -1.78 ± 2.27
Physical mixtures 6.56 ± 2.32A 13.35 ± 6.22A 6.88 ± 0.30B 9.62 ± 8.88A * *
Dispersion 9.66 ± 0.82Aab 12.75 ± 3.43Aab 18.68 ± 1.62Aa 14.80 ± 1.22Aab 7.30 ± 4.22ab 5.53 ± 3.18b
75% Unprocessed VitC -2.89 ± 0.74B -2.89 ± 0.75C -2.89 ± 0.76B -2.89 ± 0.77C -2.89 ± 0.78 -2.89 ± 0.79
Physical mixtures 14.36 ± 7.00AB 16.66 ± 0.03B 10.75 ± 7.39AB 20.54 ± 4.93B * *
Dispersion 24.82 ± 7.59Ab 33.62 ± 6.76Ab 16.28 ± 4.00Ab 62.78 ± 1.34Aa 18.62 ± 3.96b 30.98 ± 2.44b
ABC represent statistical difference between systems at specific %RHs (down a column separated by lines)
abc represent statistical difference between polymer types in the physical mixtures or dispersion (across a row)
*Data collection will be completed
155

156
4.6.5 Discoloration of L-ascorbic acid (VitC) stored at various temperature and %RHs
overtime
Minimal a*value change over time was observed in the pure, unprocessed
crystalline VitC when stored at all studied temperatures and %RHs (Fig 4.14). A slight
decrease in a*value were observed in week 2 then it remained constant up to 6 weeks.
(Fig 14a,b). Storage %RHs at both temperatures did not result in significant (p>0.05)
a*value change after 8 weeks of storage (Table 4.9, Table 4.11). In contrast, significant
increase (p<0.05) in b* value was observed at week 8 for the VitC that was stored at
54%RH and 75%RH, 40oC (Fig 4.15a,b, Table 4.8). Similar observation in freeze dried
VitC was also seen in which the changes in b*value were more distinct over time than the
changes in the a*value. The increases in b*value but not in a* indicated that as
storage %RHs increased (below the %RHo), the yellow discolorations were more
noticeable in VitC.
No significant b*value (p>0.05) change was observed between the VitC and FD
VitC after 8 weeks of storage (Table 4.7, Table 4.8). However, at the storage temperature
of 25oC, where the discoloration kinetics was slower than at 40
oC, the b*value of FD
VitC decreased after 2 weeks of storage (Fig 4.11). Freeze drying process did not
eliminate the crystalline physical structure of VitC since both unprocessed VitC and FD
VitC were XRPD crystalline (Fig 4.1). However, freeze drying disrupted the ordered
crystalline lattice in unprocessed VitC (Fig 4.13). The different b*value discoloration
trend between unprocessed VitC and FD VitC implied that VitC crystal lattice geometry
effects the types of degradation byproducts of VitC.
Fig 4.13. Polarized light microscope images of (a) unprocessed crystalline VitC, (b) FD
VitC
(b) (a)

157
Fig 4.14. Hunter colorimeter Δa*value of unprocessed crystalline VitC stored at (a) 25oC
(b) 40oC and freeze dried VitC stored at (c) 25
oC (d) 40
oC
Fig 4.15. Hunter colorimeter Δb*value of unprocessed VitC stored at (a) 25oC (b) 40
oC
and freeze dried VitC stored at (c) 25oC (d) 40
oC

158
The discoloration of VitC in physical mixtures was observed, especially when
stored at high %RHs. Slight increases in a* value were observed in all types of physical
mixtures when stored at 0%, 23%, and 54%RHs, both at 25oC and 40
oC over time (Fig
4.16a, 4.16b, 4.16c , 4.18a, 4.18b, 4.18c). When the physical mixtures statistically
analyzed at specific %RHs without differentiating the types of polymer used in the
dispersion, the increase of redness in the physical mixtures with all types of pectin were
significantly higher (p<0.05) than VitC alone when stored at 23%RH, at both
temperatures (Table 4.7, Table 4.11). The physical mixtures with PVP were significantly
(p<0.05) more red than VitC when stored at 23%RH, 25oC, while the physical mixtures
with PAA had significantly higher a* values when stored at 23%, 40oC. This indicated
that the presence of polymer in the system increased the discoloration of the system,
increasing the redness. The statistically significant (p<0.05) increase in the redness of the
physical mixtures as compared to initial VitC were more apparent when the statistical
analysis were done with at specific %RHs and polymer types (Table 4.10, Table 4.12).
The significantly higher (p<0.04) a*value were not only observed at 23%RH, but also in
other storage %RHs, at both 25oC and 40
oC.
In contrast, the discoloration of the solid dispersions did not uniformly resulted in
the increase of a*value when stored at various temperatures and %RHs. Some of the
dispersion underwent discoloration to a lower a*value indicating that the greenness of the
sample was increased. Below 23%RH storage, minimal discoloration was observed in the
dispersion overtime at both temperatures (Fig 16e, 16f, Fig 18e, 18f). No significant
(p>0.05) differences in a*values were observed after 8 weeks of storage at 0 and 23%RH,
at both temperatures (Table 4.9, Table 4.11) than pure VitC when statistical analysis were
done at a specific %RHs, except for the dispersions formed with K which had
significantly higher color change to green color. At 54%RH, 25oC, the a*value of the
dispersions formed with all types of polymer decreased over time (Fig 4.16g) and the
dispersions formed with all types of pectin were significantly lower than the VitC after 8
weeks of storage (Table 4.9). At 75%RH, 25oC, the a*value decreased until week 4 or 6,
depending on the types of polymer, before an increase was observed at week 8 (Fig
4.16h). Similar observations were seen when the dispersions were stored at 54%RH,
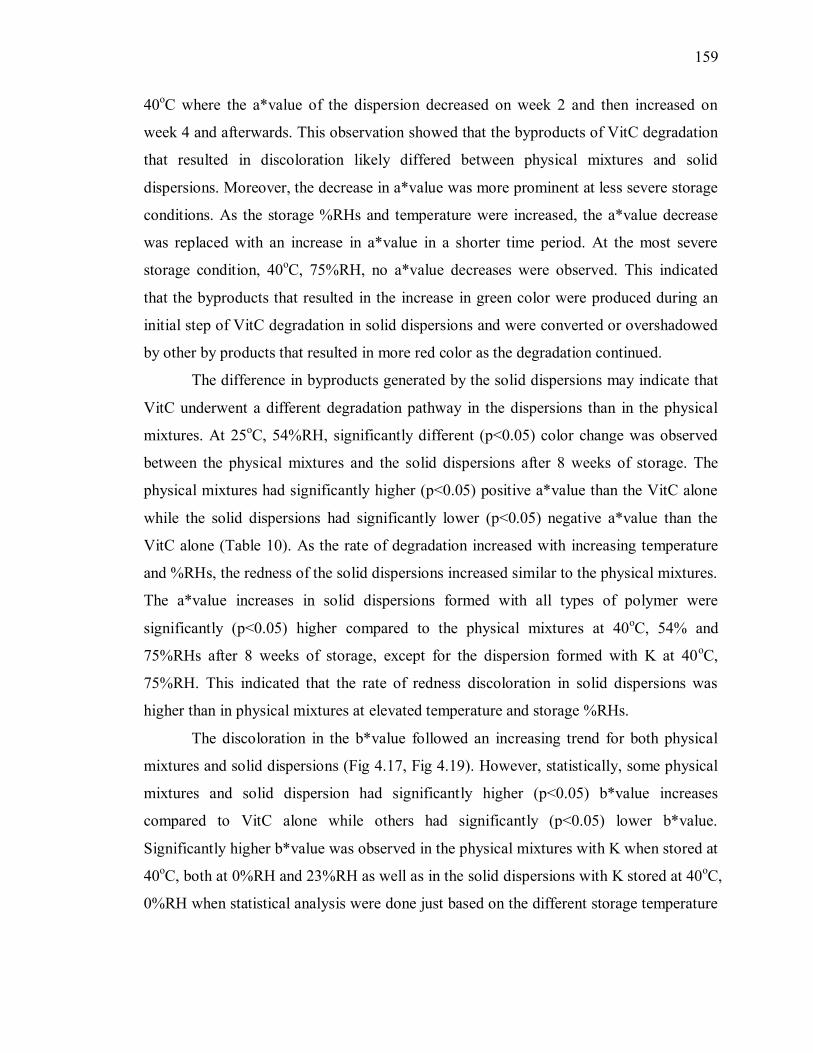
159
40oC where the a*value of the dispersion decreased on week 2 and then increased on
week 4 and afterwards. This observation showed that the byproducts of VitC degradation
that resulted in discoloration likely differed between physical mixtures and solid
dispersions. Moreover, the decrease in a*value was more prominent at less severe storage
conditions. As the storage %RHs and temperature were increased, the a*value decrease
was replaced with an increase in a*value in a shorter time period. At the most severe
storage condition, 40oC, 75%RH, no a*value decreases were observed. This indicated
that the byproducts that resulted in the increase in green color were produced during an
initial step of VitC degradation in solid dispersions and were converted or overshadowed
by other by products that resulted in more red color as the degradation continued.
The difference in byproducts generated by the solid dispersions may indicate that
VitC underwent a different degradation pathway in the dispersions than in the physical
mixtures. At 25oC, 54%RH, significantly different (p<0.05) color change was observed
between the physical mixtures and the solid dispersions after 8 weeks of storage. The
physical mixtures had significantly higher (p<0.05) positive a*value than the VitC alone
while the solid dispersions had significantly lower (p<0.05) negative a*value than the
VitC alone (Table 10). As the rate of degradation increased with increasing temperature
and %RHs, the redness of the solid dispersions increased similar to the physical mixtures.
The a*value increases in solid dispersions formed with all types of polymer were
significantly (p<0.05) higher compared to the physical mixtures at 40oC, 54% and
75%RHs after 8 weeks of storage, except for the dispersion formed with K at 40oC,
75%RH. This indicated that the rate of redness discoloration in solid dispersions was
higher than in physical mixtures at elevated temperature and storage %RHs.
The discoloration in the b*value followed an increasing trend for both physical
mixtures and solid dispersions (Fig 4.17, Fig 4.19). However, statistically, some physical
mixtures and solid dispersion had significantly higher (p<0.05) b*value increases
compared to VitC alone while others had significantly (p<0.05) lower b*value.
Significantly higher b*value was observed in the physical mixtures with K when stored at
40oC, both at 0%RH and 23%RH as well as in the solid dispersions with K stored at 40
oC,
0%RH when statistical analysis were done just based on the different storage temperature
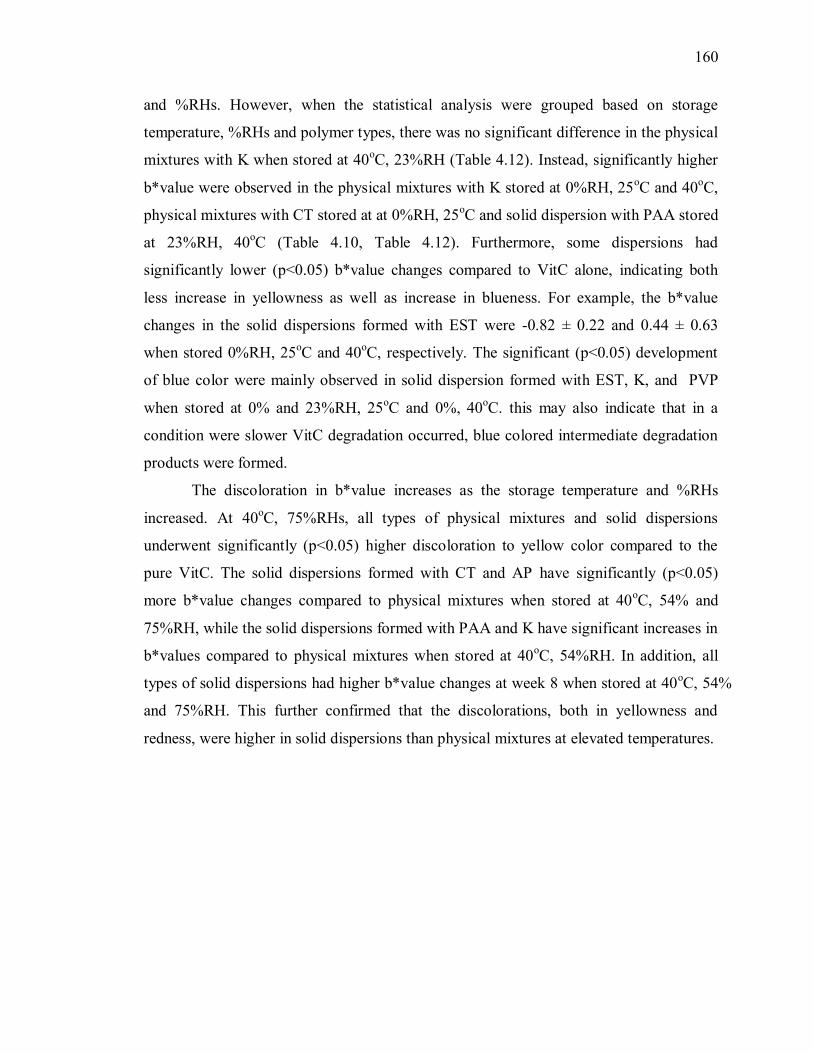
160
and %RHs. However, when the statistical analysis were grouped based on storage
temperature, %RHs and polymer types, there was no significant difference in the physical
mixtures with K when stored at 40oC, 23%RH (Table 4.12). Instead, significantly higher
b*value were observed in the physical mixtures with K stored at 0%RH, 25oC and 40
oC,
physical mixtures with CT stored at at 0%RH, 25oC and solid dispersion with PAA stored
at 23%RH, 40oC (Table 4.10, Table 4.12). Furthermore, some dispersions had
significantly lower (p<0.05) b*value changes compared to VitC alone, indicating both
less increase in yellowness as well as increase in blueness. For example, the b*value
changes in the solid dispersions formed with EST were -0.82 ± 0.22 and 0.44 ± 0.63
when stored 0%RH, 25oC and 40
oC, respectively. The significant (p<0.05) development
of blue color were mainly observed in solid dispersion formed with EST, K, and PVP
when stored at 0% and 23%RH, 25oC and 0%, 40
oC. this may also indicate that in a
condition were slower VitC degradation occurred, blue colored intermediate degradation
products were formed.
The discoloration in b*value increases as the storage temperature and %RHs
increased. At 40oC, 75%RHs, all types of physical mixtures and solid dispersions
underwent significantly (p<0.05) higher discoloration to yellow color compared to the
pure VitC. The solid dispersions formed with CT and AP have significantly (p<0.05)
more b*value changes compared to physical mixtures when stored at 40oC, 54% and
75%RH, while the solid dispersions formed with PAA and K have significant increases in
b*values compared to physical mixtures when stored at 40oC, 54%RH. In addition, all
types of solid dispersions had higher b*value changes at week 8 when stored at 40oC, 54%
and 75%RH. This further confirmed that the discolorations, both in yellowness and
redness, were higher in solid dispersions than physical mixtures at elevated temperatures.
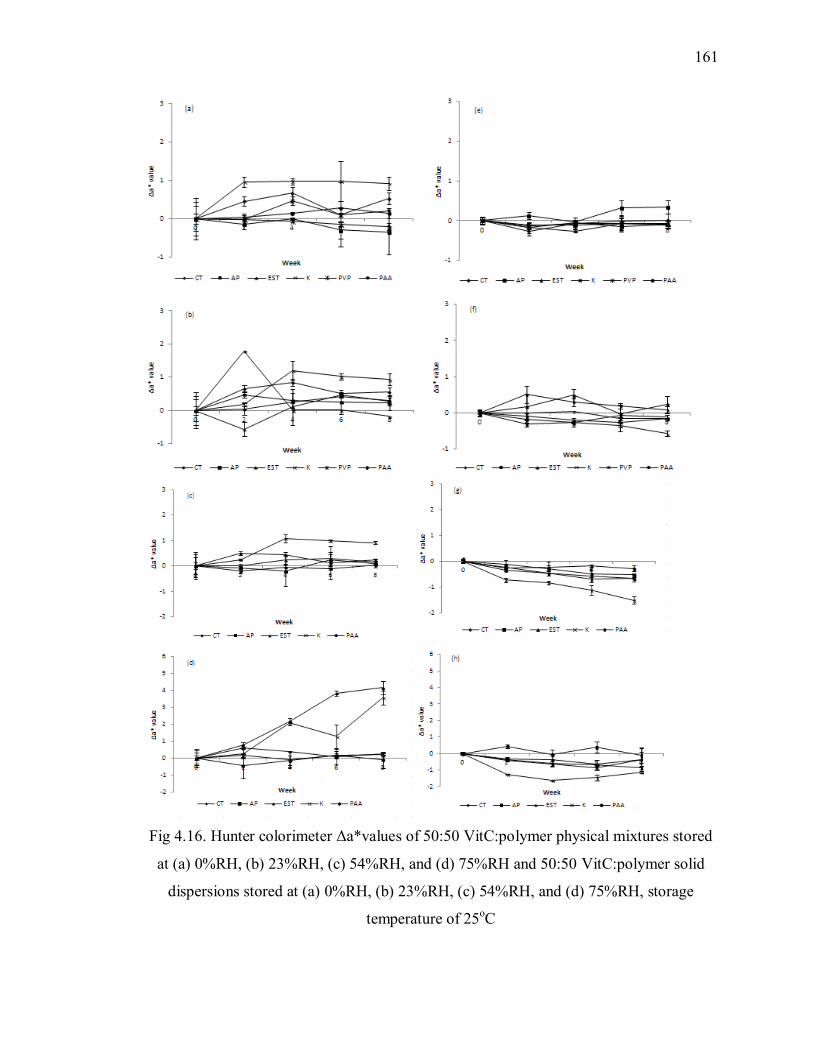
161
Fig 4.16. Hunter colorimeter Δa*values of 50:50 VitC:polymer physical mixtures stored
at (a) 0%RH, (b) 23%RH, (c) 54%RH, and (d) 75%RH and 50:50 VitC:polymer solid
dispersions stored at (a) 0%RH, (b) 23%RH, (c) 54%RH, and (d) 75%RH, storage
temperature of 25oC

162
Fig 4.17. Hunter colorimeter Δb*values of 50:50 VitC:polymer physical mixtures stored
at (a) 0%RH, (b) 23%RH, (c) 54%RH, and (d) 75%RH and 50:50 VitC:polymer solid
dispersions stored at (a) 0%RH, (b) 23%RH, (c) 54%RH, and (d) 75%RH, storage
temperature of 25oC

163
Fig 4.18. Hunter colorimeter Δa*values of 50:50 VitC:polymer physical mixtures stored
at (a) 0%RH, (b) 23%RH, (c) 54%RH, and (d) 75%RH and 50:50 VitC:polymer solid
dispersions stored at (a) 0%RH, (b) 23%RH, (c) 54%RH, and (d) 75%RH, storage
temperature of 40oC

164
Fig 4.19. Hunter colorimeter Δb*value of 50:50 VitC:polymer physical mixtures stored at
(a) 0%RH, (b) 23%RH, (c) 54%RH, and (d) 75%RH and 50:50 VitC:polymer solid
dispersions stored at (a) 0%RH, (b) 23%RH, (c) 54%RH, and (d) 75%RH, storage
temperature of 40oC

Table 4.9. Change in a*values of various systems stored at 25oC and specified %RHs after 8 weeks
Types of
polymer System
a* value increase at specified %RHs
0 23 54 75
None Unprocessed -0.25±0.02DEa -0.19 ± 0.03Da -0.21 ± 0.02CDa -0.27 ± 0.02BCDa
Freeze dried -0.17 ± 0.01DEa 0.12 ± 0.13CDb -0.18 ± 0.04Dc -0.15 ± 0.06BCb
CT Physical mixtures 0.52 ± 0.15ABab 0.57 ± 0.11Ba 0.22 ± 0.06Bc 0.27 ± 0.06Bbc
Dispersion 0.02 ± 0.16 BCDEa 0.08 ± 0.10CDa -0.66 ± 0.13Fa -0.38 ± 0.68BCDa
AP Physical mixtures -0.35 ± 0.58Ea 0.23 ± 0.22Ca 0.09 ± 0.15Ba -0.11 ± 0.48BCa
Dispersion 0.34 ± 0.16BCa 0.24 ± 0.22BCa -0.53 ± 0.06EFb -0.12 ± 0.46BCab
EST Physical mixtures 0.20 ± 0.17BDCa 0.28 ± 0.10BCa 0.15 ± 0.04Ba 0.21 ± 0.06Ba
Dispersion -0.10 ± 0.09CDEa -0.11 ± 0.05Da -0.67 ± 0.03Fb -0.87 ± 0.09CDc
K Physical mixtures 0.91 ± 0.06Ab 0.94 ± 0.19Ab 0.91 ± 0.06Ab 3.58 ± 0.41Aa
Dispersion -0.11 ± 0.08CDEa -0.57 ± 0.08Eb -1.51 ± 0.13Gd -1.12 ± 0.07Dc
PVP Physical mixtures 0.42 ± 0.09ABCb 0.35 ± 0.12BCa n.d n.d
Dispersion -0.06 ± 0.08CDEa -0.15 ± 0.04Da n.d n.d
PAA Physical mixtures 0.14 ± 0.14BCDEa 0.29 ± 0.14CDa 0.03 ± 0.02BCa -0.31 ± 0.13BCDb
Dispersion -0.10 ± 0.08CDEa -0.16 ± 0.02Da -0.29 ±0.12EDa -0.36 ± 0.43BCDa
abc represent statistical difference between %RHs in a sample (across a row) ABCDEFG represent statistical difference between systems and polymer types (down a column) Red writing represents freeze dried VitC, physical mixtures or solid dispersions that statistically have higher a*value change at week 8 than unprocessed VitC Blue writing represents freeze dried VitC, physical mixtures or solid dispersions that statistically have lower a*value change at week 8 than unprocessed VitC
Yellow highlight represents the solid dispersions that were statistically become more red (higher increased a*value) at week 8 than the initial color compared to the physical mixtures Gray highlight represents solid dispersions that statistically become more green or less red (decrease in a*value or lower increase in a*value) at week 8 than the initial color compared to the physical mixtures
The a* value of physical mixtures and solid dispersions formed with PVP stored at 54% and 75%RH could not be measured due to the conversion of
powdered solid to viscous, glassy gel 165

Table 4.10. Change in a*values of various systems stored at 25oC at specified polymer types and %RHs after 8 weeks
abc represent statistical difference between polymer types in the physical mixtures or dispersion (across a row)
The a* value of physical mixtures and solid dispersions formed with PVP stored at 54% and 75%RH could not be measured due to the conversion of
powdered solid to viscous, glassy gel
Negative number indicate increase in greenness, positive number indicate increase in redness than the initial samples prior storage treatment ABC represent statistical difference between systems at specific %RHs (down a column separated by lines)
%RH System a* value increase at specified polymer types
CT AP EST K PVP PAA
0% Unprocessed VitC -0.25±0.03AB -0.25±0.03A -0.25±0.03B -0.25±0.03B -0.25±0.03B -0.25±0.03C
Physical mixtures 0.52 ± 0.15Aab -0.35 ± 0.58Ac 0.20 ± 0.17Abc 0.91 ± 0.06Aa 0.42 ± 0.03Aab 0.14 ± 0.14Abc
Dispersion 0.02 ± 0.16Bb 0.34 ± 0.16Aa -0.10 ± 0.09Bb -0.11 ± 0.08Bb -0.06 ± 0.08Bb -0.10 ± 0.08Bb
23% Unprocessed VitC -0.19 ± 0.03C -0.19 ± 0.03A -0.19 ± 0.03B -0.19 ± 0.03B -0.19 ± 0.03B -0.19 ± 0.03B
Physical mixtures 0.57 ± 0.11Ab 0.23 ± 0.22Ac 0.28 ± 0.10Abc 0.94 ± 0.19Aa 0.35 ± 0.12Abc 0.29 ± 0.14Ac
Dispersion 0.08 ± 0.10Bab 0.24 ± 0.22Aa -0.11 ± 0.05Bb -0.57 ± 0.08Cc -0.15 ± 0.04Bb -0.16 ± 0.02Bb
54% Unprocessed VitC 3.20 ± 0.19B 3.20 ± 0.20B 3.20 ± 0.21A 3.20 ± 0.22C 3.20 ± 0.23 3.20 ± 0.24B
Physical mixtures 2.52 ± 0.87Bb 2.10 ± 0.40Bb 1.68 ± 0.25Bb 11.80 ± 0.17Ba n.d 1.64 ± 0.12bb
Dispersion 14.86 ± 0.17Aa 19.49 ± 0.23Aa 3.34 ± 0.40Ab 19.61 ± 5.65Aa n.d 15.19 ± 3.00Aa
75% Unprocessed VitC -0.27 ± 0.02A -0.27 ± 0.02A -0.27 ± 0.02B -0.27 ± 0.02B -0.27 ± 0.02 -0.27 ± 0.02A
Physical mixtures 0.27 ± 0.06Ab -0.11 ± 0.48Ab 0.21 ± 0.06Ab 3.58 ± 0.41Aa n.d -0.31 ± 0.13Ab
Dispersion -0.38 ± 0.68Aa -0.12 ± 0.46Aa -0.87 ± 0.09Ca -1.12 ± 0.07Ca n.d -0.36 ± 0.43Aa
166

Table 4.11. Change in a*values of various systems stored at 40oC and specified %RHs after 8 weeks
Types of
polymer System
a* value increase at specified %RHs
0 23 54 75
None Unprocessed 0.17 ± 0.02Da -0.36 ± 0.04Fb 0.07 ± 0.03Ga -0.17 ± 0.11GFa
Freeze dried 0.08 ± 0.04Da -0.30 ± 0.14EFab 0.32 ± 0.21EFGa -0.72 ± 0.02Gb
CT Physical mixtures 0.77 ± 0.18ABb 0.54 ± 0.26BCb 0.59 ± 0.17EFGb 2.59 ± 0.21DEFa
Dispersion 0.03 ± 0.06CDb -0.38 ± 0.14Fb 3.13 ± 0.25BCa 3.35 ± 0.41CDEa
AP Physical mixtures -0.17 ± 0.65Da 0.38 ± 0.18BCDa 1.75 ± 0.19CDEa 0.72 ± 3.08EFGa
Dispersion 0.68 ± 0.48ABCb -0.09 ± 0.60CDEFb 2.71 ± 0.44BCDa 3.52 ± 0.59CDEa
EST Physical mixtures 0.70 ± 0.18ABCa 0.97 ± 0.04ABa 0.71 ± 0.04DEFGa 0.97 ± 0.24DEFGa
Dispersion -0.33 ± 0.15Db -0.43 ± 0.07Fb 1.39 ± 0.03DEFa 0.56 ± 0.78EFGab
K Physical mixtures 1.18 ± 0.17Ab 1.36 ± 0.16Ab 2.33 ± 0.12BCDb 12.44 ± 1.85Aa
Dispersion -0.21 ± 0.06Db -1.51 ± 0.26Fb 4.79 ± 1.55Aa 6.93 ± 1.33Ba
PVP Physical mixtures -0.22 ± 0.03Da 0.35 ± 0.03DEFa n.d n.d
Dispersion -0.19 ± 0.03Da -0.54 ± 0.1Fb n.d n.d
PAA Physical mixtures 0.13 ± 0.05BCDb 0.04 ± 0.09CDEb 0.03 ± 0.04FGb 4.16 ± 0.37BCDa
Dispersion -0.19 ± 0.08Dc -0.50 ± 0.04Fc 3.64 ± 0.83ABb 6.21 ± 0.20BCa
abc represent statistical difference between %RHs in a sample (across a row) ABCDEFG represent statistical difference between systems and polymer types (down a column)
Red writing represents freeze dried VitC, physical mixtures or solid dispersions that statistically have higher a*value change at week 8 than unprocessed
VitC
Yellow highlight represents the solid dispersions that were statistically become more red (higher increased a*value) at week 8 than the initial color
compared to the physical mixtures
Gray highlight represents solid dispersions that statistically become more green or less red (decrease in a*value or lower increase in a*value) at week 8
than the initial color compared to the physical mixtures
The a* value of physical mixtures and solid dispersions formed with PVP stored at 54% and 75%RH could not be measured due to the conversion of
powdered solid to viscous, glassy gel 167
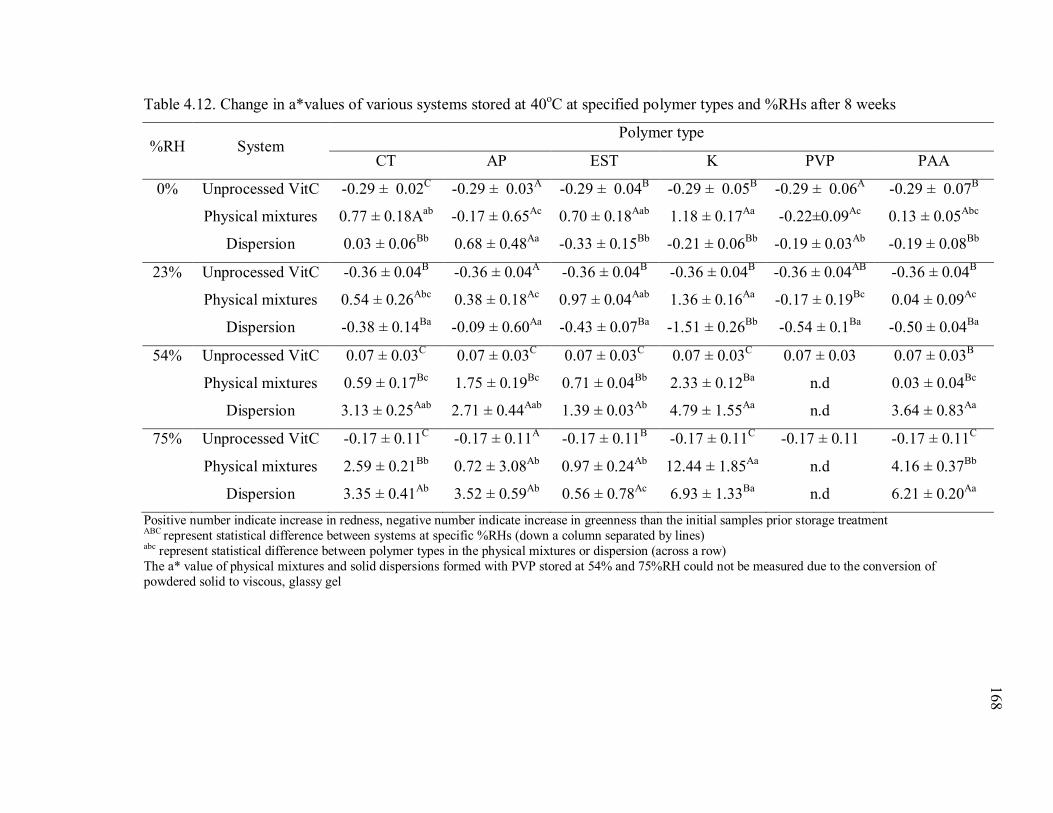
Table 4.12. Change in a*values of various systems stored at 40oC at specified polymer types and %RHs after 8 weeks
%RH System Polymer type
CT AP EST K PVP PAA
0% Unprocessed VitC -0.29 ± 0.02C -0.29 ± 0.03
A -0.29 ± 0.04
B -0.29 ± 0.05
B -0.29 ± 0.06
A -0.29 ± 0.07
B
Physical mixtures 0.77 ± 0.18Aab
-0.17 ± 0.65Ac
0.70 ± 0.18Aab
1.18 ± 0.17Aa
-0.22±0.09Ac
0.13 ± 0.05Abc
Dispersion 0.03 ± 0.06Bb
0.68 ± 0.48Aa
-0.33 ± 0.15Bb
-0.21 ± 0.06Bb
-0.19 ± 0.03Ab
-0.19 ± 0.08Bb
23% Unprocessed VitC -0.36 ± 0.04B -0.36 ± 0.04
A -0.36 ± 0.04
B -0.36 ± 0.04
B -0.36 ± 0.04
AB -0.36 ± 0.04
B
Physical mixtures 0.54 ± 0.26Abc
0.38 ± 0.18Ac
0.97 ± 0.04Aab
1.36 ± 0.16Aa
-0.17 ± 0.19Bc
0.04 ± 0.09Ac
Dispersion -0.38 ± 0.14Ba
-0.09 ± 0.60Aa
-0.43 ± 0.07Ba
-1.51 ± 0.26Bb
-0.54 ± 0.1Ba
-0.50 ± 0.04Ba
54% Unprocessed VitC 0.07 ± 0.03C 0.07 ± 0.03
C 0.07 ± 0.03
C 0.07 ± 0.03
C 0.07 ± 0.03 0.07 ± 0.03
B
Physical mixtures 0.59 ± 0.17Bc
1.75 ± 0.19Bc
0.71 ± 0.04Bb
2.33 ± 0.12Ba
n.d 0.03 ± 0.04Bc
Dispersion 3.13 ± 0.25Aab
2.71 ± 0.44Aab
1.39 ± 0.03Ab
4.79 ± 1.55Aa
n.d 3.64 ± 0.83Aa
75% Unprocessed VitC -0.17 ± 0.11C -0.17 ± 0.11
A -0.17 ± 0.11
B -0.17 ± 0.11
C -0.17 ± 0.11 -0.17 ± 0.11
C
Physical mixtures 2.59 ± 0.21Bb
0.72 ± 3.08Ab
0.97 ± 0.24Ab
12.44 ± 1.85Aa
n.d 4.16 ± 0.37Bb
Dispersion 3.35 ± 0.41Ab
3.52 ± 0.59Ab
0.56 ± 0.78Ac
6.93 ± 1.33Ba
n.d 6.21 ± 0.20Aa
Positive number indicate increase in redness, negative number indicate increase in greenness than the initial samples prior storage treatment ABC represent statistical difference between systems at specific %RHs (down a column separated by lines) abc represent statistical difference between polymer types in the physical mixtures or dispersion (across a row)
The a* value of physical mixtures and solid dispersions formed with PVP stored at 54% and 75%RH could not be measured due to the conversion of
powdered solid to viscous, glassy gel
168

Table 4.13. Change in b*values of various systems stored at 25oC and specified %RHs after 8 weeks
Types of
polymer System
b* value increase at specified %RHs
0 23 54 75
None Unprocessed 1.20 ± 0.10ABCa 1.40 ± 0.07ABCa 1.83 ± 0.15ABCDa 1.73 ± 0.27Da
Freeze dried -0.30 ± 0.08CDEc 0.10 ± 0.34CDEbc 1.00 ± 0.14DEb 4.11 ± 0.26CDa
CT Physical mixtures 2.57 ± 0.50ABa 2.19 ± 0.41ABa 0.15 ± 0.07BCDEb 0.80 ± 0.19Db
Dispersion -0.47 ± 1.48CDEb 0.49 ± 0.17CDEb 2.52 ± 0.85Ab 8.16 ± 3.49Ba
AP Physical mixtures -0.64 ± 2.03CDEa -0.05 ± 0.67CDEFa -0.98 ± 0.27DEa -0.16 ± 1.13Da
Dispersion 0.35 ± 0.76BCDEb 0.74 ± 0.69BCb 0.61 ± 0.31ABCDb 6.45 ± 1.89BCa
EST Physical mixtures 0.96 ± 0.43BCDa 1.23 ± 0.46ABCa -0.56 ± 0.57CDEb 0.33 ± 0.22Dab
Dispersion -0.91 ± 0.55CDEab -0.82 ± 0.22DEFGab -1.9 ± 0.33Eb 0.67 ± 1.04Da
K Physical mixtures 3.5 ± 0.21Ab 2.48 ± 0.18Ab 1.81 ± 0.18ABb 16.18 ± 3.00Aa
Dispersion -1.90 ± 0.38CDEbc -2.82 ± 1.04Hc 0.56 ± 1.80ABCDb 8.88 ± 1.21Ba
PVP Physical mixtures -1.21 ± 0.15EDa -0.96 ± 0.21EFGa n.d n.d
Dispersion -0.58 ± 0.08CDEa -1.50 ± 0.74FGHa n.d n.d
PAA Physical mixtures -0.21 ± 0.12CDEc 0.68 ± 0.06Cb 0.71 ± 0.27ABCDb 4.36 ± 0.51BCDa
Dispersion 0.75 ± 0.61BCDb 0.52 ± 0.46CDb 1.45 ± 1.35ABCb 7.32 ± 1.73Ba
abc represent statistical difference between %RHs in a sample (across a row) ABCDEFGH represent statistical difference between systems and polymer types (down a column) Red writing represents freeze dried VitC, physical mixtures or solid dispersions that statistically have higher b*value change at week 8 than unprocessed VitC Blue writing represents freeze dried VitC, physical mixtures or solid dispersions that statistically have lower b*value change at week 8 than unprocessed VitC
Yellow highlight represents the solid dispersions that were statistically become more yellow (higher increased b*value) at week 8 than the initial color compared to the physical mixtures Gray highlight represents solid dispersions that statistically become more green or less yellow (decrease in b*value or lower increase in a*value) at week 8 than the initial color compared to the physical mixtures The b* value of physical mixtures and solid dispersions formed with PVP stored at 54% and 75%RH could not be measured due to the conversion of powdered solid to viscous, glassy gel
169

Table 4.14. Change in b*values of various systems stored at 25oC at specified polymer types and %RHs after 8 weeks
%RH System b* value increase at specified polymer types
CT AP EST K PVP PAA
0% Unprocessed VitC 1.20 ± 0.10AB 1.20 ± 0.11A 1.20 ± 0.12A 1.20 ± 0.13B 1.20 ± 0.14A 1.20 ± 0.15A
Physical mixtures 2.57 ± 0.50Aab -0.64 ± 2.03Ac 0.96 ± 0.43Abc 3.5 ± 0.21Aa -1.21 ± 0.15Cc -0.21 ± 0.12Bc
Dispersion -0.47 ± 1.48Bab 0.35 ± 0.76Aa -0.91 ± 0.55Bab -1.90 ± 0.38Cb -0.58 ± 0.08Bab 0.75 ± 0.61ABa
23% Unprocessed VitC 1.40 ± 0.07B 1.40 ± 0.08A 1.40 ± 0.09A 1.40 ± 0.10A 1.40 ± 0.11A 1.40 ± 0.12A
Physical mixtures 2.19 ± 0.41Aab -0.05 ± 0.67Bde 1.23 ± 0.46Abc 2.48 ± 0.18Aa -0.96 ± 0.21Be 0.68 ± 0.06Bcd
Dispersion 0.49 ± 0.17Ca 0.74 ± 0.69ABa -0.82 ± 0.22Bab -2.82 ± 1.04Bc -1.50 ± 0.74Bbc 0.52 ± 0.46Ba
54% Unprocessed VitC 1.17 ± 0.15B 1.17 ± 0.15A 1.17 ± 0.15A 1.17 ± 0.15A 1.17 ± 0.15 1.17 ± 0.15A
Physical mixtures 0.15 ± 0.07Bbc -0.98 ± 0.27Bd -0.56 ± 0.57Bcd 1.81 ± 0.18Aa n.d 0.71 ± 0.27Ab
Dispersion 2.52 ± 0.85Aa 0.61 ± 0.31Aab -1.9 ± 0.33Cb 0.56 ± 1.80Aab n.d 1.45 ± 1.35Aa
75% Unprocessed VitC 1.73 ± 0.27B 1.73 ± 0.28B 1.73 ± 0.29A 1.73 ± 0.30C 1.73 ± 0.31 1.73 ± 0.32C
Physical mixtures 0.80 ± 0.19Bbc -0.16 ± 1.13Bc 0.33 ± 0.22Ac 16.18 ± 3.00Aa n.d 4.36 ± 0.51Bb
Dispersion 8.16 ± 3.49Aa 6.45 ± 1.89Aa 0.67 ± 1.04Ab 8.88 ± 1.21Ba n.d 7.32 ± 1.73Aa
Positive number indicate increase in yellowness, negative number indicate increase in blueness than the initial samples prior storage treatment ABC represent statistical difference between systems at specific %RHs (down a column separated by lines) abc represent statistical difference between polymer types in the physical mixtures or dispersion (across a row)
The b* value of physical mixtures and solid dispersions formed with PVP stored at 54% and 75%RH could not be measured due to the conversion of
powdered solid to viscous, glassy gel
170
Table 4.15. Change in b*values of various systems stored at 40oC and specified %RHs after 8 weeks
Types of polymer System b* value increase at specified %RHs
0 23 54 75
None Unprocessed 2.55 ± 0.09Bc 2.38 ± 0.25DCc 3.20 ± 0.19DCa 4.33 ± 0.78DEb
Freeze dried 1.84 ± 0.15BCDc 3.05 ± 0.08Dc 8.64 ± 1.33DCa 5.11 ± 0.87Eb
CT Physical mixtures 2.09 ± 0.52ABb 1.8 ± 1.24BCDb 2.52 ± 0.87Db 12.50 ± 0.71Ca
Dispersion 0.81 ± 0.14BCDc 0.63 ± 0.90Dc 14.86 ± 0.17ABb 19.31 ± 1.21Ba
AP Physical mixtures -0.39 ± 2.57BCDb 0.66 ± 0.31Db 2.10 ± 0.40Db 9.02 ± 0.12Ca
Dispersion 1.96 ± 1.16ABb 1.96 ± 2.25BCDb 19.49 ± 0.23Aa 19.17 ± 2.12Ba
EST Physical mixtures 0.84 ± 0.78BCDb 2.05 ± 0.19BCDb 1.68 ± 0.25Db 8.45 ± 1.98CDa
Dispersion -1.83 ± 0.59Db 0.44 ± 0.63Dbc 3.34 ± 0.40Db 11.08 ± 3.17Ca
K Physical mixtures 4.60 ± 1.04Ac 4.79 ± 0.46ABCc 11.80 ± 0.17BCb 20.78 ± 2.65ABa
Dispersion -1.19 ± 0.39CDb 4.90 ± 2.43ABb 19.61 ± 5.65Aa 23.51 ± 2.41ABa
PVP Physical mixtures 0.83 ± 0.25BCDa 0.77 ± 0.44Da n.d n.d
Dispersion -0.48 ± 0.40BCDa 0.46 ± 0.45Da n.d n.d
PAA Physical mixtures 0.40 ± 0.55BCDb 0.52 ± 0.26Db 1.64 ± 0.12Db 20.67 ± 1.81ABa
Dispersion 1.04 ± 0.71BCd 6.55 ± 0.80Ac 15.19 ± 3.00ABb 24.66 ± 0.73Aa
abc represent statistical difference between %RHs in a sample (across a row) ABCDEFGH represent statistical difference between systems and polymer types (down a column) Red writing represents freeze dried VitC, physical mixtures or solid dispersions that statistically have higher b*value change at week 8 than unprocessed VitC Blue writing represents freeze dried VitC, physical mixtures or solid dispersions that statistically have lower b*value change at week 8 than unprocessed VitC
Yellow highlight represents the solid dispersions that were statistically become more yellow (higher increased b*value) at week 8 than the initial color compared to the physical mixtures Gray highlight represents solid dispersions that statistically become more green or less yellow (decrease in b*value or lower increase in a*value) at week 8 than the initial color compared to the physical mixtures The b* value of physical mixtures and solid dispersions formed with PVP stored at 54% and 75%RH could not be measured due to the conversion of
powdered solid to viscous, glassy gel 171

Table 4.16. Change in b*values of various systems stored at 40oC at specified polymer types and %RHs after 8 weeks
%RH System b* value increase at specified polymer types
CT AP EST K PVP PAA
0% Unprocessed VitC 1.84 ± 0.15A 1.84 ± 0.16A 1.84 ± 0.17A 1.84 ± 0.18B 1.84 ± 0.19A 1.84 ± 0.20A
Physical mixtures 2.09 ± 0.52Aab -0.39 ± 2.57Ab 0.84 ± 0.78Ab 4.60 ± 1.04Aa 0.83 ± 0.25Bb 0.40 ± 0.55Bb
Dispersion 0.81 ± 0.14Bab 1.96 ± 1.16Aa -1.83 ± 0.59Bc -1.19 ± 0.39Cc -0.48 ± 0.40Cbc 1.04 ± 0.71ABab
23% Unprocessed VitC 2.38 ± 0.25A 2.38 ± 0.26A 2.38 ± 0.27A 2.38 ± 0.28A 2.38 ± 0.29A 2.38 ± 0.30B
Physical mixtures 1.8 ± 1.24Ab 0.66 ± 0.31Ab 2.05 ± 0.19Ab 4.79 ± 0.46Aa 0.77 ± 0.44ABb 0.52 ± 0.26Bb
Dispersion 0.63 ± 0.90Ac 1.96 ± 2.25Abc 0.44 ± 0.63Bc 4.90 ± 2.43Aab 0.46 ± 0.45Bc 6.55 ± 0.80Aa
54% Unprocessed VitC 3.20 ± 0.19B 3.20 ± 0.20B 3.20 ± 0.21A 3.20 ± 0.22C 3.20 ± 0.23 3.20 ± 0.24B
Physical mixtures 2.52 ± 0.87Bb 2.10 ± 0.40Bb 1.68 ± 0.25Bb 11.80 ± 0.17Ba n.d 1.64 ± 0.12Cb
Dispersion 14.86 ± 0.17Aa 19.49 ± 0.23Aa 3.34 ± 0.40Ab 19.61 ± 5.65Aa n.d 15.19 ± 3.00Aa
75% Unprocessed VitC 4.33 ± 0.78C 4.33 ± 0.79C 4.33 ± 0.80B 4.33 ± 0.81B 4.33 ± 0.82 4.33 ± 0.83C
Physical mixtures 12.50 ± 0.71Bb 9.02 ± 0.12Bb 8.45 ± 1.98ABb 20.78 ± 2.65Aa n.d 20.67 ± 1.81Ba
Dispersion 19.31 ± 1.21Aa 19.17 ± 2.12Aa 11.08 ± 3.17Ab 23.51 ± 2.41Aa n.d 24.66 ± 0.73Aa
Positive number indicate increase in yellowness, negative number indicate increase in blueness than the initial samples prior storage treatment ABC represent statistical difference between systems at specific %RHs (down a column separated by lines) abc represent statistical difference between polymer types in the physical mixtures or dispersion (across a row)
The b* value of physical mixtures and solid dispersions formed with PVP stored at 54% and 75%RH could not be measured due to the conversion of
powdered solid to viscous, glassy gel
172

173
4.6.6 The relationship between %VitC loss and discoloration
In the presence of oxygen, VitC oxidizes to dehydroascorbic acid (DHAA) and
further converts to 2,3-diketo-L-gulonic acid (DKG) by the cleavage of the lactone ring
and the addition of a water molecule [1, 39]. The DKG is then converted to L-xylosone
followed by other oxidation, polymerization, and dehydration reactions to form various
end products. The degradation products of VitC were shown to result in discoloration
associated with non-enzymatic browning. More than 50 low molecular weight products
have been identified as VitC degradation products [1]. Furfural, one of the main
degradation products of VitC, especially at low acid conditions (pH<2)[39], may undergo
polymerization that results in the formation of a brown color melanodins pigment [40,
41]. Other carbonyl compounds formed as VitC degradation products, such as the α, β –
unsaturated carbonyls, were also shown to result in the browning of VitC [42]. Studies
have shown the correlation between VitC degradation and brown color formation [3, 43,
44].
The increases in %VitC losses in physical mixtures and solid dispersions
containing VitC and polymers were followed by increases in a* and b* values which
were clearly seen in the samples stored at 40oC, 75%RH. This observation confirmed that
as VitC degraded the brown color pigments were produced as a degradation product [43].
Moreover, the decreased in a*values (increase in green color) in the solid dispersions
stored at 25oC were also followed by the increase in %VitC lost. For example, a*value
changes in the dispersions formed with CT in 0, 23, 54, and 75%RH were 0.02 ± 0.16,
0.08 ± 0.10, -0.66 ± 0.13, and 0.38 ± 0.68, respectively, while the %VitC losses were -
4.89% ± 0.07%, 3.08% ± 1.89%, 5.46% ± 2.16% and 17.89% ± 6.84%, respectively. This
showed that the degradation of VitC in the solid dispersions resulted in the development
of green color. Further study would need to be done to identify the specific degradation
products and degradation mechanisms that resulted in the increase in the green color.
Color development was also observed in the physical mixtures and solid dispersions that
had minimal %VitC degradation as measured by the microplate reader assay. The
physical mixtures of CT (0.77 ± 0.18), EST (0.70 ± 0.18), and K (1.18 ± 0.17 ) had
significantly (p<0.05) higher a*value changes compared to crystalline VitC alone (0.17 ±

174
0.02) while there were no significant (p>0.05) %VitC loss differences between the
physical mixtures (CT, EST, and K: -2.91% ± 3.86%, 4.58% ± 2.22%, 1.25% ± 0.51%,
respectively) and VitC alone (4.99 ± 2.16) after 8 weeks of storage (40oC, 0%RH).
Although correlation between %VitC lost and discoloration were observed [3, 43, 44],
discoloration could not be used as a sole method in determining the VitC content. Instead,
the development of brown pigment can be used as an indicator of VitC degradation [10,
11]. In addition, color is an essential attribute for acceptability of a product and was
found to be related to the perception of other sensory attributes such as flavor and
sweetness [45, 46]. Therefore, it is essential to monitor the non-enzymatic browning of
VitC to ensure the acceptable appearance of a product.
4.6.7 Effects of physical forms and polymer types VitC chemical stability
The VitC in unprocessed VitC, FD VitC, and physical mixtures was present as a a
crystalline solid. Physical mixtures have higher VitC degradation and discoloration than
VitC alone, as previously discussed. Therefore, although the physical structure of VitC
was crystalline in these three sample types, the presence of a polymer in the system
resulted in higher VitC degradation and discoloration
At 0% and 23%RHs, the VitC in the solid dispersions was in the form of an
XRPD amorphous solid, but the VitC crystallized in the dispersions when they were
stored at 54% and 75%RH within 1 week. An exception was found in the dispersion
formed with PAA which immediately crystallized upon formation. Therefore, during the
time period of chemical analysis, the solid dispersions formed with all types of pectin and
PVP were considered amorphous at 0% and 23%RH and crystalline at 54% and 75%RH
at both 25oC and 40
oC; while the dispersion formed with PAA was considered as
crystalline solid regardless the storage condition. Minimal %VitC loss and discoloration
were found between the amorphous solid dispersions (0% and 23%RH, 25oC and 40
oC)
and VitC alone while significantly higher (p<0.05) %VitC lost were observed in the
crystallized dispersion formed with PAA at 23%RH, 25oC and 40
oC. Significantly higher
(p<0.05) %VitC loss and discoloration were observed between the crystallized solid
175
dispersions and pure crystalline VitC, which are clearly shown at the highest temperature
and %RHs storage condition.
At lower storage %RHs where the VitC was present as an amorphous solid in the
dispersions, there were no significant (p>0.05) differences in %VitC loss than in the
physical mixtures following 10 weeks of storage when statistical analysis were grouped
based on temperature and %RHs. Both physical mixtures and solid dispersions had some
discoloration at low %RH condition. However, the discoloration initially occurred to
different color directions (different trends in a* and b* values were present). Therefore, it
was hard to compare the rate of discoloration between the two systems at low %RHs. As
temperature and storage %RH increased, it was clear that the crystallized solid dispersion
underwent significantly higher (p<0.05) VitC degradation and discoloration (a*value and
b*value) than physical mixtures. It can be concluded that the VitC degradation and
discoloration were higher in solid dispersions than in physical mixtures at high
temperature and %RHs.
The increases in %VitC degradation in the crystallized solid dispersions at 54%
and 75%RHs were consistent with another study that observed significant increases in
VitC degradation (30%) in freeze dried VitC (2.5%w/w) – lactose systems as the lactose
crystallized. The author concluded that the VitC was excluded from the system after the
crystallization of lactose resulting in a reduced protective effect of the sugar for the VitC.
However the crystallization of trehalose in VitC (2.5%w/w) – trehalose systems did not
lead to significant VitC degradation due to the high viscosity of trehalose in rubbery
which maintained its protective effect [31]. The formation of freeze dried VitC (10%w/w)
and various wall materials were found to result in higher VitC degradation and
discoloration [32]. However, the author did not determine the physical structures of VitC
(crystalline or amorphous) in the dispersions. Therefore, it was unknown whether the
alterations of physical structure were the cause of the VitC degradation and discoloration.
Another study showed that formation of stable amorphous curcumin solid dispersions
with polymer increased the chemical stability of curcumin[47]. Therefore, there is a
possibility that if a stable VitC amorphous solid dispersion was formed at high %RHs and
temperature (ie. 40oC, 54% and 75%RH), the chemical stability would be improved.
176
Based on the statistical analysis that differentiated the sample based on storage
temperature, %RHs and polymer types, the dispersion formed with AP, EST, and K
stored at 23%RH, 40oC as significantly lower (p<0.05)VitC degradation compared to the
physical mixtures which may indicated that the formation of amorphous solid dispersion
improved the stability of VitC. However, the dispersion formed with CT stored at
23%RH, 25oC had significantly higher (p<0.05) VitC degradation compared to the
physical mixtures. Therefore, further study would need to be done to form a stable VitC
amorphous solid dispersion at high temperature and %RHs; and to understand its
chemical stability.
In addition, there has been an increased interest in understanding the effects of the
glass transition temperature (Tg) of an amorphous solid on the chemical stability of
various compounds [20-23]. Studies showed that in the glassy state, amorphous solids
were more chemically stable due to low molecular mobility of the system compared to in
the rubbery state [20, 21]. Extensive studies have been done to understand whether the
chemical stability of an amorphous compound was more affected by the physical state of
the solid (glassy or rubbery) or the moisture present in the system [20-23]. The stability
of VitC in fortified formula with other types of vitamins, proteins, and carbohydrates was
affected by both temperature and aw [20]. While other studies showed that the chemical
stability was highly influence by the state of amorphous solid. For example, the VitC
contents were found to further decrease with increasing the temperature above the Tg in
air dried papaya cubes [23]. Moreover, although thiamin stability was affected by both aw
and Tg, Tg was found to have a more prominent effect on the stability [21]. However,
there was a challenge to separate the effects of temperature, aw, and Tg since the aw or the
temperature of the system have to be altered in order to change the Tg of a compound.
Different types of PVP, with different Tgs, were used to separate the influences of aw and
Tg on the stability of aspartame. No significant (p>0.05) differences were found in the
stability of aspartame when at a specific aw despite the difference in physical state (glassy
or rubbery). However, the chemical degradation was significantly different (p<0.05)
between the systems with similar Tgs, but having higher aw, which indicated that the rate
of aspartame degradation was more influenced by aw than the physical state.

177
The solid dispersions with AP, EST, and K were in the glassy state when stored at
0%RH, 40oC and were in the rubbery state when stored at 23%RH, 40
oC. However,
the %VitC losses in the dispersions stored at 0% and 23%RH (40oC) were not
significantly different (p<0.05) following 10 weeks of storage (Table 4). For example
the %VitC lost in dispersions formed with AP was 2.17 ± 1.57 and 2.32 ± 0.42 when
stored at 0%RH and 23%RH, respectively. Moreover in the same types of dispersions, no
significant color differences (both a*value and b*value) were observed at 0%RH and
23%RH (Table 7, Table 8). Therefore, the physical structures of the dispersions (glassy
or rubbery) seemed to have limited affect on the chemical stability. The limited chemical
stability difference between the glassy and rubbery states may be due to the minimal
storage temperature difference with the Tg (T-Tg) between the two physical states. For
example, the T-Tg of the glassy state in the dispersion with AP was -13oC and the T-Tg
of the rubbery state in the same dispersion was 8oC. At the temperatures near the Tg, the
difference in the chemical stability of VitC in fortified formula was not significant
whether the VitC was in the rubbery or glassy solid[20]. Due to the recrystallization of
VitC at higher storage %RHs, the effect of large difference of T-Tg could not be obtained
in study.
The types of polymer used in the physical mixtures and dispersions were also
shown to affect the chemical stability of VitC despite the similarities in the Tgs and
moisture absorbed at various storage temperature and %RHs between the pectin types.
The presence of a potassium salt in the physical mixtures and solid dispersions had a
significant effect on VitC discoloration. The effect of potassium salt in VitC discoloration
was most clearly observed in the physical mixtures. The a*values of the physical
mixtures formed with K exhibit significantly higher (p<0.05) changes in redness in all
studied storage temperature and %RHs at week 8. Temperature and storage combinations
as low as 0%RH, 25oC resulted in an increase of a*value of 0.91 ± 0.06 in the K physical
mixtures, while he change in a*value of unprocessed crystalline VitC was -0.25±0.02
after 8 weeks when stored at 0%RH, 25oC. The effect of the potassium salt in the solid
dispersion was not as pronounced as in the physical mixtures. Significantly (p<0.05)
higher %VitC losses were also seen the dispersions formed with K. The %VitC loss of

178
dispersions with K stored at 40oC, 75%RH were above 60% as compared to %VitC
losses in other types of solid dispersions which were below 35%.
The ability of different polymers to interact with VitC to form stable amorphous
solid dispersions was found to have minimal influence on the chemical stability of VitC.
Based on preceding study (Chapter 3), PVP was able to form the strongest interaction
with VitC, followed by CT and EST. No significant difference in the %VitC lost in the
dispersion formed with those types of polymer at all studied storage temperature and RHs.
The discoloration of the dispersion formed with EST, both the a*value and b*value, were
significantly lower (p<0.05) at all storage temperature and %RHs than the dispersion
formed with CT and PVP. However, the ability of VitC to interact with CT was found to
be between the ability PVP and EST to interact with VitC. Therefore, based on this study,
it was inconclusive whether the discoloration differences were due to the ability of
polymer to interact with VitC.
4.7 Conclusion
Limited VitC loss and discoloration were observed in in crystalline VitC
ingredients at storage conditions below the RHo, regardless of whether the VitC was
unprocessed or freeze dried. The presence of a polymer increased the chemical instability
and discoloration of VitC compared to the single vitamin ingredients. And the formation
of amorphous solid dispersions of VitC and polymers further increased the VitC
degradation and discoloration as compared to physical mixtures, clearly observed in the
recrystallized solid dispersions stored at 40oC, 75%RH. Storage temperature and %RHs
highly influenced in the chemical stability of VitC-polymer physical mixtures and solid
dispersions. In solid dispersion systems, the Tg was found to have a limited effect on the
vitamin chemical stability, although the types of polymer used in the system influenced
the chemical stability of VitC. In addition, minimal correlation was found betwen the
VitC-polymer hydrogen bond strength and the chemical stability of VitC in the dispersion.

179
4.8 References
1. Fennema, O., Fennema's Food Chemistry Fourth Edition. 2006, Boca Raton:
CRC Press. 467-476.
2. Lee, S.H. and T.P. Labuza, DESTRUCTION OF ASCORBIC-ACID AS A
FUNCTION OF WATER ACTIVITY. Journal of Food Science, 1975. 40(2): p.
370-373.
3. Shephard, A.B., S.C. Nichols, and A. Braithwaite, Moisture induced solid phase
degradation of L-ascorbic acid - Part 1. a kinetic study using tristimulus
colorimetry and a quantitative HPLC assay. Talanta, 1999. 48(3): p. 585-593.
4. Hiatt, A.N., L.S. Taylor, and L.J. Mauer, Influence of Simultaneous Variations in
Temperature and Relative Humidity on Chemical Stability of Two Vitamin C
Forms and Implications for Shelf Life Models. Journal of Agricultural and Food
Chemistry, 2010. 58(6): p. 3532-3540.
5. Lee, S.K. and A.A. Kader, Preharvest and postharvest factors influencing vitamin
C content of horticultural crops. Postharvest Biology and Technology, 2000.
20(3): p. 207-220.
6. Castro, I., et al., Ohmic heating of strawberry products: electrical conductivity
measurements and ascorbic acid degradation kinetics. Innovative Food Science
& Emerging Technologies, 2004. 5(1): p. 27-36.
7. Santos, P.H.S. and M.A. Silva, Retention of Vitamin C in Drying Processes of
Fruits and VegetablesA Review. Drying Technology, 2008. 26(12): p. 1421-1437.
8. Robertson, G.L. and C.M.L. Samaniego, EFFECT OF INITIAL DISSOLVED-
OXYGEN LEVELS ON THE DEGRADATION OF ASCORBIC-ACID AND THE
BROWNING OF LEMON JUICE DURING STORAGE. Journal of Food Science,
1986. 51(1): p. 184-&.
9. Cortes, C., M.J. Esteve, and A. Frigola, Color of orange juice treated by High
Intensity Pulsed Electric Fields during refrigerated storage and comparison with
pasteurized juice. Food Control, 2007. 19(2): p. 151-158.

180
10. Rodrigo, D., et al., Physicochemical characteristics and quality of refrigerated
Spanish orange-carrot juices and influence of storage conditions. Journal of Food
Science, 2003. 68(6): p. 2111-2116.
11. Nagy, S. and V. Randall, USE OF FURFURAL CONTENT AS AN INDEX OF
STORAGE TEMPERATURE ABUSE IN COMMERCIALLY PROCESSED
ORANGE JUICE. Journal of Agricultural and Food Chemistry, 1973. 21(2): p.
272-275.
12. Yuan, J.P. and F. Chen, Separation and identification of furanic compounds in
fruit juices and drinks by high-performance liquid chromatography photodiode
array detection. Journal of Agricultural and Food Chemistry, 1998. 46(4): p.
1286-1291.
13. Ozkan, M., A. Kirca, and B. Cemeroglu, Effects of hydrogen peroxide on the
stability of ascorbic acid during storage in various fruit juices. Food Chemistry,
2004. 88(4): p. 591-597.
14. Islam, M.I.U., R. Sherrell, and T.A.G. Langrish, An Investigation of the
Relationship between Glass Transition Temperatures and the Crystallinity of
Spray-Dried Powders. Drying Technology, 2010. 28(3): p. 361-368.
15. Yu, L., Amorphous pharmaceutical solids: preparation, characterization and
stabilization. Advanced Drug Delivery Reviews, 2001. 48(1): p. 27-42.
16. Hancock, B.C. and G. Zograf, Characteristics and significance of the amorphous
state in pharmaceutical systems. Journal of Pharmaceutical Sciences, 1997. 86(1):
p. 1-12.
17. Andersen, A.B. and L.H. Skibsted, Glass transition of freeze-concentrated
aqueous solution of ascorbic acid as studied by alternating differential scanning
calorimetry. Food Science and Technology-Lebensmittel-Wissenschaft &
Technologie, 1998. 31(1): p. 69-73.
18. Serajuddin, A.T.M., Solid dispersion of poorly water-soluble drugs: Early
promises, subsequent problems, and recent breakthroughs. Journal of
Pharmaceutical Sciences, 1999. 88(10): p. 1058-1066.

181
19. Ford, J.L., THE CURRENT STATUS OF SOLID DISPERSIONS. Pharmaceutica
Acta Helvetiae, 1986. 61(3): p. 69-88.
20. Sablani, S.S., et al., Evaluating stability of vitamin C in fortified formula using
water activity and glass transition. International Journal of Food Properties, 2007.
10(1): p. 61-71.
21. Bell, L.N. and K.L. White, Thiamin stability in solids as affected by the glass
transition. Journal of Food Science, 2000. 65(3): p. 498-501.
22. Bell, L.N. and M.J. Hageman, DIFFERENTIATING BETWEEN THE EFFECTS
OF WATER ACTIVITY AND GLASS-TRANSITION DEPENDENT MOBILITY ON
A SOLID-STATE CHEMICAL-REACTION - ASPARTAME DEGRADATION.
Journal of Agricultural and Food Chemistry, 1994. 42(11): p. 2398-2401.
23. Kurozawa, L.E., et al., Ascorbic acid degradation of papaya during drying: Effect
of process conditions and glass transition phenomenon. Journal of Food
Engineering, 2014. 123: p. 157-164.
24. Miao, S. and Y.H. Roos, Nonenzymatic browning kinetics of a carbohydrate-
based low-moisture food system at temperatures applicable to spray drying.
Journal of Agricultural and Food Chemistry, 2004. 52(16): p. 5250-5257.
25. Frias, J.M. and J.C. Oliveira, Kinetic models of ascorbic acid thermal degradation
during hot air drying of maltodextrin solutions. Journal of Food Engineering,
2001. 47(4): p. 255-262.
26. Stevens, R., et al., Technique for rapid, small-scale analysis of vitamin C levels in
fruit and application to a tomato mutant collection. Journal of Agricultural and
Food Chemistry, 2006. 54(17): p. 6159-6165.
27. Lipasek, R.A., L.S. Taylor, and L.J. Mauer, Effects of Anticaking Agents and
Relative Humidity on the Physical and Chemical Stability of Powdered Vitamin C.
Journal of Food Science, 2011. 76(7): p. C1062-C1074.
28. West, M.E. and L.J. Mauer, Color and Chemical Stability of a Variety of
Anthocyanins and Ascorbic Acid in Solution and Powder Forms. Journal of
Agricultural and Food Chemistry, 2013. 61(17): p. 4169-4179.

182
29. Mauer, L.J. and L.S. Taylor, Water-Solids Interactions: Deliquescence, in Annual
Review of Food Science and Technology, Vol 1, M.P. Doyle and T.R.
Klaenhammer, Editors. 2010, Annual Reviews: Palo Alto. p. 41-63.
30. Hiatt, A.N., L.S. Taylor, and L.J. Mauer, Effects of Co-Formulation of
Amorphous Maltodextrin and Deliquescent Sodium Ascorbate on Moisture
Sorption and Stability. International Journal of Food Properties, 2011. 14(4): p.
726-740.
31. Roos, Y.H. and M. Karel, PLASTICIZING EFFECT OF WATER ON THERMAL-
BEHAVIOR AND CRYSTALLIZATION OF AMORPHOUS FOOD MODELS.
Journal of Food Science, 1991. 56(1): p. 38-43.
32. Hung, L.H., et al., Decomposition and discoloration of L-ascorbic acid freeze-
dried with saccharides. Innovative Food Science & Emerging Technologies, 2007.
8(4): p. 500-506.
33. Okamura, M., AN IMPROVED METHOD FOR DETERMINATION OF L-
ASCORBIC-ACID AND L-DEHYDROASCORBIC ACID IN BLOOD-PLASMA.
Clinica Chimica Acta, 1980. 103(3): p. 259-268.
34. Bansch, B., et al., IS THE OXIDATION OF L-ASCORBIC-ACID BY AQUATED
IRON(III) IONS IN ACIDIC AQUEOUS-SOLUTION SUBSTITUTION-
TRANSFER-CONTROLLED OR ELECTRON-TRANSFER-CONTROLLED - A
COMBINED CHLORIDE, PH, TEMPERATURE, AND PRESSURE-
DEPENDENCE STUDY. Inorganic Chemistry, 1991. 30(24): p. 4555-4559.
35. May, J.M., Ascorbate function and metabolism in the human erythrocyte.
Frontiers in Bioscience, 1998. 3(CITED JAN. 8, 1998): p. D1-10.
36. Miller, J. and M.A. Joslyn, EFFECT OF SUGARS ON OXIDATION OF
ASCORBIC ACID .3. INFLUENCE OF PH AND TYPE OF BUFFER. Food
Research, 1949. 14(4): p. 354-363.
37. Ortiz, J., et al., Interaction of Environmental Moisture with Powdered Green Tea
Formulations: Relationship between Catechin Stability and Moisture-induced
Phase Transformations. Journal of Agricultural and Food Chemistry, 2009.
57(11): p. 4691-4697.

183
38. Zhou, Y. and Y.H. Roos, Stability and Plasticizing and Crystallization Effects of
Vitamins in Amorphous Sugar Systems. Journal of Agricultural and Food
Chemistry, 2012. 60(4): p. 1075-1083.
39. Yuan, J.P. and F. Chen, Degradation of ascorbic acid in aqueous solution.
Journal of Agricultural and Food Chemistry, 1998. 46(12): p. 5078-5082.
40. Rodriguez, M., et al., CHEMICAL-CHANGES DURING STORAGE OF AN
ALCOHOLIC ORANGE JUICE BEVERAGE. Journal of Food Science, 1991.
56(2): p. 475-&.
41. Solomon, O., U. Svanberg, and A. Sahlstrom, EFFECT OF OXYGEN AND
FLUORESCENT LIGHT ON THE QUALITY OF ORANGE JUICE DURING
STORAGE AT 8-DEGREES-C. Food Chemistry, 1995. 53(4): p. 363-368.
42. Roig, M.G., et al., Studies on the occurrence of non-enzymatic browning during
storage of citrus juice. Food Research International, 1999. 32(9): p. 609-619.
43. Kacem, B., et al., NONENZYMATIC BROWNING IN ASEPTICALLY
PACKAGED ORANGE DRINKS - EFFECT OF ASCORBIC-ACID, AMINO-
ACIDS AND OXYGEN. Journal of Food Science, 1987. 52(6): p. 1668-1672.
44. Trammell, D.J., D.E. Dalsis, and C.T. Malone, EFFECT OF OXYGEN ON
TASTE, ASCORBIC-ACID LOSS AND BROWNING FOR HTST-PASTEURIZED,
SINGLE-STRENGTH ORANGE JUICE. Journal of Food Science, 1986. 51(4): p.
1021-1023.
45. Calvo, C., A. Salvador, and S.M. Fiszman, Influence of colour intensity on the
perception of colour and sweetness in various fruit-flavoured yoghurts. European
Food Research and Technology, 2001. 213(2): p. 99-103.
46. Tepper, B.J., Effects of a slight color variation on consumer acceptance of orange
juice. Journal of Sensory Studies, 1993. 8(2): p. 145-154.
47. Li, B., et al., Both solubility and chemical stability of curcumin are enhanced by
solid dispersion in cellulose derivative matrices. Carbohydrate Polymers, 2013.
98(1): p. 1108-1116.

184
4.9 Appendix
Sample of SAS code used for statistical analysis
DATA PLATEREADER;
INPUT SYSTEMS VITC;
CARDS;
1 2.361474633
1 4.027785191 2 -5.19388391
2 -2.937527932
3 -5.63881958
3 -0.178185696
4 0.252912241
4 2.79091385
5 6.153301066
5 3.009150049
6 0.892834501
6 1.611034218 7 -7.760943421
7 -0.821016074
8 -4.061100281
8 -2.311847441
9 -5.81620784
9 -9.10426775
10 -6.573747981
10 7.04932521
11 3.479945565
12 5.173585624
12 8.89552613 ;
ODS RTF;ODS LISTING CLOSE;
PROC ANOVA DATA=PLATEREADER;
CLASS SYSTEMS;
MODEL VITC=SYSTEMS;
MEANS SYSTEMS/TUKEY;
RUN;
QUIT;

185
CHAPTER 5. SUMMARY AND FUTURE DIRECTIONS
5.1 Summary
The physical alteration of crystalline solids to form amorphous solids has been to
improve the dissolution and bioavailability of hydrophobic compounds, such as drug and
phytochemicals. However, amorphous compounds are thermodynamically less stable
than crystalline solids which often results in recrystallization during storage of common
temperatures and relative humidities (%RHs). The recrystallization negates the improved
solubility traits of amorphous solid. The formation of amorphous solid dispersions with
polymer is known to increase the stability of amorphous compounds. L-ascorbic acid
(VitC), a hydrophilic compound, has a high crystallization tendency and could serve as a
good model to understand the effects of polymer on inhibiting the crystallization of
amorphous solids. This study focused on the crystallization inhibitor properties of various
types of polymers, and their effects on the physical stability of VitC at various
storage %RHs and temperatures. The specific properties of the polymers, including the
ability to interact with the target compound, glass transition temperature (Tg), and
hygroscopicity were also explored to determine the key factors that resulted in a stable
amorphous solid dispersion.
The presence and type of polymers determined whether VitC amorphous solid
dispersions could be formed. Solid dispersions formed with different types of pectin and
polyvinylpyrrolidone (PVP) (50% w/w) were stable for up to four months when stored at
low %RHs conditions (below 23%RH), but not above 54%RH. The dispersion formed
with polyacrylic acid (PAA) crystallized immediately upon formation. The stability of
VitC amorphous solid dispersions was highly influenced by storage %RHs, but limited
influence of temperature was observed between 25oC and 40
oC. The ability of the

186
polymer to interact with VitC via hydrogen bonding was the key factor in the formation
of a stable amorphous solid dispersion. The presence of VitC – polymer interactions were
identified by the peak position shifts and peak shape alternation in fourier transform
infrared spectroscopy (FTIR) spectra. No peak shape alternation and limited peak shifts
were found in the (partially) crystallized dispersion formed with PAA. The effect of the
polymer Tg was less pronounced in the formation of amorphous solid dispersion than the
hydrogen bonding influence. The dispersions formed with higher Tg polymers were
found to be less stable than the dispersion formed with other polymers that had lower Tgs.
In addition, although polymer hygroscopicity was not the key element in inhibiting the
crystallization of amorphous solid, the stability of amorphous solid dispersion was
influenced by the moisture absorbed by the system. As evident, in the 50:50
VitC:polymer dispersion, when the polymer that potentially had the strongest hydrogen
bonding interaction with VitC (PVP) was the most hygroscopic, and the resulting
physical stability was similar to the less hygroscopic pectin dispersions.
The effect of VitC-polymer interactions was further explored with the formation of
solid dispersions with various polymer ratios: 0% - 100% polymer, in 10% polymer
increments. The effect of VitC-polymer interaction was further confirmed to be the key
factor in the formation of stable amorphous solid dispersions. The stronger VitC-polymer
interaction in dispersions formed with lower degree of esterification (%DE) pectin was
accompanied by the better physical stability of the dispersion. A lower polymer ratio was
required to create dispersion formed with lower degree of esterification (%DE) pectin.
The pectin with lower %DE had less hydrogen bond donors that competed with the VitC
hydrogen bond donors in forming an interaction with pectin acceptor groups. The
equilibrium constant and the amount of functional groups that can possibly be involved in
hydrogen bond interactions were found to be important. Higher amount of PVP was
necessary to form VitC amorphous solid dispersion due to the low equilibrium constant
and hydrogen bond functional groups. The VitC-PVP amorphous solid dispersion was
more stable when stored at higher %RHs compared to high %DE pectin which was
consistent with the stronger VitC-PVP interaction.

187
The chemical stability of VitC is highly important for the quality and shelf life of
foods. VitC is an essential nutrient that is widely used in food fortification and dietary
supplements, and is also commonly used as an antioxidant to promote the stability of
foods. The chemical stability of VitC in known to be influenced by light, oxygen,
temperature and %RHs, and also by its physical form and the types of systems it is
present in. The chemical stability of VitC in various systems was explored: pure VitC,
freeze dried VitC, VitC-polymer physical mixtures, and freeze dried VitC-polymer solid
dispersions. The VitC loss overtime was monitored using microplate reader assay.
Discoloration was also observed as an indicator of VitC degradation. The chemical
stability of VitC from the highest to the lowest was the pure VitC = freeze dried VitC >
VitC – polymer physical mixtures > VitC - polymer solid dispersions. No significant
difference was found in %VitC lost and discoloration of the crystalline pure VitC and
freeze dried VitC. The presence of polymer in the system resulted in a significant
decrease in the chemical stability, especially at elevated temperatures and %RHs. The
formation of VitC solid dispersion with polymer further decreased VitC stability. The
chemical stability of the VitC in the solid dispersion was more influenced by aw than the
Tg and the physical state (crystalline vs. amorphous) of the system.
5.2 Future Directions
This study provides an initial understanding of the physical stability of VitC
amorphous solid dispersions formed with various types of polymers. Acidic polymers
were used in the formation of VitC amorphous solid dispersions. Basic polymers have the
possibility to better inhibit the crystallization of an acidic compound, such as VitC.
Therefore, further studies could to be done to compare the abilities of acidic and basic
polymers to form stable amorphous solid dispersions. VitC can be protonated in aqueous
solution at pHs above its pKa. The different forms of VitC can result in different abilities
to form interactions with the polymers. Therefore, further study could be done to
understand whether increasing the pH of the solution prior to freeze drying could
improve the interaction of VitC with specific polymers. Moreover, synthetic polymers

188
that were commonly used in pharmaceutical area were used in this study as models with a
simpler monomer structure and hydrogen bond groups than food grade pectin. Further
analysis could be done to understand the effect of other food grade polymers on
inhibiting the crystallization of VitC.
Limited polymer types were used in this study to understand the effect of polymers
on VitC chemical stability. Further research needs to be done to understand a wider
variety of polymers thatare commonly used in the food industry and how they affect the
chemical stability of VitC. Moreover, the usage of microplate reader assay to quantify the
VitC content resulted in high variability. Other analysis techniques such as HPLC are
required to more accurately detect the amount of VitC degradation. The discoloration
trend difference of VitC in physical mixtures and solid dispersions were hypothesized to
be due to the different intermediate degradation product and degradation mechanisms in
the two systems. A Study that correlates the VitC degradation intermediate/end product
and discoloration could be done to understand the observation in this study. In addition,
the crystallized solid dispersions stored at higher temperature and %RHs underwent
higher chemical degradation than the amorphous solid dispersions stored at lower
temperature and %RHs. Further developments would be needed to create a VitC
amorphous solid dispersion that is stable at high %RH and temperature, and to
understand whether a physically stable amorphous solid dispersion would improve the
chemical stability of VitC at elevated temperatures and %RHs.


![spiral.imperial.ac.uk · Web view], chemical sensors ], and crystallization nucleation agents [ 7 Grafted polymers offer significant steric bulk and can significantly alter surface](https://static.fdocuments.us/doc/165x107/60b7731345ad0970e6539319/web-view-chemical-sensors-and-crystallization-nucleation-agents-7-grafted.jpg)