CRYSTALLIZATION - index-of.co.uk/index-of.co.uk/Tutorials-2/CRYSTALLIZATION.pdf · Braithwaite A...
21
which are the most mature in terms of their evolu- tionary development, although it is widely recognized that column liquid chromatography still lacks a sensi- tive and universal detector for general applications. This void may be Rlled by mass spectrometry, which has made great strides in the last few years towards this goal based on particle-beam interfaces and atmo- spheric ionization techniques coupled with the devel- opment of low cost mass separators. By comparison, thin-layer chromatography and supercritical Suid chromatography have become recognized as tech- niques with niche applications and are unlikely to supplant gas and column liquid chromatography as the dominant chromatographic methods used in ana- lytical laboratories. The microcolumn techniques of capillary electrophoresis, micellar electrokinetic chromatography, and capillary electrochromatogra- phy have quickly established themselves as useful laboratory methods and are likely to become of in- creasing importance as they complete their evolution- ary cycle. In particular, the infant capillary electro- chromatography has the potential to replace column liquid chromatography from many of its traditional separation roles, but has yet to reach a state of devel- opment to be considered as a routine laboratory tech- nique. The only thing that is certain about science is un- certainty. Although chromatographic methods are likely to dominate separation science for the Rrst part of the twenty-Rrst century, it would be a foolish person who predicts their form, continuing develop- ment, and main applications. Throughout the history of chromatography general approaches have had to adapt to changing needs brought about by dramatic shifts in the focus on different types of applications, and this has a signiRcant impact on the relative im- portance of the various techniques. However, chromatography should be considered as an holistic approach to separations, and will be better under- stood and correctly employed if we abandon the current trend to compartmentalize the technique based on specialization in individual subject areas. See Colour Plate 3. Further Reading Berger TA (1995) Packed Column Supercritical Fluid Chromatography. Cambridge: Royal Society of Chem- istry. Braithwaite A and Smith FJ (1996) Chromatographic Methods. London: Blackie Academic & Professional. Giddings JC (1991) UniTed Separation Science. New York: Wiley-Interscience. Guiochon G and Guilleman CL (1988) Quantitative Gas Chromatography for Laboratory Analysis and On-Line Process Control. Amsterdam: Elsevier. Guiochon G, Shirazi SG and Katti AM (1994) Funda- mentals of Preparative and Nonlinear Chromatography. Boston: Academic Press. Heftmann E (1992) Chromatography, Parts A and B. Am- sterdam: Elsevier. Jennings W, Mittlefehldt E and Stremple P (1997) Analytical Gas Chromatography. San Diego: Academic Press. Lee ML, Yang FJ and Bartle KD (1984) Open Tubular Column Gas Chromatography. Theory and Practice. New York: Wiley-Interscience. Li SFY (1992) Capillary Electrophoresis. Principles, Prac- tice and Applications. Amsterdam: Elsevier. Poole CF and Poole SK (1991) Chromatography Today. Amsterdam: Elsevier. Robards K, Haddad PR and Jackson PE (1994) Principles and Practice of Modern Chromatographic Methods. London: Academic Press. Sherma J and Fried B (1997) Handbook of Thin-Layer Chromatography. New York: Marcell Dekker. Snyder LR, Kirkland JJ and Glajch JL (1997) Practical HPLC Method Development. New York: J Wiley. CRYSTALLIZATION H. J. M. Kramer and G. M. van Rosmalen, Delft University of Technology, Delft, The Netherlands Copyright ^ 2000 Academic Press Introduction Crystallization from solution is a separation tech- nique where a solid phase is separated from a mother liquor. In contrast to other separation processes, however, the dispersed phase consisting of numerous solid particles also forms the Rnal product, that has to meet the required product speciRcations. Crystalliza- tion can thus also be seen as a technique to obtain solid products, where the crystallization process has to be carefully controlled in order to meet the ever- increasing demands of the customer on particle properties like particle size distribution, crystal shape, degree of agglomeration, caking behaviour and purity. Since the particles must also be easily 64 I / CRYSTALLIZATION / Derivatization
Transcript of CRYSTALLIZATION - index-of.co.uk/index-of.co.uk/Tutorials-2/CRYSTALLIZATION.pdf · Braithwaite A...

which are the most mature in terms of their evolu-tionary development, although it is widely recognizedthat column liquid chromatography still lacks a sensi-tive and universal detector for general applications.This void may be Rlled by mass spectrometry, whichhas made great strides in the last few years towardsthis goal based on particle-beam interfaces and atmo-spheric ionization techniques coupled with the devel-opment of low cost mass separators. By comparison,thin-layer chromatography and supercritical Suidchromatography have become recognized as tech-niques with niche applications and are unlikely tosupplant gas and column liquid chromatography asthe dominant chromatographic methods used in ana-lytical laboratories. The microcolumn techniques ofcapillary electrophoresis, micellar electrokineticchromatography, and capillary electrochromatogra-phy have quickly established themselves as usefullaboratory methods and are likely to become of in-creasing importance as they complete their evolution-ary cycle. In particular, the infant capillary electro-chromatography has the potential to replace columnliquid chromatography from many of its traditionalseparation roles, but has yet to reach a state of devel-opment to be considered as a routine laboratory tech-nique.
The only thing that is certain about science is un-certainty. Although chromatographic methods arelikely to dominate separation science for the Rrst partof the twenty-Rrst century, it would be a foolishperson who predicts their form, continuing develop-ment, and main applications. Throughout the historyof chromatography general approaches have had toadapt to changing needs brought about by dramaticshifts in the focus on different types of applications,and this has a signiRcant impact on the relative im-portance of the various techniques. However,chromatography should be considered as an holistic
approach to separations, and will be better under-stood and correctly employed if we abandon thecurrent trend to compartmentalize the techniquebased on specialization in individual subject areas.
See Colour Plate 3.
Further Reading
Berger TA (1995) Packed Column Supercritical FluidChromatography. Cambridge: Royal Society of Chem-istry.
Braithwaite A and Smith FJ (1996) ChromatographicMethods. London: Blackie Academic & Professional.
Giddings JC (1991) UniTed Separation Science. New York:Wiley-Interscience.
Guiochon G and Guilleman CL (1988) Quantitative GasChromatography for Laboratory Analysis and On-LineProcess Control. Amsterdam: Elsevier.
Guiochon G, Shirazi SG and Katti AM (1994) Funda-mentals of Preparative and Nonlinear Chromatography.Boston: Academic Press.
Heftmann E (1992) Chromatography, Parts A and B. Am-sterdam: Elsevier.
Jennings W, Mittlefehldt E and Stremple P (1997)Analytical Gas Chromatography. San Diego: AcademicPress.
Lee ML, Yang FJ and Bartle KD (1984) Open TubularColumn Gas Chromatography. Theory and Practice.New York: Wiley-Interscience.
Li SFY (1992) Capillary Electrophoresis. Principles, Prac-tice and Applications. Amsterdam: Elsevier.
Poole CF and Poole SK (1991) Chromatography Today.Amsterdam: Elsevier.
Robards K, Haddad PR and Jackson PE (1994) Principlesand Practice of Modern Chromatographic Methods.London: Academic Press.
Sherma J and Fried B (1997) Handbook of Thin-LayerChromatography. New York: Marcell Dekker.
Snyder LR, Kirkland JJ and Glajch JL (1997) PracticalHPLC Method Development. New York: J Wiley.
CRYSTALLIZATION
H. J. M. Kramer and G. M. van Rosmalen,Delft University of Technology, Delft, The Netherlands
Copyright^ 2000 Academic Press
Introduction
Crystallization from solution is a separation tech-nique where a solid phase is separated from a motherliquor. In contrast to other separation processes,
however, the dispersed phase consisting of numeroussolid particles also forms the Rnal product, that has tomeet the required product speciRcations. Crystalliza-tion can thus also be seen as a technique to obtainsolid products, where the crystallization process hasto be carefully controlled in order to meet the ever-increasing demands of the customer on particleproperties like particle size distribution, crystalshape, degree of agglomeration, caking behaviourand purity. Since the particles must also be easily
64 I / CRYSTALLIZATION / Derivatization

separated from the mother liquor, additional de-mands on Rlterability and washability can be for-mulated.
Because of the mostly rigid structure of the solidphase, the formation of solid particles is a rather slowprocess, and to reach an acceptable production ratelarge vessels are generally needed. This rigid structureon the other hand impedes the incorporation offoreign substances or solvent molecules, and in onlyone separation step a pure solid product is obtained.
Crystallization is often used as a generic term forevaporative or cooling crystallization, precipitationand melt crystallization. There are, however, con-siderable differences between the three types ofcrystallization as far as the processing method and thecorresponding equipment are concerned. In precipita-tion the drop-out of the solid phase is achieved bymixing two feed streams that are either two reactantsor a solvent containing the solute and an antisolvent.The hydrodynamics of the process therefore playa predominant role in precipitation with regard to theproperties of the obtained product.
In melt crystallization the potential of crystalliza-tion to produce a pure product is mainly utilized, andthe solid phase is remolten to obtain the Rnal product.The applications are mainly in the ultrapuriRcation oforganic compounds or to produce pure water asa concentration technique.
An upcoming technique in crystallization is super-critical crystallization, mostly with condensed CO2,because of its benign properties compared to organicsolvents. Condensed CO2 can be used either as a sol-vent or as an antisolvent, and speciRcally adaptedprocesses and equipment have been developed forthese high pressure crystallization techniques.
Also the crystallization of proteins requires its owndedicated approach, because large, sometimes easilydegradable molecules require carefully designedprocesses.
Because 70% of the products sold by the processindustry and the pharmaceutical industry } as bulkproducts, intermediates, Rne chemicals, biochemicals,food additives and pharmaceutical products } aresolids, crystallization in its widest deRnition is thelargest separation process after distillation.
Although this chapter will primarily focus on evap-orative and cooling crystallization, the energy, massand population balances treated here as well as thekinetic rate expressions for the physical processessuch as nucleation, growth and agglomeration andthe characterization of the particles can equally beapplied to the other types of crystallization.
Several books on the diverse aspects of crystalliza-tion have been published over the last 10 years. Thesebooks that can be recommended for a wide overview
in this Reld contain an abundance of references. Theauthors of these books are Mersmann (1995), Mullin(1993), Randolph and Larsen (1987), Myerson(1993), NyH vlt (1992), Tavare (1995) and Hurle(1993). SoK hnel and Garside (1992) have writtena book on precipitation and Arkenbout (1995)a book on melt crystallization.
This article reviews industrial evaporation andcooling crystallization processes. A basic modellingapproach is presented which enables the analysis anddesign of industrial crystallization processes, either byanalytical calculations or by making use of moderncomputational tools.
Crystallization Methods andSupersaturation
Crystallization only occurs when supersaturation iscreated that acts as the driving force for crystalliza-tion. The crystallization method is mainly chosen onthe basis of the thermodynamic and physical proper-ties of the compound and the solvent, as well as onthe required purity of the product. There are severalways to represent the phase diagram, dependingon the mode of crystallization. For evaporative andcooling crystallization a solubility diagram is mostlyused, in which the solubility of the compound isexpressed as a function of temperature. In precipita-tion the solubility is always very low, and the solubil-ity product at the operating temperature is needed. Inantisolvent precipitation, the solubility diagrammostly has to be determined for the particular three-phase system. In melt cooling crystallization T-x dia-grams are used, while for melt pressure crystallizationpT-x diagrams are needed.
A decision scheme for the selection of the appropri-ate crystallization method is presented in Figure 1.For a high purity product or when the use of a sol-vent poses environmental or safety problems, meltcrystallization is chosen. A melt temperature lyingbetween 0 and 1003C is preferred, since at highertemperatures many organic compounds become un-stable, while at temperatures below 03C operating theprocess becomes more difRcult, although not im-possible. A high viscosity of the melt hampers theoperation.
At solubilities below about 1 mass %, the process isdesigned as a precipitation process to obtain a reason-able production rate. The supersaturation that is gen-erated by the mixing of reactants often reaches highvalues. Also in antisolvent crystallization, low solu-bility of the solute and high supersaturation arereached by mixing two solvents.
Finally, for the more easily soluble substances thechoice between cooling and evaporative crystallization
Sepsci*31*TSK*Venkatachala=BGI / CRYSTALLIZATION 65

Figure 1 Decision diagram for choosing the method of crystallization.
is made on the basis of the solubility curve, and theprevailing supersaturations are generally low. Espe-cially where water is the solvent, cooling crystalliza-tion is more favourable than evaporative crystalliza-tion, except for highly soluble substances. Therefore,multi-effect Sash evaporation where the vapouris used for heating next crystallizer or the feed streamis frequently applied to reduce the energy costs, ifevaporative crystallization is applied.
In cooling crystallization direct cooling, Sash cool-ing or indirect cooling can be applied. Where indirectcooling is used encrustation on the cooling surfacesmust be minimized. In Sash cooling this problem islargely avoided at the expense of a more complicatedinstallation. Also direct cooling uses an inert coolingmedium or refrigerant that is bubbled directly intothe solution and evaporates does not suffer fromabundant incrustation, but needs recompression ofthe cooling medium.
So, in these various methods of crystallization,supersaturation is created by cooling, by evaporationof solvent or by a combination of the two in the caseof Sash evaporation or Sash cooling, or by mixingtwo reactants or solvents. In all these cases the actualconcentration is higher than the equilibrium concen-tration, and a driving force for crystallization isachieved.
From a thermodynamic point of view this drivingforce is reSected by the difference in chemicalpotential of the solute in the liquid and in the solidphase at temperature T:
��"�L(T)!�S(T) [1]
For cooling crystallization from the melt or the solu-tion, eqn [1] can be transformed into:
��"�Heq
TH) �T [2]
For melt pressure crystallization:
��"�Vmolar�P" ���melt�solid
) �P [3]
For practical reasons the supersaturation in cooling ismostly indicated by:
�T"T!TH [4]
and can also be translated via the solubility curve intoa concentration difference:
�c"c!cH [5]
Other frequently used expressions are the dimension-less saturation ratio:
S" ccH
[6]
or the relative supersaturation:
�"c!cHcH
"�ccH
"S!1 [7]
66 I / CRYSTALLIZATION / Derivatization

Here c can be expressed by kg solute per kg or m3 ofthe solvent or solution, but an expression in kg soluteper m3 solution ("liquid) phase is generally used inmass balances ("mass fraction, w).
For evaporative crystallization, eqn [1] can betransformed into:
��"RT ln�a
aeq�"RT ln��c
�eqcH� [8]
Given the relatively low supersaturations, �, thatoften lie between 0.001 and 0.01 with more easilysoluble substances, eqn [8] simpliRes into:
��"RT�ccH
"RT� [9]
For two or more A and B ions in solution that react toform crystal c, the expression for �� becomes:
��"RT ln�i a
vii
Ksp[10]
and for stoichiometric solutions equals:
��"RTv ln S+RT�� [11]
In practice the supersaturation is often indicated byeqn [5].
For Sash cooling or evaporation two terms contri-bute to the driving force (�T and �c).
For precipitation, no simpliRcations are allowed,owing to the high supersaturation values (��1), andeither eqn [8] or eqn [10] is used. For antisolventprecipitation the value of c depends on the actualconcentration of the solute in the original solventand, like cH, on the degree of dilution by the anti-solvent.
Mass and Heat Balances
Traditional design of an industrial crystallizer isbased on only mass and enthalpy balances. The pro-duction rate determines to a large extent the dimen-sions of the crystallizer as well as the energy con-sumption. It also determines the mode of operation,which means batchwise or continuous, single ormultistage operation. In the next section the balanceequations are given for an evaporative and for a cool-ing crystallizer.
Evaporative Crystallizers
Consider an ideally mixed vessel. The compositionof the product stream is kept similar to that of the
content of the crystallizer. The volume, V, of thecrystallizer is often assumed to be constant ineqns [12}19], However, by making V and the feedstreams time-dependent, dynamic effects can betaken into account, and thus also batch processes.The mass balance is given by:
dMtotal
dt"�v,feed(�feed�feed,liquid#(1!�feed)�crystal)
!�v,prod(��liquid#(1!�)�crys)!�v,vapour�vapour
[12]The component balances are given by:
dMi
dt"�v,feed�
�feed�feed,liquidwfeed,liquid,i
#(1!�feed)�crystalwfeed,crystal,i�!�v,prod(��liquidwliquid,i#(1!�)�crystalwcrystal,i)
(i"1, Ncomp) [13]
with:
Mi"V(��liquidwliquid,i#(1!�)�crystalwcrystal,i) [14]
where component i"1 is the main compound to becrystallized, and components i"2, 3,2 Ncomp arethe impurities present.
The distribution coefRcients relate the impurityuptake by the solid and the concentration of theimpurity in the liquid phase:
kdistr,i"wcrystal,i
wliquid,i(i"2,2Ncomp) [15]
Instead of substituting all component balances intothe total mass balance given by eqn [12] to solve themass balance of the total system, it is more conve-nient to combine the solvent mass balance togetherwith the component balances:
dV��liquidwliquid,solvent
dt"�v,feed(�feed�feed,liquidwfeed,solvent)
!�v,prod(��liquidwliquid,solvent)
!�v,vapour�vapour [16]
Finally, the sum of the mass fractions in both theliquid and the solid phase must equal one:
wliquid,solvent#�i
wliquid,i"1 [17]
�i
wcrystal,i"1 [18]
Sepsci*31*TSK*Venkatachala=BGI / CRYSTALLIZATION 67

The enthalpy balance with the production rate orsolids production, P, is given by:
dHdt
"�H,feed!�H,prod!�H,vapour#Qheat#P�Hcr
[19]
The total enthalpy and the enthalpy of the streams aredeRned as:
H"V(��liquidCp,liquid#(1!�)�crystalCp,crystal)T
�H,feed"�v,feed(�feed�feed,liquidCp,liquid
#(1!�feed)�crystalCp,crystal)Tfeed
�H,prod"�v,prod(��liquidCp,liquid#(1!�)�crystalCp,crystal)T
�H,vapour"�v,vapour(�vapourCp,vapourT#�vapour�Hevap)
[20]
The crystal free volume fraction � should be as low aspossible to reduce the crystallizer volume.
The liquid mass fraction wliquid,1 of the main com-ponent must be determined or can be approximatedby the saturation concentration, especially for solublecompounds with a low � value.
With the production rate, P, as a design parameter,the volumetric product Sow rate can be deduced forthe chosen � value from:
P"�v,prod(1!�)�crystal"�v,prodMT [21]
From the product Sow rate so obtained and the meanresidence time that is needed to grow sufRcientlylarge crystals, the necessary suspension volume forthe crystallizer can be calculated from:
�v,prod"V
[22]
" Lmean
4Gmean[23]
Here, for the desired Lmean, a reasonable value mustbe chosen, that is related to its solubility and the meangrowth rate, Gmean, can be estimated from a correla-tion (Mersmann, 1988; Kind and Mersmann 1990) ordetermined by laboratory experiments.
From the crystallizer suspension volume, V, theneeded vapour head, the process streams and the heatduty that has to be accommodated, the crystallizerdimensions can now be determined. Constraints forthe design are a height/diameter ratio of about 3 : 2,and a cross-sectional area for evaporation that islarge enough to avoid entrainment of liquid droplets
into the condensor. For the design of the heat ex-changer see Sinnott (1998).
Cooling Crystallizers
In cooling crystallization the warm feed stream iscooled to the process temperature. In principle thesame set of mass and heat balance equations can beused, except that no vapour Sow exists. Furthermore,the process temperature cannot freely be chosen, be-cause it is determined for a given production rate,crystal free fraction, �, residence time, and liquidmass fraction, wliquid,1. This latter liquid mass fractionof the main component will depend on the processtemperature, so a temperature-dependent equationfor wliquid,1 must be added. The degrees of freedom forthe crystallizer design are therefore more limited.
The Population Balance
The Crystal Length-based Population BalanceEquation
In crystallization as a separation process, the separ-ability of the particles from the mother liquor by, forexample, Rltration are of utmost importance, as wellas their washability and drying. The efRciency ofthese processes is directly related to the crystal sizedistribution (CSD) of the solid, and as soon as theCSD of the solid phase becomes an interesting prod-uct speciRcation, the population balance equation(PBE) must be introduced. The PBE describes how thesize distribution develops in time as a result of variouskinetic processes. The concept of the PBE was intro-duced to crystallization by Randolph. A general formof the PBE is as follows:
(n(L)V)t
"!V(GL(L)n(L))
L#B(L)V!D(L)V
#m
�j"1
�v,in,jnin,j(L)!n
�k"1
�v,out,khout,k(L)n(L)
[24]
where the amount and the size of the crystals (orparticles) are expressed in terms of number densityn(L) (�/(m3m)) and crystal (or particle) length L (m)respectively (Figure 2A).
All the variables in this equation are in principlealso time-dependent. For the sake of simplicity, thet dependence is omitted here.
In other representations of the PBE, the amount ofparticles may also be expressed in terms of volumedensity v(L) (m3/(m3m1)) or mass density m(L)(kg/(m3m1), where the size is represented by the
68 I / CRYSTALLIZATION / Derivatization

Figure 2 (A) Number and (B) mass distribution of a crystal population.
Figure 3 Schematic depiction of the processes affecting the CSD. In an infinitesimally small size range from L to L#dL, crystals mayenter and leave due to growth, aggregation, attrition, breakage and volumetric input and output flow streams.
length L (Figure 2B). Figure 2 also shows two often-used values which characterize the crystal size distri-bution, the mean crystal size and the volume-basedmedian size (the size at which the integral over them(L) curve from zero to L50 equals half of the integralover the entire curve).
For particle sizes given in terms of volume, thecorresponding number density becomes n(v) insteadof n(L). The latter representation becomes more con-venient if agglomeration of crystals plays an impor-tant role.
In eqn [24] V is the suspension volume in the cry-stallizer with m streams entering and n streams leav-ing the crystallizer with volumetric Sow rates �v.
GL(L) is the linear size-dependent growth rate(m s�1), and B(L) and D(L) are birth and death terms
respectively (�m�3m�1). Birth and depth events canbe caused by agglomeration and disruption of earlieragglomerated particles, but also by breakage of crys-tals and by the birth of small crystals, called nuclei.Breakage of crystals will not happen under normaloperating conditions.
The classiRcation function h(L) describes the rela-tion between the CSD in the crystallizer and that onan outlet stream.
The processes on the right-hand side of eqn [24]that lead to the crystal population in a certain sizeinterval, dL, are depicted in Figure 3. In the PBEgiven by eqn [24] all operation modes are represent-ed. The difference between batch and continuousprocesses only inSuences the in- and outSow terms onthe right-hand side of the PBE.
Sepsci*31*TSK*Venkatachala=BGI / CRYSTALLIZATION 69
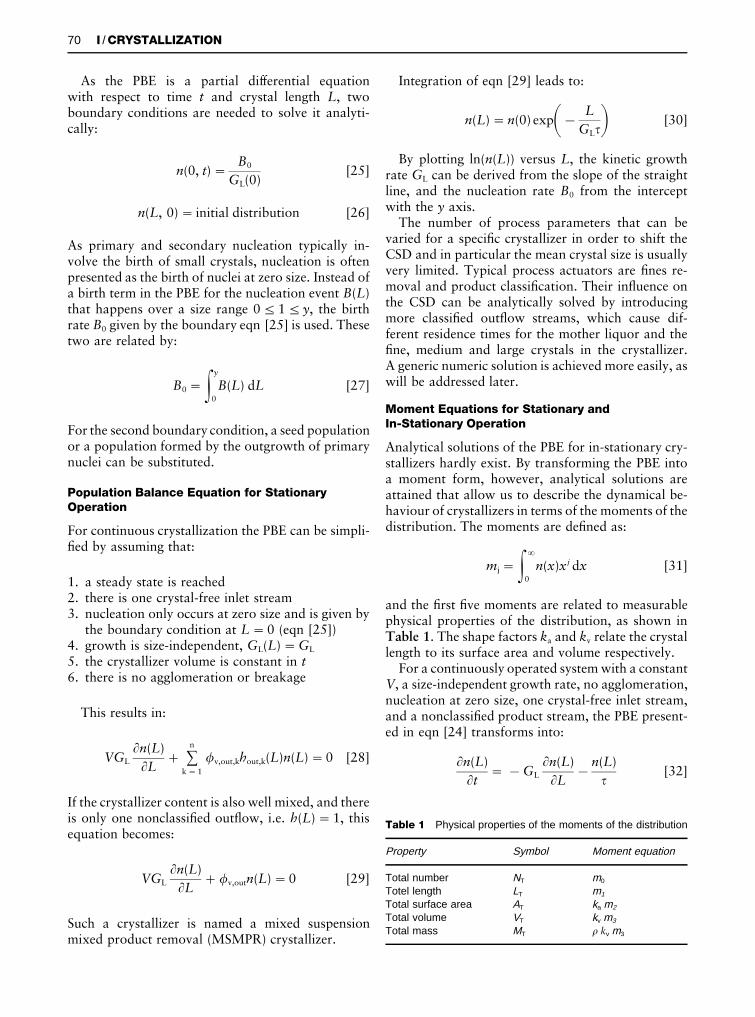
Table 1 Physical properties of the moments of the distribution
Property Symbol Moment equation
Total number NT m0
Totel length LT m1
Total surface area AT ka m2
Total volume VT kv m3
Total mass MT � kv m3
As the PBE is a partial differential equationwith respect to time t and crystal length L, twoboundary conditions are needed to solve it analyti-cally:
n(0, t)" B0
GL(0)[25]
n(L, 0)"initial distribution [26]
As primary and secondary nucleation typically in-volve the birth of small crystals, nucleation is oftenpresented as the birth of nuclei at zero size. Instead ofa birth term in the PBE for the nucleation event B(L)that happens over a size range 0414y, the birthrate B0 given by the boundary eqn [25] is used. Thesetwo are related by:
B0"�y
0B(L) dL [27]
For the second boundary condition, a seed populationor a population formed by the outgrowth of primarynuclei can be substituted.
Population Balance Equation for StationaryOperation
For continuous crystallization the PBE can be simpli-Red by assuming that:
1. a steady state is reached2. there is one crystal-free inlet stream3. nucleation only occurs at zero size and is given by
the boundary condition at L"0 (eqn [25])4. growth is size-independent, GL(L)"GL
5. the crystallizer volume is constant in t6. there is no agglomeration or breakage
This results in:
VGLn(L)L
#n
�k"1
�v,out,khout,k(L)n(L)"0 [28]
If the crystallizer content is also well mixed, and thereis only one nonclassiRed outSow, i.e. h(L)"1, thisequation becomes:
VGLn(L)L
#�v,outn(L)"0 [29]
Such a crystallizer is named a mixed suspensionmixed product removal (MSMPR) crystallizer.
Integration of eqn [29] leads to:
n(L)"n(0) exp�!L
GL� [30]
By plotting ln(n(L)) versus L, the kinetic growthrate GL can be derived from the slope of the straightline, and the nucleation rate B0 from the interceptwith the y axis.
The number of process parameters that can bevaried for a speciRc crystallizer in order to shift theCSD and in particular the mean crystal size is usuallyvery limited. Typical process actuators are Rnes re-moval and product classiRcation. Their inSuence onthe CSD can be analytically solved by introducingmore classiRed outSow streams, which cause dif-ferent residence times for the mother liquor and theRne, medium and large crystals in the crystallizer.A generic numeric solution is achieved more easily, aswill be addressed later.
Moment Equations for Stationary andIn-Stationary Operation
Analytical solutions of the PBE for in-stationary cry-stallizers hardly exist. By transforming the PBE intoa moment form, however, analytical solutions areattained that allow us to describe the dynamical be-haviour of crystallizers in terms of the moments of thedistribution. The moments are deRned as:
mj"��
0n(x)xj dx [31]
and the Rrst Rve moments are related to measurablephysical properties of the distribution, as shown inTable 1. The shape factors ka and kv relate the crystallength to its surface area and volume respectively.
For a continuously operated system with a constantV, a size-independent growth rate, no agglomeration,nucleation at zero size, one crystal-free inlet stream,and a nonclassiRed product stream, the PBE present-ed in eqn [24] transforms into:
n(L)t
"!GLn(L)L
!n(L)
[32]
70 I / CRYSTALLIZATION / Derivatization

with similar boundary conditions. This equationcan be reduced to a set of ordinary differentialequations by means of the moment transformation:
dmj
dt"jGLmj�1!
mj
#B0L
j0 [33]
where L0, the size of the nuclei, is here zero. Only theRrst four moment equations (j"0}3) have to besolved to obtain all the information about the lumpedproperties of the CSD.
Population Balance Equation for Batch Operation
For batch operation, the PBE (eqn [24]) can be sim-pliRed by assuming that:
1. the inlet stream is crystal-free2. nucleation only occurs at zero size, and is reSected
by the boundary condition at L"0 (eqn [25])3. growth is size-independent4. there is no agglomeration or disruption
This results in:
n(L)Vt
"!VGLn(L)L
[34]
Since batch operation is inherently ‘in-stationary’,a moment transformation is needed to obtain analyti-cal solutions to the PBE. This leads to
dd(Vmj)
dt"jGLmj�1V#B0L
j0V [35]
where the size of the nuclei, L0, is zero. Again ordi-nary differential equations (j"0}3) have to besolved to attain the lumped properties of the CSD.
To improve the CSD, a controlled cooling or evap-oration trajectory can be imposed.
The Crystal Volume-Based Population BalanceEquation
When a crystallizing system depends purely on nu-cleation and growth processes, it is favourable to usea PBE with length as the crystal size co-ordinate. Forkinetic processes where the volume of particles arecombined or split up, like in agglomeration and dis-ruption, a PBE with the particle volume as crystal sizecoordinate is preferred. This leads to:
(n(v)V)t
"!V(Gv(v)n(v))
v#B(v)V!D(v)V
#m
�j"1
�v,in,jnin,j(v)!n
�k"1
�v,out,khout,k(v)n(v)
[36]
A volumetric growth rate is then required. Crystalgrowth rates are, however, available in length-basedrates, so G(v) has to be calculated from:
Gv(v)"dvdL
GL"3kvL2GL [37]
This expression prohibits the introduction of zero-sized nuclei as a boundary condition, and nucleationhas to be modelled as birth within a certain size interval.
The number of particles in a certain size intervalmust be the same, regardless of whether the boundsof that interval are expressed in terms of length ofvolume. This implies that:
n(L) dL"n(v) dv [38]
and, after some rewriting, the following transforma-tion equations:
n(L)"3kvL2n(v)
n(v)" 1
3 ��kvv2
n(L) [39]
Agglomeration and Disruption
To solve the PBE where there is agglomeration anddisruption of earlier agglomerated particles, the birthand death terms for these processes must be derived.
The rate of agglomeration, r, is given by:
r(v1, v2)"�(v1, v2, �, �)n(v1)n(v2) [40]
The rate constant, �, commonly called the agglomer-ation kernel, depends on the particle sizes v1 and v2,the supersaturation � and the turbulence level, repre-sented by the power input �. The birth and deathterms associated with the agglomeration of two par-ticles, resulting in the birth of a new one and the deathof the original two, are:
B(v)"12�
v
0�(u, v!u)n(u)n(v!u) du [41]
D(v)"n(v)��
0�(u, v)n(u) du [42]
The factor 12 is needed to avoid double-counting, since
the integral takes each interaction twice. The depend-ency of � on � and � has been omitted here fornotation simplicity.
There is also disruption of earlier agglomeratedparticles with a corresponding disruption rate. Thisdisruption process of earlier agglomerated particles
Sepsci*31*TSK*Venkatachala=BGI / CRYSTALLIZATION 71

can be described in the PBE by an additional deathterm for the disrupted particles, and an additionalbirth term for the newly formed particles:
D(v)"S(v, �) ) n(v) [43]
B(v)"��
v
b(v, u)S(u, �)n(u) du [44]
where S(v) is a selection function that describes therate at which particles fall apart, and b is a breakagefunction that describes how many particles of sizev are formed on disruption of a particle of size u.
Often, the disruption terms are loaded into theagglomeration kernel �, which then represents theeffective agglomeration kernel. In that case termsexpressed by the eqns [43] and [44] can be left outand only eqns [41] and [42] are needed for substitu-tion in the PBE. The main disadvantage of this lum-ped description of the whole agglomeration process isthat prediction of the agglomeration behaviour fordifferent hydrodynamic conditions (and thus fordifferent scales and geometries) becomes vir-tually impossible because � and � have a differ-ent dependency on �.
The PBE with agglomeration and disruption termscan rarely be solved analytically. A moment transforma-tion is again required with the moments deRned as:
mj"��
0n(v)vj dv [45]
where v represents crystal size volume v. The zeromoment is again the total number of particles, but theRrst moment of the volume-based CSD already equalsthe third moment of the length-based CSD.
Substitution of the above expressions into the PBE(eqn [36]) for a system with agglomeration andgrowth and no nucleation, with a constant crystal-lizer volume, only one crystal-free inlet streamand a nonclassiRed product stream, results after amoment transformation in:
dmj
dt"!mj
#jGvmj�1#Bagg,j!Dagg,j [46]
where the moment forms of B and D due to agglom-eration are deRned as:
Baggl,j"��
0vjBdv [47]
Daggl,j"��
0vjD dv [48]
A solution is only obtained for a size-independentkernel �0. For a batch-agglomerating system (withoutgrowth), only solutions for m0 and m1 (which is equalto the m3 in size coordinates) are obtained:
dm0
dt"!�
��0m
20 [49]
dm1
dt"0 [50]
The numerical solution of the population balance forcases where nucleation, growth and agglomeration ispresent often imposes a problem, because no analyti-cal solution exists and the generation of numericalsolutions is not easy. It is essential to divide the sizeaxis into proper size intervals to obtain reliable re-sults and to transform the population balance, a par-tial differential equation, into a set of ordinarydifferential equations. Hounslow et al. presenteda numerical scheme based on a geometrical discretiz-ation of the size axis in which for each size intervalthe ratio between the upper and lower boundary r isexactly equal to ��2. Although accurate results areobtained in the absence of crystal growth and nuclea-tion, the method is in general not accurate enough inthe presence of these crystallization phenomenaand gives rise to an overestimation of the highermoments. An improved Rnite-element technique hasbeen introduced to solve the steady-state solution ofthe population balance for nucleation, growth andagglomeration.
Kinetic Expressions
In order to solve the population balance equation,kinetic expressions are needed to represent the phys-ical processes that take place in the crystallizer, suchas nucleation, growth and agglomeration. Theirmechanisms and the corresponding equations will betreated here.
Nucleation
Two different nucleation mechanisms can be dis-tinguished: primary and secondary nucleation.
Primary nucleation is new phase formation froma clear liquid or solution. It can be subdivided intohomogeneous and heterogeneous nucleation. In thelatter case a foreign substrate of tiny invisible par-ticles, e.g. dust or dirt particles, is present in thesolution on which nucleation starts. In homogeneousnucleation such a substrate is absent and nuclei areformed by statistical Suctuations of solute entitiesthat cluster together.
72 I / CRYSTALLIZATION / Derivatization

Figure 4 Nucleation rate as a function of the supersaturation(��). Jhomo and Jhetero, homogeneous and heterogeneous nuclea-tion rate; B0, secondary nucleation rate.
Secondary nucleation is the breeding of nuclei fromcrystals of the crystallizing material that are alreadypresent in the solution. These nuclei are in generalattrition fragments, and result from collisions of thelarger crystals with the hardware of the crystallizer, inparticular with the blades of impellers and pumps. Athigh solid densities in the crystallizer collisions be-tween the larger crystals can create fragments that actas secondary nuclei.
During the start-up phase of evaporative or coolingcrystallization of moderately to very soluble com-pounds, primary nucleation takes place. After theiroutgrowth to larger crystals, secondary nucleationtakes over, and becomes the most important source ofnuclei at low supersaturation values. For precipita-tion of slightly soluble compounds the process gener-ally remains dominated by primary nucleation fortwo reasons. Supersaturation remains high enough,especially at the inlet points of the feed streams, toproduce primary nuclei, and the often agglomeratedcrystals remain too small to be prone to attrition.
Homogeneous primary nucleation Local Suctu-ations in concentration induce the formation of nu-merous clusters that can fall apart again. In under- orjust saturated solutions, cluster formation and clusterdecay are in equilibrium; it is a reversible process. Insupersaturated solutions, however, clusters of a criti-cal size are formed that either fall apart or grow out.In the classical nucleation theory of Volmer, Beckerand DoK ring, these clusters are formed by the attach-ment and detachment of single solute entities. Al-though clusters can also grow by the collision ofclusters, their concentration is always so much lowerthan that of single solute entities that this process ofcluster enlargement can be ignored.
The critical size of a cluster that is represented byits critical radius, rH, is given by:
rH"2�Vmolar
��[51]
and is thus related to the supersaturation via ��, andto the interfacial tension �.
For the homogeneous nucleation rate, Jhomo
(�m�3), the following equation can be derived aftersome simpliRcations:
Jhomo"AS exp�16��3V2
molar
3k3T3(ln S)2� [52]
In this Arrhenius type of expression, changes in thesupersaturation ratio S in the pre-exponential factorsA ) S are of minor inSuence compared to changes inS in the exponential term. Various authors use dif-
ferent expressions for A and this can cause consider-able differences in the attained values of J (Mer-smann, 1995; SoK hnel and Garside, 1992; Kashchiev,2000).
Heterogeneous primary nucleation The occurrenceof homogeneous nucleation is rare, in practice sincenucleation on a foreign substrate will substantiallyreduce the nucleation barrier. For this type of nuclea-tion, a similar rate equation can be used:
Jhetero"AheteroS exp�16��3V2
molar
3k3T3(ln S)2� [53]
where the interfacial tension � is replaced by a muchlower �eff. Although Ahetero is lower than A, the ef-fect of the exponential term dominates up to veryhigh supersaturation values, that are rarely met inpractice (Figure 4).
Secondary nucleation The classic expression for thesecondary nucleation rate in a suspension of growingcrystals, B0, is the empirical power law, based onthree experimentally accessible parameters that wererecognized already early on to be important:
B0"kNGiNhMjT [54]
Since the growth rate is directly related to the super-saturation �, and the rotational speed to the powerinput, the power law can also be written as:
B0"k1N�b�kMj
T [55]
Frequently measured values for b, k and j understeady-state conditions are 1(b(3, 0.6(k(0.7and j"1 or 2. For nucleation dominated bycrystal}impeller collisions j"2, while for nucleationruled by crystal}crystal collisions, j"2.
Sepsci*31*TSK*Venkatachala=BGI / CRYSTALLIZATION 73

Figure 5 Dynamic behaviour of the CSD. Continuous line,measured; dashed line, modelled with the power law.
Also the crystallizer geometry-like type of stirrersor pumps, and number of blades, as well as the scaleof operation inSuence the attrition rate of the crys-tals. These effects were supposed to be includedin kN of k1
N, that could only be established experi-mentally. The power law with its four parameters,used together with other kinetic parameters (e.g.those related to the growth of the crystals) seems tobe perfectly adequate to describe the steady-statemedian crystal size in continuous crystallizationprocesses.
The power law, however, fails to describe the dy-namics of a crystallization process. If, for example,the median crystal size is plotted versus time fromimmediately after the start-up, often an oscillatingbehaviour is observed that dampens out until Rnallya steady-state value is reached (Figure 5). This oscil-lating behaviour can be explained by the observationthat only crystals above a certain size breed secondarynuclei by attrition. The Rrst nuclei are created byprimary nucleation and grow out, which causes thesupersaturation to decrease. When the mean size hasreached its Rrst peak, more of the larger crystals arewithdrawn with the product than are grown into thelarger crystal sizes by outgrowth of secondary nuclei.This happens because at the early stages no largecrystals are available for breeding.
Some groups have tried to account for this phe-nomenon by adding a target efRciency to thepower law that is a function of the crystal size. Oneauthor, Eek, allowed only crystals above a certain sizeto breed. This improved the simulations, althoughnone of them was fully successful.
An attrition function for the crystals, was intro-duced by O’Meadhra based on the approach ofMersmann. He distributed the attrited volume over thesmall crystal sizes. In this way a birth function B(L)was calculated from the volumetric attrition rate.A disadvantage of this modelling, in common with thepower law, is that it has no predictive value, since
the attrition function also must be determined experi-mentally for the particular crystallizer.
Gahn and Mersmann were the Rrst to derive a sec-ondary nucleation rate model based on physical attri-tion properties. Their approach comprises three con-secutive steps and calculates the secondary nucleationrate of crystals that collide with the blades of animpeller.
1. A simpliRed Sow pattern based on geometric con-siderations as presented by Ploss et al. is used tocalculate the impact velocity and the chance ofcrystals from size class i to collide with an impellersegment j.
2. Subsequently a model was developed to calculatethe volume of attrition fragments produced duringa single collision of a crystal corner represented bya cone, and a hard Sat surface of the impeller. Themodel relates the attrited volume of crystal i andsegment j to the impact energy of the crystal colli-sion via its relevant mechanical properties, such asthe Vickers hardness, the fracture resistance of thesubstance and the shear modulus. The model as-sumes that the circulation time is sufRcient toheal the damaged crystal corner before a sub-sequent collision of the same corner takes place.This assumption is often not valid for crystallizersup to 100 L. A minimum impact energy requiredto cause fracture can also be derived, and thus theminimum crystal size for a given velocity proRle isprone to attrition. The model also provides a nor-malized number density function of the fragmentswith a minimum and maximum size of fragmentsformed at each collision of crystal i with impellersegment j. In general, the size distribution of frag-ments lies in the range from 2 to 100 �m.
3. In the third step the rate of secondary nucleation islinked to the rate of formation of attrition frag-ments. The amount of stress remaining in thefragments limits the number that grows into thepopulation, because stress increases their chemicalpotential. Their real saturation concentrationcH becomes:
cHreal"cHexp � K
KTLfragment� [56]
The stress content of the fragments is directly relatedto their length, and the value of K has to be deter-mined experimentally, for example from experimentswhere the Rnes of a crystallizer are withdrawn, andallowed to grow out in a growth cell.
The formed fragments with size Lfragment can now bedistributed with their respective length and stresscontent. A number of fragments will dissolve, and the
74 I / CRYSTALLIZATION / Derivatization

Figure 6 Diffusion of a growth unit towards and integration intothe crystal surface layer.
Figure 7 Concentration profile perpendicular to the crystal surface during growth.
rest will grow into the population with a size-depen-dent growth rate.
This model does not deliver a secondary nucleationrate, B0, with nuclei born at zero size or a birth term,B(L), for the distribution of secondary nuclei, butcalculates from the number of collisions, and fromthe surviving fragments per collision, the number ofnew developing crystals. Since for this calculation aninitial CSD is needed, iteration loops are alwaysneeded if this nucleation model is used as a predictivetool for secondary nucleation.
Both this model and that of O’Meadhra are able todescribe the dynamic behaviour of crystallizationprocesses.
Crystal Growth
DeVnitions of growth rate The growth rates of thecrystallographically different faces (h k l) of acrystal can vary considerably. The growth rates of thecrystal faces determine the shape of the crystal and,together with the growth mechanisms, also the crystalsurface structure.
The growth rate of a particular crystal face (h k l) ismostly deRned by its linear growth rate Rlin (m s�1),which refers to the growth rate of that face along thenormal direction. An overall linear growth rateRM lin averaged over all different (h k l) faces can bedeRned in several ways. One deRnition which is oftenused relates RM lin to the increase of the crystal mass intime:
1A
dmdt
" �kv
kaL2
dL3
dt"3
kv
ka�GL"6
kv
ka�RM lin [57]
For spheres and cubes (or for crystals where L isbased on the diameter of a sphere with the samevolume), ka/kv"6, and:
1A
dmdt
"12
�GL"�RM lin [58]
Note that G"dL/dt"2 RM lin for substitution ofthe linear rate equations in the population balanceequation.
Crystal growth mechanisms For growth from solu-tion the crystal growth processes can be roughlydivided into two steps (Figure 6):
1. (volume) diffusion of growth units towardsthe crystal}solution interface
2. subsequent integration of these growth units intothe crystal surface
The concentration proRle perpendicular to thecrystal surface is given in Figure 7, where the concen-trations in the bulk at the crystal}solution interfaceand the equilibrium concentration at the growth siteare indicated by cb, ci and cH respectively.
For very soluble compounds, the growth rate isonly limited by diffusion through the stagnantlayer with thickness � at the interface, with cb!cH asthe driving force for diffusion. For poorly solublecompounds the surface integration step is growth-limiting, and the driving force for the integrationequals cb!cH. For most compounds, however, bothsteps must be taken into account. For growth fromthe melt the transport of the heat of crystallizationbecomes a third rate-limiting step. This is also thecase for very concentrated solutions. In the following,Rrst the surface integration and volume diffusiongrowth mechanisms and the related growth rate
Sepsci*31*TSK*Venkatachala=BGI / CRYSTALLIZATION 75

Figure 8 Growth curves for spiral, birth and spread (B&S) andrough growth.
expressions will be given, as well as the growthrate expressions for a combination of both steps. Theexpressions for heat transfer-controlled growth andfor simultaneous heat and mass transfer will not bediscussed here.
Surface integration controlled growth
Rough surfaces The structure of a growing surfaceat a molecular level is inSuenced by several factors:Rrst, by the binding energies between the atoms, ionsor molecules in the crystal surface layer. Also thesolvent, temperature and driving force can play animportant role. Depending on these factors, surfacescan become roughened. For a given compound anda selected solvent, either thermal or kinetic roughen-ing may occur.
Each crystal face has a critical temperature abovewhich the surface becomes rough. For ionic com-pounds these temperatures are very high, and alwaysabove the normal operating conditions. For organiccompounds, however, roughening temperatures caneven be close to room temperature, as with paraf-Rn crystals growing from hexane. For rough growththe crystal faces tend to become rounded, especiallyat the edges, and nicely faceted crystals are no longerformed.
Kinetic roughening is caused by growth at toohigh supersaturation, and also happens for ionic sub-stances. Rough growth always affects the crystalquality in a negative way, in particular the crystalpurity, since impurities or solvent molecules are moreeasily incorporated.
It is not surprising that for rough growth the lineargrowth rate depends linearly on the supersaturation,because all surface sites can act as growth sites, andthe rate constant kr is proportional to the solubility ofthe compound. The solubility reSects the number ofgrowth units that potentially impinges on the crystalsurface, and thus contributes to its growth. The lineargrowth rate is given by:
Rlin"kr� [59]
Smooth surfaces For growth of smooth crystalfaces, as normally happens under moderate operatingconditions, an orderly deposition of subsequentgrowth layers is needed. This can be realized by thepropagation of growth steps along the crystal surface(Figure 6). Two sources can be identiRed for thegeneration of steps, and the two mechanisms oflayered crystal growth are named after these sources:the ‘birth and spread’ or two-dimensional (2D) nu-cleation and growth model or the spiral growthmodel.
In the birth and spread model the steps are gener-ated by the formation of 2D nuclei on the crystalsurface that grow into islands by spreading laterallyalong the crystal surface. New nuclei can be formedon the original surface as well as on top of the alreadygrowing island. 2D nuclei can only be formed if thesupersaturation is high enough to overcome the 2Dnucleation barrier. The linear growth rate is given by:
Rlin"kr(S!1)2/3S1/3exp�!B2D
3 ln S� [60]
where S"�#1.At low supersaturations, where 2D nuclei are not
yet formed, screw dislocations that are present aslattice defects in the crystals and emerge on the crystalsurface will act as step sources. The steps will curvearound the defect emerging point, and spiral hillocksare formed.
The linear growth rate, also known as the para-bolic growth law, equals:
Rlin"kr�2 [61]
In both eqns [60] and [61] kr is directly propor-tional to the solubility of the compound. This solubil-ity dependence is clearly seen in plots of the growthrates and the mean crystal sizes of many salts versusthe supersaturation, as given by Mersmann. So, at thelow supersaturations generally prevailing in evapor-ative and cooling crystallization, the surface integra-tion growth step mostly obeys the parabolic low. Athigher supersaturations, 2D nucleation and growthtake over. If, at very high supersaturations, the size ofthe 2D nuclei approaches that of one growth unit,rough growth occurs (Figure 8).
Volume diffusion controlled growth Becausediffusion through the stagnant boundary layer atthe crystal surface is the rate-limiting step, this
76 I / CRYSTALLIZATION / Derivatization

growth model is also called the diffusion layermodel. Even for rather concentrated solutions thesimpliRed Fick’s law can be applied, and the increasein crystal mass is given by:
dmdt
"D�
A(cb!cH)"kdA(cb!cH) [62]
The mass transfer coefRcient kd follows in itssimplest form from Sh"kdL/D, where for Sh severalcorrelations provided in literature can be used. Thevalues for Sh generally lie between 2 and 10. Forconcentrated solutions the MaxwelldStefan equationis used
dmdt
" kd
(1!w)A(cb!cH) [63]
with w"mass fraction of the solute.So, for most cases the linear growth rate is given by:
RM lin"kakd
6kv�cH� [64]
The dependency of RM lin on � is Rrst order, and RM lin isdirectly related to the solubility. It always limits themaximal growth rate by which a crystal can grow ata given supersaturation in Figure 8.
Volume diffusion and surface integration con-trolled growth For combined volume diffusionand rough growth as growth rate-determining steps,the growth process can be described by:
1A
dmdt
" kdkr
kd#kr(cb!cH) [65]
while for combined volume diffusion and spiralgrowth surface integration the growth rate becomes:
1A
dmdt
"kd(cb!cH)# k2d
2kr!�
k4d
4k2r#k3
d(cb!cH)kr �
1/2
[66]
With eqn [57] either RM lin or G can be calculated.The temperature dependence of kr and kd is given
by an Arrhenius-type equation, where the corre-sponding Arrhenius activation energies are typicallyof the order of 40}60 kJ mol L�1 for surface integra-tion and 10}20 kJ mol�1 for the volume diffu-sion step.
For easily soluble compounds generally lineargrowth rates of 10�7 m s�1 are permissible in order to
obtain smoothly grown crystals at � values of 0.001to 0.01, while for slightly soluble substances growthrates of 10�9 to 10�8 m s�1 are commonly encoun-tered at � values of 10}100. Their correspondingmean sizes vary from 600 �m to 10 �m respec-tively.
Growth rate dispersion Small crystals, regardlesswhether they are born by primary or secondary nu-cleation, grow slower than their parent crystals. Thisis attributed to a certain content of stress in the smallcrystals. During the growth of the nuclei, the outerlayers of the crystals lose some of the stress } a pro-cess called healing. Although the stress content ofindividual small crystals of the same size can dif-fer, and thus their growth rate } a phenomenonnamed growth rate dispersion } the overall effectof stress on the growth rate of a large number of smallcrystals can equally be described by a size-dependentgrowth function. The equilibrium concentration thenbecomes a size-dependent function analogous toeqn [56].
G(L)"kg��!Wi(L)kT �
g
[67]
where Wi(L)" k/Lfragment and g"1 for volume dif-fusion-dominated growth, and 2 for spiral growth.The value of k is, as mentioned before, a Rttingparameter that has to be determined experimentally.
Dissolution of Crystals
Only at very low undersaturations or for extremelyinsoluble substances such as BaSO4, the dissolutionprocess proceeds by the disappearance of subsequentlayers, and a smooth surface is maintained. Normallysurface disintegration occurs at the crystal edges andat etch pits, and the surface becomes easilyroughened. So the dissolution rate is either given byan expression where only volume diffusion israte controlling:
!1A
dmdt
"kd(cH!cb) [68]
or by a combined volume diffusion and surfacedisintegration rate, as given by eqn [65] and, morerarely, by eqn [66], but now with a negative value forthe change in mass, and a decreasing A.
Agglomeration
The agglomeration process consists of the transporta-tion and collision of particles, and the attachment ofthe particles, followed by either disruption or cemen-
Sepsci*31*TSK*Venkatachala=BGI / CRYSTALLIZATION 77
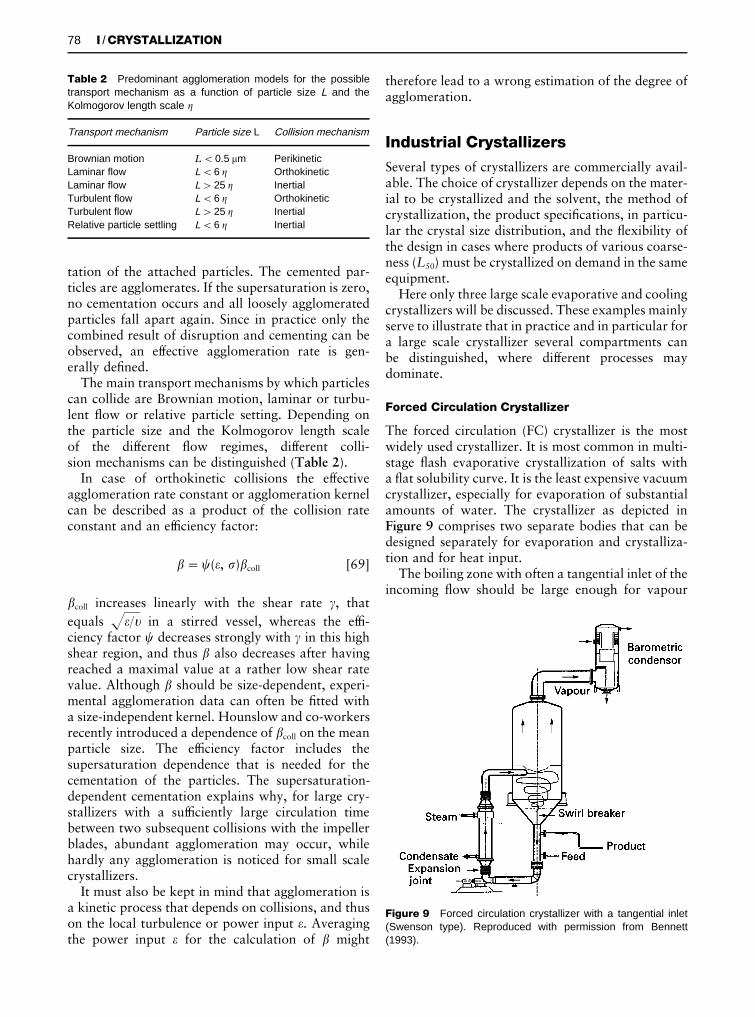
Table 2 Predominant agglomeration models for the possibletransport mechanism as a function of particle size L and theKolmogorov length scale �
Transport mechanism Particle size L Collision mechanism
Brownian motion ¸(0.5 �m PerikineticLaminar flow L(6 � OrthokineticLaminar flow L'25 � InertialTurbulent flow L(6 � OrthokineticTurbulent flow L'25 � InertialRelative particle settling L(6 � Inertial
Figure 9 Forced circulation crystallizer with a tangential inlet(Swenson type). Reproduced with permission from Bennett(1993).
tation of the attached particles. The cemented par-ticles are agglomerates. If the supersaturation is zero,no cementation occurs and all loosely agglomeratedparticles fall apart again. Since in practice only thecombined result of disruption and cementing can beobserved, an effective agglomeration rate is gen-erally deRned.
The main transport mechanisms by which particlescan collide are Brownian motion, laminar or turbu-lent Sow or relative particle setting. Depending onthe particle size and the Kolmogorov length scaleof the different Sow regimes, different colli-sion mechanisms can be distinguished (Table 2).
In case of orthokinetic collisions the effectiveagglomeration rate constant or agglomeration kernelcan be described as a product of the collision rateconstant and an efRciency factor:
�"�(�, �)�coll [69]
�coll increases linearly with the shear rate �, thatequals ��/� in a stirred vessel, whereas the efR-ciency factor � decreases strongly with � in this highshear region, and thus � also decreases after havingreached a maximal value at a rather low shear ratevalue. Although � should be size-dependent, experi-mental agglomeration data can often be Rtted witha size-independent kernel. Hounslow and co-workersrecently introduced a dependence of �coll on the meanparticle size. The efRciency factor includes thesupersaturation dependence that is needed for thecementation of the particles. The supersaturation-dependent cementation explains why, for large cry-stallizers with a sufRciently large circulation timebetween two subsequent collisions with the impellerblades, abundant agglomeration may occur, whilehardly any agglomeration is noticed for small scalecrystallizers.
It must also be kept in mind that agglomeration isa kinetic process that depends on collisions, and thuson the local turbulence or power input �. Averagingthe power input � for the calculation of � might
therefore lead to a wrong estimation of the degree ofagglomeration.
Industrial Crystallizers
Several types of crystallizers are commercially avail-able. The choice of crystallizer depends on the mater-ial to be crystallized and the solvent, the method ofcrystallization, the product speciRcations, in particu-lar the crystal size distribution, and the Sexibility ofthe design in cases where products of various coarse-ness (L50) must be crystallized on demand in the sameequipment.
Here only three large scale evaporative and coolingcrystallizers will be discussed. These examples mainlyserve to illustrate that in practice and in particular fora large scale crystallizer several compartments canbe distinguished, where different processes maydominate.
Forced Circulation Crystallizer
The forced circulation (FC) crystallizer is the mostwidely used crystallizer. It is most common in multi-stage Sash evaporative crystallization of salts witha Sat solubility curve. It is the least expensive vacuumcrystallizer, especially for evaporation of substantialamounts of water. The crystallizer as depicted inFigure 9 comprises two separate bodies that can bedesigned separately for evaporation and crystalliza-tion and for heat input.
The boiling zone with often a tangential inlet of theincoming Sow should be large enough for vapour
78 I / CRYSTALLIZATION / Derivatization

Figure 10 Stirred draft tube baffle (DTB) crystallizer with anexternal heat exchanger and fines destruction (Swenson type).Reproduced with permission from Bennett (1993).
Figure 11 Fluidized bed crystallizer (Swenson type). Repro-duced with permission from Bennett (1993).
release, while the vessel bulk zone should maintaina sufRciently large volume to retain the growingcrystals until the supersaturation is consumed.A slurry pump circulates the crystal slurry throughthe tubes of the heat exchanger, that can act as aninternal Rnes dissolver, back into the boiling zone.This pump also creates most of the attrition frag-ments that may grow out as secondary nuclei, al-though usually an (axial-type) centrifugal pump isapplied to minimize the attrition in order to get a suf-Rciently large mean crystal size. Because the forcedcirculation causes good mixing, the FC crystallizer isoften modelled as a one compartment or MSMPRcrystallizer in spite of its various zones.
The supersaturation and the turbulence may how-ever differ locally.
Draft Tube Baf]ed Crystallizer
In this draft tube bafSed (DTB) crystallizer withan external heat exchanger, as depicted in Figure 10,the heat duty is also separated from the crystallizerbody. Fines removal has been realized by installinga skirt bafSe that creates a settling or annularzone. The Sow in the draft tube thus has to be up-wards: this is effected by the impeller that alsocreates most of the attrition fragments. The Rnes Sowcan be diluted or heated to partly or totally dissolve
the Rnes. An increase in Rnes Sow increases the num-ber of Rnes that are removed from the crystallizer, butalso the cut size of the Rnes. The Rnes loop in this wayserves as an actuator that can be applied for controlof the mean crystal size, although the variation inmean crystal size that can be achieved is limited.
The addition of an elutriation leg at the bottom ofthe crystallizer or the addition of another type ofclassiRer allows classiRcation of the product Sow, andthus also serves as an actuator to inSuence the CSD ofthe product.
Obviously the various zones of the DTB crystallizerhave different functions, and different super-saturation and turbulence values can be expected, inparticular for large scale crystallizers.
The DTB crystallizer can also be applied as coolingcrystallizer by using the heat exchangers as a coolingsystem.
Fluidized Bed Crystallizer
A Suidized bed crystallizer (Figure 11) is especiallydesigned to produce large and uniformly sized crys-tals. The heat duty and the crystallizer body are againseparated. At the top of the bed the crystals aresettled, and only the Rnes leave the crystallizer withthe exhausted mother liquor to be circulated throughthe heat exchanger after mixing with the feed stream.The hot circulated Sow enters the vaporizer head,where the solvent is Sashed off. The super-saturated solution leaves the vaporizer through thedowncomer, and enters the densely packed Suidizedbed at the bottom of the crystallizer. The supersatura-tion is consumed on its way up, and a coarse productleaves the crystallizer at the bottom.
Secondary nucleation here results fromcrystal}crystal collisions. Also for this crystallizerseveral functions can be identiRed that are restrictedto various zones in the crystallizer. The supersatura-tion and the turbulence are also not evenly distributed.
Sepsci*31*TSK*Venkatachala=BGI / CRYSTALLIZATION 79

Figure 12 (A) A DTB crystallizer and (B: a,b) two compartment structures.
Since the residence time of the crystals can be con-siderably increased, this type of crystallizer is com-monly used to produce large crystals.
This crystallizer can also be used for cooling crys-tallization. No vapour chamber is then needed. Otherwell-known cooling crystallizers are: Rrst, a Swensontype where the suspension is circulated through a heatexchanger; second, a direct cooling crystallizer,where a refrigerant is introduced directly into a drafttube crystallizer; and third, a cooling disc crystallizer,that can be regarded as a compact cascade of coolingcrystallizers with various cooling elements that arescraped by rotating wipers.
Compartmental Modelling
In an industrial crystallizer various zones with dif-ferent functions can be identiRed, as has been illus-trated in the former section. The supersaturation(Kramer et al. 1999) and the turbulence (Derksen andvan den Akker, 1999) in a crystallizer are thereforenot necessarily evenly distributed. Their local valuesdepend on the geometry and scale of the crystallizer,
on the Sow pattern, as well as on the rates of thekinetic processes and the production rate of the speci-Rc crystallizing compound. In particular, the nonlin-ear kinetic processes such as nucleation and agglom-eration are strongly dependent on these local values.It also has to be established whether locally the super-saturation does not exceed a maximum beyond whichvalue rough growth occurs or too many solvent inclu-sions are incorporated in the crystals.
As the conventional modelling techniques use geo-metrically lumped descriptions (i.e. MSMPR) ofthe physical processes inside a crystallizer vessel(Randolph, 1998; Mersmann, 1995; Eek, 1995;O’Meadhra, 1996), they do not account for the vari-ations in the local process conditions and have there-fore seldom proven to be reliable for scale-up pur-poses. A reliable tool for modelling of crystallizersrequires the separation of kinetics and hydrodynam-ics. A well-known technique for this purpose is com-partmental modelling. This technique, which is fre-quently applied for standard reactor engineeringproblems, has been applied within crystallization fora number of years (Kramer, 1999).
80 I / CRYSTALLIZATION / Derivatization
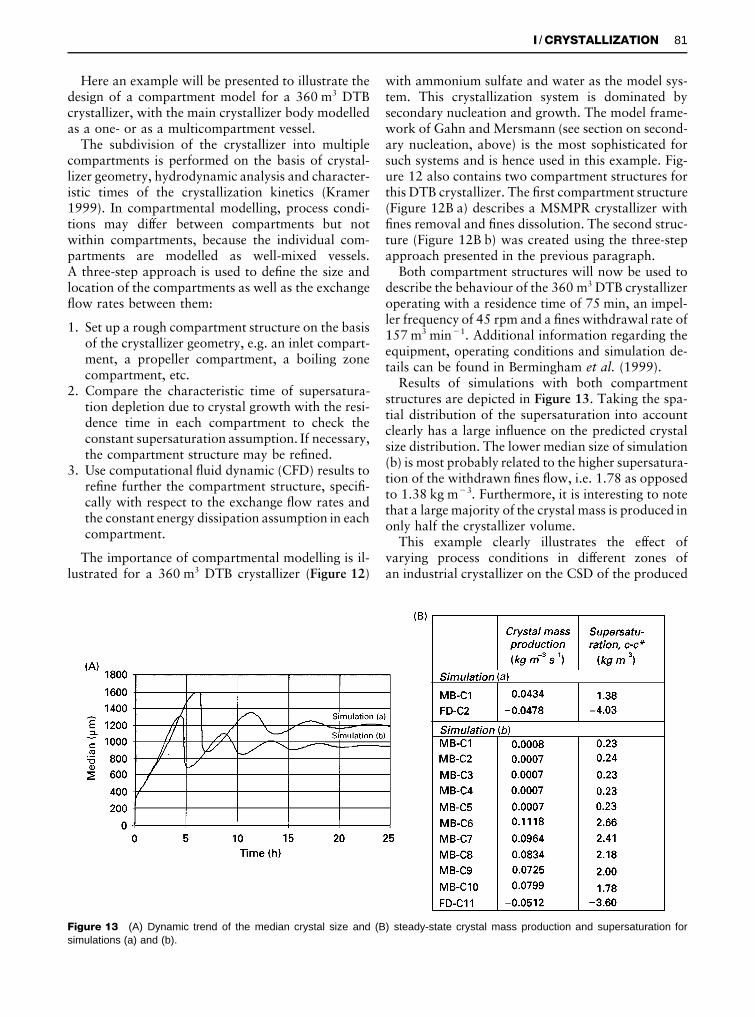
Figure 13 (A) Dynamic trend of the median crystal size and (B) steady-state crystal mass production and supersaturation forsimulations (a) and (b).
Here an example will be presented to illustrate thedesign of a compartment model for a 360 m3 DTBcrystallizer, with the main crystallizer body modelledas a one- or as a multicompartment vessel.
The subdivision of the crystallizer into multiplecompartments is performed on the basis of crystal-lizer geometry, hydrodynamic analysis and character-istic times of the crystallization kinetics (Kramer1999). In compartmental modelling, process condi-tions may differ between compartments but notwithin compartments, because the individual com-partments are modelled as well-mixed vessels.A three-step approach is used to deRne the size andlocation of the compartments as well as the exchangeSow rates between them:
1. Set up a rough compartment structure on the basisof the crystallizer geometry, e.g. an inlet compart-ment, a propeller compartment, a boiling zonecompartment, etc.
2. Compare the characteristic time of supersatura-tion depletion due to crystal growth with the resi-dence time in each compartment to check theconstant supersaturation assumption. If necessary,the compartment structure may be reRned.
3. Use computational Suid dynamic (CFD) results toreRne further the compartment structure, speciR-cally with respect to the exchange Sow rates andthe constant energy dissipation assumption in eachcompartment.
The importance of compartmental modelling is il-lustrated for a 360 m3 DTB crystallizer (Figure 12)
with ammonium sulfate and water as the model sys-tem. This crystallization system is dominated bysecondary nucleation and growth. The model frame-work of Gahn and Mersmann (see section on second-ary nucleation, above) is the most sophisticated forsuch systems and is hence used in this example. Fig-ure 12 also contains two compartment structures forthis DTB crystallizer. The Rrst compartment structure(Figure 12B a) describes a MSMPR crystallizer withRnes removal and Rnes dissolution. The second struc-ture (Figure 12B b) was created using the three-stepapproach presented in the previous paragraph.
Both compartment structures will now be used todescribe the behaviour of the 360 m3 DTB crystallizeroperating with a residence time of 75 min, an impel-ler frequency of 45 rpm and a Rnes withdrawal rate of157 m3 min�1. Additional information regarding theequipment, operating conditions and simulation de-tails can be found in Bermingham et al. (1999).
Results of simulations with both compartmentstructures are depicted in Figure 13. Taking the spa-tial distribution of the supersaturation into accountclearly has a large inSuence on the predicted crystalsize distribution. The lower median size of simulation(b) is most probably related to the higher supersatura-tion of the withdrawn Rnes Sow, i.e. 1.78 as opposedto 1.38 kg m�3. Furthermore, it is interesting to notethat a large majority of the crystal mass is produced inonly half the crystallizer volume.
This example clearly illustrates the effect ofvarying process conditions in different zones ofan industrial crystallizer on the CSD of the produced
Sepsci*31*TSK*Venkatachala=BGI / CRYSTALLIZATION 81

Figure 14 Liquid inclusions in (NH4)2SO4 crystal embedded ina liquid of similar refractive index.
crystals. Compartmental modelling is therefore an im-portant or even essential tool in the design of industrialcrystallizers to predict the inSuence of crystallizer ge-ometry, scale, operating conditions and process ac-tuators on the process behaviour and product quality.
Only using this approach can a reasonable predic-tion can be obtained for the composition of the bleedand/or product streams, and of the Rlterability andwashability of the product, which determine the ef-Rciency of this separation process.
Product Properties Related to theProcess Conditions
In order to apply crystallization as an adequate separ-ation process, the solid phase has to fulRl a number ofrequirements. The crystal size distribution as well asthe shape of the crystals should meet the demands ofa good Rlterability and washability of the product, asis needed for a good separation. The surface rough-ness of the crystals may also play a role, becausea rough surface leads to attrition, and the attritedfragments may hamper the downstream processes.
The crystals should be formed under process condi-tions that minimize the uptake of impurities ormother liquor inclusions in the crystals. This canhappen when the (local) supersaturation is too high.A too high local turbulence should be avoided, thiscauses attrition of especially the corners or edges ofthe crystals. Although healing of the crystals willoccur particularly in the regions of the highest super-saturations, this healing process is never perfect, andalways leads to the uptake of solvent inclusions. Thatcrystals are prone to attrition beyond a certain sizethat also depends on the degree of turbulence can beseen from Figure 14.
Agglomeration should in general be prevented,since liquid incorporation between the primary par-
ticles of an agglomerate is unavoidable. Only if, asoften happens in precipitation processes, the primaryparticles are too small for Rltration, agglomerationshould just be promoted. In that event the soluteconcentration in the mother liquor is extremely lowand some incorporation of it in the solid phase hardlyaffects the separation process.
Final Remarks
To summarize, it can be said that the design of a goodevaporative or cooling crystallization process is basedon heat, mass and population balances, kinetic pro-cesses of nucleation, growth and agglomeration of theparticles, as well as on the hydrodynamics that existin the crystallizer of a given geometry and scale.However, as the prevailing process conditions are notevenly distributed in industrial crystallizers, local de-scriptions of the crystallization phenomena areneeded to calculate the local variations in the processconditions, their effect on the process perfor-mance and to predict their dependence of the scaleand geometry of the crystallizer. It has been shownthat by taking all these balances and processes intoaccount in a compartmental modelling tool, the ef-Rciency of the separation process as well as the qual-ity of the crystalline product and the process perfor-mance can be properly predicted.
Symbols
a activity J mol�1
A primary nucleation factor �m�3 s�1
AT total crystal surface areaper unit crystallizervolume
m2 m�3
B(�, v) breakage function �m�1
B0 birth rate �m�3 s�1
B(L) birth rate (size-based) �m�3 m�1 s�1
B(v) birth rate (volume-based) �m�3 m�3 s�1
c concentration kg m�3
Cp speciRc heat J kg�1 K�1
D(L, t) death rate �m�3 m�1 s�1
D(v, t) death rate �m�3 m�3 s�1
GL or G linear growth rate m s�1
GV volumetric growth rate m3 s�1
H enthalpyH(L) classiRcation function *J primary nucleation rate �m�3
k Bolzmann constant J K�1
ka, kv surface, volume shapefactor
*
kn or kHv nucleation rate constant *kdistr distribution constant
impurity uptake*
82 I / CRYSTALLIZATION / Derivatization

L particle length mLD dominant crystal size mLT total crystal length per
unit crystallizer volumem m�3
mj jth moment of adistribution
2
MT total crystal mass perunit crystallizer volume
kg m�3
m(L) mass density kg m�3 m�1
m(v) mass density kg m�3 m�3
n(L) number density �m�3 m�1
n(v) number density �m�3 m�3
NT total number of crystals �m�3
P production rate kg s�1
r radius mr(v1, v2) rate of aggregation �m�9 s�1
R gas constant J mol�1 K�1
Rlin linear growth rate of acrystal face
m s�1
S supersaturation ratio *S(v) selection function s�1
t time sT temperature Ku particle volume m3
v particle volume m3
V crystallizer volume m3
VT total crystal volume perunit crystallizer volume
m3 m�3
Vmolar molar volume m3 mol�1
w mass fraction *Wi stress energy crystals J� aggregation kernel m3 s�1
� interfacial free energy,activity coefRcient
J m�2, r
� speciRc power inputimpeller
W m�3
� Kolmogorof length scale m�v volumetric Sow rates m3 s�1
� chemical potential J mol�1
� material density kg m�3
� relative supersaturation * residence time s� efRciency factor for
agglomeration*
k surface-related stress Jm
See Colour Plate 4.
Further Reading
Arkenbout GF (1995) Melt Crystallization Technology.Lancaster, USA: Technomic.
Becker R and GoK ring W (1935) Kinetische Behandlung derKeimbildung in uK bersaK ttigten DaKmpfen. Ann Physik 24:719d752.
Bennema P (1993) Growth and morphology of crystals. In:Hurle DTJ (ed.) Handbook of Crystal Growth, vol. 1A,pp. 477}583. Amsterdam: Elsevier Science.
Bennett RC (1993) Crystalliser selection and design. In:Meyerson A (ed.) Handbook of Industrial Crystallisa-tion, pp. 103}130. Boston: Butterworth Heinemann.
Bermingham SK, Neumann AM, Kramer HJM et al. (1999)A design procedure and predictive models for solutioncrystallisation processes. In: Proceedings of Fifth Inter-national Conference on Foundations of Computer AidedProcess Design, FOCAPD’99, Breckenridge, USA,paper I21.
Derksen J and van den Akker HEA (1999) Large eddysimulations on the Sow driven by a rushton turbine.AIChE Journal 45: 209}221.
Eek RA, Dijkstra SJ and van Rosmalen GM (1995) Dy-namic modelling of suspension crystallisers, using ex-perimental data. AIChE Journal 41: 571}584.
Gahn C and Mersmann A (1997) Theoretical predictionand experimental determination of attrition rates.Transactions IChemE 75(A): 125}131.
Gahn C and Mersmann A (1999) Brittle fracture in crystal-lisation processes. Part A. Attrition and abration ofbrittle solids. AIChE Journal 54: 1273}1282.
Gahn C and Mersmann A (1999b) Brittle fracture in crys-tallisation processes. Part B. Growth of fragments andscale up of suspensions crystallisers. AIChE Journal 54:1283}1292.
Hounslow MJ (1998) The population balance as a tool forunderstanding particle rate processes. KONA 16:179}193.
Hounslow MJ, Mumtaz HS, Collier AP, Barrick JP andBramley AS (1999) Aggregation during precipitation} putting the pieces of the puzzle together. Proceedingsof the 14th International Symposium on Industrial Crys-tallization, CD ROM.
Hurle D (1993) Handbook of Crystal Growth. Amsterdam:Elsevier Science.
Ilievski D and Hounslow MJ (1995) Tracer studies ofagglomeration during precipitation. Part II: Quantitat-ive analysis of tracer data and identiRcation of mecha-nism. AIChE Journal 41: 525}535.
Kashchiev D (2000) Nucleation: Theory and Application.Oxford: Butterworth Heinemann.
Kind M and Mersmann A (1990) On supersaturation dur-ing mass crystallisation form solution. Chemical Engin-eering Technology 13: 50}62.
Kramer HJM, Dijkstra JW, Neumann AM et al. (1996)Modelling of industrial crystallizers, a compartmentalapproach using a dynamic Sow-sheet tool. Journal ofCrystal Growth 166: 1084}1088.
Kramer HJM, Bermingham SK and van Rosmalen GM(1999) Design of industrial crystallisers for a requiredproduct quality. Journal of Crystal Growth 198/199:729}737.
Litster, JD, Smit DJ and Hounslow MJ (1995) Adjustabledicretized population balance for growth and aggrega-tion. AIChE Journal 41: 591}603.
Sepsci*31*TSK*Venkatachala=BGI / CRYSTALLIZATION 83

Mersmann A (1988) Design of crystallisers. Chemical En-gineering Process 23: 213}228.
Mersmann A (1995) Crystallisation Technology Hand-book. New York: Marcel Dekker.
Meyerson AS (1993) Handbook of Industrial Crystallisa-tion. Boston: Butterworth Heinemann.
Mullin JW (1993) Crystallisation. Boston: ButterworthHeinemann.
Mumtaz HS, Hounslow, MJ, Seaton NA and Paterson WR(1997) Orthokinetic aggregation during precipitation:a computational model for calcium oxalate. Transac-tions of the IChemE 75: 152}159.
Mutaftschiev B (1993) Nucleation theory. In: Hurle DTJ(ed.) Handbook of Crystal Growth, vol. 1A, pp.187}247. Amsterdam: Elsevier.
Nicmanis M and Hounslow MJ (1998) Finite-elementmethods for steady-state population balance equations.AIChE Journal 44: 2258}2272.
Nyvlt J (1992) Design of Crystallisers. Boca Raton, FL:CRC Press.
OD Meadhra R, Kramer HJM and van Rosmalen GM (1996)A model for secondary nucleation in a suspension crys-talliser. AIChE Journal 42: 973}982.
Ottens EPK, Janse AH and De Jong EJ (1972) Secondarynucleation in a stirred vessel cooling crystalliser. Journalof Crystal Growth 13/14: 500}505.
Plo{ R, Tengler T and Mersmann A (1989) A new model ofthe effect of stirring intensity on the rate of second-ary nucleation. Chemical Engineering Technology 12:137}146.
Randolph AD and Larson MA (1988) Theory of ParticulateProcesses. 2nd edn. New York: Academic Press.
Sinnott RK (1998) In: Chemical Engineering Design, vol. 6.(Coulson JM and Richardson JF eds.), Oxford: Butter-worth Heinemann.
SoK hnel O and Garside J (1992) Precipitation. Oxford: But-terworth Heinemann.
van der Eerden JP (1993) Crystal growth mechanisms: In:Hurle DTJ (ed.) Handbook of Crystal Growth, vol. 1A,pp. 307}477. Amsterdam: Elsevier Science.
van der Heijden AEDM, van der Eerden JP and van Ros-malen GM (1994) The secondary nucleation rate;a physical model. Chemical Engineering Science3103}3113.
Volmer M (1939) Kinetik der Phasenbildung. Dresden:Steinkopf.
DISTILLATION
R. Smith and M. Jobson, Department of ProcessIntegration, UMIST, Manchester, UK
Copyright^ 2000 Academic Press
Introduction
Distillation is the most commonly used method forthe separation of homogeneous Suid mixtures. Separ-ation exploits differences in boiling point, orvolatility, between the components in the mixture.Repeated vaporization and condensation of the mix-ture allows virtually complete separation of mosthomogeneous Suid mixtures. The vaporization re-quires the input of energy. This is the principal disad-vantage of distillation: its high energy usage.However, distillation has three principle advantagesover alternative methods for the separation of homo-geneous Suid mixtures:
1. The ability to handle a wide range of feed Sowrates. Many of the alternative processes for theseparation of Suid mixtures can only handle lowSow rates, whereas distillation can be designed forthe separation of extremely high or extremely lowSow rates.
2. The ability to separate feeds with a wide range offeed concentrations. Many of the alternatives todistillation can only separate feeds that are alreadyrelatively pure.
3. The ability to produce high product purity. Many ofthe alternatives to distillation only carry out a par-tial separation and cannot produce pure products.
It is no accident that distillation is the most commonmethod for the separation of homogeneous mixtures.It is a versatile, robust and well-understood technique.We shall start explaining distillation by a single-stageseparation, before understanding how to set up a cas-cade of separation stages, which is distillation.
Single-Stage Separation
Consider the liquid mixture illustrated in Figure 1. Ifthis liquid mixture is partially vaporized then thevapour becomes richer in the more volatile compo-nents (i.e. those with the lower boiling points) thanthe liquid phase. The liquid becomes richer in the lessvolatile components (i.e. those with the higher boilingpoints). If we allow the system in Figure 1 to come toequilibrium conditions, then the distribution of thecomponents between the vapour and liquid phases is
84 I / DISTILLATION / Derivatization