Biobased copolyesters: synthesis, crystallization behavior ...
Crystallization Behavior and Morphology of Polylactideand PLA/Clay Nanocomposites in the Presence ofChain Extenders
N. Najafi, M.C. Heuzey, P.J. CarreauDepartment of Chemical Engineering, Center for Applied Research on Polymers and Composites (CREPEC),Ecole Polytechnique, Montreal, Quebec, Canada
The effect of clay and chain extender on the noniso-thermal, isothermal crystallization kinetics, and mor-phology of polylactide (PLA) was investigated in thisstudy. PLA and PLA-based nanocomposites containing2 wt% organoclay were prepared via melt compound-ing. Three commercially available chain extenders wereused: polycarbodiimide (PCDI), tris(nonylphenyl) phos-phite (TNPP), and Joncryl ADR4368F. The nanoclay par-ticles were found to act as nucleating agents. Chainextender incorporation, however, had diverse effectson both crystallization rate and degree of crystallinity.Nonisothermal DSC results revealed that the additionof PCDI increased the cold-crystallization temperature(Tc) from 106 to 1148C, reduced the degree of crystal-linity from 6.3 to 5.3%, and resulted in the formation ofbimodal melting peaks in PLA. On the other hand, thereduction of chain ends in the presence of TNPPresulted in a significant increase of the crystallizationrate and degree of crystallinity from 6.3 to 15.2%. Inthe case of Joncryl, its incorporation led to the forma-tion of a long-chain branching structure, which dis-rupted the chain packing. Therefore, the degree ofcrystallinity (from 6.3 to 1.6%) and the rate of crystalli-zation decreased, while Tc was increased from 106 to1228C in the presence of Joncryl. POLYM. ENG. SCI.,53:1053–1064, 2013. ª 2012 Society of Plastics Engineers
INTRODUCTION
The environmental impact of petroleum-based polymers
and their waste management has motivated their substitu-
tion by more environmentally benign products. The most
common biodegradable polymers are polylactic acid
(PLA), polycaprolactone (PCL), polybutylene adipate ter-
ephthalate (PBAT), and polyhydroxy butyrate (PHB) [1].
PLA has attracted the most attention among them, due to its
high strength, high modulus, good processability, transpar-
ency after processing, and commercial availability [2, 3].
PLA is a linear aliphatic thermoplastic polyester derived
from renewable plant sources such as starch and sugar beet
[4]. PLA can be synthesized either by direct condensation
polymerization of lactic acid (hence called polylactic acid)
[5] or by ring-opening polymerization of cyclic lactide (pol-
ylactide) [6], leading to the production of low and high-mo-
lecular weights, respectively. Despite all the advantages of
PLA, there are nevertheless some drawbacks such as poor
gas-barrier properties, low-mechanical resistance, and melt
strength [2] that restrict its practical applications. Many
attempts have been made to overcome such shortcomings
and improve PLA properties. Some of these efforts have
been directed toward the incorporation of nanoscale par-
ticles including organomodified layered silicate, carbon
nanotubes, and TiO2 [7–10]. Although the mechanical and
barrier properties of PLA can be improved by the incorpo-
ration of organically modified clay, thermal degradation of
PLA seems to be intensified with clay loading, leading to a
loss of molecular weight [11–13]. However, it has been
shown that the use of a chain extender during compounding
can compensate for the molecular weight decrease, with an
overall positive impact on mechanical and physical proper-
ties [12–15].
It is well known that crystalline properties play an
essential role in physical, mechanical, and gas-barrier
properties. Meanwhile, the crystallization rate and ulti-
mate crystalline morphology are impacted significantly by
the thermal history [16]. As a consequence, a considerable
attention has been devoted to the fundamental understand-
ing of PLA-crystallization kinetics [3, 7, 10, 16–20].
Crystallization is a process associated with partial align-
ment of polymer chains, starting from nucleation and fol-
lowed by subsequent growth. In addition to thermal his-
tory, other factors strongly affect the nucleation process.
Crystal nucleation is considerably influenced by impur-
ities, dyes, fillers, plasticizers, etc. Once the nuclei are
formed, segments of a chain pull out of the amorphous
phase, fold together, and sequentially attach to the growth
front, forming an ordered structure called lamellae. The
resulting lamellar crystals then organize themselves into
Correspondence to: M.C. Heuzey; e-mail: [email protected]
Contract grant sponsor: NSERC (Natural Science and Engineering
Research Council of Canada).
DOI 10.1002/pen.23355
Published online in Wiley Online Library (wileyonlinelibrary.com).
VVC 2012 Society of Plastics Engineers
POLYMER ENGINEERING AND SCIENCE—-2013
larger spheroidal entities named spherulites [21]. Detailed
investigation in both melt crystallization and cold crystal-
lization of PLA and its stereocomplex have been exten-
sively performed [17, 19, 22]. It has been reported that
the degree of crystallization, crystallization growth rate,
and the resulting crystalline morphology are highly influ-
enced by chain structure, concentration of the residual
monomer, nucleating agent, thermal history, and environ-
mental factors like shear/stretching flow [17, 19, 22].
Besides these factors, the molecular weight is also a key
parameter governing the crystallization kinetics.
As previously mentioned, the incorporation of organo-
clay particles into PLA leads to further thermal degrada-
tion, decreasing the molecular weight and mechanical
properties. To control such degradation in PLA nanocom-
posites, chain extenders can be used, resulting in a reat-
tachment of cleaved polymer chains [12]. The impact of
different chain extenders, polycarbodiimide (PCDI), tris(-
nonylphenyl) phosphite (TNPP), hexamethylene diisocya-
nate (HDI), pyromellitic dianhydride (PMDA), and
Joncryl 1ADR 4368F on the thermal degradation of PLA
and PLA/clay nanocomposites was investigated in our
previous works [12, 13]. The effect of chain extender and
processing conditions on clay delamination and the result-
ing rheological, mechanical, and gas-barrier properties
were also investigated in our previous studies [9, 12].
Although the impact of PCDI and TNPP on the noniso-
thermal crystallization of PLA was briefly reported in Refs.
[23, 24], to our knowledge, no comprehensive report has
been published on the influence of these chain extenders on
the nonisothermal and isothermal crystallization behavior
of PLA-based nanocomposites. The objective of this work
is to show how the presence of a chain extender affects the
crystallization behavior of PLA and PLA-based nanocom-
posites using differential scanning calorimetry (DSC) and
polarized optical microscopy (POM).
EXPERIMENTAL
Materials
The PLA investigated in this study, PLA 4032D, is a
semicrystalline grade from NatureWorks, USA, having a D-
LA content of 2 mol%. The organomodified clay is Cloi-
site1 30B, supplied by Southern Clay Products. In addition,
three different chain extenders were used in this work: PCDI,
a carboxyl-reactive chain extender, TNPP, and Joncryl1
ADR 4368F. The two former ones were purchased from
Sigma Aldrich, Canada, and the latter was supplied by
BASF, Germany. All these products were used as received.
The molecular formulae of the chain extenders and the orga-
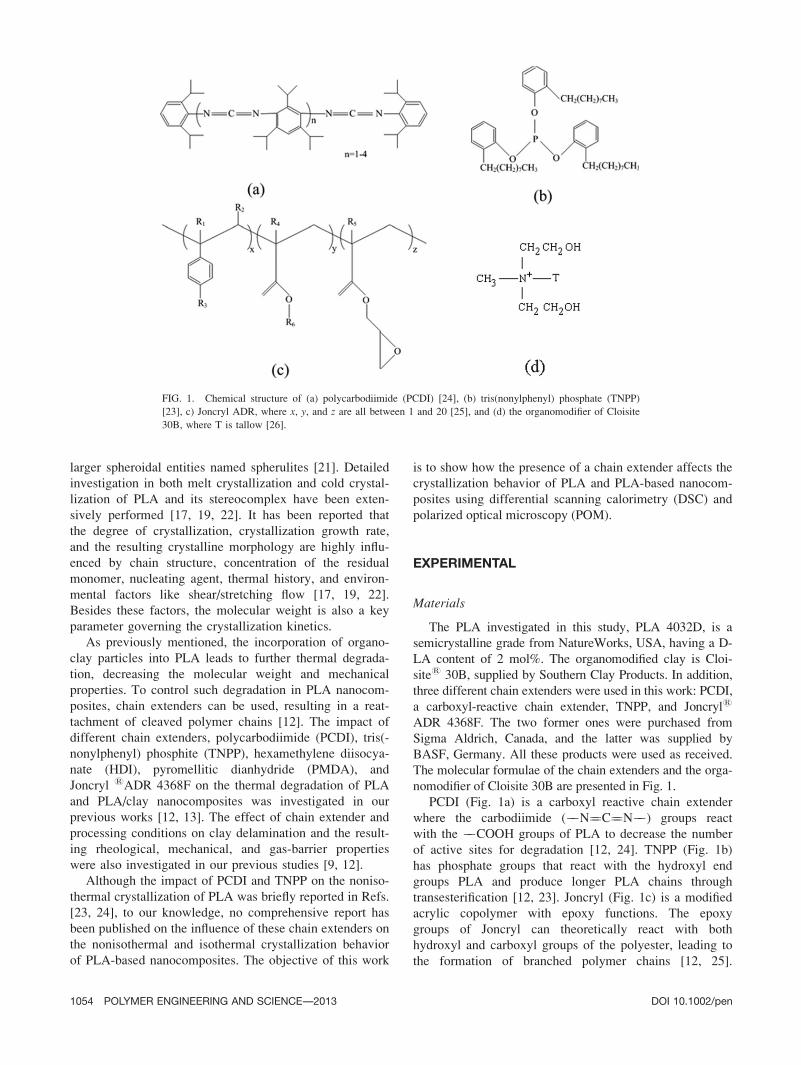
nomodifier of Cloisite 30B are presented in Fig. 1.
PCDI (Fig. 1a) is a carboxyl reactive chain extender
where the carbodiimide (��N¼¼C¼¼N��) groups react
with the ��COOH groups of PLA to decrease the number
of active sites for degradation [12, 24]. TNPP (Fig. 1b)
has phosphate groups that react with the hydroxyl end
groups PLA and produce longer PLA chains through
transesterification [12, 23]. Joncryl (Fig. 1c) is a modified
acrylic copolymer with epoxy functions. The epoxy
groups of Joncryl can theoretically react with both
hydroxyl and carboxyl groups of the polyester, leading to
the formation of branched polymer chains [12, 25].
FIG. 1. Chemical structure of (a) polycarbodiimide (PCDI) [24], (b) tris(nonylphenyl) phosphate (TNPP)
[23], c) Joncryl ADR, where x, y, and z are all between 1 and 20 [25], and (d) the organomodifier of Cloisite
30B, where T is tallow [26].
1054 POLYMER ENGINEERING AND SCIENCE—-2013 DOI 10.1002/pen

Finally, Cloisite1 30B (Fig. 1d) is an organically modi-
fied clay with two hydroxyl groups. The interaction
between the C¼¼O groups of PLA and the hydroxyl
groups of the organomodifier makes it highly compatible
with the PLA matrix [26].
Material Processing
Melt compounding of PLA with clay and chain ex-
tender was carried out in a counter-rotating Brabender
Plasti-Corder1 internal mixer. Before mixing, PLA and
clay were dried at 708C in a vacuum oven for 48 h. The
dried PLA was compounded in the molten state with 2
wt% dried clay and chain extender in the internal mixer.
The nomenclature used for the nanocomposites is as fol-
lows: PLA-2C–PCDI, PLA-2C–TNPP, and PLA-2C–J for
the systems containing 2 wt% PCDI, 1 wt% TNPP, or 1
wt% Joncryl as a chain extender and PLA-2C for PLA
and clay only. For comparison purposes, PLA without
and with chain extender but without clay was also com-
pounded under the same conditions and are, respectively,
named neat PLA, PLA–PCDI, PLA–TNPP, and PLA–J.
The mixing was conducted under nitrogen atmosphere at
a rotation speed of 100 rpm for 11 min, while the temper-
ature was set at 1908C. After mixing, the various systems
were immediately immersed in liquid nitrogen to avoid
thermo-oxidative degradation during cooling. Thereafter,
the processed materials were placed in a vacuum desicca-
tor at ambient temperature for further use.
Characterization
The nonisothermal melt-crystallization behavior of the
various specimens was investigated using a TA Instru-
ments differential scanning calorimeter (DSC-Q 1000)
under nitrogen atmosphere. Samples (�10 mg) were
encapsulated in aluminum standard pans. To eliminate
any initial thermal history, the samples were heated at a
scanning rate of 108C/min from 30 to 2508C, held for 2
min and then cooled to 308C at the same rate. The crys-
tallization enthalpy (DHc), melting enthalpy (DHm), and
degree of crystallinity were determined from the second
heating cycle performed at the same heating rate. To
study the kinetics of isothermal cold-crystallization behav-
ior (from glassy state) in the temperature range of 80–
1208C, all the specimens were first heated at 608C/min to
2508C and held there for 5 min. Then the molten samples
were cooled at 608C/min to 308C and subsequently
reheated at the same rate to the desired crystallization
temperature (Tc). The protocol used to study the isother-
mal crystallization behavior was similar to Refs. [27, 28].
The samples were kept at Tc until the crystallization was
complete. To compare the kinetics of isothermal melt
with that of cold crystallization, the specimens were
heated to 2508C at 608C/min and held there for 5 min.
Then the molten samples were cooled at the same rate to
the desired crystallization temperature (Tc).The crystallization was monitored using a Nikon Opti-
phot-2 polarizing microscope to follow the formation and
growth of the spherulites. Thin films with a thickness of
�100 lm were prepared using compression molding. A
film was placed between two glass slides and heated on a
programmable hot stage at a heating rate of 508C/min to
1908C, where the sample was kept for 5 min to eliminate
the initial thermomechanical history. Subsequently, the
sample was cooled at the same rate to a set temperature
of 1308C to observe crystallization.
FIG. 2. DSC thermograms of the second heating for PLA and PLA-
based nanocomposites with and without chain extenders. The heat flow
axis has been shifted for clarity. The dotted vertical indicates neat PLA
cold-crystallization temperature.
DOI 10.1002/pen POLYMER ENGINEERING AND SCIENCE—-2013 1055
Fourier transform infrared absorption spectra were
obtained using a Perkin Elmer FTIR spectrometer. The
attenuated total reflectance mode was used to measure the
IR absorption in the solution state. Samples (�4 g) were
dissolved in 10 mL of chloroform. The spectral resolution
and scanning speed were adjusted to 4 cm21 and 32 kHz,
respectively. The spectra were acquired after subtraction
of the chloroform absorption obtained under the same
conditions.
RESULTS AND DISCUSSION
Nonisothermal Analysis
PLA is known to crystallize slowly in comparison with
other polyesters such as PCL and polyethylene terephtha-
late (PET) due to the rigid segments in its main chain
[19]. The nonisothermal melt-crystallization behavior of
PLA and PLA-based nanocomposites with and without
chain extender is shown in the DSC thermograms in Fig.
2. The second heating is shown. From these thermograms,
the degree of crystallinity (Xc) is determined according to
Eq. 1:
Xc %ð Þ ¼ DHm � DHc
DH0m
fPLA
100
� �0@
1A� 100 (1)
where DHm and DHc are the measured melting and crys-
tallization enthalpies, respectively, and fPLA is the PLA
weight percent in the sample. For the enthalpy of fusion
(DHom) of a perfectly crystalline PLA, a value of 93.6 J/g
has been used [20, 29]. The main features of the DSC
thermograms are summarized in Table 1.
Crystallization of the neat PLA during the cooling pro-
cess was insignificant (not shown), whereas it easily crys-
tallized during the heating process (cold-crystallization).
A cold-crystallization exotherm followed by a melting
peak is observed for the neat PLA at 106 and 1678C,respectively, quite close to the values reported in previous
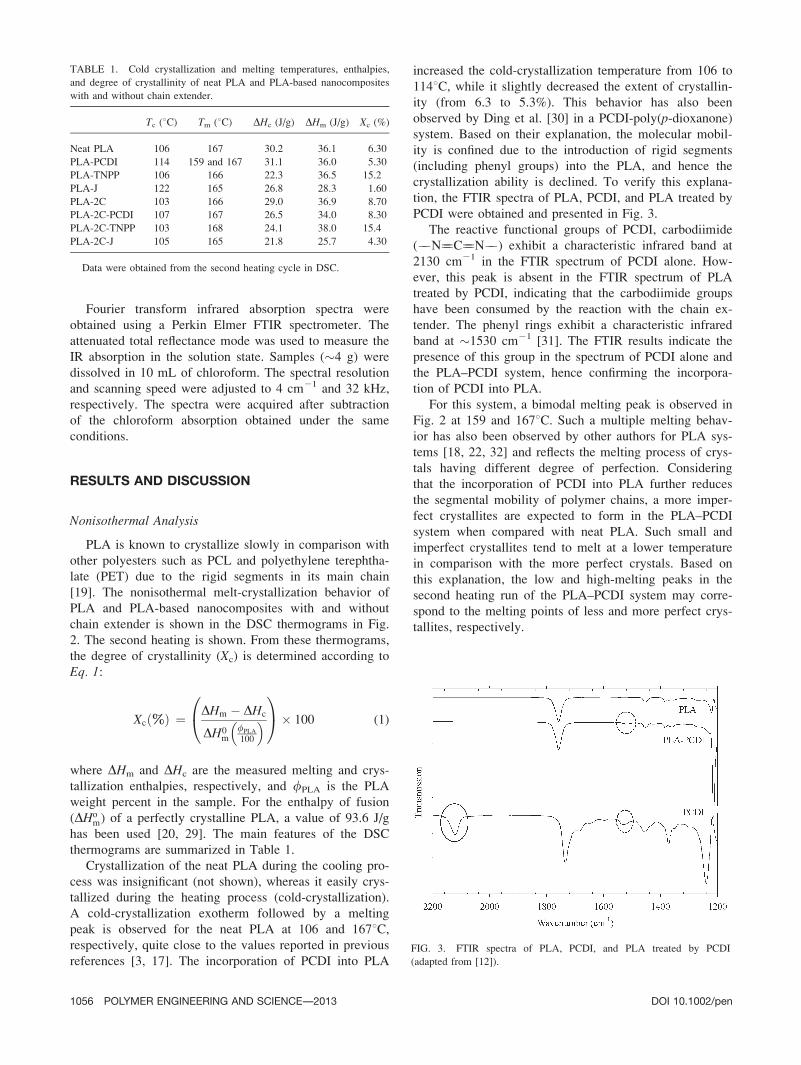
references [3, 17]. The incorporation of PCDI into PLA
increased the cold-crystallization temperature from 106 to
1148C, while it slightly decreased the extent of crystallin-
ity (from 6.3 to 5.3%). This behavior has also been
observed by Ding et al. [30] in a PCDI-poly(p-dioxanone)system. Based on their explanation, the molecular mobil-
ity is confined due to the introduction of rigid segments
(including phenyl groups) into the PLA, and hence the
crystallization ability is declined. To verify this explana-
tion, the FTIR spectra of PLA, PCDI, and PLA treated by
PCDI were obtained and presented in Fig. 3.
The reactive functional groups of PCDI, carbodiimide
(��N¼¼C¼¼N��) exhibit a characteristic infrared band at
2130 cm21 in the FTIR spectrum of PCDI alone. How-
ever, this peak is absent in the FTIR spectrum of PLA
treated by PCDI, indicating that the carbodiimide groups
have been consumed by the reaction with the chain ex-
tender. The phenyl rings exhibit a characteristic infrared
band at �1530 cm21 [31]. The FTIR results indicate the
presence of this group in the spectrum of PCDI alone and
the PLA–PCDI system, hence confirming the incorpora-
tion of PCDI into PLA.
For this system, a bimodal melting peak is observed in
Fig. 2 at 159 and 1678C. Such a multiple melting behav-
ior has also been observed by other authors for PLA sys-
tems [18, 22, 32] and reflects the melting process of crys-
tals having different degree of perfection. Considering
that the incorporation of PCDI into PLA further reduces
the segmental mobility of polymer chains, a more imper-
fect crystallites are expected to form in the PLA–PCDI
system when compared with neat PLA. Such small and
imperfect crystallites tend to melt at a lower temperature
in comparison with the more perfect crystals. Based on
this explanation, the low and high-melting peaks in the
second heating run of the PLA–PCDI system may corre-
spond to the melting points of less and more perfect crys-
tallites, respectively.
TABLE 1. Cold crystallization and melting temperatures, enthalpies,
and degree of crystallinity of neat PLA and PLA-based nanocomposites
with and without chain extender.
Tc (8C) Tm (8C) DHc (J/g) DHm (J/g) Xc (%)
Neat PLA 106 167 30.2 36.1 6.30
PLA-PCDI 114 159 and 167 31.1 36.0 5.30
PLA-TNPP 106 166 22.3 36.5 15.2
PLA-J 122 165 26.8 28.3 1.60
PLA-2C 103 166 29.0 36.9 8.70
PLA-2C-PCDI 107 167 26.5 34.0 8.30
PLA-2C-TNPP 103 168 24.1 38.0 15.4
PLA-2C-J 105 165 21.8 25.7 4.30
Data were obtained from the second heating cycle in DSC.
FIG. 3. FTIR spectra of PLA, PCDI, and PLA treated by PCDI
(adapted from [12]).
1056 POLYMER ENGINEERING AND SCIENCE—-2013 DOI 10.1002/pen
It has been shown that the addition of TNPP to PLA
increases the thermal stability and, in some cases, its mo-
lecular weight [12, 23, 33]. Theoretically, the crystalliza-
tion rate and degree of crystallization should decrease as
the molecular weight increases due to a reduction in chain
mobility. In contrast to expectations, a significant increase
in the degree of crystallinity (from 6.3 to 15.2%) is
reported in Table 1 for the PLA treated by TNPP. The
reason for this increase is discussed later.
The DSC thermograms of Fig. 2 and the data collected
in Table 1 indicate that the addition of Joncryl to PLA
decreases the extent of crystallinity from 6.3 to 1.6%,
while the crystallization temperature is shifted from 106
to 1238C. In our previous work, it was found that Joncryl
led to the formation of a long-chain branched (LCB)
structure in Joncryl-treated PLA and that it had a pro-
found effect on molecular weight [12]. The presence of
branches disrupts the packing of polymer chains, thus pre-
venting crystallization. The decreased chain mobility
caused by the increased molecular weight and LCB, on
the other hand, is responsible for the increased cold-crys-
tallization temperature.
The presence of clay nanoparticles is found to affect
the nucleation and crystal growth rate of PLA nanocom-
posites [7, 8, 10]. Figure 2 and Table 1 indicate that the
crystallization temperature (Tc) of PLA without chain ex-
tender was slightly reduced (from 106 to 1038C), and the
degree of crystallinity increased from 6.3 to 8.7% after
clay loading (PLA-2C). These findings suggest that the
nanosized dispersed clay particles may act as nucleating
agents in the PLA nanocomposites, leading to enhanced
nucleation and facilitating the crystallization process [7,
8, 10]. The nucleating effect of clay particles is more pro-
nounced in the PLA nanocomposite treated with PCDI
(PLA-2C–PCDI). The resulting nanocomposite has a
higher degree of crystallinity (8.3%) and a lower Tc(1078C) in comparison with the PLA–PCDI system (Xc ¼5.3% and Tc ¼ 1148C). However, the lower mobility of
polymer chains caused by the presence of PCDI rigid seg-
ments still leads to an increase in cold-crystallization tem-
perature from 103 to 1078C when compared with the
nanocomposite with no chain extender (PLA-2C).
A comparison of the nanocomposite containing TNPP
(PLA-2C–TNPP) with the PLA–TNPP system reveals that
their degree of crystallization is comparable, although the
Tc of the resultant nanocomposite is lower (1038C) than thatof TNPP-treated PLA (1068C). In spite of that, its degree of
crystallinity (15.4%) is higher than that of PLA (6.3%) and
the PLA nanocomposite without chain extender (8.7%).
The DSC results of the PLA nanocomposite with Joncryl
(PLA-2C–J) are also shown and reported in Fig. 2 and Table
1. On the basis of our last results [9, 12], the effect of Joncryl
in the PLA nanocomposite is not as spectacular as for neat
PLA due to the degradation of the matrix, highly favored by
the presence of the clay. Therefore, polymer chains of a
lower molecular weight and less LCB are expected to form
in the resulting nanocomposite when compared with the
PLA–Joncryl system. Such a decrease in molecular weight
accompanied by less LCB, as well as the nucleating effect of
the clay particles, is responsible for the decreased cold-crys-
tallization temperature from 122 to 1048C and the increased
degree of crystallization of the Joncryl-based nanocomposite
from 1.6 to 4.3% compared to the PLA–Joncryl system.
However, the LCB structure of the resultant nanocomposite
obstructs chain packing, leading to a reduction of its crystal-
linity (1.6%) in comparison with that of the neat PLA (6.3%)
and PLA nanocomposite without chain extender (8.7%).
Isothermal Analysis
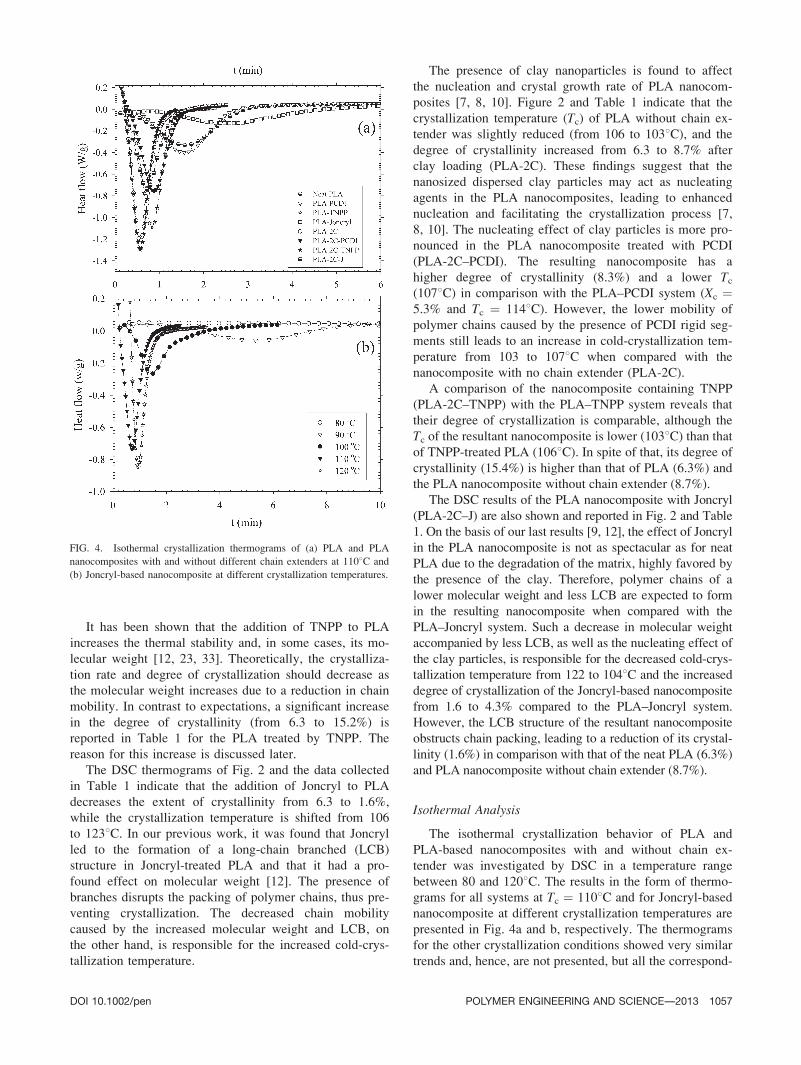
The isothermal crystallization behavior of PLA and
PLA-based nanocomposites with and without chain ex-
tender was investigated by DSC in a temperature range
between 80 and 1208C. The results in the form of thermo-
grams for all systems at Tc ¼ 1108C and for Joncryl-based
nanocomposite at different crystallization temperatures are
presented in Fig. 4a and b, respectively. The thermograms
for the other crystallization conditions showed very similar
trends and, hence, are not presented, but all the correspond-
FIG. 4. Isothermal crystallization thermograms of (a) PLA and PLA
nanocomposites with and without different chain extenders at 1108C and
(b) Joncryl-based nanocomposite at different crystallization temperatures.
DOI 10.1002/pen POLYMER ENGINEERING AND SCIENCE—-2013 1057
ing enthalpy values are listed in Table 2. Similarly to the
nonisothermal crystallization case, the addition of a chain
extender and clay particles strongly influenced the crystalli-
zation behavior. The addition of organoclay as a filler and
TNPP as a chain extender slightly increased the measured
values of DH, while the incorporation of PCDI and/or
Joncryl into PLA and the PLA-based nanocomposite
decreased the enthalpy values. To quantify how the chain
extenders affect the rate of crystallization, the relative
degree of crystallinity, Xt, versus the crystallization time, t,is considered and plotted in Fig. 5. The relative degree of
crystallinity is defined as Eq. 2:
Xt ¼DHðtÞDHð1Þ
(2)
where DH(t) is the enthalpy of isothermal crystalliza-
tion at time t and DH(!) is the enthalpy of complete crys-
tallization, both calculated from Eq. 3 and the data from
Fig. 4:
DHðtÞ ¼Z1
0
dH
dt
� �:dt
DHð1Þ ¼Z1
0
dH
dt
� �:dt
(3)
To further quantitatively describe the evolution of the
crystallinity during isothermal crystallization, we used the
well-known Avrami model, which is the most common
and easiest approach to obtain relevant parameters charac-
terizing the crystallization kinetics [34, 35]. The relative
crystallinity can be calculated from Eq. 4:
XðtÞ ¼ 1� expð�ktnÞ (4)
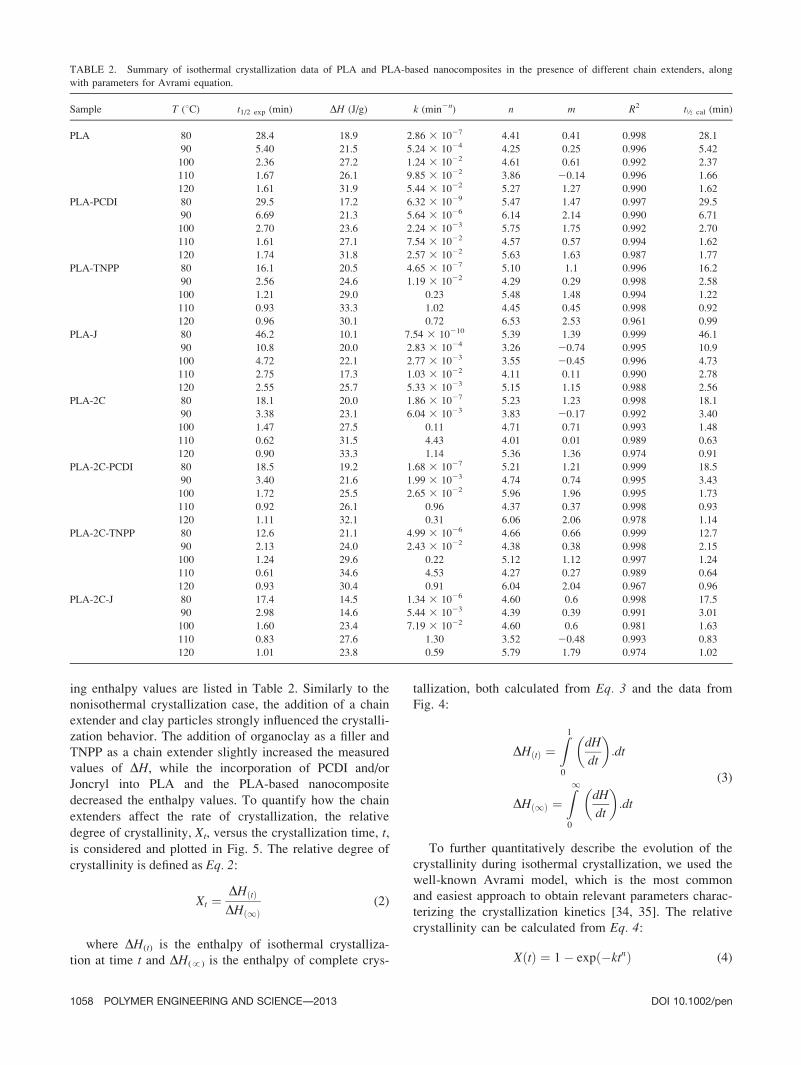
TABLE 2. Summary of isothermal crystallization data of PLA and PLA-based nanocomposites in the presence of different chain extenders, along
with parameters for Avrami equation.
Sample T (8C) t1/2 exp (min) DH (J/g) k (min2n) n m R2 t½ cal (min)
PLA 80 28.4 18.9 2.86 3 1027 4.41 0.41 0.998 28.1
90 5.40 21.5 5.24 3 1024 4.25 0.25 0.996 5.42
100 2.36 27.2 1.24 3 1022 4.61 0.61 0.992 2.37
110 1.67 26.1 9.85 3 1022 3.86 20.14 0.996 1.66
120 1.61 31.9 5.44 3 1022 5.27 1.27 0.990 1.62
PLA-PCDI 80 29.5 17.2 6.32 3 1029 5.47 1.47 0.997 29.5
90 6.69 21.3 5.64 3 1026 6.14 2.14 0.990 6.71
100 2.70 23.6 2.24 3 1023 5.75 1.75 0.992 2.70
110 1.61 27.1 7.54 3 1022 4.57 0.57 0.994 1.62
120 1.74 31.8 2.57 3 1022 5.63 1.63 0.987 1.77
PLA-TNPP 80 16.1 20.5 4.65 3 1027 5.10 1.1 0.996 16.2
90 2.56 24.6 1.19 3 1022 4.29 0.29 0.998 2.58
100 1.21 29.0 0.23 5.48 1.48 0.994 1.22
110 0.93 33.3 1.02 4.45 0.45 0.998 0.92
120 0.96 30.1 0.72 6.53 2.53 0.961 0.99
PLA-J 80 46.2 10.1 7.54 3 10210 5.39 1.39 0.999 46.1
90 10.8 20.0 2.83 3 1024 3.26 20.74 0.995 10.9
100 4.72 22.1 2.77 3 1023 3.55 20.45 0.996 4.73
110 2.75 17.3 1.03 3 1022 4.11 0.11 0.990 2.78
120 2.55 25.7 5.33 3 1023 5.15 1.15 0.988 2.56
PLA-2C 80 18.1 20.0 1.86 3 1027 5.23 1.23 0.998 18.1
90 3.38 23.1 6.04 3 1023 3.83 20.17 0.992 3.40
100 1.47 27.5 0.11 4.71 0.71 0.993 1.48
110 0.62 31.5 4.43 4.01 0.01 0.989 0.63
120 0.90 33.3 1.14 5.36 1.36 0.974 0.91
PLA-2C-PCDI 80 18.5 19.2 1.68 3 1027 5.21 1.21 0.999 18.5
90 3.40 21.6 1.99 3 1023 4.74 0.74 0.995 3.43
100 1.72 25.5 2.65 3 1022 5.96 1.96 0.995 1.73
110 0.92 26.1 0.96 4.37 0.37 0.998 0.93
120 1.11 32.1 0.31 6.06 2.06 0.978 1.14
PLA-2C-TNPP 80 12.6 21.1 4.99 3 1026 4.66 0.66 0.999 12.7
90 2.13 24.0 2.43 3 1022 4.38 0.38 0.998 2.15
100 1.24 29.6 0.22 5.12 1.12 0.997 1.24
110 0.61 34.6 4.53 4.27 0.27 0.989 0.64
120 0.93 30.4 0.91 6.04 2.04 0.967 0.96
PLA-2C-J 80 17.4 14.5 1.34 3 1026 4.60 0.6 0.998 17.5
90 2.98 14.6 5.44 3 1023 4.39 0.39 0.991 3.01
100 1.60 23.4 7.19 3 1022 4.60 0.6 0.981 1.63
110 0.83 27.6 1.30 3.52 20.48 0.993 0.83
120 1.01 23.8 0.59 5.79 1.79 0.974 1.02
1058 POLYMER ENGINEERING AND SCIENCE—-2013 DOI 10.1002/pen

where X(t) is the relative degree of crystallinity (from Eq.2), n is the Avrami index, and k is the overall crystalliza-
tion rate constant including nucleation and crystal growth
contributions. The Avrami constants k and n can be calcu-
lated by fitting the experimental data to Eq. 5, obtainedafter taking the double logarithm of Eq. 4:
lnð� lnð1� XðtÞÞÞ ¼ ln k þ n lnðtÞ (5)
Because the Avrami model rarely describes the whole
conversion range [36], the relative crystallinity data between
5 and 80% were used to calculate k and n. The plots of ln
[2ln (1 2 X (t)] as a function of ln (t) for the data obtainedat Tc ¼ 1108C for the PLA and PLA-based nanocomposites
with and without chain extenders are presented in Fig. 6.
The behavior at the four other crystallization tempera-
tures was similar, and, for conciseness, the results are not
presented here. However, the calculated k, n, and the cor-
relation coefficient of the fit (R2) are all summarized in
Table 2. Most correlation coefficient values are larger
than 99%, indicating good fits of the experimental data in
Fig. 5.
The Avrami index, n, is a constant with a typically in-
teger value between 1 and 4, depending on different fac-
tors such as nucleation type, nucleation density, crystal
growth dimension, and restriction of crystalline formation
due to surrounding fillers [17].
The index value of 1, 2, and 3 indicates one, two, and
three-dimensional spherulites growth, respectively. The
fractional Avrami index value or value greater than 4 can
theoretically be explained by the introduction of the
nucleation index, m (Eq. 6), describing the nucleation
mechanism throughout the crystallization process [37]:
m ¼ n� n0 � 1 (6)
where n0 is the dimensionality index (e.g., n0 ¼ 1 for rods,
n0 ¼ 2 for disks, and n0 ¼ 3 for spheres). m values
between 1 and 0 represent instantaneous and sporadic
nucleation gradually decreasing with time and approach-
ing a constant value at a certain time, while a value of 0
indicates sporadic nucleation steadily increasing with
time. An m value from 0 to 1 and greater than 1 indicates
a sporadic nucleation, which increases and markedly
FIG. 5. Relative crystallinity (Eq. 4) of (a) PLA and PLA nanocompo-
sites with and without different chain extenders at 1108C and (b)
Joncryl-based nanocomposite at different crystallization temperatures.
FIG. 6. Avrami fits of the isothermal crystallization data of (a) PLA
and PLA nanocomposites with and without different chain extenders at
1108C and (b) Joncryl-based nanocomposite at different crystallization
temperatures.
DOI 10.1002/pen POLYMER ENGINEERING AND SCIENCE—-2013 1059
increases with time, respectively [37]. A large variety of
n values have been reported for PLA in the literature [17,
38]. The data summarized in Table 2 reveal that the
obtained Avrami exponent ranges from 3 to 6 in these
samples, suggesting a three-dimensional spherulite growth
(n0 ¼ 3). The calculated m values, reported in Table 2,
are mainly greater than zero but smaller than 1 indicating
that the nucleation process is most likely governed by
sporadic nucleation, which increases with time.
The k values of Table 2 as well as the data of Figs. 4
and 5 show that the addition of PCDI to the neat PLA
leads to a reduction in the crystallization rate. For exam-
ple, at the crystallization temperature of 1008C, the kvalue varies from 1.3 3 1022 min2n for the neat PLA to
2.2 3 1023 min2n for the PLA treated with PCDI. The
temperature of 1008C is chosen in the comparison of the
k values; however, the trend is the same at all crystalliza-
tion temperatures. The incorporation of rigid PCDI frag-
ments into the PLA confines the molecular mobility, as
shown by the FTIR results, and subsequently reduces the
rate of crystallization. It is interesting to note that the
crystallization of the PLA and PLA–PCDI system almost
terminates at the same time in Fig. 4, even though the
PLA crystallization begins sooner in comparison with that
in the PLA–PCDI system. This behavior indicates that the
crystallization rate of the PLA is gradually decreased at
later stage of crystallization when compared with that of
the PLA–PCDI system (see Fig. 5). The faster growth of
PLA crystallites at early stage of the crystallization may
lead to crystal impingements. Such impingements, there-
fore, retard the crystallization kinetics at later stage of the
crystallization. This explanation is in good agreement
with what is observed by optical microscopy as discussed
later.
In contrast with PCDI, the incorporation of TNPP to
PLA results in a significant increase of the PLA crystalli-
zation kinetics, even though the molecular weight is also
increased [12]. Based on the explanation of Carvalho
et al. [39], decreasing the number of chain ends in the
system as a consequence of short chains removal is re-
sponsible for the increased crystallization rate. Also,
Richter and coworkers [40] explained that chain ends are
much more mobile than mid-chain segments. The high
mobility of the chain ends decreases the likelihood of
their attaching to the growth front in comparison with a
stem from a mid-chain region.
Consequently, the chain ends are more resistant to
being folded into a compact crystalline form, acting as an
entropic defect at the crystal growth front, and subse-
quently decrease the crystal growth rate. As reported in
our previous work [12], the addition of TNPP decreases
the number of chain ends per mass in PLA, resulting in a
decrease of the defects at the growth front and promoted
crystallization kinetics when compared with neat PLA
(the k value changes from 1.3 3 1022 to 0.23 min2n).
The decreased number of chain ends per mass resulting
from the TNPP incorporation is also responsible for the
increased degree of crystallinity in PLA and PLA-based
nanocomposites containing TNPP during nonisothermal
crystallization, as shown in Table 1.
On the contrary, the addition of Joncryl to PLA signifi-
cantly reduces the crystallization kinetics (k value changes
from 1.3 3 1022 to 2.77 3 1023 min2n) as evidenced in
Table 2 and Figs. 4 and 5. The epoxy groups, present in
Joncryl (Fig. 1), react with hydroxyl and carboxyl groups
of the polyester and form a LCB structure [12]. The LCB
structure and branch points hinder the chain-folding phe-
nomenon, which is required for the incorporation of the
chains into growing crystalline lamellae.
As reported by other authors [7, 8, 10], the presence of
clay particles increases the crystallization kinetics of
PLA. Generally, two major factors, nucleation and mobil-
ity of chain segments, control the crystallization behavior.
As shown in Fig. 4 and Table 2, the inclusion of clay par-
ticles in neat PLA and PLA with chain extender decreases
the crystallization halftime from 2.36 to 1.47 min at Tc ¼1008C. This is due to heterogeneous nucleation that
results in narrower crystallization peaks, indicating that
the rate of crystallization is increased (k ¼ 0.11 min2n)
when compared with that of neat PLA (k ¼ 1.24 3
1022 min2n). In the case of the PLA-based nanocompo-
site-containing PCDI and Joncryl, the nucleating effect of
clay particles promotes the crystallization kinetics on one
hand. On the other hand, less chain mobility in PCDI-
enriched system and the LCB structure in the Joncryl
nanocomposite results in the retardation of the crystalliza-
tion process; the k value changes from 0.11 to 2.6 3
1022 and 7.2 3 1022 min2n in nanocomposite-containing
PCDI and Joncryl, respectively.
The comparison of the crystallization kinetics between
the nanocomposite-containing PCDI and those treated by
Joncryl is also interesting. Joncryl-based nanocomposite
shows a larger crystallization rate than the nanocompo-
site-containing PCDI at the early stage of the crystalliza-
tion, while a reverse trend is observed for the nanocompo-
site-containing PCDI as the relative crystallinity increases,
since the crystallization is finished at a shorter time (see
Fig. 5). Based on what is reported in Refs. [41, 42], the
crystallization rate is first controlled by nucleation and
then crystal growth and packing. We assume that the for-
mation of a branched structure in the nanocomposite-con-
taining Joncryl leads to an enhancement of the density of
nuclei, increasing the crystallization rate at the early stage
of crystallization. However, suppression or disruption of
chain packing within the crystallites, caused by a LCB
structure, then retards the crystal growth at later stages.
Comparing the k parameter of the various samples
shows that its value first increases with increasing crystal-
lization temperature, followed by a decrease above
1108C. Such a behavior is expected in polymer due to a
balance between two opposing effects. At low-crystalliza-
tion temperatures, close to the glass transition temperature
(Tg � 608C), the decreased chain mobility significantly
retards the crystallization rate, whereas at high-crystalliza-
1060 POLYMER ENGINEERING AND SCIENCE—-2013 DOI 10.1002/pen

tion temperatures, close to equilibrium melting tempera-
ture (Tm0), a considerable decrease in nucleation density
hinders the crystallization growth, although the chain mo-
bility is high. Moreover, the comparison of different sys-
tems at a given crystallization temperature shows that the
incorporation of PCDI and Joncryl into PLA decreases
the k value, especially at low-crystallization temperatures,
close to Tg, where the segmental mobility is the dominant
factor controlling the crystallization rate. However, the
TNPP and clay addition result in an increased k value, in
complete agreement with what is explained earlier.
To further verify whether these systems closely follow
the Avrami model, the obtained k and n are used to calcu-
late the crystallization halftime (t1/2) using Eq. 7.
t=1=2cal
ln 2
k
� �1=n (7)
The calculated t1/2 is also reported in Table 2. The
comparison between the experimental and calculated t1/2shows that the Avrami model can precisely predict t1/2,confirming that the crystallization kinetics of all the sys-
tems is correctly described by this model for the relative
degree of crystallinity between 5 and 80%.
To compare the overall crystallization rates from the
melt with glassy states, the isothermal crystallization of
the neat molten PLA and some nanocomposite samples
was also studied at 90 and 1108C. All the corresponding
data are listed in Table 3, although the thermograms are
not presented for the sake of brevity. The results indicate
that the overall crystallization rate in the molten state is
much slower than that from the glassy state (i.e., k value
of TNPP-enriched PLA decreased from 1.19 3 1022 and
1.02 to 1.9 3 1023 and 3.05 3 1023 min2n at 90 and
1108C, respectively). Similar results have been observed
in polypropylene by Supaphol [43].
Based on the Lauritzen and Hoffman’s theory [44], the
crystal growth rate is expected to be only a function of
the crystallization temperature, Tc. Supaphol [43] sug-
gested that faster crystallization from the glassy state
resulted from a higher contribution of nucleation mecha-
nisms (either as an enhancement of nucleation rate or
density). Indeed, the total number of activated nuclei that
can serve as predetermined homogeneous nuclei during
isothermal crystallization at Tc increased upon the
quenching process and led to an increase in the overall
crystallization rate. This argument can also be confirmed
by the calculated nucleation index, m, presented in Tables
2 and 3. Contrary to crystallization from the glassy state
(Table 2), m has a value less than zero in melt isothermal
crystallization (Table 3). This indicates that the instanta-
neous and sporadic nucleation gradually decrease with
time and approach a constant value in melt isothermal
crystallization, while such nucleation rates markedly
increase with time [37] in cold isothermal crystallization.
The crystal growth rate is usually defined as the
inverse of the crystallization halftime (G ¼ 1/t1/2), and
the variation of Gexp is plotted as a function of crystalliza-
tion temperature in Fig. 7. As expected, Gexp is strongly
dependent on the crystallization temperature. Gexp
increases first with increasing crystallization temperature
up to 1108C, passes through a maximum, and then is
reduced. The trend is consistent with the crystallization
kinetics (k values). A comparison of the neat PLA with
the PLA–PCDI and PLA–Joncryl systems reveals that the
restriction of chain movement in the PCDI and Joncryl-
enriched systems reduces Gexp when compared with that
of the neat PLA. However, the reduction of defects in
polymer chains promotes Gexp as TNPP is added to the
TABLE 3. Summary of melt-isothermal crystallization data of PLA and PLA-based nanocomposites in the presence of TNPP as a chain extender,
along with parameters for Avrami equation.
Sample T (8C) DH (J/g) t1/2 exp (min) k (min2n) n m R2 t1/2 cal (min)
PLA 90 22.3 6.18 6.12 3 1024 3.85 20.15 0.998 6.20
110 23.2 4.89 2.30 3 1023 3.58 20.42 0.998 4.92
PLA–TNPP 90 23.1 5.54 1.90 3 1023 3.45 20.55 0.999 5.53
110 26.2 4.48 3.05 3 1023 3.62 20.38 0.999 4.48
PLA-2C–TNPP 90 23.3 5.24 2.60 3 1023 3.36 20.64 0.999 5.27
110 27.6 4.05 4.58 3 1023 3.58 20.42 0.998 4.06
FIG. 7. Crystallization rate (G) of the PLA and PLA-based nanocom-
posites in the presence of different chain extenders as a function of crys-
tallization temperature.
DOI 10.1002/pen POLYMER ENGINEERING AND SCIENCE—-2013 1061
neat PLA. The effect of clay loading on the crystallization
kinetics is evident in Fig. 7, especially at high-crystalliza-
tion temperature where nucleation is the dominant factor
controlling the crystallization kinetics. The formation of
additional nucleation sites by the clay particles is respon-
sible for such enhancement of Gexp.
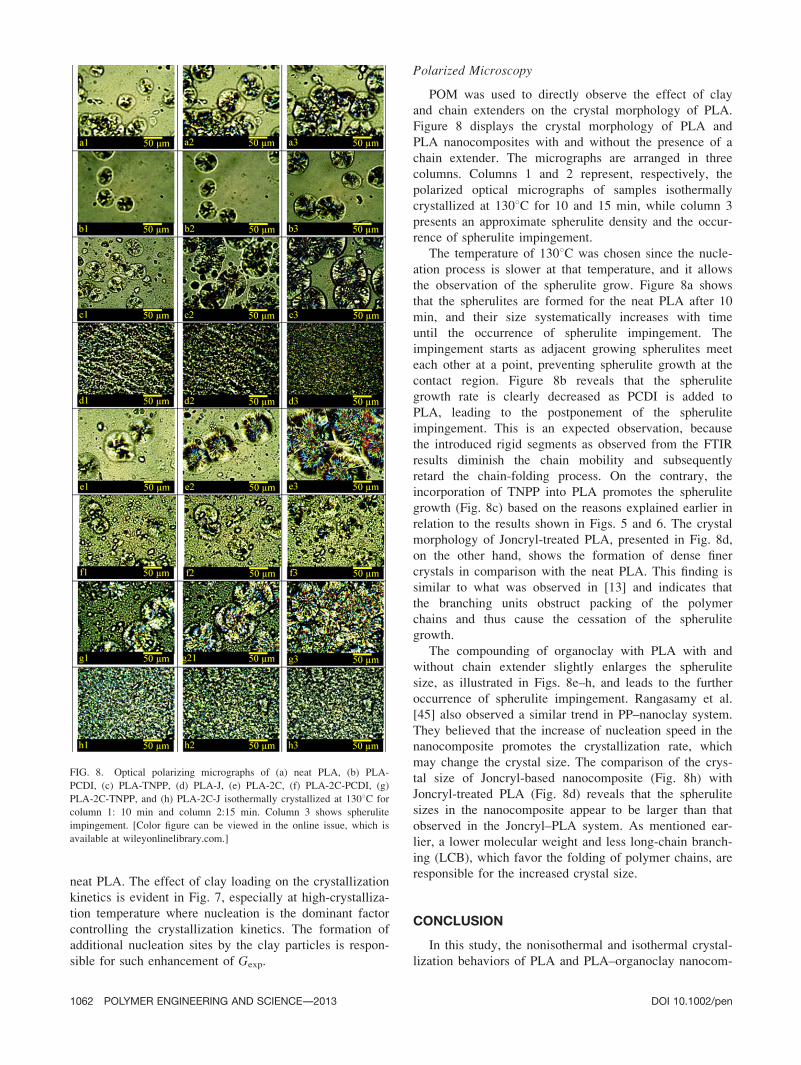
Polarized Microscopy
POM was used to directly observe the effect of clay
and chain extenders on the crystal morphology of PLA.
Figure 8 displays the crystal morphology of PLA and
PLA nanocomposites with and without the presence of a
chain extender. The micrographs are arranged in three
columns. Columns 1 and 2 represent, respectively, the
polarized optical micrographs of samples isothermally
crystallized at 1308C for 10 and 15 min, while column 3
presents an approximate spherulite density and the occur-
rence of spherulite impingement.
The temperature of 1308C was chosen since the nucle-
ation process is slower at that temperature, and it allows
the observation of the spherulite grow. Figure 8a shows
that the spherulites are formed for the neat PLA after 10
min, and their size systematically increases with time
until the occurrence of spherulite impingement. The
impingement starts as adjacent growing spherulites meet
each other at a point, preventing spherulite growth at the
contact region. Figure 8b reveals that the spherulite
growth rate is clearly decreased as PCDI is added to
PLA, leading to the postponement of the spherulite
impingement. This is an expected observation, because
the introduced rigid segments as observed from the FTIR
results diminish the chain mobility and subsequently
retard the chain-folding process. On the contrary, the
incorporation of TNPP into PLA promotes the spherulite
growth (Fig. 8c) based on the reasons explained earlier in
relation to the results shown in Figs. 5 and 6. The crystal
morphology of Joncryl-treated PLA, presented in Fig. 8d,
on the other hand, shows the formation of dense finer
crystals in comparison with the neat PLA. This finding is
similar to what was observed in [13] and indicates that
the branching units obstruct packing of the polymer
chains and thus cause the cessation of the spherulite
growth.
The compounding of organoclay with PLA with and
without chain extender slightly enlarges the spherulite
size, as illustrated in Figs. 8e–h, and leads to the further
occurrence of spherulite impingement. Rangasamy et al.
[45] also observed a similar trend in PP–nanoclay system.
They believed that the increase of nucleation speed in the
nanocomposite promotes the crystallization rate, which
may change the crystal size. The comparison of the crys-
tal size of Joncryl-based nanocomposite (Fig. 8h) with
Joncryl-treated PLA (Fig. 8d) reveals that the spherulite
sizes in the nanocomposite appear to be larger than that
observed in the Joncryl–PLA system. As mentioned ear-
lier, a lower molecular weight and less long-chain branch-
ing (LCB), which favor the folding of polymer chains, are
responsible for the increased crystal size.
CONCLUSION
In this study, the nonisothermal and isothermal crystal-
lization behaviors of PLA and PLA–organoclay nanocom-
FIG. 8. Optical polarizing micrographs of (a) neat PLA, (b) PLA-
PCDI, (c) PLA-TNPP, (d) PLA-J, (e) PLA-2C, (f) PLA-2C-PCDI, (g)
PLA-2C-TNPP, and (h) PLA-2C-J isothermally crystallized at 1308C for
column 1: 10 min and column 2:15 min. Column 3 shows spherulite
impingement. [Color figure can be viewed in the online issue, which is
available at wileyonlinelibrary.com.]
1062 POLYMER ENGINEERING AND SCIENCE—-2013 DOI 10.1002/pen
posites in the presence of three different chain extenders
(polycarbodiimide, PCDI, tris (nonylphenyl) phosphite,
TNPP, and Joncryl) were investigated using differential
scanning calorimetry (DSC) and polarized optical micros-
copy (POM). Both isothermal and nonisothermal crystalli-
zation studies suggested that organoclay particles act as
nucleating agents and yield a faster overall rate of crys-
tallization. The addition of PCDI increased the cold-crys-
tallization temperature and decreased the degree of crys-
tallinity. It was assumed that the lower mobility of poly-
mer chains, reacted with this chain extender, reduced
spherulite size and the crystallization growth rate, result-
ing in an increased crystallization halftime for the iso-
thermal case. In contrast, TNPP was found to signifi-
cantly intensify the crystallization process by reducing
the number of chain ends, acting as defects to incorpo-
rate into the crystals. The degree of crystallinity, crystal
growth rate, and subsequently spherulite size increased
as TNPP was added. The Joncryl incorporation, how-
ever, confined the crystallization process due to the for-
mation of a LCB structure, resulting in the disruption of
chain packing. Therefore, the degree of crystallinity and the
rate of crystallization decreased, while the cold-crystalliza-
tion temperature was dramatically increased in nonisother-
mal crystallization. The isothermal crystallization growth
rate of all the compounds was determined in the tempera-
ture range of 80–1208C. It first increased to attain a maxi-
mum at �1108C and was then followed by a reduction. The
Avrami analysis was used to quantify the effects of clay
and chain extenders on the isothermal crystallization behav-
ior. It was found that all systems satisfactorily follow the
Avrami equation and more likely exhibit a 3D spherulitic
growth.
A comparison of the overall crystallization rate param-
eters calculated from both cold and melt isothermal crys-
tallization processes revealed that the rate of crystalliza-
tion from the glassy state proceeded faster than that from
the melt state. This indeed suggests that the quenching
process increased the total number of activated nuclei that
can act as predetermined homogeneous nuclei upon subse-
quent crystallization at Tc.
REFERENCES
1. A. Demirbas, Energy Sour.: Part A, 29, 419 (2007).
2. S. Gumus, G. Ozkoc, and A. Aytac, J. Appl. Polym. Sci.,123, 2837 (2012).
3. G.Z. Papageorgiou, D.S. Achilias, S. Nanaki, T. Besli-
kas, and D. Bikiaris, Thermochim. Acta, 511, 129
(2010).
4. J. Lunt, Polym. Degrad. Stab., 59, 145 (1998).
5. F. Achmad, K. Yamane, S. Quan, and T. Kokugan, Chem.Eng. J., 151, 342 (2009).
6. R. Mehta, V. Kumar, H. Bhunia, and S.N. Upadhyay, J.Macromol. Sci.: Polym. Rev., 45, 325 (2005).
7. Y. Di, S. Iannace, E. Dimsio, and N. Luigi, J. Polym. Sci.:Polym. Phys., 43, 689 (2005).
8. J.H. Lee, T.G. Park, H.S. Park, D.S. Lee, Y.K. Lee, S.C.
Yoon, and J.D. Nam, Biomaterials, 24, 2773 (2003).
9. N. Najafi, M.C. Heuzey, and P.J. Carreau, Comp. Sci. Tech.,72, 608 (2012).
10. M. Pluta, J.K. Jeszka, and G. Boiteux, Eur. Polym. J., 43,2819 (2007).
11. K. Fukushima, D. Tabuani, and G. Camino, Mater. Sci.Eng. C, 29, 1433 (2009).
12. N. Najafi, M.C. Heuzey, P.J. Carreau, and P.M. Wood-
Adams, Polym. Degrad. Stab., 97, 554 (2012).
13. Q. Meng, M.C. Heuzey, and P.J. Carreau, Polym. Degrad.Stab., 97, 2010 (2012).
14. H. Li and M.A. Huneault, J. Appl. Polym. Sci., 122, 134 (2011).
15. J. Liu, L. Lou, W. Yua, R. Liao, and R. Li, Polymer, 51,5186 (2010).
16. H. Xiao, W. Lu, and J.T. Yeh, J. Appl. Polym. Sci., 113,112 (2009).
17. M. Day, A.V. Nawaby, and X. Liao, J. Therm. Anal. Calo-rim., 86, 623 (2006).
18. X. Ling and J.E. Spruiell, J. Polym. Sci.: Polym. Phys., 44,3200 (2006).
19. T. Miyata and T. Masuko, Polymer, 39, 5515 (1998).
20. L. Wang and C.M. Dong, J. Polym. Sci.: Polym. Chem., 44,2226 (2006).
21. L. Mandelkern, Crystallization of Polymers: Kinetics andMechanisms, Cambridge University Press, Cambridge,
United Kingdom (2004).
22. H. Abe, M. Harigaya, Y. Kikkawa, T. Tsuge, and Y. Doi,
Biomacromolecules, 6, 457 (2005).
23. J.A. Cicero, J.R. Dorgan, S.F. Dec, and D.M. Knauss,
Polym. Degrad. Stab., 78, 95 (2002).
24. L.X. Yang, X.S. Chen, and X.B. Jing, Polym. Degrad. Stab.,93, 1923 (2008).
25. M. Villalobos, A. Awojulu, T. Greeley, G. Turco, and G.
Deeter, Energy, 31, 3227 (2006).
26. V. Krikorian and D.J. Pochan, Chem. Mater., 15, 4317
(2003).
27. J. Yu and Z. Qiu., Ind. Eng. Chem. Res., 50, 12579 (2011).
28. V. Ojijo, T. Malwela, S.S. Ray, and R. Sadiku, Polymer, 53,505 (2012).
29. J.W. Huang, Y.C. Hung, Y.L. Wen, C.C. Kang, and M.Y.
Yeh, J. Appl. Polym. Sci., 12, 3149 (2009).
30. S.D. Ding, Z.P. Liu, and T. Yang, J. Polym. Res., 17, 63(2010).
31. M. Rybachuk, A. Hertwig, M. Weise, M. Sahre, M. Mann,
and J. Bell, Appl. Phys. Lett., 96, 909 (2010).
32. M. Pluta, J.K. Jeszka, and G. Boiteux, Eur. Polym. J., 43,2819 (2007).
33. J.R. Dorgan, J. Janzen, and M.P. Clayton, J. Rheol., 49, 607(2005).
34. M. Avrami, J. Chem. Phys., 9, 177 (1941).
35. M.C. Tobin, J. Polym. Sci.: Polym. Phys., 14, 2253 (1976)
36. A.T. Lorenzo, M.L. Arnal, J. Albuerne, and A.J. Muller,
Polym. Test., 26, 222 (2007).
DOI 10.1002/pen POLYMER ENGINEERING AND SCIENCE—-2013 1063
37. P. Supaphol, Thermochim. Acta, 370, 37 (2001).
38. H. Tsuji, H. Takai, and S.K. Saha, Polymer, 47, 3826
(2006).
39. J.L. Carvalho, S.L. Cormier, N. Lin, and K.D. Veress, Mac-romolecules, 45, 1688 (2012).
40. M. Zamponi, M. Monkenbusch, L. Willner, A. Wischnew-
ski, B. Farago, and D. Richter, Europhys. Lett., 72, 1039
(2005).
41. S.H. Tabatabaei, P.J. Carreau, and A. Ajji, Chem. Eng. Sci.,64, 4719 (2009).
42. J. Tian, W. Yu, and C. Zhou, J. Appl. Polym. Sci., 104,
3592 (2007).
43. P. Supaphol and J.E. Spruiell, Polymer, 42, 699 (2001)
44. P. Supaphol, J. Appl. Polym. Sci., 79, 1603 (2001).
45. L. Rangasamy, E. Shim, and B. Pourdeyhimi, J. Appl.Polym. Sci., 121, 410 (2011).
1064 POLYMER ENGINEERING AND SCIENCE—-2013 DOI 10.1002/pen