Crystal form and orientation of isotactic polypropylene samples prepared by vibration-injection...
6
Crystal Form and Orientation of Isotactic Polypropylene Samples Prepared by Vibration-Injection Molding Jie Zhang, Tai Zeng, Ji Zhu, Yanwei Lei, Kaizhi Shen, Qiang Fu Department of Polymeric Science and Engineering, Sichuan University, State Key Laboratory of Polymer Materials Engineering, Chengdu 610065, China Received 20 August 2006; accepted 29 January 2007 DOI 10.1002/app.26554 Published online 12 July 2007 in Wiley InterScience (www.interscience.wiley.com). ABSTRACT: A vibration–injection molding equipment was developed to prepare isotactic polypropylene injection samples to investigate their crystal form and orientation. Wide-angle X-ray scattering experiments (WAXD) were conducted in two modes: theta–theta mode and tube-fixed mode. Through vibration–injection molding, in additional to a form, b form, or g form can be obtained under differ- ent conditions. At high melt temperature (230), b-PP can be induced and the core of the sample contains more b-PP than the surface. At low melt temperature (190), g-PP can be induced and the core and the surface of the sample contain approximate same proportion of g-PP. Pole figures show that a-PP of a static sample just orientates slightly along M direction, while that of vibration samples orientate much stronger. The orientation of the normal of (040)a plane of the sample obtained at T 5 2308C, f 5 0.5 Hz, and P v 5 75 MPa is preferred in M direction, and the orientation of the normal of (040)a plane of the sample obtained at T 5 1908C, f 5 1.5 Hz, and P v 5 35 MPa is preferred in N direc- tion. b-PP and g-PP do not show obvious orientation. Ó 2007 Wiley Periodicals, Inc. J Appl Polym Sci 106: 1456–1461, 2007 Key words: crystal form; orientation; isotactic polypropyl- ene; vibration–injection; WAXD; pole figure INTRODUCTION The performance of semicrystalline polymer is decided directly by its final crystal structure and morphology. Isotactic polypropylene (I-PP) is a kind of semicrystalline polymer that has multicrystal forms. Under different crystallization conditions, the crystal form of I-PP may be a-PP, b-PP, or g-PP, and different crystal form has different properties. For example, b-PP has a better ability of impact resist- ance than a-PP. 1–3 At the same time, crystal orienta- tion is a key factor that influences the properties of I-PP products. Therefore, there were some studies using pole figures on the crystal orientation of injec- tion-molded polypropylene compounds, 4 polypro- pylene sheets produced by die-drawing and roll- ing, 5–7 and extruded tubular film of I-PP. 8 Oscillation or vibration technique has been used in injection molding to control the molecular orienta- tion and crystal morphology to enhance the mech- anical performance of PP. 9–12 However, there has been little emphasis on crystal form and orientation, especially on the orientation of different crystal forms of I-PP samples prepared by oscillation or vibration injection molding. In this article, self- designed vibration–injection molding equipment was used to prepare I-PP samples, and WAXD and pole figure were used to characterize their crystal form and orientation. EXPERIMENTAL Material I-PP F401 used in the experiment was commercial- ized products from Yan Shan petroleum chemical, Beijing, China, M w 5 7.8 3 10 4 , MFI 5 1.87 g/min. Samples preparation and characterization A pressure vibration–injection machine with vibra- tion frequency of 0 1.5 Hz and vibration pressure of 0 75 MPa was developed to prepare I-PP sam- ples. During injection and packing, a pulsation pres- sure was introduced to the melt in a mold cavity to causes the melt vibrating forth and backwards with certain frequency and pressure. Three parameters, including melt temperature (T), vibration frequency (f), and vibration pressure (P v ) that represents the Correspondence to: K. Shen ([email protected]). Contract grant sponsor: National Natural Science Foun- dation of China; contract grant numbers: 50473053, 50533050. Contract grant sponsor: National Basic Research Pro- gram of China; contract grant number: 2005CB623800. Contract grant sponsor: Scientific Research Foundation for Returned Overseas Chinese Scholars, State Education Ministry. Journal of Applied Polymer Science, Vol. 106, 1456–1461 (2007) V V C 2007 Wiley Periodicals, Inc.
Transcript of Crystal form and orientation of isotactic polypropylene samples prepared by vibration-injection...
Crystal Form and Orientation of Isotactic PolypropyleneSamples Prepared by Vibration-Injection Molding
Jie Zhang, Tai Zeng, Ji Zhu, Yanwei Lei, Kaizhi Shen, Qiang Fu
Department of Polymeric Science and Engineering, Sichuan University, State Key Laboratory of Polymer MaterialsEngineering, Chengdu 610065, China
Received 20 August 2006; accepted 29 January 2007DOI 10.1002/app.26554Published online 12 July 2007 in Wiley InterScience (www.interscience.wiley.com).
ABSTRACT: A vibration–injection molding equipmentwas developed to prepare isotactic polypropylene injectionsamples to investigate their crystal form and orientation.Wide-angle X-ray scattering experiments (WAXD) wereconducted in two modes: theta–theta mode and tube-fixedmode. Through vibration–injection molding, in additionalto a form, b form, or g form can be obtained under differ-ent conditions. At high melt temperature (230), b-PP canbe induced and the core of the sample contains more b-PPthan the surface. At low melt temperature (190), g-PP canbe induced and the core and the surface of the samplecontain approximate same proportion of g-PP. Pole figures
show that a-PP of a static sample just orientates slightlyalong M direction, while that of vibration samples orientatemuch stronger. The orientation of the normal of (040)a planeof the sample obtained at T 5 2308C, f 5 0.5 Hz, and Pv
5 75 MPa is preferred in M direction, and the orientation ofthe normal of (040)a plane of the sample obtained at T5 1908C, f5 1.5 Hz, and Pv5 35 MPa is preferred in N direc-tion. b-PP and g-PP do not show obvious orientation. � 2007Wiley Periodicals, Inc. J Appl Polym Sci 106: 1456–1461, 2007
Key words: crystal form; orientation; isotactic polypropyl-ene; vibration–injection; WAXD; pole figure
INTRODUCTION
The performance of semicrystalline polymer isdecided directly by its final crystal structure andmorphology. Isotactic polypropylene (I-PP) is a kindof semicrystalline polymer that has multicrystalforms. Under different crystallization conditions, thecrystal form of I-PP may be a-PP, b-PP, or g-PP, anddifferent crystal form has different properties. Forexample, b-PP has a better ability of impact resist-ance than a-PP.1–3 At the same time, crystal orienta-tion is a key factor that influences the properties ofI-PP products. Therefore, there were some studiesusing pole figures on the crystal orientation of injec-tion-molded polypropylene compounds,4 polypro-pylene sheets produced by die-drawing and roll-ing,5–7 and extruded tubular film of I-PP.8
Oscillation or vibration technique has been used ininjection molding to control the molecular orienta-
tion and crystal morphology to enhance the mech-anical performance of PP.9–12 However, there hasbeen little emphasis on crystal form and orientation,especially on the orientation of different crystalforms of I-PP samples prepared by oscillation orvibration injection molding. In this article, self-designed vibration–injection molding equipment wasused to prepare I-PP samples, and WAXD and polefigure were used to characterize their crystal formand orientation.
EXPERIMENTAL
Material
I-PP F401 used in the experiment was commercial-ized products from Yan Shan petroleum chemical,Beijing, China, Mw 5 7.8 3 104, MFI 5 1.87 g/min.
Samples preparation and characterization
A pressure vibration–injection machine with vibra-tion frequency of 0 � 1.5 Hz and vibration pressureof 0 � 75 MPa was developed to prepare I-PP sam-ples. During injection and packing, a pulsation pres-sure was introduced to the melt in a mold cavity tocauses the melt vibrating forth and backwards withcertain frequency and pressure. Three parameters,including melt temperature (T), vibration frequency(f), and vibration pressure (Pv) that represents the
Correspondence to: K. Shen ([email protected]).Contract grant sponsor: National Natural Science Foun-
dation of China; contract grant numbers: 50473053,50533050.Contract grant sponsor: National Basic Research Pro-
gram of China; contract grant number: 2005CB623800.Contract grant sponsor: Scientific Research Foundation
for Returned Overseas Chinese Scholars, State EducationMinistry.
Journal of Applied Polymer Science, Vol. 106, 1456–1461 (2007)VVC 2007 Wiley Periodicals, Inc.
maximum value of the pulsation pressure, werechanged in our experiment. The method and equip-ment were introduced in detail in our previousarticles.12,13 The processing parameters are listed inTable I.
The wide-angle X-ray scattering experiments(WAXD) were conducted using a Brvker D8 diffrac-tometer. The wavelength of the monochromatedX-ray from CuKa radiation was 0.154 nm and thescanning 2u range was from 58 to 308 with a scan-ning rate of 18/min. We used two modes to do theexperiments, theta-theta mode and tube-fixed mode.When theta-theta mode was used, both tube (X-raysource) and detector scanned at the same rate. When
tube-fixed mode was used, the tube was fixed at anangle of 18 while detector scanned. Because of thesame depth that X-ray could penetrate into a sample,the result of theta-theta mode contains more infor-mation of the core of samples and the result of tube-fixed mode contains more information of the surfaceof samples. The scan direction was the flow direc-tion. The data for pole figure were obtained usingthe same instrument with a texture attachment.
TABLE IProcessing Parameters in Vibration Injection Molding
Processing parameters Parameters value
Injection pressure (MPa) 40Packing pressure (MPa) 40Melt temperature (8C) 190/230Mould temperature (8C) 80Vibration pressure (MPa) 0–75Frequency (Hz) 0–1.5
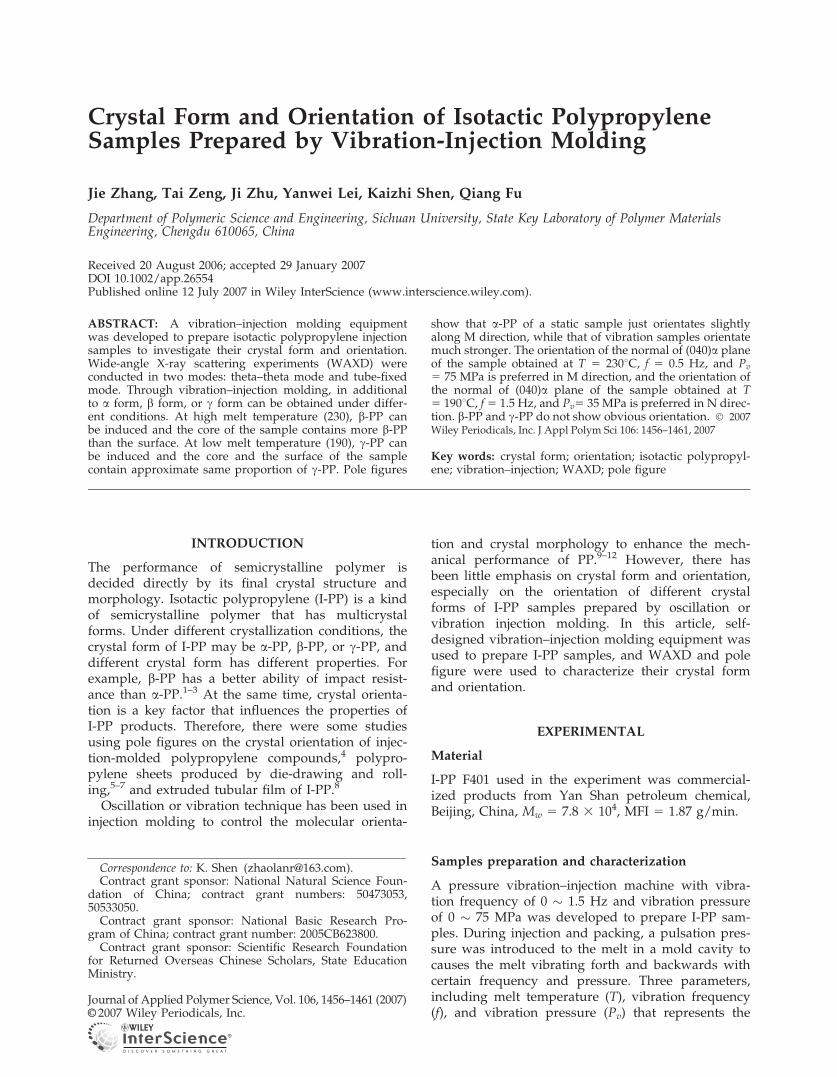
Figure 1 WAXD of samples obtained at 2308C by theta-theta mode. (a) Static sample, (b) f 5 0.5 Hz, Pv 5 35 MPa,(c) f 5 0.5 Hz, Pv 5 75 MPa, (d) f 5 1.5 Hz, Pv 5 35 MPa.
Figure 2 WAXD of samples obtained at 1908C by theta-theta mode. (a) Static sample, (b) f 5 0.5 Hz, Pv 5 35 MPa,(c) f 5 0.5 Hz, Pv 5 75 MPa, (d) f 5 1.5Hz, Pv 5 35 MPa.
ISOTACTIC POLYPROPYLENE SAMPLES 1457
Journal of Applied Polymer Science DOI 10.1002/app

EXPERIMENT RESULTS
WAXD
WAXD diagrams can be used to determine crystalforms of I-PP samples. The data used in Figures 1and 2 were obtained using theta-theta mode. Whenmelt temperature is 2308C, the a-ipp is formed underconventional injection condition as shown in Figure1(a). However, one observes another diffraction peak(300) at 2u 5 16.58 from other diagrams in Figure 1,which is the characteristic peak of b-PP. It indicatesthat b-PP can be induced through vibration at 2308C.The intensity of the peak is related to vibration pres-sure and frequency. When both vibration pressureand frequency are low [Fig. 1(b)], the intensity islow, and it increases as increasing the two parame-ters.
According to the intensity of the peaks, the rela-tive content of b-phase can be obtained as follows:14
k ¼ Hb
Hb þ ðHa1 þHa2 þHa3Þ
where Ha1, Ha2, Ha3 are intensities of a-diffractionpeaks corresponding to (040)a, (110)a, (130)a, respec-tively, and Hb is the intensity of the (300)b. There-fore, the content of b-phase is 0.19, 0.30, and 0.24corresponding to Figure 1(b–d). It means that moreb-PP can be formed at high vibration pressure com-pared with high frequency in the range of ourexperiment.
Figure 2 shows the WAXD diagrams of I-PP sam-ples obtained by vibration-injection molding at1908C. Instead of the peak at 2u 5 16.58, there is asmall peak at 2u 5 20.18 in Figure 2(c,d). It meansthat no b-PP but g-PP is induced at this temperature.No change of crystal form is seen at low vibration
Figure 3 WAXD of static sample. (a) Theta-theta mode,(b) tube-fixed mode.
Figure 4 WAXD of sample obtained at T 5 2308C, f 5 0.5Hz, and Pv 5 75 MPa. (a) Theta-theta mode, (b) tube-fixedmode.
Figure 5 WAXD of sample obtained at T 5 1908C, f 5 1.5Hz, and Pv 5 35 MPa. (a) Theta-theta mode, (b) tube-fixedmode.
1458 ZHANG ET AL.
Journal of Applied Polymer Science DOI 10.1002/app
frequency and low vibration pressure [Fig. 2(b)].One should note that the (040)a peak becomes verystrong in Figure 2(c,d), due to the high frequency orhigh pressure processing condition.
Figures 3–5 are comparisons of results betweentheta-theta mode and tube-fixed mode. There is noobvious difference between the two diagrams in Fig-ure 3. It indicates that the crystal form and the orien-tation of the core of static sample are almost thesame as those of the surface. However, the peaks ofthe diagram obtained using theta-theta mode arenarrower than those of the diagrams obtained usingtube-fixed mode, and it can be found in the othertwo figures. It seems that crystals in the core aremore perfect than those in the surface. Comparedwith diagram b, the peak at 2u 5 16.58 of diagram ais much higher and the (040)a peak is stronger inFigure 4. It means that the core of the sample con-tains more b-PP than the surface of the sample, theproportions are 0.3 and 0.17, respectively. In Figure5, although the intensity of (040)a peaks of diagrama and b is not the same, the intensity of the peak at2u 5 20.18 is almost the same. It seems that the coreand the surface of the sample contain approximatelythe same proportion of g-PP.
Pole figure
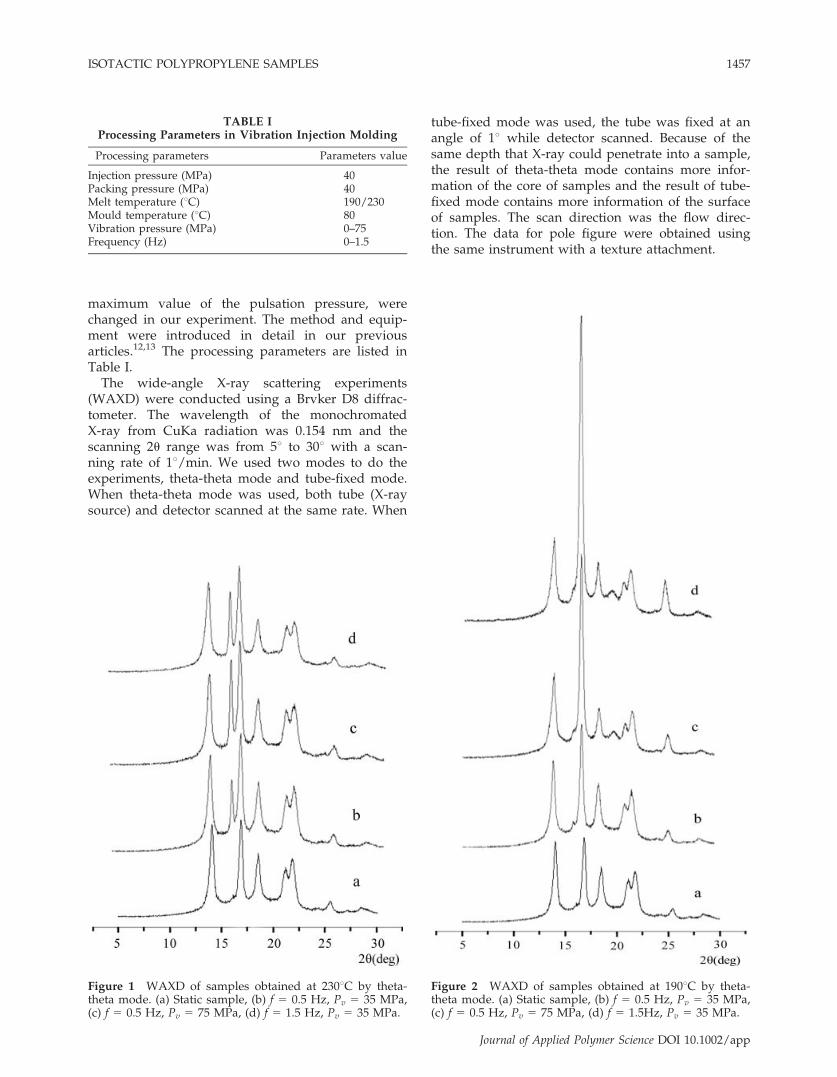
Figure 6 is pole figures of (040)a, (110)a, (130)areflection of the static sample. The normal of (040)arepresents the b axis of a monoclinic, the (040)a polefigure actually exhibits the orientation for b axis. InFigure 6(a), the inner contour has the strongest poleintensity, and the contours are ellipses with smallratios of major axis to minor axis. The contours ofFigure 6(b,c) are almost circular at large angles. Itindicates that the b-axis of the static sample just ori-entates slightly along M direction (MD).
Figure 7 is pole figures of(040)a, (110)a, (130)areflection of the sample obtained at T 5 2308C, f5 0.5 Hz, and Pv 5 75 MPa. The (040) poles have astronger equatorial orientation than that shown inFigure 6(a), and it is evident that the b-axis isarranged in a cylindrical manner about the MD. Atthe same time, b-axis has a slight preference orienta-tion about N direction (ND), as there are not anyclosed contours in the center in the pole-figure. Asshown in Figure 7(b), the pole intensity of (110)aplane has the biggest value in the center of the equa-tor, the ND orientation of (110) normal is obvious. InFigure 7(c), the direction of the pole intensity isalong MD. Since (130)a plane is parallel to the c-axisof a monoclinic, the normal of (130) is perpendicularto the c-axis. It is regarded that the c-axis has a pref-erential orientation in T direction (TD).
Figure 6 Pole figures of a-PP of static sample. (a) (040)plane, (b) (110) plane, (c) (130) plane. [Color figure can beviewed in the online issue, which is available at www.interscience.wiley.com.]
Figure 7 Pole figures of a-PP of sample obtained at T5 2308C, f 5 0.5 Hz, and Pv 5 75 MPa. (a) (040) plane, (b)(110) plane, (c) (130) plane. [Color figure can be viewed inthe online issue, which is available at www.interscience.wiley.com.]
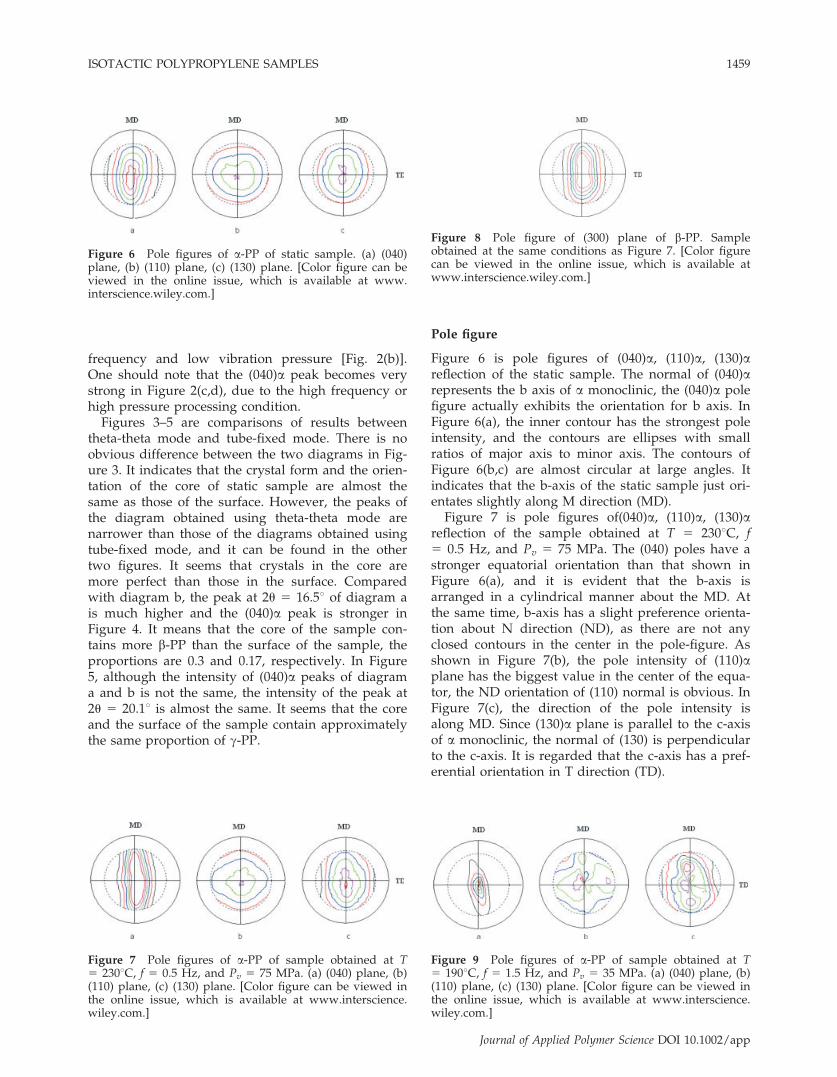
Figure 8 Pole figure of (300) plane of b-PP. Sampleobtained at the same conditions as Figure 7. [Color figurecan be viewed in the online issue, which is available atwww.interscience.wiley.com.]
Figure 9 Pole figures of a-PP of sample obtained at T5 1908C, f 5 1.5 Hz, and Pv 5 35 MPa. (a) (040) plane, (b)(110) plane, (c) (130) plane. [Color figure can be viewed inthe online issue, which is available at www.interscience.wiley.com.]
ISOTACTIC POLYPROPYLENE SAMPLES 1459
Journal of Applied Polymer Science DOI 10.1002/app
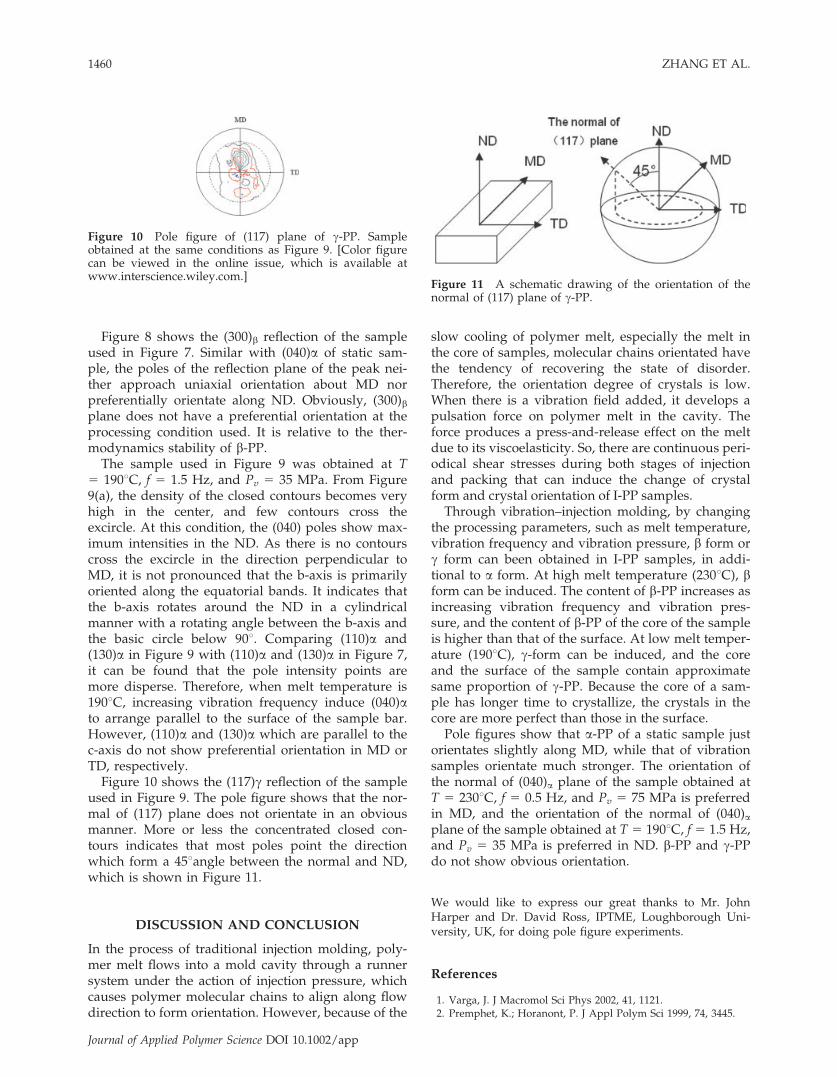
Figure 8 shows the (300)b reflection of the sampleused in Figure 7. Similar with (040)a of static sam-ple, the poles of the reflection plane of the peak nei-ther approach uniaxial orientation about MD norpreferentially orientate along ND. Obviously, (300)bplane does not have a preferential orientation at theprocessing condition used. It is relative to the ther-modynamics stability of b-PP.
The sample used in Figure 9 was obtained at T5 1908C, f 5 1.5 Hz, and Pv 5 35 MPa. From Figure9(a), the density of the closed contours becomes veryhigh in the center, and few contours cross theexcircle. At this condition, the (040) poles show max-imum intensities in the ND. As there is no contourscross the excircle in the direction perpendicular toMD, it is not pronounced that the b-axis is primarilyoriented along the equatorial bands. It indicates thatthe b-axis rotates around the ND in a cylindricalmanner with a rotating angle between the b-axis andthe basic circle below 908. Comparing (110)a and(130)a in Figure 9 with (110)a and (130)a in Figure 7,it can be found that the pole intensity points aremore disperse. Therefore, when melt temperature is1908C, increasing vibration frequency induce (040)ato arrange parallel to the surface of the sample bar.However, (110)a and (130)a which are parallel to thec-axis do not show preferential orientation in MD orTD, respectively.
Figure 10 shows the (117)g reflection of the sampleused in Figure 9. The pole figure shows that the nor-mal of (117) plane does not orientate in an obviousmanner. More or less the concentrated closed con-tours indicates that most poles point the directionwhich form a 458angle between the normal and ND,which is shown in Figure 11.
DISCUSSION AND CONCLUSION
In the process of traditional injection molding, poly-mer melt flows into a mold cavity through a runnersystem under the action of injection pressure, whichcauses polymer molecular chains to align along flowdirection to form orientation. However, because of the
slow cooling of polymer melt, especially the melt inthe core of samples, molecular chains orientated havethe tendency of recovering the state of disorder.Therefore, the orientation degree of crystals is low.When there is a vibration field added, it develops apulsation force on polymer melt in the cavity. Theforce produces a press-and-release effect on the meltdue to its viscoelasticity. So, there are continuous peri-odical shear stresses during both stages of injectionand packing that can induce the change of crystalform and crystal orientation of I-PP samples.
Through vibration–injection molding, by changingthe processing parameters, such as melt temperature,vibration frequency and vibration pressure, b form org form can been obtained in I-PP samples, in addi-tional to a form. At high melt temperature (2308C), bform can be induced. The content of b-PP increases asincreasing vibration frequency and vibration pres-sure, and the content of b-PP of the core of the sampleis higher than that of the surface. At low melt temper-ature (1908C), g-form can be induced, and the coreand the surface of the sample contain approximatesame proportion of g-PP. Because the core of a sam-ple has longer time to crystallize, the crystals in thecore are more perfect than those in the surface.
Pole figures show that a-PP of a static sample justorientates slightly along MD, while that of vibrationsamples orientate much stronger. The orientation ofthe normal of (040)a plane of the sample obtained atT 5 2308C, f 5 0.5 Hz, and Pv 5 75 MPa is preferredin MD, and the orientation of the normal of (040)aplane of the sample obtained at T 5 1908C, f 5 1.5 Hz,and Pv 5 35 MPa is preferred in ND. b-PP and g-PPdo not show obvious orientation.
We would like to express our great thanks to Mr. JohnHarper and Dr. David Ross, IPTME, Loughborough Uni-versity, UK, for doing pole figure experiments.
References
1. Varga, J. J Macromol Sci Phys 2002, 41, 1121.2. Premphet, K.; Horanont, P. J Appl Polym Sci 1999, 74, 3445.
Figure 10 Pole figure of (117) plane of g-PP. Sampleobtained at the same conditions as Figure 9. [Color figurecan be viewed in the online issue, which is available atwww.interscience.wiley.com.]
Figure 11 A schematic drawing of the orientation of thenormal of (117) plane of g-PP.
1460 ZHANG ET AL.
Journal of Applied Polymer Science DOI 10.1002/app
3. Tjong, S.C.; Shen, J. S.; Li, R. K. Y. Polym Eng Sci 1996, 36,100.
4. Chen, Z.; Finet, M. C.; Liddell, K. J Appl Polym Sci 1992, 46,1429.
5. Chaffey, C. E.; Taraiya, A. K.; Ward, I. M. Polym Eng Sci 1997,37, 1773.
6. Hibi, S.; Takahiro, N. Polym Eng Sci 1995, 35, 902.7. Hibi, S.; Takahiro N.; Jun, M. Polym Eng Sci 1995, 35,
911.8. Choi, D.; White, J. L. Polym Eng Sci 2001, 41, 1743.
9. Kalay, G.; Allan, P.; Bevis, M. J. Plast. Rubb. Proc. Appl. 1995,23, 71.
10. Kalay, G.; Bevis, M. J. J Polym Sci Part B: Polym Phys 1997, 35,241.
11. Ibar, J. P. Polym Eng Sci 1998, 38, 1.12. Zhang, J.; Shen, K. J Polym Sci Part B: Polym Phys 2004, 42,
2385.13. Zhang, J.; Shen, K. J Appl Polym Sci 2005, 96, 818.14. Karger-Kocsis, J. Polypropylene: Structure, Blends and Compo-
sites; Chapman & Hall: London, 1995.
ISOTACTIC POLYPROPYLENE SAMPLES 1461
Journal of Applied Polymer Science DOI 10.1002/app