
Crustal velocity structure across the Main Ethiopian Rift ...lewebb/Geol240/E Africa/Mackenzie et al...
13
Geophys. J. Int. (2005) 162, 994–1006 doi: 10.1111/j.1365-246X.2005.02710.x GJI Seismology Crustal velocity structure across the Main Ethiopian Rift: results from two-dimensional wide-angle seismic modelling G. D. Mackenzie, 1, ∗ H. Thybo 2 and P. K. H. Maguire 1 1 Department of Geology, University of Leicester, Leicester, LE1 7RH, UK 2 Geological Institute, University of Copenhagen, Denmark Accepted 2005 June 13. Received 2005 February 4; in original form 2004 July 21 SUMMARY We present the results of velocity modelling of a recently acquired wide-angle seismic reflec- tion/refraction profile across the Main Ethiopian Rift. The models show a continental type of crust with significant asymmetry between the two sides of the rift. A 2- to 5-km-thick layer of sedimentary and volcanic sequences is modelled across the entire region. This is underlain by a 40- to 45-km-thick crust with a c. 15-km-thick high-velocity lowest crustal layer beneath the western plateau. This layer is absent from the eastern side, where the crust is 35 km thick beneath the sediments. We interpret this layer as underplated material associated with the Oligocene flood basalts of the region with possible subsequent addition by recent magmatic events. Slight crustal thinning is observed beneath the rift, where Pn velocities indicate the presence of hot mantle rocks containing partial melt. Beneath the rift axis, the velocities of the upper crustal layers are 5–10 per cent higher than outside the rift, which we interpret as resulting from mafic intrusions that can be associated with magmatic centres observed in the rift valley. Variations in seismic reflectivity suggest the presence of layering in the lower crust beneath the rift, possibly indicating the presence of sills, as well as some layering in the proposed underplated body. Key words: crustal structure, Ethiopia, refraction seismology, rifts. INTRODUCTION The process of continental break-up is fundamental to the devel- opment of the Earth’s surface geology. The embryonic stage, the continental rift, cannot fully reveal the nature of the complex strain accommodation during break-up. In addition, the ultimate result of rifting is a volcanic or non-volcanic continental margin that are re- gions in which both the thermal response of the process has long since decayed away, and the structural and stratigraphic records of the separated margins are generally buried beneath thick post-rift se- quences. In order to test geodynamic models of the break-up process it is essential to image magmatic modification of the crust/mantle, and to determine crust/mantle strain at the moment when there is a transfer of extension accommodation from faulting to magma sup- ply. The Ethiopian Rift provides a unique opportunity to study the transition between continental rifting to the south in Kenya and new seafloor spreading to the north in the onshore extension of the Red Sea and Gulf of Aden in Afar (Fig. 1). While the Kenya Rift has been the subject of numerous geophysical investigations (e.g. Prodehl et al. 1994; Khan et al. 1999) and pioneering seismic stud- ies have provided near 1-D models of the crust and upper mantle beneath Afar (Berckhemer et al. 1975; Makris & Ginzberg 1987), ∗ Now at: Compagnie G´ en´ erale de G´ eophysique, Vantage West, Great West Rd., Brentford, Middlesex, TW8 9GG, UK. E-mail: [email protected] very little is known about the crustal structure beneath the transi- tional northern Main Ethiopian Rift (MER). EAGLE (the Ethiopia Afar Geoscientific Lithospheric Experiment) is a multidisciplinary project designed to investigate crust and mantle structure and the processes of strain accommodation beneath this transitional rift at the moment of continental break-up (Maguire et al. 2003). The project included a large controlled source seismic refraction and wide-angle reflection study consisting of one cross-rift and one rift- axial refraction profile as well as an areal 2-D array, the latter de- signed to provide a 3-D tomographic seismic velocity image of the upper crust around the intersection of the two profile lines (Fig. 2). We present results from velocity modelling of the cross-rift refrac- tion profile, which traverses the MER immediately southwest of the splayed opening into the Afar depression. The specific objectives for this profile were: to provide estimates of total crustal thinning across this transitional sector of the rift; to assess the role of basement in the location of major faults and magmatic segments; and to determine whether significant underplating takes place during rifting. TECTONIC AND GEOLOGICAL SETTING The NNE–SSW trending MER transects the uplifted Ethiopian plateau, which is believed to have developed in response to the impact of a Palaeogene mantle plume head on the base of the litho- sphere (Schilling et al. 1992; Ebinger & Sleep 1998). This plateau is 994 C 2005 RAS
-
Upload
truonglien -
Category
Documents
-
view
217 -
download
0
Transcript of Crustal velocity structure across the Main Ethiopian Rift ...lewebb/Geol240/E Africa/Mackenzie et al...

Geophys. J. Int. (2005) 162, 994–1006 doi: 10.1111/j.1365-246X.2005.02710.xG
JISei
smol
ogy
Crustal velocity structure across the Main Ethiopian Rift: resultsfrom two-dimensional wide-angle seismic modelling
G. D. Mackenzie,1,∗ H. Thybo2 and P. K. H. Maguire1
1Department of Geology, University of Leicester, Leicester, LE1 7RH, UK2Geological Institute, University of Copenhagen, Denmark
Accepted 2005 June 13. Received 2005 February 4; in original form 2004 July 21
S U M M A R YWe present the results of velocity modelling of a recently acquired wide-angle seismic reflec-tion/refraction profile across the Main Ethiopian Rift. The models show a continental type ofcrust with significant asymmetry between the two sides of the rift. A 2- to 5-km-thick layerof sedimentary and volcanic sequences is modelled across the entire region. This is underlainby a 40- to 45-km-thick crust with a c. 15-km-thick high-velocity lowest crustal layer beneaththe western plateau. This layer is absent from the eastern side, where the crust is 35 km thickbeneath the sediments. We interpret this layer as underplated material associated with theOligocene flood basalts of the region with possible subsequent addition by recent magmaticevents. Slight crustal thinning is observed beneath the rift, where Pn velocities indicate thepresence of hot mantle rocks containing partial melt. Beneath the rift axis, the velocities ofthe upper crustal layers are 5–10 per cent higher than outside the rift, which we interpretas resulting from mafic intrusions that can be associated with magmatic centres observed inthe rift valley. Variations in seismic reflectivity suggest the presence of layering in the lowercrust beneath the rift, possibly indicating the presence of sills, as well as some layering in theproposed underplated body.
Key words: crustal structure, Ethiopia, refraction seismology, rifts.
I N T RO D U C T I O N
The process of continental break-up is fundamental to the devel-opment of the Earth’s surface geology. The embryonic stage, thecontinental rift, cannot fully reveal the nature of the complex strainaccommodation during break-up. In addition, the ultimate result ofrifting is a volcanic or non-volcanic continental margin that are re-gions in which both the thermal response of the process has longsince decayed away, and the structural and stratigraphic records ofthe separated margins are generally buried beneath thick post-rift se-quences. In order to test geodynamic models of the break-up processit is essential to image magmatic modification of the crust/mantle,and to determine crust/mantle strain at the moment when there is atransfer of extension accommodation from faulting to magma sup-ply. The Ethiopian Rift provides a unique opportunity to study thetransition between continental rifting to the south in Kenya andnew seafloor spreading to the north in the onshore extension of theRed Sea and Gulf of Aden in Afar (Fig. 1). While the Kenya Rifthas been the subject of numerous geophysical investigations (e.g.Prodehl et al. 1994; Khan et al. 1999) and pioneering seismic stud-ies have provided near 1-D models of the crust and upper mantlebeneath Afar (Berckhemer et al. 1975; Makris & Ginzberg 1987),
∗Now at: Compagnie Generale de Geophysique, Vantage West, Great WestRd., Brentford, Middlesex, TW8 9GG, UK. E-mail: [email protected]
very little is known about the crustal structure beneath the transi-tional northern Main Ethiopian Rift (MER). EAGLE (the EthiopiaAfar Geoscientific Lithospheric Experiment) is a multidisciplinaryproject designed to investigate crust and mantle structure and theprocesses of strain accommodation beneath this transitional rift atthe moment of continental break-up (Maguire et al. 2003). Theproject included a large controlled source seismic refraction andwide-angle reflection study consisting of one cross-rift and one rift-axial refraction profile as well as an areal 2-D array, the latter de-signed to provide a 3-D tomographic seismic velocity image of theupper crust around the intersection of the two profile lines (Fig. 2).We present results from velocity modelling of the cross-rift refrac-tion profile, which traverses the MER immediately southwest of thesplayed opening into the Afar depression. The specific objectives forthis profile were: to provide estimates of total crustal thinning acrossthis transitional sector of the rift; to assess the role of basement in thelocation of major faults and magmatic segments; and to determinewhether significant underplating takes place during rifting.
T E C T O N I C A N D G E O L O G I C A LS E T T I N G
The NNE–SSW trending MER transects the uplifted Ethiopianplateau, which is believed to have developed in response to theimpact of a Palaeogene mantle plume head on the base of the litho-sphere (Schilling et al. 1992; Ebinger & Sleep 1998). This plateau is
994 C© 2005 RAS

Crustal velocity structure across the Main Ethiopian Rift 995
25˚ 30˚ 35˚ 40˚ 45˚ 50˚
-10˚
-5˚
0˚
5˚
10˚
15˚
20˚
Western Rift
Ethiopian Plateau
Afar
E.A.P.
Arabia
M.E.R
.
Kenya Rift
Gulf of Aden
Red Sea
Figure 1. Regional map of the East African Rift. Box indicates the locationof the EAGLE study area shown in Fig. 2. E.A.P—East African Plateau,M.E.R.—Main Ethiopian Rift.
covered by extensive flood basalts that have been dated at 31–29 Ma(e.g. Baker et al. 1996; Hofmann et al. 1997) almost co-eval withopening of the Red Sea and Gulf of Aden rifts by c. 30 and 28 Ma,respectively (Wolfenden et al. 2004). Rifting within the southernand central MER is believed to have occurred later, between 18–15Ma (WoldeGabriel et al. 1990) and in the northern MER at c. 11 Mawith formation of the Arboye border fault (Wolfenden et al. 2004)(see Fig. 2). To the north, within the structurally complex Afar de-pression, the MER intersects the Gulf of Aden and Red Sea rifts toform a triple junction between the Nubian, Arabian and Somalianplates. Structural and stratigraphic patterns indicate a migration ofextensional strain after 2.5 Ma from the border faults to a narrow 20-km-wide subaxial zone of narrow near north–south trending zonesof aligned eruptive centres cut by small offset faults and dykes ar-ranged in a right stepping en echelon pattern (Boccaletti et al. 1998;Wolfenden et al. 2004) (see Fig. 2). Bilham et al. (1999) have shownfrom GPS measurements that 80 per cent of the current rate of ex-tension of 4 mm yr−1 is concentrated in these magmatic segmentswhich have been interpreted by Ebinger & Casey (2001) as zonesof intensive dyke injection.
The Pan-African metamorphic crustal basement with a strong N–S fabric is overlain by Carboniferous—Cretaceous sediments fol-lowed by the dominantly Oligocene flood basalts, based on rareoutcrops in the central MER and good exposures in the SouthernMER (Davidson 1983; Ebinger et al. 1993). Within the rift valley area series of asymmetric sedimentary basins, for example the Adamabasin, bounded on one side by steep border faults (Ebinger & Casey2001) and containing Pleistocene volcanic, volcaniclastic and lacus-trine strata which overlie the Miocene—Pliocene felsic and maficsequences of the Kesem and Balchi formations (Wolfenden et al.2004). These sequences also extend beyond the western rift escarp-
ment into the Bishoftu embayment around 9◦N and onto the easternescarpment (Fig. 3).
P R E V I O U S G E O P H Y S I C A L W O R K
Previous wide-angle seismic surveys within the Ethiopian Rift con-sist of six refraction profiles (Berckhemer et al. 1975; Makris &Ginzberg 1987); five within the Afar depression and a sixth trendingeast–west on the plateau, extending into the rift south of the currentprofile (Line 1 in Fig. 2, inset). Within the Afar region a highlythinned crust was modelled with low sub-Moho velocities of 7.4–7.5 km s−1 interpreted as high-temperature upper mantle material.The sixth profile beneath the plateau indicated a c. 38-km-thick crustthinning to the west and underlain by normal mantle with a velocityof 8.1 km s−1 although Berckhemer et al. (1975) noted that availablegravity data required the presence of a high-density lower crustalbody beneath the rift escarpment.
Mahatsente et al. (1999) derived crustal structure beneath the riftbetween 6.5◦ and 8.5◦N from 3-D modelling of gravity data. Thisindicated crustal thinning from 38–51 km beneath the plateaux to≤31 km beneath the rift axis with a large dense intrusion in boththe lower-and upper crust following the magmatic segments in thecentre of the rift. The intrusion includes several lateral displacementsin an east–west direction and is suggested to originate from partialmelting in the lithosphere.
Recent receiver function work by Ayele et al. (2004) from datarecorded at the FURI broad-band station near Addis Ababa suggestsa c. 40-km-thick crust on the margin of the rift near Addis Ababawith anomalously low mantle lithospheric velocities and a possiblelithosphere/asthenosphere boundary at a depth of 90 km.
DATA A C Q U I S I T I O N
A 400-km-long wide-angle reflection/refraction profile (Fig. 2) wasacquired in January 2003 as part of project EAGLE (Maguire et al.2003). The NW–SE striking profile traversed the MER between theBlue Nile gorge in the Ethiopian Highlands and the Bale Mountainson the eastern part of the plateau. Within the rift the profile crossedthe Boset magmatic centre within the asymmetric Adama basin,bounded by the Arboye border fault.
Eight in-line borehole shots of between 1 and 2 tonnes of TNTwith a nominal shot spacing of 50 km were recorded on 431 seismicrecorders with an average station spacing of 1 km. The recorders in-cluded 92 three-component Guralp CMG-6TD seismometers (band-width 30–100 s) which had been deployed every 4–5 km to collectearthquake data over a 1- to 2-month period leading up to the project.These were augmented with 339 single-component Reftek ‘Texan’recorders deployed only for the period of the controlled source sur-vey. Data were recorded with a sample rate of 100 sps for bothinstrument types. GPS timing was used for the shots with shot andinstrument locations measured using multiple GPS readings.
DATA M O D E L L I N G
Phase identification and picking
Data quality is extremely good with substantial energy propagationalong the entire length of the profile. Fig. 4 shows three examplesof seismic sections from SP12 on the northwest plateau, SP14 onthe western edge of the rift and SP17 at the southeast end of theprofile. Two seismic phases (Ps and Ps1) with turning points in the
C© 2005 RAS, GJI, 162, 994–1006
996 G. D. Mackenzie, H. Thybo and P. K. H. Maguire
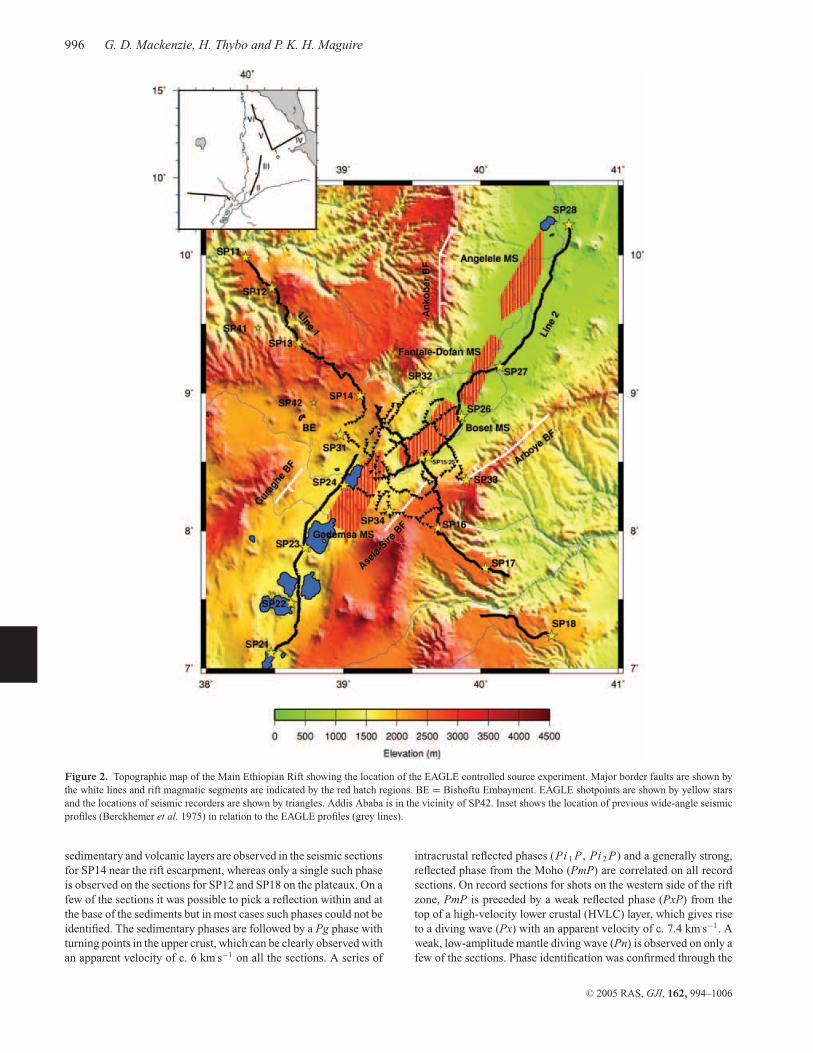
Figure 2. Topographic map of the Main Ethiopian Rift showing the location of the EAGLE controlled source experiment. Major border faults are shown bythe white lines and rift magmatic segments are indicated by the red hatch regions. BE = Bishoftu Embayment. EAGLE shotpoints are shown by yellow starsand the locations of seismic recorders are shown by triangles. Addis Ababa is in the vicinity of SP42. Inset shows the location of previous wide-angle seismicprofiles (Berckhemer et al. 1975) in relation to the EAGLE profiles (grey lines).
sedimentary and volcanic layers are observed in the seismic sectionsfor SP14 near the rift escarpment, whereas only a single such phaseis observed on the sections for SP12 and SP18 on the plateaux. On afew of the sections it was possible to pick a reflection within and atthe base of the sediments but in most cases such phases could not beidentified. The sedimentary phases are followed by a Pg phase withturning points in the upper crust, which can be clearly observed withan apparent velocity of c. 6 km s−1 on all the sections. A series of
intracrustal reflected phases (Pi 1 P , Pi 2 P) and a generally strong,reflected phase from the Moho (PmP) are correlated on all recordsections. On record sections for shots on the western side of the riftzone, PmP is preceded by a weak reflected phase (PxP) from thetop of a high-velocity lower crustal (HVLC) layer, which gives riseto a diving wave (Px) with an apparent velocity of c. 7.4 km s−1. Aweak, low-amplitude mantle diving wave (Pn) is observed on only afew of the sections. Phase identification was confirmed through the
C© 2005 RAS, GJI, 162, 994–1006

Crustal velocity structure across the Main Ethiopian Rift 997
Figure 3. (a) Simplified geological map of the region (after Wolfenden 2003) together with the location of EAGLE profile 1 (b) Geological cross-section A–A′across the Adama basin near profile 1 (after Wolfenden et al. 2004).
checking of reciprocal traveltimes, which proved especially usefulin identifying the PxP and PmP phases. A weak reflected phasefrom the upper mantle has been identified behind the Pn phase on afew sections. Traveltimes were picked on shot gathers using ZP, aninteractive plotting and picking software package (B. Zelt personalcommunication 2003). Picks were assigned a picking error basedon the relative signal to noise ratio (Table 1).
Traveltime modelling
Traveltime modelling was conducted using a combination of for-ward modelling and inversion with the RAYINVR code of Zelt &Smith (1992). In order to reduce the errors associated with seismicmodelling assuming a flat earth, which can become noticeable forlong profiles (Gorman 2002), a new local Cartesian coordinate sys-tem was defined for the project area and model offsets calculatedbased upon this system. Therefore, the curvature of the earth ap-pears as a slight topographic bulge in the model. An initial modelwas obtained through trial and error forward modelling to fit thepicked traveltimes using a top-down layer stripping approach. Thisinitial model was then refined via damped least-squares inversionto minimize the traveltime residuals. The resultant model was sub-sequently modified slightly, mainly regarding the vertical velocitygradients, based on qualitative comparison of the record sections
with synthetic seismograms (Fig. 5) calculated using the TRAMPcode of Zelt & Forsyth (1994).
The final velocity model (Fig. 6) shows a thin low-velocity layerof 3.3 km s−1 within the rift valley which extends westward to nearSP14. The layer thickens eastwards from c. 1 to c. 2.5 km in the riftvalley. It is underlain by a c. 2- to 5-km-thick layer of 4.5–5.5 km s−1
which extends the length of the profile. Beneath this layer, the top ofthe crystalline basement (defined as the >6.0 km s−1 layer) showsconsiderable topography, in particular beneath the rift escarpments.This topography resembles the surface expression of the rift witha small throw beneath the western margin of the rift and a largerthrow beneath the Arboye border fault on the eastern margin.
Normal continental crustal velocities of 6.0–6.8 km s−1 are mod-elled to 35- to 40-km depth with the exception of a narrow 20-to 30-km-wide region in the upper crust beneath the Boset mag-matic centre in the rift valley, where velocities are approximately6.5 km s−1 (c. 5 per cent higher than in the surrounding parts ofthe profile). An intracrustal reflector at c. 21-km depth beneaththe surface shallows eastwards beneath the western plateau and ismodelled at c. 12-km depth beneath the eastern plateau. Anotherintracrustal reflector is also modelled beneath the rift axis but it isunclear whether these reflectors are continuous along the whole pro-file or separated with possible different origins (e.g. those beneaththe rift valley may result from the presence of magma chambers or
C© 2005 RAS, GJI, 162, 994–1006

998 G. D. Mackenzie, H. Thybo and P. K. H. Maguire
Figure 4. Example seismic sections from (a) SP12, (b) SP14 and (c) SP17. Sections are reduced at 6 km s−1 with trace normalized amplitudes and bandpassfiltered from 4–16 Hz. Calculated traveltime curves from the velocity model shown in Fig. 5 are overlain. Phase labelling: Ps and Ps1—sedimentary divingwaves; Pg—basement diving wave; P1—diving wave in the mid crust; Px—diving wave in high-velocity lower crustal (HVLC) layer; Pn—mantle diving wave;Pi 1 P and Pi2P—intracrustal reflectors; PxP—reflector off top of HVLC layer; PmP—Moho reflector; PLP—mantle reflector. Note the delay in the Pg phaseas a result of the deeper basement and thicker sediments within the rift e.g. between c. 50- and 100-km offset from SP14.
sills). A second intracrustal reflector is modelled at c. 28-km depthbelow the surface beneath the eastern and western plateaux. Thisreflector appears to be more continuous than the upper reflector. Itsdepth of 23 km below the surface beneath the rift shows that theupper crust is considerably thinned with the maximum thinning oc-curring slightly to the west of the rift axis. Due to the uncertaintyin the continuity of the first intracrustal reflector we will in the
following discussions use the terms upper and lower crust for theregions above or below this second reflector.Beneath the eastern plateau the depth to the Moho is 40 kmbelow the surface and the Pn mantle velocity is 8.0–8.1 km s−1 asexpected in stable areas with normal heat flow. Beneath the rift axisthe Moho is shallower at c. 35-km depth below the surface and thePn mantle velocity is 7.7 km s−1. Beneath the western plateau a
C© 2005 RAS, GJI, 162, 994–1006

Crustal velocity structure across the Main Ethiopian Rift 999
Table 1. Modelling results.
Phase N Per cent Error(s) T RMS χ2
Ps 70 94 0.06 0.105 3.359PsP 11 100 0.11 0.191 5.553Ps1 187 97 0.06 0.085 2.647Ps 1 P 24 100 0.10 0.110 1.925Pg 895 95 0.066 0.159 3.724Pi 1 P 334 97 0.146 0.112 0.647P1 287 92 0.093 0.147 2.772Pi 2 P 334 99 0.151 0.205 2.431PxP 418 94 0.149 0.199 1.894PmP 287 98 0.155 0.176 1.901Px 90 93 0.131 0.126 2.049Pn 32 69 0.160 0.204 1.490All phases 2959 96 0.115 0.164 2.563
N is the number of picks, per cent is the percentage of data points used,error is the average assigned traveltime error for that phase. T RMS and χ2
after Zelt & Smith (1992).
Figure 5. Synthetic seismic sections for (a) SP12 (b) SP14 and (c) SP17 shown in Fig. 3.
c. 15-km-thick layer of 7.4 km s−1 velocity is modelled betweenc. 33- and 48-km depth. This may only extend to the rift and isdefinitely absent from the eastern part of the profile. The preciselocation of its eastward termination is uncertain, but it is likely thatthe layer terminates beneath the western rift flank. Mantle velocitiesbeneath this body are not constrained by the refraction data butoverlaying seismic sections with theoretical traveltime curves for anumber of different possible velocities suggests a preferred mantlevelocity of <8.0 km s−1 for this region. A possible mantle reflectorat c. 60 km below the surface is modelled with relatively large depthuncertainty due to the lack of velocity information immediatelyabove it.
M O D E L R E S O L U T I O N
Model resolution was assessed by monitoring the number of raystraced, the RMS traveltime residual, and the normalized χ2 value(Zelt & Forsyth 1994). These values are summarized in Table 1 for
C© 2005 RAS, GJI, 162, 994–1006
1000 G. D. Mackenzie, H. Thybo and P. K. H. Maguire
0
10
20
30
40
50
60
Dep
th (
km)
0 50 100 150 200 250 300 350
Distance (km)
5.0 4.8 5.2
6.10
6.16
6.33
6.406.64
6.827.38 7.70
8.05
6.83
6.63
6.38
6.316.15
6.07
6.73
6.65
6.54
6.526.24 6.23
6.516.086.13
3.3
NW SESP11 SP12 SP13 SP14 SP15/25 SP16 SP17 SP18
3 4 5 6 7 8 9
Vp (km s−1)
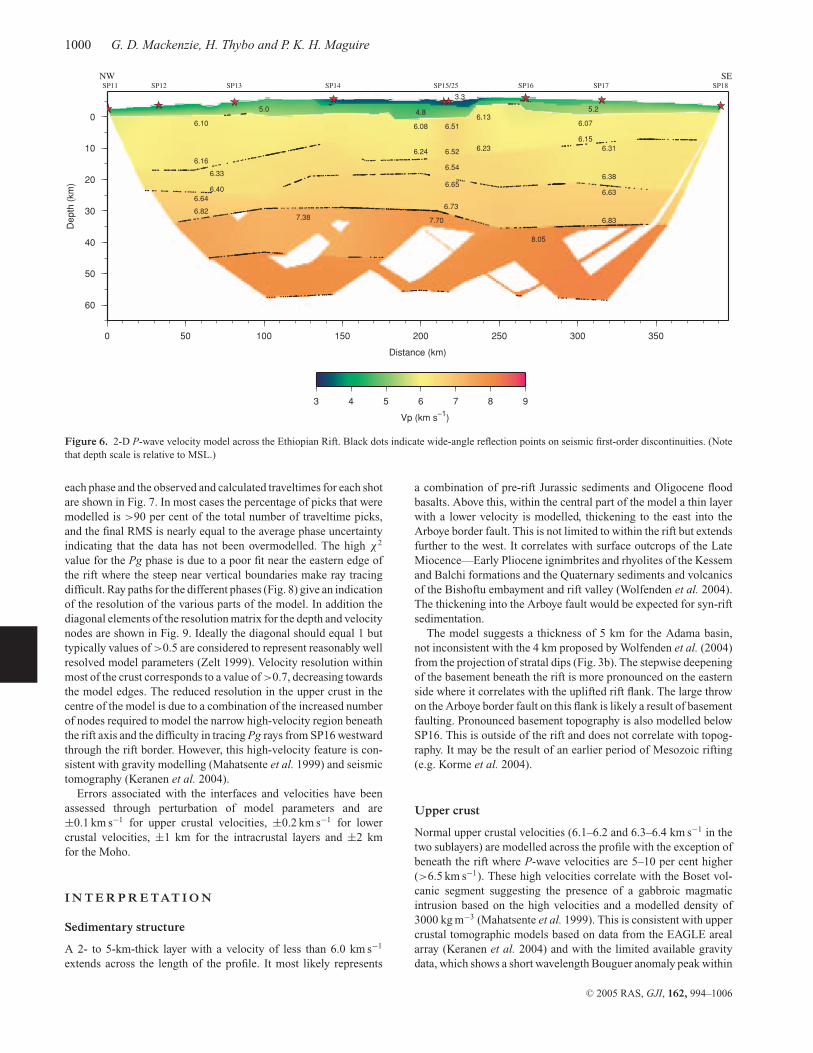
Figure 6. 2-D P-wave velocity model across the Ethiopian Rift. Black dots indicate wide-angle reflection points on seismic first-order discontinuities. (Notethat depth scale is relative to MSL.)
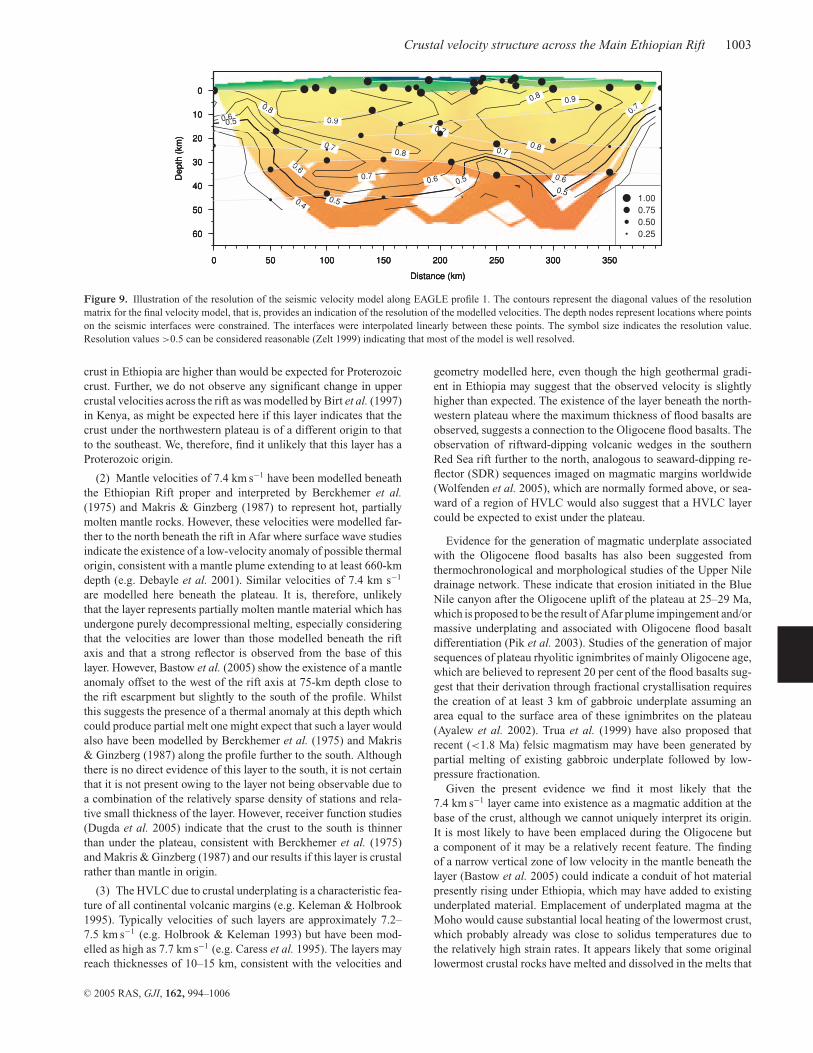
each phase and the observed and calculated traveltimes for each shotare shown in Fig. 7. In most cases the percentage of picks that weremodelled is >90 per cent of the total number of traveltime picks,and the final RMS is nearly equal to the average phase uncertaintyindicating that the data has not been overmodelled. The high χ2
value for the Pg phase is due to a poor fit near the eastern edge ofthe rift where the steep near vertical boundaries make ray tracingdifficult. Ray paths for the different phases (Fig. 8) give an indicationof the resolution of the various parts of the model. In addition thediagonal elements of the resolution matrix for the depth and velocitynodes are shown in Fig. 9. Ideally the diagonal should equal 1 buttypically values of >0.5 are considered to represent reasonably wellresolved model parameters (Zelt 1999). Velocity resolution withinmost of the crust corresponds to a value of >0.7, decreasing towardsthe model edges. The reduced resolution in the upper crust in thecentre of the model is due to a combination of the increased numberof nodes required to model the narrow high-velocity region beneaththe rift axis and the difficulty in tracing Pg rays from SP16 westwardthrough the rift border. However, this high-velocity feature is con-sistent with gravity modelling (Mahatsente et al. 1999) and seismictomography (Keranen et al. 2004).
Errors associated with the interfaces and velocities have beenassessed through perturbation of model parameters and are±0.1 km s−1 for upper crustal velocities, ±0.2 km s−1 for lowercrustal velocities, ±1 km for the intracrustal layers and ±2 kmfor the Moho.
I N T E R P R E TAT I O N
Sedimentary structure
A 2- to 5-km-thick layer with a velocity of less than 6.0 km s−1
extends across the length of the profile. It most likely represents
a combination of pre-rift Jurassic sediments and Oligocene floodbasalts. Above this, within the central part of the model a thin layerwith a lower velocity is modelled, thickening to the east into theArboye border fault. This is not limited to within the rift but extendsfurther to the west. It correlates with surface outcrops of the LateMiocence—Early Pliocene ignimbrites and rhyolites of the Kessemand Balchi formations and the Quaternary sediments and volcanicsof the Bishoftu embayment and rift valley (Wolfenden et al. 2004).The thickening into the Arboye fault would be expected for syn-riftsedimentation.
The model suggests a thickness of 5 km for the Adama basin,not inconsistent with the 4 km proposed by Wolfenden et al. (2004)from the projection of stratal dips (Fig. 3b). The stepwise deepeningof the basement beneath the rift is more pronounced on the easternside where it correlates with the uplifted rift flank. The large throwon the Arboye border fault on this flank is likely a result of basementfaulting. Pronounced basement topography is also modelled belowSP16. This is outside of the rift and does not correlate with topog-raphy. It may be the result of an earlier period of Mesozoic rifting(e.g. Korme et al. 2004).
Upper crust
Normal upper crustal velocities (6.1–6.2 and 6.3–6.4 km s−1 in thetwo sublayers) are modelled across the profile with the exception ofbeneath the rift where P-wave velocities are 5–10 per cent higher(>6.5 km s−1). These high velocities correlate with the Boset vol-canic segment suggesting the presence of a gabbroic magmaticintrusion based on the high velocities and a modelled density of3000 kg m−3 (Mahatsente et al. 1999). This is consistent with uppercrustal tomographic models based on data from the EAGLE arealarray (Keranen et al. 2004) and with the limited available gravitydata, which shows a short wavelength Bouguer anomaly peak within
C© 2005 RAS, GJI, 162, 994–1006

Crustal velocity structure across the Main Ethiopian Rift 1001
-2
0
2
4
t-x/
6 (s
)
0 50 100 150 200 250 300 350
Distance (km)
SP11
-2
0
2
4
0 50 100 150 200 250 300 350
Distance (km)
SP12
-2
0
2
4
t-x/
6 (s
)
0 50 100 150 200 250 300 350
Distance (km)
SP13
-2
0
2
4
0 50 100 150 200 250 300 350
Distance (km)
SP14
-2
0
2
4
t-x/
6 (s
)
0 50 100 150 200 250 300 350
Distance (km)
SP25
-2
0
2
4
0 50 100 150 200 250 300 350
Distance (km)
SP16
-2
0
2
4
t-x/
6 (s
)
0 50 100 150 200 250 300 350
Distance (km)
SP17
-2
0
2
4
0 50 100 150 200 250 300 350
Distance (km)
SP18
Figure 7. Observed and calculated traveltimes for all shot points along EAGLE profile 1. Grey bars indicate the traveltime picks with a length correspondingto the assessed uncertainty, black dots the calculated traveltimes.
the rift. The upper crust (including the surficial volcanic/sedimentlayer) thins from c. 28 km–c. 23 km thick beneath the rift with theregion of maximum thinning offset to the west of the axis of thesurface expression of the rift. Similar crustal velocities are mod-elled under both the western and eastern plateaux. This is differentto findings in Kenya, where significantly higher upper crustal veloc-ities were modelled on the eastern than on the western side of therift which has led to the proposal that the Kenya rift formed alonga pre-existing Proterozoic–Archean suture zone (Birt et al. 1997).The finding of similar velocities on the two sides of the MER sug-gests that this part of the East African Rift system dissects crust ofsimilar origin.
Lower crust and upper mantle
Normal continental lower crust and mantle is modelled beneaththe eastern plateau. The crust is thinner beneath the rift axis thanbeneath the eastern side of the rift zone. A sub-Moho Pn mantle
velocity of 7.7 km s−1 is modelled beneath the rift axis, similar tothe Pn mantle velocity beneath the Kenya rift. There such a lowvelocity was attributed to the presence of high-temperature mantlematerial with 3–5 per cent partial melt (Mechie et al. 1994) and wesuggest a similar origin for the low mantle velocity modelled here.The crustal thinning and low mantle velocity agree with preliminaryresults from the modelling of data along the axial profile (Maguireet al. 2005).
Beneath the western plateau a 15-km-thick layer with a velocityof 7.4 km s−1 is modelled which, although uncertain, is believed toterminate beneath or near the western rift escarpment. The resolu-tion test (Fig. 9) shows that the velocity is reasonably well resolved,that its upper interface is well constrained by the data, and that areflection from its base is resolved in the central part of this body.We only identify this layer on the western side of the MER. The layerexhibits strong reflectivity in the seismic sections and its velocity ofc. 7.4 km s−1 is between those expected of normal lower crust andmantle. The depth to the base of this layer is greater than the Moho
C© 2005 RAS, GJI, 162, 994–1006

1002 G. D. Mackenzie, H. Thybo and P. K. H. Maguire
Figure 8. Two point ray path diagrams indicating ray coverage for each of the modelled seismic phases along EAGLE profile 1. (Note the reduced scale fordisplay of the mantle reflections PLP).
depth on the eastern side of the rift and to the south (Berckhemeret al. 1975; Makris & Ginzberg 1987). Teleseismic receiverfunctions also suggest a thicker crust exists under the northwest-ern than under the southeastern plateau and to the south, withcrustal thinning beneath the rift axis (Dugda et al. 2005; Stuartet al. 2003). The available gravity data also exhibits a general de-crease in Bouguer anomaly values from east to west consistent witha thick crust including a dense lower crustal layer beneath the west-ern plateau and a thinner crust beneath the eastern plateau (Tiberiet al. 2005; Cornwell et al. 2005). We see three possible origins for
this layer which are discussed below: (1) a relic pre-rift Proterozoiccrust; (2) a low velocity mantle layer; or (3) magmatic underplatingof Oligocene and/or recent origin.
(1) A 7-km-thick lower crustal layer with velocities of 7.0–7.3 km s−1 is commonly observed in Proterozoic crust worldwide(Christensen & Mooney 1995) and was modelled at the base of theProterozoic crust on the eastern side of the Kenyan rift (Birt et al.1997). However, given the relatively high geothermal gradient andthereby temperature of the region, the velocities in our model of the
C© 2005 RAS, GJI, 162, 994–1006
Crustal velocity structure across the Main Ethiopian Rift 1003
0
10
20
30
40
50
60
Dep
th (
km)
0 50 100 150 200 250 300 350
Distance (km)
0
10
20
30
40
50
60
Dep
th (
km)
0 50 100 150 200 250 300 350
Distance (km)
0.4
0.50.5
0.5
0.5
0.60.6
0.6
0.6
0.7
0.7
0.7
0.7
0.7
0.8
0.8
0.8
0.8
0.9
0.90
10
20
30
40
50
60
Dep
th (
km)
0 50 100 150 200 250 300 350
Distance (km)
1.000.750.500.25
Figure 9. Illustration of the resolution of the seismic velocity model along EAGLE profile 1. The contours represent the diagonal values of the resolutionmatrix for the final velocity model, that is, provides an indication of the resolution of the modelled velocities. The depth nodes represent locations where pointson the seismic interfaces were constrained. The interfaces were interpolated linearly between these points. The symbol size indicates the resolution value.Resolution values >0.5 can be considered reasonable (Zelt 1999) indicating that most of the model is well resolved.
crust in Ethiopia are higher than would be expected for Proterozoiccrust. Further, we do not observe any significant change in uppercrustal velocities across the rift as was modelled by Birt et al. (1997)in Kenya, as might be expected here if this layer indicates that thecrust under the northwestern plateau is of a different origin to thatto the southeast. We, therefore, find it unlikely that this layer has aProterozoic origin.
(2) Mantle velocities of 7.4 km s−1 have been modelled beneaththe Ethiopian Rift proper and interpreted by Berckhemer et al.(1975) and Makris & Ginzberg (1987) to represent hot, partiallymolten mantle rocks. However, these velocities were modelled far-ther to the north beneath the rift in Afar where surface wave studiesindicate the existence of a low-velocity anomaly of possible thermalorigin, consistent with a mantle plume extending to at least 660-kmdepth (e.g. Debayle et al. 2001). Similar velocities of 7.4 km s−1
are modelled here beneath the plateau. It is, therefore, unlikelythat the layer represents partially molten mantle material which hasundergone purely decompressional melting, especially consideringthat the velocities are lower than those modelled beneath the riftaxis and that a strong reflector is observed from the base of thislayer. However, Bastow et al. (2005) show the existence of a mantleanomaly offset to the west of the rift axis at 75-km depth close tothe rift escarpment but slightly to the south of the profile. Whilstthis suggests the presence of a thermal anomaly at this depth whichcould produce partial melt one might expect that such a layer wouldalso have been modelled by Berckhemer et al. (1975) and Makris& Ginzberg (1987) along the profile further to the south. Althoughthere is no direct evidence of this layer to the south, it is not certainthat it is not present owing to the layer not being observable due toa combination of the relatively sparse density of stations and rela-tive small thickness of the layer. However, receiver function studies(Dugda et al. 2005) indicate that the crust to the south is thinnerthan under the plateau, consistent with Berckhemer et al. (1975)and Makris & Ginzberg (1987) and our results if this layer is crustalrather than mantle in origin.
(3) The HVLC due to crustal underplating is a characteristic fea-ture of all continental volcanic margins (e.g. Keleman & Holbrook1995). Typically velocities of such layers are approximately 7.2–7.5 km s−1 (e.g. Holbrook & Keleman 1993) but have been mod-elled as high as 7.7 km s−1 (e.g. Caress et al. 1995). The layers mayreach thicknesses of 10–15 km, consistent with the velocities and
geometry modelled here, even though the high geothermal gradi-ent in Ethiopia may suggest that the observed velocity is slightlyhigher than expected. The existence of the layer beneath the north-western plateau where the maximum thickness of flood basalts areobserved, suggests a connection to the Oligocene flood basalts. Theobservation of riftward-dipping volcanic wedges in the southernRed Sea rift further to the north, analogous to seaward-dipping re-flector (SDR) sequences imaged on magmatic margins worldwide(Wolfenden et al. 2005), which are normally formed above, or sea-ward of a region of HVLC would also suggest that a HVLC layercould be expected to exist under the plateau.
Evidence for the generation of magmatic underplate associatedwith the Oligocene flood basalts has also been suggested fromthermochronological and morphological studies of the Upper Niledrainage network. These indicate that erosion initiated in the BlueNile canyon after the Oligocene uplift of the plateau at 25–29 Ma,which is proposed to be the result of Afar plume impingement and/ormassive underplating and associated with Oligocene flood basaltdifferentiation (Pik et al. 2003). Studies of the generation of majorsequences of plateau rhyolitic ignimbrites of mainly Oligocene age,which are believed to represent 20 per cent of the flood basalts sug-gest that their derivation through fractional crystallisation requiresthe creation of at least 3 km of gabbroic underplate assuming anarea equal to the surface area of these ignimbrites on the plateau(Ayalew et al. 2002). Trua et al. (1999) have also proposed thatrecent (<1.8 Ma) felsic magmatism may have been generated bypartial melting of existing gabbroic underplate followed by low-pressure fractionation.
Given the present evidence we find it most likely that the7.4 km s−1 layer came into existence as a magmatic addition at thebase of the crust, although we cannot uniquely interpret its origin.It is most likely to have been emplaced during the Oligocene buta component of it may be a relatively recent feature. The findingof a narrow vertical zone of low velocity in the mantle beneath thelayer (Bastow et al. 2005) could indicate a conduit of hot materialpresently rising under Ethiopia, which may have added to existingunderplated material. Emplacement of underplated magma at theMoho would cause substantial local heating of the lowermost crust,which probably already was close to solidus temperatures due tothe relatively high strain rates. It appears likely that some originallowermost crustal rocks have melted and dissolved in the melts that
C© 2005 RAS, GJI, 162, 994–1006

1004 G. D. Mackenzie, H. Thybo and P. K. H. Maguire
Figure 10. True amplitude seismic section from SP12, SP17 and SP18 illustrating the difference in lower crustal reflectivity characteristics. SP18 has bouncepoints under the eastern plateau, SP17 bounce points directly beneath the rift axis and SP12 bounce points in the high-velocity lower crustal layer. Arrowedsections indicate the range over which PmP reflectivity is discussed in the text.
were added to the base of the crust. This may explain the slightshallowing of the upper interface of the anomalous layer comparedto the depth to Moho on the eastern side of the rift. The upper inter-face of this anomalous layer may represent an upper limit of a relictMoho.
The existence of thicker crust under the northwestern plateau mayalso have influenced the evolution of the MER on a local scale andpartly explain the kink in the rift at around 9◦N where the rift axischanges from NNE to a more NE direction (Figs 2 and 3). The rift’snorthward propagation may have followed the pre-existing boundary
C© 2005 RAS, GJI, 162, 994–1006
Crustal velocity structure across the Main Ethiopian Rift 1005
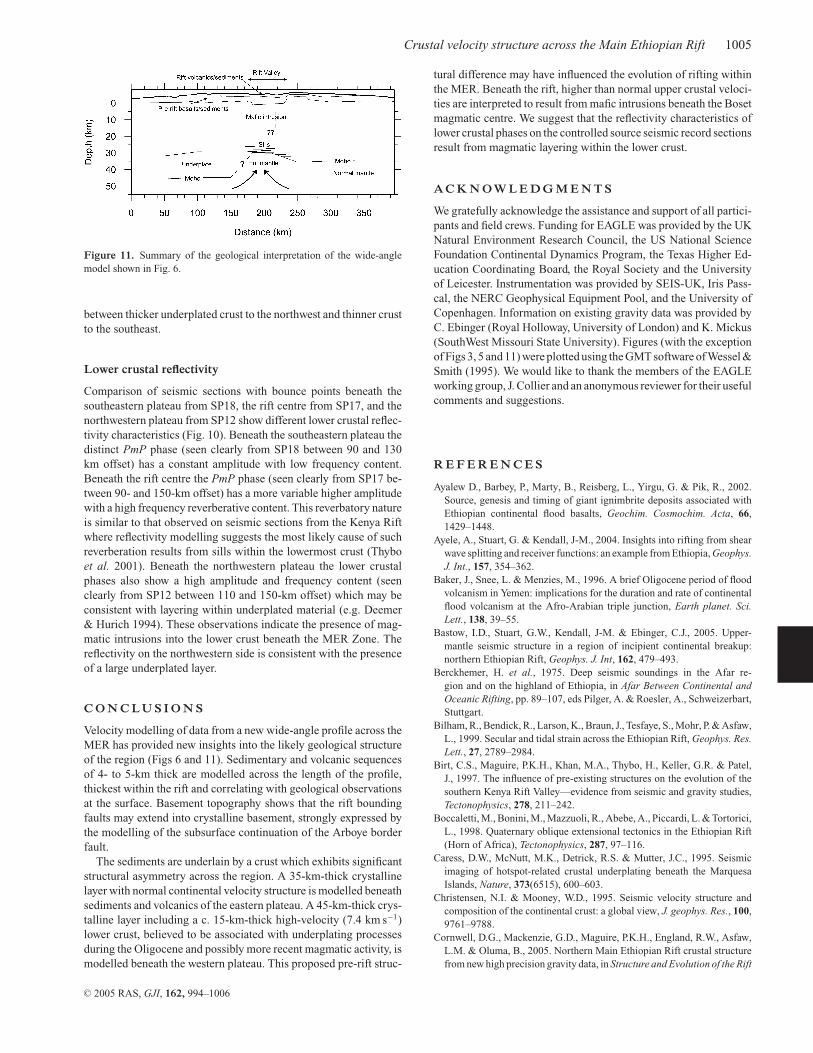
Figure 11. Summary of the geological interpretation of the wide-anglemodel shown in Fig. 6.
between thicker underplated crust to the northwest and thinner crustto the southeast.
Lower crustal reflectivity
Comparison of seismic sections with bounce points beneath thesoutheastern plateau from SP18, the rift centre from SP17, and thenorthwestern plateau from SP12 show different lower crustal reflec-tivity characteristics (Fig. 10). Beneath the southeastern plateau thedistinct PmP phase (seen clearly from SP18 between 90 and 130km offset) has a constant amplitude with low frequency content.Beneath the rift centre the PmP phase (seen clearly from SP17 be-tween 90- and 150-km offset) has a more variable higher amplitudewith a high frequency reverberative content. This reverbatory natureis similar to that observed on seismic sections from the Kenya Riftwhere reflectivity modelling suggests the most likely cause of suchreverberation results from sills within the lowermost crust (Thyboet al. 2001). Beneath the northwestern plateau the lower crustalphases also show a high amplitude and frequency content (seenclearly from SP12 between 110 and 150-km offset) which may beconsistent with layering within underplated material (e.g. Deemer& Hurich 1994). These observations indicate the presence of mag-matic intrusions into the lower crust beneath the MER Zone. Thereflectivity on the northwestern side is consistent with the presenceof a large underplated layer.
C O N C L U S I O N S
Velocity modelling of data from a new wide-angle profile across theMER has provided new insights into the likely geological structureof the region (Figs 6 and 11). Sedimentary and volcanic sequencesof 4- to 5-km thick are modelled across the length of the profile,thickest within the rift and correlating with geological observationsat the surface. Basement topography shows that the rift boundingfaults may extend into crystalline basement, strongly expressed bythe modelling of the subsurface continuation of the Arboye borderfault.
The sediments are underlain by a crust which exhibits significantstructural asymmetry across the region. A 35-km-thick crystallinelayer with normal continental velocity structure is modelled beneathsediments and volcanics of the eastern plateau. A 45-km-thick crys-talline layer including a c. 15-km-thick high-velocity (7.4 km s−1)lower crust, believed to be associated with underplating processesduring the Oligocene and possibly more recent magmatic activity, ismodelled beneath the western plateau. This proposed pre-rift struc-
tural difference may have influenced the evolution of rifting withinthe MER. Beneath the rift, higher than normal upper crustal veloci-ties are interpreted to result from mafic intrusions beneath the Bosetmagmatic centre. We suggest that the reflectivity characteristics oflower crustal phases on the controlled source seismic record sectionsresult from magmatic layering within the lower crust.
A C K N O W L E D G M E N T S
We gratefully acknowledge the assistance and support of all partici-pants and field crews. Funding for EAGLE was provided by the UKNatural Environment Research Council, the US National ScienceFoundation Continental Dynamics Program, the Texas Higher Ed-ucation Coordinating Board, the Royal Society and the Universityof Leicester. Instrumentation was provided by SEIS-UK, Iris Pass-cal, the NERC Geophysical Equipment Pool, and the University ofCopenhagen. Information on existing gravity data was provided byC. Ebinger (Royal Holloway, University of London) and K. Mickus(SouthWest Missouri State University). Figures (with the exceptionof Figs 3, 5 and 11) were plotted using the GMT software of Wessel &Smith (1995). We would like to thank the members of the EAGLEworking group, J. Collier and an anonymous reviewer for their usefulcomments and suggestions.
R E F E R E N C E S
Ayalew D., Barbey, P., Marty, B., Reisberg, L., Yirgu, G. & Pik, R., 2002.Source, genesis and timing of giant ignimbrite deposits associated withEthiopian continental flood basalts, Geochim. Cosmochim. Acta, 66,1429–1448.
Ayele, A., Stuart, G. & Kendall, J-M., 2004. Insights into rifting from shearwave splitting and receiver functions: an example from Ethiopia, Geophys.J. Int., 157, 354–362.
Baker, J., Snee, L. & Menzies, M., 1996. A brief Oligocene period of floodvolcanism in Yemen: implications for the duration and rate of continentalflood volcanism at the Afro-Arabian triple junction, Earth planet. Sci.Lett., 138, 39–55.
Bastow, I.D., Stuart, G.W., Kendall, J-M. & Ebinger, C.J., 2005. Upper-mantle seismic structure in a region of incipient continental breakup:northern Ethiopian Rift, Geophys. J. Int, 162, 479–493.
Berckhemer, H. et al., 1975. Deep seismic soundings in the Afar re-gion and on the highland of Ethiopia, in Afar Between Continental andOceanic Rifting, pp. 89–107, eds Pilger, A. & Roesler, A., Schweizerbart,Stuttgart.
Bilham, R., Bendick, R., Larson, K., Braun, J., Tesfaye, S., Mohr, P. & Asfaw,L., 1999. Secular and tidal strain across the Ethiopian Rift, Geophys. Res.Lett., 27, 2789–2984.
Birt, C.S., Maguire, P.K.H., Khan, M.A., Thybo, H., Keller, G.R. & Patel,J., 1997. The influence of pre-existing structures on the evolution of thesouthern Kenya Rift Valley—evidence from seismic and gravity studies,Tectonophysics, 278, 211–242.
Boccaletti, M., Bonini, M., Mazzuoli, R., Abebe, A., Piccardi, L. & Tortorici,L., 1998. Quaternary oblique extensional tectonics in the Ethiopian Rift(Horn of Africa), Tectonophysics, 287, 97–116.
Caress, D.W., McNutt, M.K., Detrick, R.S. & Mutter, J.C., 1995. Seismicimaging of hotspot-related crustal underplating beneath the MarquesaIslands, Nature, 373(6515), 600–603.
Christensen, N.I. & Mooney, W.D., 1995. Seismic velocity structure andcomposition of the continental crust: a global view, J. geophys. Res., 100,9761–9788.
Cornwell, D.G., Mackenzie, G.D., Maguire, P.K.H., England, R.W., Asfaw,L.M. & Oluma, B., 2005. Northern Main Ethiopian Rift crustal structurefrom new high precision gravity data, in Structure and Evolution of the Rift
C© 2005 RAS, GJI, 162, 994–1006

1006 G. D. Mackenzie, H. Thybo and P. K. H. Maguire
Systems within the Afar Volcanic Province, Northeast Africa, eds Yirgu,G., Ebinger, C.J. & Maguire, P.K.H., Geol. Soc. Spec. Pub., London, UK,submitted.
Davidson, A., compiler, 1983. The Omo River Project, reconnaissance geol-ogy and geochemistry of parts of Ilubabor, Kefa, Gemu Gofa, and Sidamo,Ministry of Mines and Energy, Ethiopian Institute of Geological SurveysBulletin 2, 1–89.
Debayle, E., Leveque, J-J. & Cara, M., 2001. Seismic evidence for a deeplyrooted low-velocity anomaly in the upper mantle beneath the northeasternAfro/Arabian continent, Earth planet. Sci. Lett., 193, 423–436.
Deemer, S.J. & Hurich, C.A., 1994. The reflectivity of magmatic underplat-ing using the layered mafic intrusion analog, Tectonophysics, 232(1–4),239–255.
Dugda, M., Nyblade, A.A., Julia, J., Langston, C.A., Ammon, C.J. & Simiyu,S., 2005. Crustal structure in Ethiopia and Kenya from receiver functionanalysis: implications for rift development in eastern Africa, J. geophys.Res., 110, 1–15, B01303, doi:10.1029/2004JB003065.
Ebinger, C.J. & Casey, M., 2001. Continental breakup in magmaticprovinces: an Ethiopian example, Geology, 29(6), 527–530.
Ebinger, C. & Sleep, N., 1998. Cenozoic magmatism throughout E Africaresulting from impact of a single plume, Nature, 395, 788.
Ebinger, C.J., Yemane, T., WoldeGabriel, G., Aronson, J.L. & Walker, R.C.,1993. Late Eocene—recent volcanism and faulting in the southern mainEthiopian rift, J. geol. Soc. London, 150, 99–108.
Gorman, A.R., 2002. Ray-theoretical seismic traveltime inversion: modi-fications for a 2-D radially parameterized Earth, Geophys. J. Int., 151,511–516.
Hofmann, C., Courtillot, V., Feraud, G., Rochette, P., Yirgu, G., Ketefo, E. &Pik, R., 1997. Timing of the Ethiopian flood basalt event and implicationsfor plume birth and global change, Nature, 389, 838–841.
Holbrook, W.S. & Keleman, P.B., 1993. Large igneous province on the US At-lantic margin and implications for magmatism during continental breakup,Nature, 364, 433–436.
Keleman, P.B. & Holbrook, W.S., 1995. Origin of thick high-velocity igneouscrust along the U.S. East coast margin, J. geophys. Res., 100, 10077–10094.
Keranen, K., Klemperer, S.L., Gloaguen, R. & the EAGLE Working Group,2004. Imaging a proto-ridge axis in the Main Ethiopian Rift, Geology,32(11), 949–952, doi:10.1130/G20737.1.
Khan, M.A.K. et al., 1999. The lithospheric structure of the Kenya Rift asrevealed by wide-angle seismic measurements. in Continental Tectonics,Vol. 164, pp. 257–269, eds MacNiocaill, C. & Ryan, P.D., Geol. Soc. Spec.Pub., London, UK.
Korme, T., Acocella, V. & Abebe, B., 2004. The role of pre-existing struc-tures in the origin, propagation and architecture of the faults in the MainEthiopian Rift, Gondwana Research, 7(2), 467–479.
Maguire, P.K.H. et al., 2003. Geophysical project in Ethiopia studies conti-nental breakup, EOS, Trans. Am. geophys. Un., 84(35), 337, 342–343.
Maguire, P.K.H. et al., 2005. Crustal structure of the Northern MainEthiopian Rift from the EAGLE controlled source survey: a snapshotof incipient lithospheric break-up, in Structure and Evolution of the RiftSystems within the Afar Volcanic Province, Northeast Africa, eds Yirgu,G., Ebinger, C.J. & Maguire, P.K.H., Geol. Soc. Spec. Pub., London, UK,submitted
Mahatsente, R., Jenztsch, G. & Jahr, T., 1999. Crustal structure of the MainEthiopian Rift from gravity data: 3-D modelling, Tectonophysics, 313,363–382.
Makris, J. & Ginzberg, A., 1987. The Afar Depression: transition betweencontinental rifting and sea-floor spreading, Tectonophysics, 141(1–3),199–214.
Mechie, J., Fuchs, K. & Altherr, R., 1994. The relationship between seis-mic velocity, mineral composition and temperature and pressure in theupper mantle—with an application to the Kenya Rift and its eastern flank,Tectonophysics, 236(1–4), 453–464.
Pik, R., Marty, B., Carignan, J. & Lave, J., 2003. Stability of the Upper Niledrainage network (Ethiopia) deduced from (U-Th)/He thermochronom-etry: implications for uplift and erosion of the Afar plume dome, EarthPlanet. Sci. Lett., 215, 73–88.
Prodehl, C., Keller, G.R. & Khan, M.A., eds, 1994. Crustal and upper mantlestructure of the Kenya Rift, Tectonophysics, 236.
Schilling, J-G., Kingsley, R., Hanan, B. & McCully, B., 1992. Nd-Sr-Pdisotopic variations along the Gulf of Aden: evidence for Afar mantleplume-continental lithosphere interaction, J. geophys. Res., 97, 10927–10966.
Stuart, G.W. & the EAGLE Working Group, 2003. Understanding the tran-sition from continental to oceanic rifting in the northern Ethiopian Rift.Eos Trans. AGU , 84(46) Fall Meet. Suppl. S52G-05.
Trua, T., Deniel, C. & Mazzuoli, R., 1999. Crustal control in the genesis ofPlio-Quaternary bimodal magmatism of the Main Ethiopian Rift (MER):geochemical and isotopic (Sr, Nd, Pb) evidence, Chem. Geol., 155, 201–231.
Thybo, H., Maguire, P.K.H., Birt, C. & Perchuæ, E., 2001. Seismic reflec-tivity and magmatic underplating beneath the Kenya Rift, Geophys. Res.Lett., 27(17), 2745–2748.
Tiberi, C., Ebinger, C., Ballu, V., Stuart, G. & Oluma, B., 2005. Inversemodels of gravity data from the Red Sea—Gulf of Aden—Ethiopian triplejunction zone, Geophys. J. Int., in press.
Wessel, P. & Smith, W.H.F., 1995. New version of the Generic MappingTools released, EOS, Trans. Am. geophys. Un., 76, 329.
WoldeGabriel, G., Aronson, J.L. & Walter, R.C., 1990. Geology, geochronol-ogy, and rift basin development in the central sector of the Main EthiopianRift, Geol. Soc. Amer. Bull., 102, 439–458.
Wolfenden, E., 2003. Evolution of the southern Red Sea Rift: Birth of amagmatic margin, PhD thesis, Royal Holloway, University of London,UK.
Wolfenden, E., Ebinger, C., Yirgu, G., Deino, A. & Ayele, D., 2004. Evolu-tion of the Northern Main Ethiopian Rift: birth of a triple junction, Earthplanet. Sci. Lett., 224(1–2), 213–228.
Wolfenden, E., Ebinger, C., Yirgu, G., Renne, P.R. & Kelley, S.P., 2005.Evolution of a volcanic rifted margin: southern Red Sea, Ethiopia. GeolSoc. Amer Bull., 117(7), 846–864, doi:10.1130/B25516.1.
Zelt, C.A., 1999. Modelling strategies and model assessment for wide-angleseismic traveltime data, Geophys. J. Int., 139, 183–204.
Zelt, C.A. & Forsyth, D.A., 1994. Modeling of wide-angle seismic datafor crustal structure: Southeastern Grenville Province, J. geophys. Res.,99(B6), 11 687–11 704.
Zelt, C.A. & Smith, R.B., 1992. Seismic traveltime inversion for 2-D crustalvelocity structure, Geophys. J. Int., 108, 16–34.
C© 2005 RAS, GJI, 162, 994–1006