
Crustal density structure in the Spanish Central System ...eprints.ucm.es/17106/1/1-s2.pdf ·...
19
Crustal density structure in the Spanish Central System derived from gravity data analysis (Central Spain) D. G6mez-Ortiza, b , * , I , R. Tejero-L6pez b , l , R. Babin-Vich b , l , A. Rivas-Ponce b , 1 " ESCE A rea de Geologia. Universidad Rey Juan Carlos. CITulipan sin. Mostoles. 28933 Madrid. Spain b Depto. Geodinamica. Facultad de cc. Geoiogicas, Universidad Compiutense de Madrid. Cose Antonio Novais sin, 28040 Madrid, Spain Abstract Shallow and deep sources generate a gravity low in the central Iberian Peninsula. Long-wavelength shallow sources are two continental sedimenty basins, the Duero and the Tajo Basins, separated by a narrow mountainous chain called the Spanish Cenal System. To investigate the crustal density structure, a multitaper specal analysis of gravity data was applied. To minimise biases due to misleading shallow and deep anomaly sources of similar wavelength, first an estimation of gravity anomaly due to Cenozoic sedimentary infill was made. Power specal analysis indicates two crustal discontinuities at mean depths of 31.1 ± 3.6 and 11.6 ± 0.2 , respectively. Comparisons with seismic data reveal that the shallow density discontinuity is related to the upper crust lower limit and the deeper source corresponds to the Moho discontinuity. A 3D-depth model for the Moho was obtained by inverse modelling of regional gravity anomalies in the Fourier domain. The Moho depth varies between a mean depth of 31 and 34 . Maximum depth is located in a NW-SE trough. Gravity modelling points to lateral density variations in the upper crust. The Central System sucture is described as a crustal block upliſted by NE-SW reverse faults. The formation of the system involves displacement along an inacrustal detachment in the middle crust. This detachment would split into several high-angle reverse faults verging both NW and SE. The direction of transport is northwards, the detachment probably being rooted at the Moho. Keywo : Gravity anomaly; Density crust scture; Moho undulations; Spanish Cenal System * Coesponding author. ESCET- A rea de Geologfa, Universidad Rey Juan Carlos, CITulip sin, M6stoles, 28933 Madrid, Spain. Fax: +34 91 664 74 90. E-mail addresses:[email protected] (D. G6mez-Ortiz), [email protected] (R. Tejero-L6pez), [email protected] (R. Babin-Vich), [email protected] (A. Rivas-Ponce). 1 Fax: +34 91394 46 31. 1. Introduction Compressional field sess due to convergence of the Aican and European Plates deformed the Iberian Plate lithosphere, giving rise to intraplate mountain ranges and continental sedimentary basins (Fig. 1). One of these inaplate mountain ranges is the Central
Transcript of Crustal density structure in the Spanish Central System ...eprints.ucm.es/17106/1/1-s2.pdf ·...

Crustal density structure in the Spanish Central System derived from gravity data analysis (Central Spain)
D. G6mez-Ortiza,b,*,I, R. Tejero-L6pezb,l, R. Babin-Vichb,l, A. Rivas-Ponceb,1
"ESCET-Area de Geologia. Universidad Rey Juan Carlos. CITulipan sin. Mostoles. 28933 Madrid. Spain bDepto. Geodinamica. Facultad de cc. Geoiogicas, Universidad Compiutense de Madrid. C/Jose Antonio Novais sin, 28040 Madrid, Spain
Abstract
Shallow and deep sources generate a gravity low in the central Iberian Peninsula. Long-wavelength shallow sources
are two continental sedimentary basins, the Duero and the Tajo Basins, separated by a narrow mountainous chain called
the Spanish Central System. To investigate the crustal density structure, a multi taper spectral analysis of gravity data was
applied. To minimise biases due to misleading shallow and deep anomaly sources of similar wavelength, first an
estimation of gravity anomaly due to Cenozoic sedimentary infill was made. Power spectral analysis indicates two
crustal discontinuities at mean depths of 31.1 ± 3.6 and 11.6 ± 0.2 km, respectively. Comparisons with seismic data
reveal that the shallow density discontinuity is related to the upper crust lower limit and the deeper source corresponds
to the Moho discontinuity. A 3D-depth model for the Moho was obtained by inverse modelling of regional gravity
anomalies in the Fourier domain. The Moho depth varies between a mean depth of 31 km and 34 km. Maximum depth
is located in a NW-SE trough. Gravity modelling points to lateral density variations in the upper crust. The Central
System structure is described as a crustal block uplifted by NE-SW reverse faults. The formation of the system involves
displacement along an intracrustal detachment in the middle crust. This detachment would split into several high-angle
reverse faults verging both NW and SE. The direction of transport is northwards, the detachment probably being rooted
at the Moho.
Keywordl': Gravity anomaly; Density crust structure; Moho undulations; Spanish Central System
* Corresponding author. ESCET-Area de Geologfa, Universidad
Rey Juan Carlos, CITulipan sin, M6stoles, 28933 Madrid, Spain.
Fax: +34 91 664 74 90. E-mail addresses:[email protected] (D. G6mez-Ortiz),
[email protected] (R. Tejero-L6pez), [email protected]
(R. Babin-Vich), [email protected] (A. Rivas-Ponce).
1 Fax: +34 91394 46 31.
1. Introduction
Compressional field stress due to convergence of
the African and European Plates deformed the Iberian
Plate lithosphere, giving rise to intraplate mountain
ranges and continental sedimentary basins (Fig. 1).
One of these intraplate mountain ranges is the Central

D
D NEOGENE
� PALAEOGENE
�
D METAMORPHIC ROCKS
IIIIIllIII GRANITIC ROCKS
6° 5° 30' 5° 4° 30' 4°
A
B
B Duero basin Tajo basin
� /NW ����==��=//==�::��==��'=��:=�=r0 Central S stem
SE 0 6.0 km/s
Uppercrust E' 10 -----_/'" 2:- 6.4 km/s .c g- 20 0 6.8 km/s 30 30
Middle crust .c 20 g-o �--------�
Lowercrust
Mantle
Fig. I. (A) Main tectonic units of the Iberian Peninsula and geological map of the study area. SC: Spanish Central System; IR: Iberian Range;
DB: Duero basin; TB: Tajo Basin; PI: Pyrenees; IM: Iberian Massif; BE: Betics. Geographical coordinates. A-B represents the location of the
refraction seismic profile described in the text. (B) Refraction seismic profile (from Suriiiach and Vegas, 1988). The geometry of the three main
crustal layers, together with the P-wave velocities, is shown.
System, which is comprised of an uplifted crustal
block bounded by two reverse faults separating it
from the Tajo and the Duero basins. Basin depocen
tres occur close to the chain borders. Here, Cenozoic
infill can reach 3000 m (Aeroservice, 1967; Querol,
1989). Seismic data point to the existence of a thicker
crust under the central part of the Iberian Peninsula,
lowering the Moho from 30 km to 34 km under the
Central System (Surifiach and Vegas, 1988; ILIHA,
1993). The area is characterized by a long-wavelength
gravity low (Mezcua et aI., 1996) and gravity studies
have related it to the Cenozoic infill of basins and to a
crust thickening of up to 2 km (Tejero et aI., 1996;
G6mez Ortiz, 2001).
In this paper, multi taper spectral analysis of
gravity data is used to investigate crustal density
structure in the central part of the Iberian Peninsula. As pointed out by Chakraborty and Agarwal (1992), the filtering technique based on regionalresidual separation through the spectral analysis of gravity data is difficult when both shallow and deep anomaly sources have similar wavelengths. It can be argued that the combined effects of gravity anomalies due to sedimentary infilling of the Duero and Tajo basins could affect the amplitude of the anomaly associated with the gravity effect of suspected deep sources, such as the Moho. To avoid this, fIrst the gravity anomaly associated with the Cenozoic sedimentary basins was computed and then this effect was subtracted from the observed gravity map. Published isopach maps, rock sample density measurements and densitylogs provided a data set used tu calculate this gravity effect. This method let us accurately discriminate between residual and regional sources. The inversion of gmvity data has revealed a crustal thickening in the central part of the study zone. Besides the spectral analysis of gravity data, gravity modelling results show the density heterogeneities within the crust.
2. Geological setting
The present-day physiographic and tectonic configruation of the intraplate Iberian domain developed in the Cenozoic. Commencing in Permian times and continuing through the Mesozoic, subsidence and rifting occurred along a NW-SE trending trough, the Iberian Basin. NW-SE to WNW-ESE structures controlled Iberian Basin geometry during extensional deformation events associated with Mesozoic rifting in the NW margin of the basin. Collision of the European and Iberian Plates caused the tectonic inversion of the Iberian Basin, giving rise to the Iberian Range (Fig. lA). During the Neogene, collision of the south-eastern margin of the Iberian and African Plates triggered compressive deformations in the south and centre of the plate, building up the Central System ( centre) and Betic Cordillera (south) (e.g., Vegas et aI., 1990; De Vicente et aI., 1996a,b).
The exposed bedrock of the Central System (Fig. lA) is comprised of low and high grade metamorphic rocks and granitoids from the Variscan base-
ment. The Central System chain has been described as an uplifted crustal block (Vegas et aI., 1990; Capote et aI., 1990; De Vicente et aI., 1996a,b) bounded by two main reverse faults trending NESW. The range is characterized by E-W tu NE-SW alignments of "sierras" (uplifted blocks) and tupographic depressions (mainly small Cenozoic sedimentary basins). Mesozoic cover is mainly preserved in the easternmost part of the study area and the interior of some tectonic depressions. NESW folds, thrust and reverse faults deform the cover as well as the basement. To the east of the study area, outcrops the westernmost Iberian Range. It consists of a NW-SE intraplate mountain range arising from Mesozoic basin inversion. The Iberian Range bounds the eastern margins of the Duero and the Tajo Basins. PalaeogenelNeogene basin infill indicates that alpine deformation started in Eocene times, and was the main range building event in the Middle to Upper Miocene (De Vicente et aI., 1996b). The sedimentary basins are the Duero Basin tu the north and the Tajo Basin tu the south. Palaeogene sediments overlay a thin Mesozoic cover, which may even be absent in the west. Basin depocentres appear close to the chain borders. The eastern part of the Duero Basin consists of a small depression, infilled with up of 3500 m of Cenozoic sediments, denoted the Almazan Basin. Magnetic and seismic reflection profIles indicate Cenozoic sedimentary thicknesses of up to 3 km (Querol, 1989; Aeroservice, 1967; Bond, 1996; Maestro, 1999; Rey Moral, 2001).
Refraction seismic studies in the central Iberian Peninsula show that the crust is comprised of three layers (e.g., Banda et aI., 1981; Suriiiach and Vegas, 1988; lLlllA, 1993): a 11 to 14 km thick upper crust, a 10 to 14 km thick middle crust and a 9 km thick lower crust (Fig. lE). Mean crustal thickness is 31 km although a seismic model transverse to the Central System reveals that the crust thickens tu attain a thickness of 34 km (Surifiach and Vegas, 1988, Fig. lE). Tectonic interpretations of Central System formation have considered two models: crustal thrusting (Warburton and Alvarez, 1989; Ribeiro et aI., 1990; Tejero et aI., 1996) or a distributed deformation accompanied by homogeneous crustal thickening of the lower crust (Vegas et aI., 1990).
3. Bouguer anomaly map of the central Iberian
Peninsula
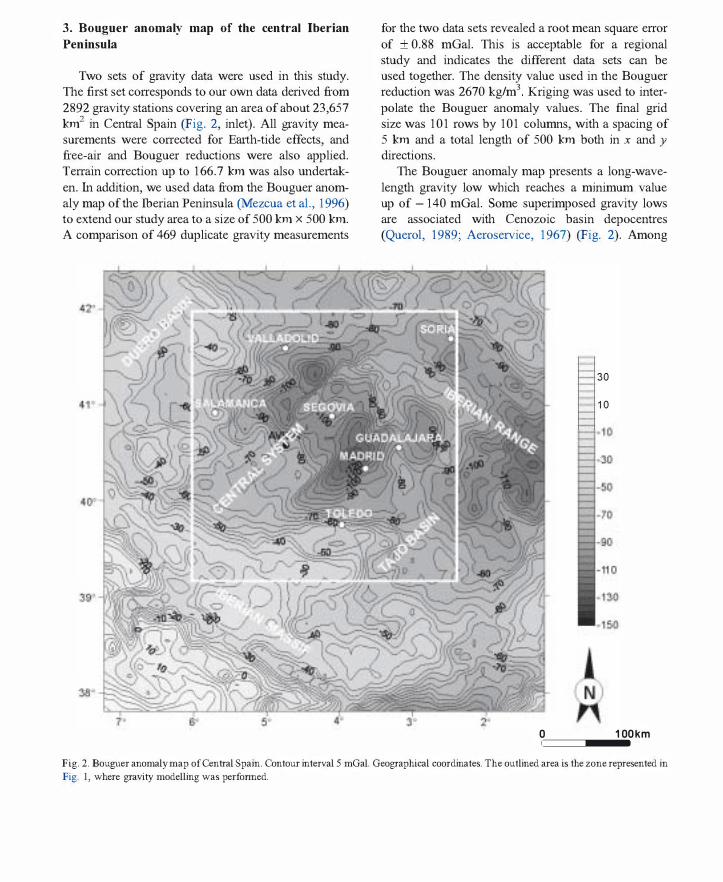
Two sets of gravity data were used in this study. The first set corresponds to our o\Vll data derived from 2892 gravity stations covering an area of about 23,657 km2 in Central Spain (Fig. 2, inlet). All gravity measurements were corrected for Earth-tide effects, and free-air and Bouguer reductions were also applied. Terrain correction up to 166.7 km was also Wldertaken. In addition, we used data from the Bouguer anomaly map of the Iberian Peninsula (Mezcua et aI., 1996) to extend our study area to a size of 500 km x 500 km. A comparison of 469 duplicate gravity measurements
for the two data sets revealed a root mean square error of ± 0.88 mGal. This is acceptable for a regional study and indicates the different data sets can be used together. The density value used in the Bouguer reduction was 2670 kg/m3 Kriging was used to interpolate the Bouguer anomaly values. The final grid size was 101 rows by 101 columns, with a spacing of 5 km and a total length of 500 km both in x and y directions.
The Bouguer anomaly map presents a long-wavelength gravity low which reaches a minimum value up of - 140 mGal. Some superimposed gravity lows are associated with Cenozoic basin depocentres (Querol, 1989; Aeroservice, 1967) (Fig. 2). Among
30
10
0,===-_.10iiokm
Fig. 2. Bouguer anomaly map of Central Spain. Contour interval 5 mGal. Geographical coordinates. The outlined area is the zone represented in
Fig. 1, where gravity modelling was perfonned.

the most striking features of the map are the strong NE-SW gradients that bound the relative gravity lows related to basin depocentres. These are associated with the reverse faults that bound the Central System and basins. Between the two gravity gradients, a relative gravity high representing the Central System is observed. Three distinctive areas can be defined in this gravity high. The easternmost part is characterized by N-S and E-W trending gravity highs associated with outcrops of low-grade metamorphic rocks. The boundary between this area and the central zone corresponds to a strong gravity gradient of N-S orientation. More negative values characterize this area, where granite bodies and high-grade metamorphic rocks outcrop. To the west, a new gravity gradient trending NW-SE corresponds to the transition to the westemmost area, where the gravity values became less negative,
1500 m
1000 m
reaching about - 80 mGal. This zone is associated with large granite bodies, which represent the main lithology of the westermnost part of the Central System.
A spectral analysis was conducted to evaluate regional and residual gravity sources. Bearing in mind that sedimentary basin infilling can generate a long wavelength Bouguer anomaly, we first estimated the Bouguer anomaly associated with this sedimentary infilling and then removed this effect from the observed Bouguer gravity map.
4. Gravity effect due to Cenozoic basin
sedimentary infilling
Several two-dimensional and three-dimensional methods have been proposed to estimate the gravity
CAMEROS RANGE
Fig. 3. Isopach map for the bottom of the Tertiary obtained for the Duero and Almazan, and Tajo Cenozoic basins. Contour interval 250 m.
Geographical coordinates.

anomaly associated with the sedimentary infilling of basins (Bott, 1960; Cordell, 1973; Granser, 1987; Chai and Hinze, 1988; Martin-Atienza and GarciaAbdeslem, 1999, among others). Here, the GRAV3DBASE forward modelling technique (Chakravarthi et aI., 2002) was used to compute the gravity anomaly associated with the Cenozoic basins of the study area. Density--<lepth variation was calculated by the parabolic fimction (Chakravarthi and Rao, 1993):
il (z) _ ilP6 P - ( ' )2 "'Po - IJ.Z
(1)
where I1p is the density contmst, z is the depth, I1po is the density contrast at the surface and a is a constant expressed in kg/m3/km that can be determined by fitting Eq. (I) to known density contrastdepth data for sedimentary rocks. The gravity anomaly is calculated for a 3D prism at each node of the isopach map of the basin, and then the gravity anomaly at any point is determined by adding the individual effect of each prism.
4.1. Application to the Duero and Taja Basins
Two types of information are needed to determine the gravity anomaly associated with a sedimentary basin: (I) an isopach map and (2) the variation of the density contrast basement-sediments at depth.
We compiled published isopach maps of the Duero and Tajo basins (Blanco and Merten, 1974; Querol, 1989; Mufioz Martin, 1997; Maestro, 1999; Rey Moral, 2001). Fig. 3 shows the isopach maps representing the thickness of the Cenozoic sedimentary Duero and Tajo basins, and the positions of the three wells used to compute the density-depth variation curve. Fig. 4 shows the lithologies and densitylogs for each well. As can be seen in Fig. 3, sedimentary thickness increases from west to east in the Duero basin, with depocentres bordering the Cantabrian MOWltains, Cameros Range and the northern limit of the Central System, where maximum thicknesses of 3000 m are reached (Aeroservice, 1967; Blanco and Merten, 1974; IGME, 1987; lTGE, 1990). The Almazan basin, which is connected to the Duero basin
OLMOS EL GREDAL-1 LA SECA (DUERO BASIN) (DUERO BASIN) (ALMAZAN BASIN)
"" 'cc
z 0 400
4CC � 000
'cc 'cc
'cc 000
,cc
:[ ''0
:[ 900
't 't <000
'00 ID ID 0 0 1100
900 1200
1000 1300
1400
«00 1500
1200 '500
1.00 2.00 2.40 2.BO
Density (g/cm3)
m w § ifi {l Cl " @ � z
2.00 3.00
Density (g/cm3)
0
200
400
600
:[ 800
.c g. 1000 0
1200
1400
1600
1800
; .� i � .:l!
] � " w >-
1.50 2.00 2.50 3.00 Density (g/cm3)
Fig. 4. Density-logs and lithological lUlits obtained from the three wells available in the study area. The density-depth parabolic fimction is also
indicated for each case.

via its westemmost edge, attains a sedimentary thickness of up to 4000 m (ITGE, 1990; Bond, 1996; Maestro, 1999; Rey Moral, 2001) including Upper Cretaceous, Palaeogene and Neogene sediments. On the other hand, the Tajo basin (Fig. 3) shows a sedimentary thickness increasing from south to north, with its depocentre located at the southern border of the Centml System, where thicknesses peak at 3500 m (Querol, 1989).
The density contmst between basement and sediments was estimated from density-log data from wells in the Duero Basin (ITGE, 1990; SHELL, 1983). No density-logs are available for the Tajo basin. Fig. 4 shows the lithological Wlits represented in the wells (La Seca, Olmos and El Gredal-I). The parabolic fit that best describes the density-depth curve obtained
o
-10
-15
•
5-
from the density-log data gives values of Jlpo�-600 kg/m3 and a� 155 kg/m3/km for the La Seca well, and Jlpo�-980 kg/m3 and a�615 kg/m3/km for the Ohnos well and of Jlpo�-360 kg/m3 and a�154 kg/m3/km for the El Gredal-I well. For gravity anomaly estimates, we adopted mean values of Jlpo� -600 kg/m3 and a�155 kg/m3/km to determine the gravity effect of the Duero and Ahnazan basins. Given that, as mentioned above, there is no density-log for the Tajo basin yet this basin has a similar sedimentary record, we also used these values for the Tajo basin.
Fig. 5 provides the gravity anomaly computed for each basin using the density-depth values estimated and the GRAV3DBASE forward modelling technique. The Duero basin shows a maximum gravity anomaly of - 32 mGal, the Almazan basin one of - 34 mGal
o 100 km
Fig. 5. Theoretical gravity map due to the sedimentary infill obtained for the Duero and Almazan, and Tajo Cenozoic basins. Contour intervalS
mGal. Geographical coordinates.

and the Tajo basin - 28 mGal. These maps were then subtracted from the observed Bouguer anomaly map to obtain a residual gravity map (Fig. 6), reflecting only the crustal structure of Central Spain. The new map obtained has values ranging from + 20 mGal to - 115 mGal, with a relative gravity low in the centre of the study area (Central System) and relative gravity highs close to the northern and south-western edges. The two strong gravity gradients that previously defmed the limits of the Central System with the sedimentary basins are now only discrete, and the relative gravity highs and lows of small wavelength appearing in this map are now assumed to reflect the heterogeneous nature of the basement in this area.
5. Estimating mean depths of main crustal density
discontinuities
Several spectral techniques can be used to estimate the power spectrum of a gravity anomaly. Herein, we used the multitaper method that provides an optimal spectrum estimate by minimising spectral leakage, while reducing the variance of the estimate by averaging orthogonal eigenspectrum estimates (Lees and Park, 1995). In order to do this, ideal data windows have to be obtained and these are given by prolate spheroidal sequences (Slepian, 1978). Due to the twodimensional character of the data set analysed, radial averaging of the power spectrum was performed to
10
0,===-_.1.00 km
Fig. 6. Bouguer anomaly map of Central Spain obtained by subtracting the theoretical anomaly maps in Fi.g. 5 from the observed anomaly map
in Fig. 2. Contour interval 5 mGal. Geographical coordinates. The outlined area is the same as in Fig. 2.

obtain a one-dimensional representation. The process involves averaging of the power spectrum values by means of concentric circles of different radius, expressed as frequency values, sharing a common origin (Mishra and Naidu, 1974; Dirnitriadis et aI., 1987; Tselentis et aI., 1988).
Fig. 7 is a graph of the natural logarithm of the gravity power spectrum versus the frequency for the stody area (Fig. 6) after subtracting the gravity effect of the sedimentary basins. Three frequency domains are defined in this figure. The first one, domain A, corresponds to a frequency of up to 0.03 km-1 and the mean depth of the source, as determined from the slope of the linear segment fitted to the data is 31.1 ± 3.6 km. The second one, domain B, corresponds to a frequency ranging from 0.03 to 0.09 km-I, and the mean depth of the causal source is 11.6 ± 0.2 km. The third domain comprises the final part of the power spectrum and is considered white noise. From seismic studies, we can link the
8
4 • c •
deeper level to Moho discontinuity and the shallower level to the base of the upper crust (Band. et aI., 1981; Surii'iach and Vegas, 1988; ILllIA, 1993).
In Fig. 7, we have also represented the natural logarithm of the observed gravity power spectrum for comparison. It can be seen that, whereas the linear segments fitted to the white noise and residual source are nearly identical to the ones from the Bouguer anomaly without the gravity effect of the basins, the regional source is poorly determined if the gravity effect of the basins is not subtracted. The power spectrum of the regional source shows an oscillating behaviour that defmes a linear segment with a lower slope (a lower mean depth) and a poor correlation. 'When the gravity effect of the basins is subtracted, the regional source shows a better marked linear rate of decay, so the mean depth of the regional source is better defmed that in the other case.
E " t; 0 Q) c.
• ·0 ;e9;onal source (Domain A)
Residual source (Domain B) White noise
!
'"
� c. -4 " ..J
-8
-1 2 ....... --r---.r--"""T"-"T'""-r--r-""T'"-r---.-..., o 0.02 0.04 0.06 0.08 0.1
Frequency (km-')
Fig. 7. Graph representing the natural logarithm of the radial gravity power spectnun versus the frequency for the Bouguer anomaly map
without the gravity effect of the sedimentary basins (black circles). Three domains have been recognised, a regional source (A), a residual source
(B) and a white noise. The radial gravity power spectrum for the observed Bouguer anomaly has been represented for comparison (open
squares).

6. Regional and residual gravity maps
Having established the main sources contributing to the gravity anomalies of the study area and their mean depths, we now need to defme a filter to isolate the anomalies associated with each source. There are several examples of the application of filtering procedures in the literature (Syberg, 1972; Spector and Grant, 1970; Gupta and Ramani, 1980; Lefort and Agarwal, 2002, among others). In this work, a cosine roll-off type filter was used. This is a spectral domain pass filter that retains long-wavelength components of observed data using taper with a smooth cosine curve in roll-off range. High and low frequency (short- and long-wavelength) cut-offs for the roll-off range and a degree for the cosine function need to be specified: the higher the degree, the steeper the transition between passed and rejected portions of the data spectrom. Unlike conventional pass filters, the cosine roll-off filter has strongly reduced null ringing effects. Based on the analysis of the radial power spectrum, the frequency cut-offs adopted here for the roll-off range were 0.02 km-I and 0.03 km- \ and the degree of the cosine function was set at 2, which is a suitable value for reducing ringing effects.
Fig. 8A and B, respectively provide the regional and residual gravity maps obtained by applying this filter to the Fourier transform of the demeaned and detrended observed gravity map, after conversion to the spatial domain taking the inverse Pourier transform. The gravity map for the regional source (Fig. 8A) shows an anomaly of + 20 to -80 mGal, characterized by a WNW-ESE relative gravity low.
The residual gravity map (Fig. 8B) is the result of subtracting the regional gravity map from the observed Bouguer anomaly map. The gravity anomaly ranges from + 15 to -40 mGal. The distribution of anomalies is similar to the observed Bouguer anomaly map, and their main features are the strong gradients associated with the main boundary faults that limit the Central System both to the north and south. Maximum gravity lows are related to the three Cenozoic basins in the study area: the Duero, Almazan and Tajo basins. Several minor gmvity highs and lows of predominant NW-SE orientation also appear. Most of these show good correlation with local geological features such as granite bodies, metamorphic outcrops and main faults.
7. 3D Moho depth model
Once the regional anomaly (Fig. 8A) has been isolated, it is inverted to obtain the geometry of the density interface causing the anomaly. The inversion method used here is that proposed by Oldenburg (1974), in which the topography of a density interface generating a certain gravity anomaly is estimated using the equation described by Parker (1973). To do this, we need to know both the mean depth of the interface and the density contrast between the bodies separated by this interface. According to Parker (1973), the Fourier tmnsform of the gravity anomaly and the sum of Fourier transforms of the topography causing such a gravity anomaly are related. Using this relationship, Oldenburg (1974) proposed an iterative method in which the topography related to the gravity anomaly is estimated for the fIrst term of the Pourier series, and the resulting topography is then used to calculate the gravity anomaly for the next term. The iterative process fmishes after a certain number of itemtions have been completed or when the difference between two successive approximations of the topography is lower than a previously established error level. The process is convergent if the depth to the interface is greater than 0 (i.e., it does not intercept the topography) and the amplitude of the interface relief is lower than the mean depth of the interface.
As the inversion operation is Wlstable at high frequencies, a high-cut filter is needed to ensure convergence. The fIlter used was that proposed by Oldenburg (1974): a Hamming window with a value of I for low frequencies (WH), 0 for high frequencies (SH) and
[ ( k-2nWH )] 1/2 I + cos
2(SH _ WH) (2)
for intermediate frequencies, k being the wavenumber (i.e., 2nlwavelength). After the process is completed, it is desimble to compute the gravity anomaly produced by the calculated topogmphy. This anomaly should be very similar to the one used as the input in the fIrst step of the inversion procedure. Oldenburg (1974) remarks that this method can be extended to the three-dimensional case when the gravity anomaly is measured over a plane. This is not the case in the study area, where the gravity stations are not located

20
o
-20
-40
-60
-80
0i'::::===-_oi1 .. OO km
Fig. 8. CA) Regional gravity map obtained by applying a cosine roll-off filter defmed from the data derived from the spectral analysis to the
Bouguer anomaly map in Fig. 5. (B) Residual gravity map obtained by subtracting the regional gravity map obtained from the observed gravity
map in Fig. 5. Both maps: contour interval 5 mGal. Geographical coordinates.

at a constant elevation and this can pose some additional indetermination in the Moho topography computation. However, the differences may be only of a few mGal and we infer that this cannot invalidate the results.
The results obtained in our spectral analysis enabled us to use the previously established value of 31.1 km as the mean reference depth. Crust layer densities were estimated using the P-wave velocity-density empirical relationship applying the Christensen and Mooney (1995) algorithm. Table 1 provides the published crust layer velocities used and estimated densities for the layers. Fig. 9 shows the Moho topography of the area examined. We used a density contrast between crust and mantle of 400 kg/m3 The residual error between the observed regional gravity map and the theoretical value computed from the Moho topography was ± 10 mGal.
The Moho topography shows a NW-SE depression at the point where a depth of up to 34 km is reached. The 31 km contour level encloses this depression, describing a trough that runs in a NESW direction roughly parallel to the Central System. Crust thickening is not homogeneous Wlder the chain and is greatest in the central part associated with the NW-SE depression. The estimated Moho geometry is in good agreement with refraction seismic data, which indicate a Moho deepening under the Central System (IUHA, 1993). A WNW-ESE refraction seismic model applied across the western-central region of the chain (Salamanca-Toledo, Fig. 9) reveals a Moho at a depth of 34 km, 1 km deeper than our results for the same area (Surifiach and Vegas, 1988).
To investigate the density structure of the crust, three gravity profiles were modelled.
Table 1
Density values for the different crustallUlits defmed by the seismic
models according to the relationship between P-wave velocity and density (Christensen and Mooney, 1995)
P-wave velocity (m/s) Density (kg/m3)
2000--4500 2000-2490 Sedimentary cover
5500-6000 6000-6800
6800-7100
8200
2650-2710 2710-2860
2860-2960
3300
Basement Middle crust
Lower crust
Mantle
8. Gravity modelling
Two density models transverse to the Central System and a further model running parallel to this chain were constructed (Fig. lOA). Refraction seismic data were used as the starting point to constrain the deep structure. Thus, according to the seismic data the crust consists of three layers: ( l ) an upper 11 km thick crust, (2) a middle 11 km thick crust and (3) a lower 9 km thick crust (Fig. lB, see Section 2). Isopach maps of the sedimentary basins derived from reflection seismic profiling were used to establish the geometry of the basins in the density models (see Section 4.1). In addition, geological mapping boundaries mapped at the surface and structural data were used to constrain upper crust density structure. From these constraints, initial models were developed. The modelling process was undertaken in 2D using the software GM-SYS 4.7 for Windows (2001).
As density constitutes a fundamental parameter in gravity modelling, measurements of density were derived from both field samples and well data. The field samples collected were 101 rock specimens with the most representative lithologies of the study area, including Variscan basement metamorphic and igneous rocks and Mesozoic and Cenozoic sedimentary rocks (Fig. 10). Neogene sediment density was mainly estimated from density-log data obtained from wells (see Section 4.1) and crustal layers densities from the Pwave velocity-density relationship (see Table I ).
Table 2 summarises the density bodies of models and corresponding crustal blocks.
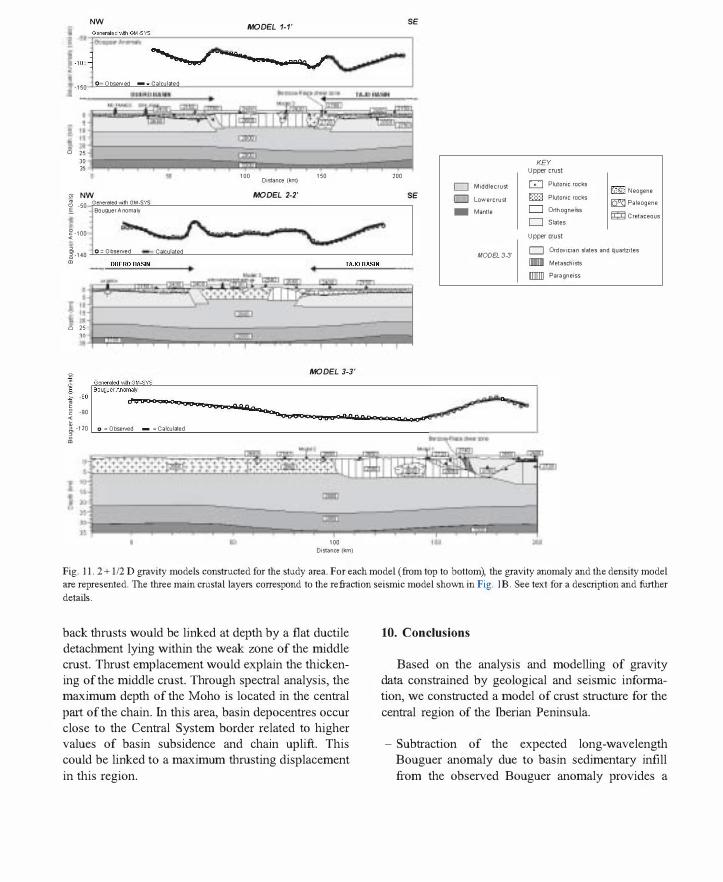
Gravity anomalies of the transverse models, models I and 2 (Fig. 11), ranged from - 70 to - 115 mGal. The Bouguer anomaly pattern shows a central gravity high bounded by NW and SE gravity lows. Initial models showed reasonable fitting of the gravity data based on the densities outlined in Table 2. Combined basin infilling and crust thickening gravity effects fit the gravity lows. Middle crust thickening is required to fit the gravity high. The base of the middle crust deepens according to lower crust geometry, and the base of the upper crust rises up to 4 km. Crust structure is a block elevated at the faults of the NW and SE borders of the Central System. Modelling suggests fault dips close to 50". Most of the shorter wavelength anomalies coincide with outcropping structures. Measured densities and geological map-

420
400
REGIONAL SOURCE D EPTH
��)) 'fr " �
� �\
60 50 40 30 THEORETICAL GRAVITY ANOMALY
DUE TO THE COMPUTED TOPOGRAPHY
0
F¥lRAMETRES 0
Density contrast:
'!>' 400kg/m3 Convergence
criteriu m: r oot-mean square error < ± 0 2 K m C o n v e r g e
c r i t e r i u m r ea ched a t iteration: 3 Root-m ea n square error at i t er a t i on 3: ±O.012Km
60 50 40 30 DIFF ERENCE BETWEEN THE
THEORETICAL GRAVITY ANOMALY DUE TO THE TOPOGRAPHY AND THE
REGIONAL ANOMALY
Fig. 9. Moho depth map of Central Spain obtained by applying the inversion method of Oldenburg (1974) to the regional gravity map in Fig. SA. Contour interval 1 km. Geographical coordinates. The lower figure shows the computed anomaly due to the Moho topography obtained,
and the difference between this map and the regional gravity map used in the inversion procedure.
ping constrained density body geometries that were progressively refined to fit the anomalies. To achieve good anomaly fit in model 2, a new body of density 2720 kg/m3 had to be introduced under the northern
border of the Tajo Basin (km 140 to 160). Both models show a heterogeneous upper crust. Anomaly fitting requires the existence of bodies of different densities corresponding to the Variscan basement.

A B VALLADDLlD
• • OLMOS
/ / TOLEDO
25 50 km
D METAMORPHIC BASEMENT
Adamellites
r:L EH 2600 2620 2640 2660 >2660
Density (kg/m3l
Quartzites
I��---,--� Le
2660 2680 2700 >2700 Density (kg/m3l
Dolomites '"
l � + �
�ol r==l � LL. 24802520 2560 2600 2640 2680 2720>2720
Density (kg/m3l
Schists
I�r-J c=r=J�,-,-� 265026802710274027702800>2800
Density (kg/m3l
Leucogranites
L-il= 2600 2620 2640 2660 2680
Density (kg/m3l
Leucogneiss
1�6 D�,----,-� 2620 2640 2660 2680 2700 >2700
Density (kg/m3l
Gneiss
m cfbCh J LL 2620 2650 2680 271027402770 2800 >2800 Density (kg/m3l
Slates
I!t G-rn d LL 2670 2700 2730 2760 27902820 >2820 Density (kg/m3l
Fig. 10. Sketch showing the location of the field rock samples used to determine rock densities (black circles) and the three wells with density
logs (black squares). Also shown is the location of the gravity models described in the text.
Beneath sedimentary basins, the basement comprises
bodies of density 2780 kg/m3. According to geolog
ical data, these correspond to sequences of low-grade
metamorphic rocks, mainly slates and quartzites. In
the Central System less dense materials predominate,
corresponding to outcrops of high grade metamorphic
rocks and granite.
The most interesting feature of model 3 (Fig. 11)
is the clear density heterogeneity in the upper crust.
The observed gravity anomaly shows a very simple
geometry, corresponding to a gravity low of long
wavelength, starting at values of - 80 mGal and
reaching up to - 95 mGal at the centre of the profile.
Although crust thickening and the resulting Moho
deepening fitted the regional anomaly trend, to
achieve good fit, we considered lateral density var
iation within the upper crust. A density body some 6
km thick of density 2660 kg/m3 characterizes the
western upper crust. In the central part, a body of
density 2680 kg/m3 and thickness 9 km is required
to fit the anomaly. In the eastern area, a maximum
depth of 11 km is reached and the body has a
density of 2720 kg/m3.
These findings indicate three domains with differ
ent predominant lithologies comprising the upper
most part of the crust, and different bodies
corresponding to granite intrusions of density values
2620 kg/m3 and 2650 kg/m3 distributed over the
area. The easternmost end of the model shows a
more complex geometry, with several bodies increas
ing in density towards the east limited by shear
zones. A Variscan normal detachment fault called
the Berzosa-Riaza shear zone places low-grade meta
morphic rocks (higher density rocks) over high-grade

Table 2
Mean density values used in the gravity modelling
Unit
Mesozoic Cover Neogene (lutites and sandstones) 2150
Palaeogene (gypSlUll, sandstones, 2400
lutites, conglomerates) Cretaceous (62.5% dolomites, 2650
37.5% sandstones)
Jurassic (limestones) 2710 Triassic
Variscan Basement Leucogranites
2650
2620
2660
2720 2680
2780
2680 2740
2800
2900 3300
Middle crust
Lower crust Mantle
Adamellites
Leucogneisses Gneiss
Slates
Quartzites Schists
gneissic complexes (lower density rocks) (e.g., Escuder Vimete et aI., 1998).
9. Discussion
Gravity data analysis and gravity modelling were used to construct a crustal density model of the central Iberian Peninsula. Crustal thickening in the area includes an increased middle crust thickness under the Central System reaching the Moho at a depth below 34 km. These fmdings are consistent with the seismic model of the crust, although the depth of the Moho established by spectral analysis is slightly lower. This discrepancy could be due to discrete lateral variation in the density contrast at the lower crust-mantle boundary, as has been pointed out by other authors for similar areas (e.g., Lefort and Agarwal, 2002).
Lateral density variations along the length of the Central System characterize the upper crust, in which three density domains are distinguished by the density models. From east to west, density and the thickness of the upper crust decrease (Fig. 11, model 3). 1n the eastern region, the Variscan basement is represented by two bodies of densities 2780 kg/m3 and 2680 kg/ m3 bounded by a regional structure, the N-S trending Berzosa-Riaza shear zone, which corresponds to an
east-dipping shear zone active in Variscan and LateVariscan deformation events (e.g., Escuder Viruete et aI., 1998). To the west, the basement is comprised of a body of density 2660 kg/m3 corresponding at the surface to the granite outcrops that dominate the area. At first sight, the limit between this body and that of density 2680 kg/m3 does not appear to coincide with a main mapped structure such as the Berzosa shear zone, but in the area, mylonites associated with deep ductile Variscan thrusts outcrop (Macaya et aI., 1991). The Variscan basement of the central and western part of the Central System are dominated by high to medium metamorphic grade rocks while in the eastern zone underlying adjacent sedimentary basins, rocks of low metamorphic grade and higher densities predominate. Density variations appear to be an inherited feature of Variscan and Late-Variscan tectonic events.
As observed in the transverse density models, the Central System comprises an upper crust upliftedblock bounded by reverse faults. The upper crust uplifts to 4 km. This value matches the vertical displacement estimated taking into account the topographic elevation (-maximum 2.6 km) and the depth at the top of the Variscan basement beneath the basins (-maximum 2.5 km below sea level). The Central System structure is the result of compressive deformation events during the Alpine orogeny. Several explanations for crust thickening have been proposed. Some suggest that the Central System arose from block rotation and distributed deformation accompanied by ductile thickening in the middle and lower crust (Vegas et aI., 1990). Other explanations have been based on a thrust tectonic model (Warburton and Alvarez, 1989; Ribeiro et aI., 1990; Tejero et al., 1996). Auy explanation for Central System formation must account for NE-SW compressive structures and crust thickening. We propose a NW-directed crustal thrust that could be rooted at the Moho (Fig. 12). This thrust would split into several high-angle reverse faults verging both NW and SE. The north border fault is the expression of this thrust at the surface. The south border fault represents a backthrust. Thrust ramp and flat geometry will depend on the crust's mechanical structure. Present rheological stmtification shows that ductile behaviour prevails at depths greater than 18 km (Tejero and Ruiz, 2002). Assuming a similar rheological structure, frontal and
NW MODEL 1-1'
SE Genented w:h GM-SYS
"1"°000""'=' -- �.
I -100 ----...."",;' -... -....... 09"' ..... '"
-150 0- Obseflled - - Calcul<ied
dl o " ;C ,
g NW
-'-':m";"'�:-, m '""
Distance (kcrv '" ;CC
MODEL 2-2' SE
i-50
Gene<otod wth G�_SYS
Bou(1JerAmma�
1 �-100
l1(O 0= Observed Ca�ulated
DUERO BASIN TAJOBASIN • •
: : .� �.'.';'�'� � ,; I € .:
i i ;: o ::
g MODEL 3-3'
Cl Middlecrust
D Lowercrust
_ Mantle
MODEL 3-3'
KEY Upper crust GJ Plutonic rocks
IT;;J Plutonic rocks
D Orthogneiss
O Slo!"s
Upper crus!
[';[J Neogene
5':] Paleogene
� Cretaceous
D Drd()\lician siates andquartlites
IIIII Metaschists
mm Para gneiss
� -60 1�:;���OCd"'�';�" _______ "" __ ", ____ """",,,, ___ _ � de
cSC � pO � g -90
Ob poop � 1-120 0 = Observed _ = Calcul<ied
'"0 Distance (km)
Fig. 11. 2 + 112 D gravity models constructed for the study area. For each model (from top to bottom), the gravity anomaly and the density model are represented. The three main crustal layers correspond to the refraction seismic model shown in Fig. lB. See text for a description and further
details.
back thrusts would be linked at depth by a flat ductile detachment lying within the weak zone of the middle crust. Thrust emplacement would explain the thickening of the middle crust. Through spectral analysis, the maximum depth of the Moho is located in the central part of the chain. In this area, basin depocentres occur close to the Central System border related to higher values of basin subsidence and chain uplift. This could be linked to a maximum thrusting displacement in this region.
10. Conclusions
Based on the analysis and modelling of gravity data constrained by geological and seismic information, we constructed a model of crust structure for the central region of the Iberian Peninsula.
- Subtraction of the expected long-wavelength Bouguer anomaly due to basin sedimentary infill from the observed Bouguer anomaly provides a

2° A
Duero Basin
D Quaternary-Tertiary
D Mesozoic cover
D Variscan Basement
D Granitoids (Variscan)
� Thrusts
---- Faults
B
NW Duero Basin Central System Tajo Basin SE
;:j • '" ? E
� .r: 0. Q)
0 30
50 (km)
_ Mantle c:=J Lower Crust
c:=J Middle Crust
c:=J Upper Crust
c:=J Cover
Fig. 12 . Diagram showing the proposed structure of the Spanish Central System.
Bouguer anomaly data set caused by the struc
tures below the basins, mainly deep-seated
sources.
- Subsequent energy spectrum analysis of this data
set reveals the existence of two distinct linear seg
ments. The slope of the shallowest depth segment
(11 ± 0.2 km) corresponds to the mean depth of the
upper crust base and the depth given by the stee
pest slope (31.1 ± 3.6 km) corresponds to the mean
Moho depth.
- A NE-SW depression characterizes Moho topog
raphy. The Moho deepens to up to 34 km under the
Central System.
- A gravity model parallel to the Central System and
transverse to the Variscan structure indicates sev
eral density domains that represent different tec
tonic domains bounded by a Variscan ductile
crustal shear zone.
- Gravity models transverse to the chain suggest its
structure consists of an 80 km wide crustal block
uplifted by reverse NE-SW to E-W faults. The
middle crust appears thickened in the Central
System.
- Crust structure is the result of Variscan and Alpine
deformations. Variscan structures limit different
density bodies within the basement. The overall
structure of the Central System is Alpine. It con
sists of an uplifted crustal block. Displacement
occurs along a NW-directed middle crust thrust,
probably rooted at the Moho.
The Bouguer gravity field of the central Iberian
Peninsula reflects the combined effects of an inherited
Variscan structure and Mesozoic tectonic events.
While crustal thickening is related to an Alpine
chain formation-the Central System-lateral density

variations seem to be associated to Variscan basement structure.
Acknowledgements
This research was supported by the Project BTE-2003-03902 (Ministerio de Educaci6n y Ciencia, Spain). We wish to thank Dr. Garcia-Abdeslem, an anonymous reviewer and the Editor for their constructive comments on the manuscript. We also thank Ana Burton for linguistic assistance.
References
Aeroservice Ltd., 1967. Mapa geol6gico de la Cuenca del Duero.
Escala 1 :250.000. Inst. de Colonizaci6n e Inst. Geol6gico y Minero de Espafia. Madrid.
Banda, E., Suriiiach, E., Aparicio, A., Sierra, 1., Ruiz de la Parte,
E., 1981. Crust and upper mantle structure of the central Iberian Meseta (Spain). Geophys. 1. R. Astron. Soc. 67,
779- 789.
Blanco, 1., Merten, R., 1974. Mapa de isobatas para el techo del Paleozoico y base del Terciario en la Cuenca del Duero.
Hispanoil.
Bond, 1 . , 1996. Tectono-sedimentary evolution of the Almazan Basin, NE Spain. In: Friend, F., Dabrio, C.l. (Eds.) , Tertiar y
Basins of Spain: The Stratigraphic Record of Crustal Kinemat
ics. Cambridge University Press, Cambridge, Great Britain, pp. 203- 213.
Bott, M.H.P., 1960. The use of rapid digital computing methods for
direct gravity interpretation of sedimentary basins. Geophys. 1. R. Astron. Soc. 3 (1), 63- 67.
Capote, R., De Vicente, G., Gonz:ilez Casado, 1.M., 1990. Evolu
ci6n de las defonnaciones alpinas en el Sistema Central. Geo
gaceta 7, 20- 22. Chai, Y., Hinze, W.J., 1988. Gravity inversion ofan interface above
which the density contrast varies exponentially with depth.
Geophysics 53 (6), 837-845. Chakraborty, K., Agarwal, B.N.P., 1992. Mapping of crustal dis
continuities by wavelength filtering of the gravity field. Geo
phys. Prospect. 41, 801- 822. Chakravarthi, V , Rao, Cv., 1993. Parabolic density fimction in
sedimentar y basin modeling. Proceedings of the Eighteenth
Annual Convention and Seminar on Exploration Geophysics, laipur, India. p. A.16.
Chakravarthi, V, Raghuram, H.M., Singh, S.B., 2002. 3-D fOl"\Vard
gravity modeling of basement interfaces above which the density contrast varies continuously with depth. Comput. Geosci.
28, 53 - 57.
Christensen, N.I., Mooney, W.D., 1995. Seismic velocity structure and composition of the continental crust: a global view.
1. Geophys. Res. 100 (B7), 9761- 9788.
Cordell, L., 1973. Gravity analysis using an exponential density
depth fimction-San lacinto Graben, California. Geophysics 38 (4), 684- 690.
De Vicente, G., Gonz:ilez Casado, 1.M., Muiioz, A., Giner, 1. ,
Rodriguez Pascua, M.A., 1996a. Structure and tertiary evolution of the Madrid Basin. In: Friend, F., Dabrio, C.J. (Eds.), Tertiar y
Basins of Spain: The Stratigraphic Record of Crustal Kinemat
ics. Cambridge University Press, Cambridge, Great Britain, pp. 263- 267.
De Vicente, G., Giner, 1. , Muiioz, A., Gonzalez-Casado, 1.M.,
Lindo, R., 1996b. Detennination of present-day stress tensor and neotectonic interval in the Spanish Central System
and Madrid Basin, central Spain. Tectonophysics 266 (1-4),
405- 424. Dimitriadis, K., Tselentis, G.A., Thanassoulas, K., 1987. A basic
program for 2-D spectral analysis of gravity data and source
depth estimation. Comput. Geosci. 13 (5), 549- 560. Escuder Viruete, 1. , Hernaiz Huerta, P.P. , Valverde Vaquero, P.,
Rodriguez Fernandez, R., DlUllling, G., 1998. Variscan syncolli
sional extension in the Iberian Massif: structural, metamorphic
and geochronological evidence from the Somosierra sector of the Sierra de Guadarrama (Central Iberian Zone, Spain). Tecto
nophysics 290 (1-2), 87- 109.
GM-SYS v. 4.7, 2001. GravityIMagnetic Modleing Software. Northwest Geophysical Associates, Inc., P.O. Box 1063. Cor
vallis, OR 97339, USA.
GOmez Ortiz, D., 2001. La estructura de la corteza en la zona central de la Peninsula Ib6rica. PhD thesis, University Complutense de
Madrid, Madrid.
Granser, H., 1987. Three-dimensional interpretation of gravity data from sedimentar y basins using an exponential density-depth
fimction. Geophys. Prospect. 35 (9), 1030- 1041.
Gupta, VK., Ramani, N., 1980. Some aspects of regional-residual separation of gravity anomalies in a precambrian terrain. Geo
physics 45 (9), 1412- 1426.
I.G.M.E., 1987. Contribuci6n de la exploraci6n petrolifera al conocimiento de la geologia de Espafia. IGME, Madrid.
465 pp.
ILIRA DSS Group, 1993. A deep seismic smmding investigation of lithospheric heterogeneity and anisotropy beneath the Iberian
Peninsula. Tectonophysics 221 (1), 35- 51.
I.T.G.E., 1990. Documentaci6n sobre la geologia del subsuelo de
Espafia. Tomo V (Duero-Almazan). Internal report munber 29()40, Modrid.
Lees, 1.M., Park, 1., 1995. Multiple-taper spectral analysis: a stand
alone C-subroutine. Comput. Geosci. 21, 199- 236. Lefort, 1.P., Agarwal, B.N.P. , 2002. Topography of the Moho lUldu
lations in France from gravity data: their age and origin. Tecto
nophysics 350, 193- 213. Macaya, 1., Gonz:ilez-Lodeiro, F., Martinez-Catalan, 1.R., Alvarez,
F., 1991. Continuous defonnation, ductile thrusting and
backfolding of cover and basement in the Sierra de Guadarrama, Hercynian orogen of central Spain. Tectonophysics
191, 291- 309.
Maestro, A., 1999. Estructura y evoluci6n alpina de la Cuenca de Almazan (Cordillera Ib6rica). PhD thesis. University of Zara
goza, Zaragoza.
Martin-Atienza, B., Garcia-Abdeslem, l., 1999. 2-D Gravity mod
eling with analytically defmed geometry and quadratic polyno
mial density fimctions. Geophysics 64 (6), 1703 - 1734.
Mezcua, l., Gil, A., Benarroch, R, 1996. Estudio Gravimetrico de la
Peninsula Iberica y Baleares. Inst. Geogrifico Nacional, Madrid.
7 pp.
Mishra, D.e., Naidu, P.S., 1974. Two-dimensional power spec
tral analysis of aeromagnetic fields. Geophys. Prospect. 22, 345- 353.
Muiioz Martin, A., 1997. Evoluci6n geodinamica del borde oriental
de la Cuenca del Tajo desde el Oligoceno hasta la Actualidad.
PhD thesis, University Complutense de Madrid, Madrid.
Oldenburg, D.W., 1974. The inversion and interpretation of gravity
anomalies. Geophysics 39 (4), 526- 536. Parker, RL., 1973. The rapid calculation of potential anomalies.
Geophys. l. R Astron. Soc. 31, 447- 455.
Querol, R, 1989. Geologia del subsuelo de la Cuenca del Tajo.
ITGE-ETSI de Minas de Madrid, Madrid. 48 pp.
Rey Moral, C., 2001. Estudio geofisico de lUla cuenca sedimentario:
La Cuenca de Almazan (provincia de Soria). hnplicaciones
tect6nicas. PhD thesis. University Complutense de Madrid,
Madrid.
Ribeiro, A., Kullberg, M.C., Kullberg, l.C., Manuppella, G.,
Phipps, S., 1990. A review of Alpine tectonics in Portugal:
foreland detachment in basement and cover rocks. Tectonophy
sics 184 (3-4), 357- 366.
SHELL, 1983. Infonne del sondeo Baides-l . Internal report.
Slepian, D., 1978. Prolate spheroidal wave fimctions, Fourier anal
ysis and lUlcertainty, V, the discrete case. Bell Syst. Tech. l. 57, 1371- 1429.
Spector, A., Grant, P.S., 1970. Statistical models for interpreting
aeromagnetic data. Geophysics 35 (2), 293- 302. Suriiiach, E., Vegas, R, 1988. Lateral inhomogeneities of the
Hercynian crust in central Spain. Phys. Earth Planet. Inter. 51,
226- 234. Syberg, F.J.R, 1972. A Fourier method for the regional-residual
problem of potential fields. Geophys. Prospect. 20, 47- 75.
Tejero, RM., Ruiz, l., 2002. Thennal and mechanical structure of
the central Iberian Peninsula lithosphere. Tectonophysics 350,
49- 62.
Tejero, R, Perucha, M.A., Rivas, A., Bergamin, l.P., 1996. Modelos
gravimetrico y estructural del Sistema Central. Geogaceta 20
(4), 947- 950.
Tselentis, G.A., Drakopoulos, l., Dimitriadis, K., 1988. A spectral
approach to Moho depths estimation from gravity measurements
in Epirus (N\V Greece). l. Phys. Earth 36, 255- 266.
Vegas, R, Vazquez, l.T., Suriiiach, E., Marcos, A., 1990. Model of
distributed defonnation, block rotations and crustal thickening
for the fonnation of the Spanish Central System. Tectonophysics
184, 376- 378.
Warburton, l., Alvarez, C., 1989. A thrust tectonic interpretation of
the Guadarrama Mountains, Spanish Central System. Libro
Homenaje a Rafael Soler. Asoc. Geol. Geof. Esp. del Petr6leo
(AGGEP), pp. 147- 155.