Crunch Time on NAFTA Renegotiation and Presidential Race · Goldman Sachs & Co. LLC Gabriel Fritsch...
34
Crunch Time on NAFTA Renegotiation and Presidential Race We have now arrived at a critical and likely defining stage on the two main sources of uncertainty and left-tail risk facing the Mexican economy and markets—the outcome of the presidential election and the renegotiation of the NAFTA trade agreement. A significant part of the current uncertainty should be resolved, one way or the other, over the next 3-4 months, a process that may lead investors to reassess short- and medium-term relative value and macro risk. Outlook for NAFTA Renegotiation Has Improved in Recent Weeks Despite the slow progress, the outlook for the renegotiation of NAFTA has improved. In recent weeks there have been a number of constructive statements by the involved parties, raising the expectation that a breakthrough in the negotiations could be achieved within the next two months. Given the upcoming sequence of political events—July 1st presidential election in Mexico, expiration of the fast-track authority on July 8, and US Congressional mid-term elections in November—if a preliminary agreement (agreement in principle) is not reached by May-June, the odds of an agreement still being reached in 2018 would drop significantly, and, concomitantly, the risk of a more disruptive trade scenario would rise. An Election Like no Other! The outcome and policy implications of the July 1 st elections could be far from “business as usual” as they will likely change the overall balance of political power and could also herald a shift from the hitherto investment-friendly and conventional policy mix towards a potentially more inward-looking, heterodox, state-centered interventionist platform. In exactly 100 days, Mexicans will participate in the largest general elections in their history and Andrés Manuel López Obrador (AMLO)—the leftist nationalist candidate running for the Morena led coalition—is enjoying a solid double-digit lead in the early polls. AMLO’s significant early lead may not be easy to undo in the 100 days until Election Day, barring a major campaign mistake and/or very poor performance in the three scheduled debates. Alberto Ramos +1(212)357-5768 | [email protected] Goldman Sachs & Co. LLC Paulo Mateus +1(212)357-5772 | [email protected] Goldman Sachs & Co. LLC Gabriel Fritsch +1(212)902-0170 | [email protected] Goldman Sachs & Co. LLC Latin America Economics Analyst Mexico: Facing 100 Days of Uncertainty and Potential Drama 23 March 2018 | 1:18PM EDT Investors should consider this report as only a single factor in making their investment decision. For Reg AC certification and other important disclosures, see the Disclosure Appendix, or go to www.gs.com/research/hedge.html .
Transcript of Crunch Time on NAFTA Renegotiation and Presidential Race · Goldman Sachs & Co. LLC Gabriel Fritsch...

Crunch Time on NAFTA Renegotiation and Presidential Race
We have now arrived at a critical and likely defining stage on the two main sourcesof uncertainty and left-tail risk facing the Mexican economy and markets—theoutcome of the presidential election and the renegotiation of the NAFTA tradeagreement. A significant part of the current uncertainty should be resolved, one wayor the other, over the next 3-4 months, a process that may lead investors toreassess short- and medium-term relative value and macro risk.
Outlook for NAFTA Renegotiation Has Improved in Recent Weeks
Despite the slow progress, the outlook for the renegotiation of NAFTA hasimproved. In recent weeks there have been a number of constructive statements bythe involved parties, raising the expectation that a breakthrough in the negotiationscould be achieved within the next two months. Given the upcoming sequence ofpolitical events—July 1st presidential election in Mexico, expiration of the fast-trackauthority on July 8, and US Congressional mid-term elections in November—if apreliminary agreement (agreement in principle) is not reached by May-June, theodds of an agreement still being reached in 2018 would drop significantly, and,concomitantly, the risk of a more disruptive trade scenario would rise.
An Election Like no Other!
The outcome and policy implications of the July 1st elections could be far from“business as usual” as they will likely change the overall balance of political powerand could also herald a shift from the hitherto investment-friendly and conventionalpolicy mix towards a potentially more inward-looking, heterodox, state-centeredinterventionist platform. In exactly 100 days, Mexicans will participate in the largestgeneral elections in their history and Andrés Manuel López Obrador (AMLO)—theleftist nationalist candidate running for the Morena led coalition—is enjoying a soliddouble-digit lead in the early polls. AMLO’s significant early lead may not be easy toundo in the 100 days until Election Day, barring a major campaign mistake and/orvery poor performance in the three scheduled debates.
Alberto Ramos+1(212)357-5768 |[email protected] Sachs & Co. LLC
Paulo Mateus+1(212)357-5772 |[email protected] Sachs & Co. LLC
Gabriel Fritsch+1(212)902-0170 |[email protected] Sachs & Co. LLC
Latin America Economics Analyst
Mexico: Facing 100 Days of Uncertainty and PotentialDrama
23 March 2018 | 1:18PM EDT
Investors should consider this report as only a single factor in making their investment decision. For Reg ACcertification and other important disclosures, see the Disclosure Appendix, or go towww.gs.com/research/hedge.html.

Mexico: Facing 100 Days of Uncertainty and Potential Drama
“Without democracy, freedom is a chimera.”
Octavio Paz (1914-1998); Mexican poet and diplomat, awarded the 1990 Nobel Prize inLiterature.
IntroductionWe have now arrived at a critical and likely defining stage on the two main sources ofuncertainty and left-tail risk facing the Mexican economy and markets—the outcome ofthe presidential election and the renegotiation of the NAFTA trade agreement. Asignificant part of the current uncertainty should be resolved, one way or the other, overthe next 3-4 months - a process that may lead investors to reassess short- andmedium-term relative value and macro risk.
We have now started the 100-day countdown to the largest general elections in
Mexican history. Presidential, legislative, and a number of local elections will take placeon Sunday, July 1. Voters will elect a new president (for a single 5-year and 10-monthsterm) and a full new Congress (500 Lower House representatives and 128 Senators).Furthermore, 9 state gubernatorial (including the Federal District), close to 1,600mayoral, and several state and municipal legislative elections will take place the sameday. The new Congress will be sworn in on September 1, and the new President onDecember 1 (a long five months after the election).
Beyond the electoral campaign dynamics, during the 100-day window investors will alsobe tuned in to the ongoing tripartite renegotiation of the NAFTA treaty. We areapproaching “crunch-time” on the complex negotiations that started on August 16, 2017.The NAFTA renegotiation has already gone through seven Rounds, but with limited(official) progress on the thorniest issues tabled by the United States in October duringRound 4: e.g., rules of origin for the auto sector; dispute settlement mechanisms(Chapter 11 on Investor-State disputes); “sunset clause”; agricultural products seasonalrestrictions; government procurement; and Canadian supply management.
Exhibit 1: Election Timeline
Apr 22 1st debate
May 20 2nd debate
Jun 12 3rd debate
Jul 1 Election day Sep 1
1st Congressional Session
Dec 1 Presidential
Inauguration
Mar 30 - Jun 27 Campaign
Source: INE, Goldman Sachs Global Investment Research
23 March 2018 2
Goldman Sachs Latin America Economics Analyst

Outlook for NAFTA Renegotiation Has Improved in Recent WeeksDespite the slow progress, the outlook for the renegotiation of NAFTA has improved. Inrecent weeks there have been a number of relatively constructive public statements bythe involved parties, raising the expectation that a breakthrough in the negotiationscould be achieved within the next two months.
During the first seven Rounds, negotiators were able to close six of the about 30chapters that are part of the ongoing attempt to revamp the NAFTA trade agreement(four sectoral annexes were also concluded). The 8th Round is scheduled to start on April8 in Washington, DC. In the upcoming Round negotiators are expected to concludeanother 7-8 chapters and to hopefully make headway on some of the thorniest anddivisive issues tabled during Round 4 in mid-October 2017, and on which there has beenvery limited progress.
On a hopeful note, we highlight that there have been press reports that the USadministration is dropping the controversial demand that vehicles exported from Mexicoand Canada have at least a 50% US value-added content. If confirmed, this would be avery important development for it would remove a key roadblock for an agreement byMay-June, and jives with recent statements by the parties involved (including USTRRobert Lighthizer and Commerce Secretary Wilbur Ross) expressing a willingness tospeed up the negotiations in order to reach a preliminary agreement soon.
Time is of the Essence on NAFTA Given The Political CycleGiven the upcoming sequence of political events—the July 1st presidential election inMexico, the expiration of the fast-track authority on July 8, and US Congressionalmid-term elections in November—if a preliminary agreement (agreement in principle) isnot reached by May-June, the odds of an agreement still being reached in 2018 woulddrop significantly, and, concomitantly, the risk of a more disruptive trade scenario wouldrise.
If an agreement is reached by May there is some chance that it could go before thecurrent Mexican Senate and US Congress. Otherwise, the treaty would need to bereviewed by the new Mexican Senate, which will be elected on July 1st and installed onSeptember 1st. Furthermore, the timing and content of a new agreement would dependon the outcome of Mexico’s presidential election, as the new president may want torevisit some of the negotiated issues (eventually starting the negotiation anew) andlikely leave his imprint on the new agreement. In this regard, we highlight that Mexico’s
Exhibit 2: Poll of Polls: AMLO Enjoying Solid Lead in Early Polls
Latest Update
AMLO R. Anaya J. A. Meade M. Zavala J. Rodríguez
23-Mar-18 39.5 27.6 23.1 5.5 2.9
18-Mar-18 41.3 23.7 24.7 6.4 1.1Bloomberg
Oraculus
Source Presidential Candidates
Source: Bloomberg, Oraculus
23 March 2018 3
Goldman Sachs Latin America Economics Analyst

leading presidential candidate, Andrés Manuel López Obrador (AMLO) has alreadymentioned that if elected, his administration would like to introduce new issues to thenegotiating table (such as emigration, as suggested in recent press reports), whichwould likely further delay the process and increase the risk that the talks endunsuccessfully.
Hence, given the political calendar, there seems to be a sense of urgency among
the three negotiating parties involved and a predisposition to accelerate the
process. Even if not final, the announcement of an agreement in principle would likelybe taken very positively by investors and markets, for that would significantly reduce therisk of a break-up of NAFTA. If an agreement, even if in principle, is not reached by May,the sense of urgency would likely disappear, and the negotiations could slow downsignificantly over the next eight months. The risk here is that the balance of politicalpower could change visibly in Mexico and the US Congress, in a direction that couldrender the approval of a revamped NAFTA agreement more difficult. In Mexico, recentpolls suggest that there is a relatively high likelihood that the ruling PRI will lose thepresidency and will also see its bench in both chambers of Congress shrink. The newadministration and a more left-leaning Mexican Congress could potentially haveconcerns with any agreement signed by the current administration. However, on thepositive side, we highlight that the ongoing NAFTA renegotiation has been lesspoliticized than what we expected earlier, as the three main presidential contendershave publicly stated that they would like NAFTA to continue. This is a key development,as in the 1990s when NAFTA was negotiated, the Mexican political left opposed theagreement head-on.
NAFTA Uncertainty Is Off Recent PeaksOverall, uncertainty over NAFTA has now moderated and is off the peaks reached inearly 2017 and during the October Round 4 (see Exhibit 3 on Google Trends for“NAFTA”). This suggests that despite the modest progress so far, markets now seem toattribute a lower risk of a break-up of the negotiation and the end of NAFTA.
Exhibit 3: “Tariffs” recently surpassed “NAFTA” in Google search frequency
* Google Trends scales searches for a specific topic relative to all searches for a chosen sample, and creates an index with 100 being the maximum proportion of searches on that topic relative to the sample.
0
10
20
30
40
50
60
70
80
0
10
20
30
40
50
60
70
80
15-Aug 4-Sep 24-Sep 14-Oct 3-Nov 23-Nov 13-Dec 2-Jan 22-Jan 11-Feb 3-Mar
"NAFTA" searches (7-day mov avg)
"Tariffs" searches (7-day mov avg)
R1 R2 R4 R3 R5 R6 R7
Source: Google Trends, Goldman Sachs Global Investment Research
23 March 2018 4
Goldman Sachs Latin America Economics Analyst

While NAFTA-specific risk and uncertainty are now more contained and off earlier peaks,risk and uncertainty related to broader US trade policy rose again in recent months (seethe US Trade Policy Uncertainty Index in Exhibit 4 and Google Trends for the word“tariff” in Exhibit 3). This follows a number of trade-related actions by the USadministration, namely: (1) the imposition in January of steep tariffs on imports ofwashing machines and solar energy cells and panels, followed in March by (2) a 25%import tariff on steel and 10% on aluminum (Canada and Mexico were excluded,apparently contingent on a successful renegotiation of NAFTA). Furthermore, followingan intellectual property-related investigation under Section 301 of the Trade Act of 1974,the US administration announced on March 22, 25% tariffs on US$50bn in goodsimported from China, and the Treasury appears likely to propose restrictions on Chinesecorporate investment in sensitive US technology sectors in coming weeks. In summary,overall US trade policy risk and uncertainty increased at the beginning of 2018, but
that rise does not appear linked to NAFTA.
Beyond NAFTA, the other major source of uncertainty impacting the outlook for
Mexico is related to the July general elections and the risk that they will change
the overall balance of political power towards a more inward-looking,
interventionist and heterodox policy mix. With 100 days until the July 1st election,left-wing nationalist AMLO continues to enjoy a solid lead in the polls and the outlookfor NAFTA is still unclear. While apprehensive, local markets have not overreacted. Infact, Mexico’s Economic Policy Uncertainty Index is tracking well below the historical
Exhibit 4: US Trade Policy Uncertainty is Rising AgainUS Trade Policy Uncertainty
The Trade Policy Uncertainty Index is a categorical index mapping the frequency of trade uncertainty related articles in the media. It follows the methodology of Baker, Bloom & Davis (2016), searching for terms such as "import tariffs", "import barrier", "trade agreement" "trade policy", etc.
0
200
400
600
800
1000
1200
1985 1987 1989 1991 1993 1995 1997 1999 2001 2003 2005 2007 2009 2011 2013 2015 2017
NAFTA bill passes in Congress
U.S. Trade and Development Act of 2000 is enacted
WTO Doha Round launched in Qatar
Congress passes FTAs with South Korea, Colombia, and Panama after a long-stretched political standoff
Donald Trump is elected president with a trade protectionist agenda
U.S. Export Enhancement Act of 1992 is enacted; build-up to the GATT Uruguay Round
TPP countries meet in Singapore; negotiations lose momentum
Rising NAFTA risk
17
18
19
20
21
22
0
50
100
150
200
250
300
350
Mar-16 Sep-16 Mar-17 Sep-17
US Trade Policy Uncertainty (lhs)MXN (rhs)
WTO is established as a successor to the GATT
Source: PolicyUncertainty.com
23 March 2018 5
Goldman Sachs Latin America Economics Analyst
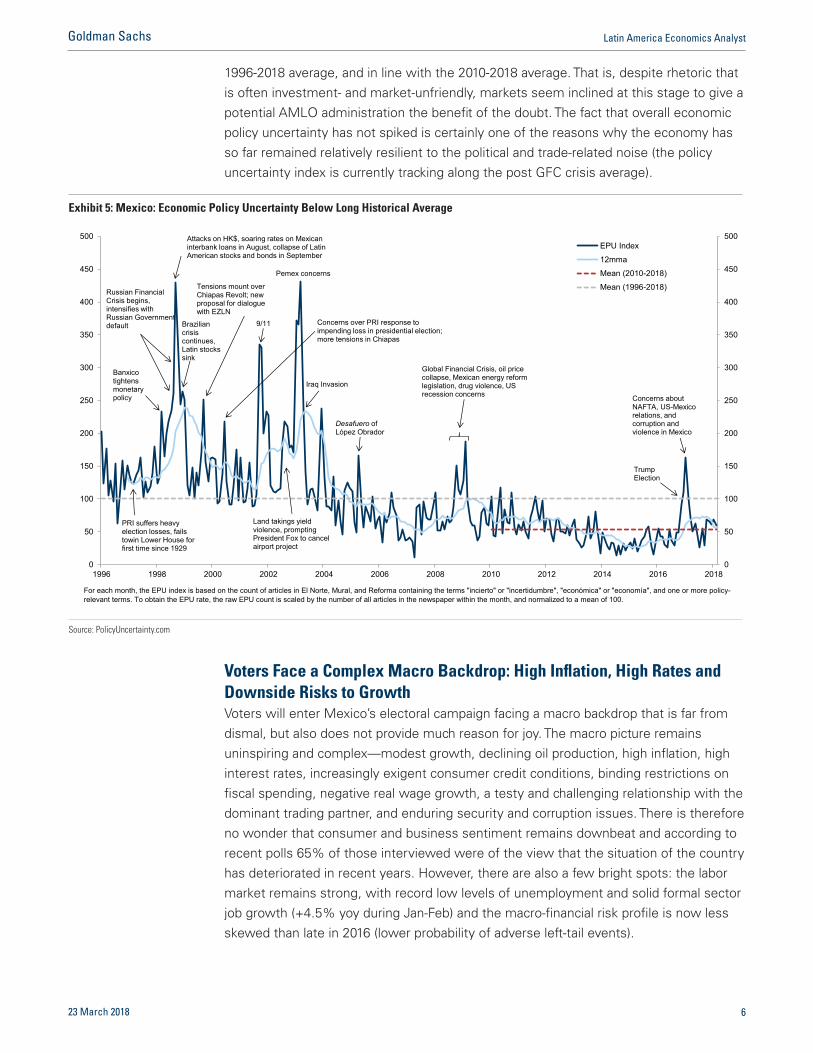
1996-2018 average, and in line with the 2010-2018 average. That is, despite rhetoric thatis often investment- and market-unfriendly, markets seem inclined at this stage to give apotential AMLO administration the benefit of the doubt. The fact that overall economicpolicy uncertainty has not spiked is certainly one of the reasons why the economy hasso far remained relatively resilient to the political and trade-related noise (the policyuncertainty index is currently tracking along the post GFC crisis average).
Voters Face a Complex Macro Backdrop: High Inflation, High Rates andDownside Risks to GrowthVoters will enter Mexico’s electoral campaign facing a macro backdrop that is far fromdismal, but also does not provide much reason for joy. The macro picture remainsuninspiring and complex—modest growth, declining oil production, high inflation, highinterest rates, increasingly exigent consumer credit conditions, binding restrictions onfiscal spending, negative real wage growth, a testy and challenging relationship with thedominant trading partner, and enduring security and corruption issues. There is thereforeno wonder that consumer and business sentiment remains downbeat and according torecent polls 65% of those interviewed were of the view that the situation of the countryhas deteriorated in recent years. However, there are also a few bright spots: the labormarket remains strong, with record low levels of unemployment and solid formal sectorjob growth (+4.5% yoy during Jan-Feb) and the macro-financial risk profile is now lessskewed than late in 2016 (lower probability of adverse left-tail events).
Exhibit 5: Mexico: Economic Policy Uncertainty Below Long Historical Average
For each month, the EPU index is based on the count of articles in El Norte, Mural, and Reforma containing the terms "incierto" or "incertidumbre", "económica" or "economía", and one or more policy-relevant terms. To obtain the EPU rate, the raw EPU count is scaled by the number of all articles in the newspaper within the month, and normalized to a mean of 100.
0
50
100
150
200
250
300
350
400
450
500
0
50
100
150
200
250
300
350
400
450
500
1996 1998 2000 2002 2004 2006 2008 2010 2012 2014 2016 2018
EPU Index12mmaMean (2010-2018)Mean (1996-2018)
PRI suffers heavy election losses, fails towin Lower House for first time since 1929
Banxico tightens monetary policy
Russian Financial Crisis begins, intensifies with Russian Government default
Attacks on HK$, soaring rates on Mexican interbank loans in August, collapse of Latin American stocks and bonds in September
Land takings yield violence, prompting President Fox to cancel airport project
Brazilian crisis continues, Latin stocks sink
9/11
Tensions mount over Chiapas Revolt; new proposal for dialogue with EZLN
Concerns over PRI response to impending loss in presidential election; more tensions in Chiapas
Pemex concerns
Iraq Invasion
Desafuero of López Obrador
Global Financial Crisis, oil price collapse, Mexican energy reform legislation, drug violence, US recession concerns
Trump Election
Concerns about NAFTA, US-Mexico relations, and corruption and violence in Mexico
Source: PolicyUncertainty.com
23 March 2018 6
Goldman Sachs Latin America Economics Analyst

An Election Like No Other!In exactly 100 days, 88 million registered Mexicans will participate in the largest
general elections in their history—12.8 million young voters between 18 to 23
years old are eligible to vote for president for the first time. Presidential, legislative,and a number of local elections will take place simultaneously on July 1. Voters will electa new president and Congress (500 Lower House representatives and 128 Senators).Furthermore, 9 gubernatorial (including the Federal District), close to 1,600 mayoral, andseveral state and municipal legislative elections will take place on the same day. Theofficial campaign will be short: formal campaigning starts on March 30 and will runthrough June 27. During that period there will be three presidential debates: April 22,May 20 and June 12. The new Congress will be sworn in on September 1, and the newPresident a long five months after the election, on December 1. The presidential electionis decided by a single round of voting.
With 100 days to go before the July 1st election, Andrés Manuel López Obrador
(AMLO)—the leftist nationalist candidate running for the Morena-PT-PES coalition—isenjoying a solid lead in the early polls.
According to poll aggregator Oraculus, AMLO leads the race with 39.5% of the effectivevoting preferences, a +11.9pt lead over Ricardo Anaya—the candidate representing thethree-party coalition between the center-right PAN, leftist PRD, and the smaller MC(Citizens Movement) party. Lagging in third place with 23.1% of the vote is the officialPRI-PVEM-Panal candidate, former finance minister José Antonio Meade.
Exhibit 6: Poll: Did the Country’s Outlook Deteriorate or Improvesince Peña Nieto took Office?
Exhibit 7: Weak Consumer Confidence
56
49 49
58
65
72
65
22 25 23
19 13 10
17
Aug-15 Nov-15 Feb-16 May-16 Aug-16 Nov-16 Feb-17 May-17 Aug-17 Nov-17
(%)
Deteriorated
Improved
-30%
-20%
-10%
0%
10%
20%
30%
60
70
80
90
100
110
120
Aug-07 Feb-09 Aug-10 Feb-12 Aug-13 Feb-15 Aug-16 Feb-18
YoY % chg; n.s.a.Cons. Confidence Index (sa) (lhs)
(Jan-2003=100)
Source: El Universal, Buendía y Laredo Source: Haver Analytics, INEGI
23 March 2018 7
Goldman Sachs Latin America Economics Analyst

The Bloomberg weighted poll of polls tracker gives AMLO an even larger +16.6ptlead: 41.3% for AMLO, versus 24.7% for Meade and 23.7% for Anaya. Independentcandidate Margarita Zavala—a former first lady who left the PAN after disagreementswith the party’s internal candidate selection process—is polling at a very distant fourthplace with 5.5% of the vote according to the Oraculus aggregation, and 6.4% accordingto the Bloomberg poll tracker.
Exhibit 8: AMLO Enjoying Solid Double Digit Lead Ahead of Official CampaignOraculus Poll Aggregator Model Projections
36.2 37.4
36.1 37.9
39.5
11.7 10.0
6.2 5.5 5.5
24.6 24.9 27.5
29.3 27.6
3.9 4.0 3.1 2.8 2.9
23.6 23.7 25.3
23.3 23.1
Nov-17 Dec-17 Jan-18 Feb-18 Mar-18
AndrØs Manuel López Obrador (Morena-PT-PES) Margarita Zavala (Independent)
Ricardo Anaya (PAN-PRD-MC) Jaime "El Bronco" Rodríguez (Independent)
JosØ Antonio Meade (PRI-PVEM-PANAL)
AMLO
R. Anaya
J. A. Meade
M. Zavala
J. Rodríguez
Source: Oraculus
Exhibit 9: Anaya and Meade Loosing Contact with AMLOBloomberg Efficiency Weighted Poll of Polls
39.3
32.3
43.5
32.9 34.2
37.6 39.0
36.4
40.3 38.7
42.2
40.2
41.3
10.3 9.1
7.3 7.9 5.8 4.3
6.9 6.1 5.2 5.8 4.0 4.6
6.4
21.9
25.0
21.3
25.1
29.2 29.8 26.5
29.5 31.4
30.1 27.4 27.7
23.7
1.1
22.6
22.9 22.2
29.3
25.1 23.3 22.9 22.6
19.3
24.5 20.6 23.5
24.7
27-Nov 18-Dec 8-Jan 29-Jan 19-Feb 12-Mar
AndrØs Manuel López Obrador (Morena-PT-PES) Margarita Zavala (Independent)Ricardo Anaya (PAN-PRD-MC) Jaime "El Bronco" Rodríguez (Independent)JosØ Antonio Meade (PRI-PVEM-PANAL)
AMLO
R. Anaya
J. A. Meade
M. Zavala
J. Rodríguez
Source: Bloomberg
23 March 2018 8
Goldman Sachs Latin America Economics Analyst

AMLO’s lead seems to be widening and becoming entrenched. The five pollsreleased in March give AMLO an even a larger lead of +14pt, up from the +8pt averageof the six polls released in February. Interestingly, all 16 polls released so far in 2018show AMLO in the lead [max=18pt; min=3pts; avg=9pt].
Voters’ preferences are not yet fully settled: unsurprising as the campaign is yet tostart. The percentage of those surveyed that did not express a preference for acandidate is at 21% for the average of ten polls released in Feb-Mar [max=30%;min=12%].
Beyond the numerical lead in voters’ preference, a number of qualitative indicators alsoseem to be playing out in favor of AMLO:
The incumbent PRI party has a very high rejection rate: 47% of thosen
interviewed would never vote for it, compared with just 12% for AMLO’s Morenaparty, and 7%-8% for the PAN/PRD (Exhibit 11).
AMLO is the candidate with the most favorable image among voters: he has an
net positive perception of +17pt (Good/Very Good net of Bad/Very Bad = 43 -26 =
Exhibit 10: AMLO lead has increased in recent polls
Date Poll AMLO R. Anaya J.A. Meade M. Zavala First Second AMLO lead
23-Mar Consulta Mitofsky 41 29 23 7 AMLO Anaya +1222-Mar El Financiero 42 23 24 7 AMLO Meade +1821-Mar GEA ISA 38 32 28 1 AMLO Anaya +63-Mar Ipsos 46 29 19 4 AMLO Anaya +171-Mar Parametria 40 24 18 11 AMLO Anaya +1627-Feb Suasor 36 27 30 4 AMLO Meade +611-Feb Parametro 36 28 28 5 AMLO Anaya/Meade +811-Feb Reforma 42 32 18 5 AMLO Anaya +1011-Feb Consulta Mitofsky 36 30 24 6 AMLO Anaya +64-Feb Mendoza Blanco 39 34 21 4 AMLO Anaya +54-Feb Parametria 40 27 21 8 AMLO Anaya +1331-Jan El Financiero 38 27 22 7 AMLO Anaya +1128-Jan Suasor 35 28 31 3 AMLO Meade +425-Jan Buendia & Laredo 40 32 20 5 AMLO Anaya +814-Jan Consulta Mitofsky 33 28 25 7 AMLO Anaya +55-Jan Suasor 33 25 30 8 AMLO Meade +3
Source: Oraculus; Goldman Sachs Global Investment Research
Exhibit 11: Poll: For what party would you never vote for? Exhibit 12: PRI has a higher rejection rate than other parties
47
12 8 7
PRI Morena PRD PAN
47
52
60
52
59
34 34 34
Jul-16 Oct-16 Jan-17 Apr-17 Jul-17 Oct-17 Jan-18
PRI
PRD
Morena
PAN
Source: Grupo Reforma Source: Consulta Mitofsky
23 March 2018 9
Goldman Sachs Latin America Economics Analyst

+17) followed at a significant distance by Ricardo Anaya (32-27 = +5) and Meade,who has a net negative perception among voters (19-38 = -19). Notably, AMLO isthe candidate with both the highest positive perception rating among voters (43%)and also the candidate with the lowest negative perception (just 26% vs. 38% forMr. Meade). This suggests that AMLO’s appeal and likability are broadening, whilethe rejection of the PRI, which epitomizes the political establishment, is quite highand is clouding the presidential bid of Mr. Meade. This also suggests that votersseek change and a new political order, and for that they seem ready to embraceAMLO.
Voting preferences for AMLO appear firmer (more cemented) than for othern
candidates: 75% of those expressing a voting preference for AMLO state that theyare sure of their choice (will not change), vs. 66% for Mr. Anaya and 69% for Mr.Meade (Exhibit 14).
AMLO is attracting previously disengaged voters and his support base isn
extending beyond his original, natural political turf. According to a ConsultaMitofsky early-February poll, among those that in the 2012 election voted forPresident Peña Nieto, 59% would now vote for the PRI candidate, José AntonioMeade, and a non-negligible 15% would vote for AMLO and 18% for Mr. Anaya
Exhibit 13: Poll: What is your opinion on the following candidates? (%)
Excellent/Good Regular Bad/Very Bad Doesn’t Know Candidate
Net Positive Perception (+/-)
A. M. López Obrador 43 23 26 8 +17
R. Anaya 32 23 27 18 +5
J. A. Meade 19 16 38 27 -19
M. Zavala 19 21 26 34 -7
J. Rodríguez 4 11 20 57 -16
Source: Consulta Mitofsky
Exhibit 14: Vote Certainty (%)
Certain Vote May Change N/A
A. M. López Obrador 74.7 20.5 4.8
R. Anaya 66.4 26.1 7.5
J. A. Meade 69.3 22.2 8.5
Independent Candidate 58.8 39.6 1.6
All Candidates 59.7 27.6 12.7
Source: Consulta Mitofsky
23 March 2018 10
Goldman Sachs Latin America Economics Analyst

(Exhibit 15). We note that the 18% share of the 2012 Peña Nieto voters that wouldvote for Mr. Anaya may have declined in recent weeks given the increasing frictionbetween Mr. Anaya and the PRI. Finally, among those that did not vote in 2012, a
significant 28% would now turn out to vote and would choose AMLO (versusonly 8.9% for Mr. Anaya and 5.4% for Mr. Meade). In our assessment, this shows:(1) the broadening electoral appeal of AMLO and, (2) the significant erosion of thePRI party brand in recent years and the difficulty the PRI is facing in leveraging Mr.Meade’s bid for the presidency.
AMLO’s Lead Could Have More Sticking Power Than in the 2006 ElectionDespite the fact that the official campaign is yet to start, given AMLO’s significantearly lead and the qualitative factors highlighted in the previous section, it maynot be easy to undo AMLO’s current lead in the polls in the 100 days until ElectionDay, barring a major campaign mistake and/or very poor performance in the threescheduled debates.
In the 2006 election, 1Q2006 polls were also showing AMLO well in the lead—byslightly under 8pts—but he eventually lost the election to Felipe Calderón of the PAN byroughly half a percentage point. But this time around it may be different; that is, it may
be harder to undo AMLO’s early pre-campaign lead. For instance:
The official campaign will be much shorter: less than 3 months compared with sixn
months in the 2006 election.
Mr. Anaya and the PRI/Mr. Meade have been involved in a high-intensity, atn
times negative, political fight to polarize into a two-way race and be viewed as theonly competitive option to challenge AMLO’s early lead. Mr. Anaya has been veryvocal in highlighting examples of alleged PRI corruption at the local and federallevels, and has promised, if elected, to prosecute corrupt PRI officials. Likewise, thePRI has also been increasingly critical of Mr. Anaya, accusing him of a number ofillegalities (including money laundering). Against this backdrop, local political analystshave been pointing out that if the PRI candidate, Mr. Meade, lingers in third placeand becomes a non-competitive candidate, senior PRI officials may well prefer an
AMLO victory over a PAN president (i.e., the rising animosity between senior PRIofficials and Mr. Anaya risks fostering an informal tactical PRI-AMLO alliance).
Exhibit 15: Electoral Preference According to 2012 Vote (%)
Josefina VÆsquez Mota (PAN)
Enrique Peæa Nieto (PRI)
AndrØs Manuel López Obrador (Morena) Didn’t Vote
A. M. López Obrador 8.9 15.0 62.2 27.9
R. Anaya 57.6 18.0 22.9 8.9
J. A. Meade 2.3 58.5 1.7 5.4
Independent Candidate 5.0 1.6 0.4 4.0
Doesn’t Declare 26.2 6.9 12.8 53.8
Who did you vote for in the 2012 election?
Who will you vote
for in 2018?
Source: Consulta Mitofsky
23 March 2018 11
Goldman Sachs Latin America Economics Analyst

Overall, the fierce political battle between the PRI and Mr. Anaya could well
weaken both candidates and end up favoring AMLO.
Mr. Anaya’s PAN-PRD-MC alliance has been beset by internal friction; somethingn
that could weaken Mr. Anaya’s bid. After all, the alliance between a center-right(PAN) and a leftist (PRD) party, which was home to AMLO for many years, wasagreed at a very high political level, and therefore may lack traction and enthusiasmat the local and militant grass-roots levels. That is, at the regional level the PRDand MC political structures may not show the zeal needed to leverage the
PAN-led presidential bid.
The preliminary disqualification by the National Electoral Institute (INE) of twon
independent candidates, Jaime “El Bronco” Rodriguez and leftist Senator ArmandoRios Piter, likely benefits AMLO for they would likely have catered to the leftist andanti-establishment voter base that is leaning AMLO. There are, however, some pressreports that Jaime “El Bronco” Rodriguez’s appeal to the Federal Electoral Court(TEPJF) may be successful, allowing him to be on the ballot.
Former PAN Margarita Zavala will remain in the race as an independentn
candidate. No matter how uncompetitive, Ms. Zavala further divides the
anti-AMLO camp and will probably take away votes from Mr. Anaya, who is tryingto establish himself as a competitive alternative to AMLO.
AMLO’s lead may also be protected by the fact that his public statements, andn
those of some of his top campaign operatives, have become more mainstream
and business-friendly (less radical and dogmatic than in previous elections), whichcould be broadening his acceptance and appeal.
An Election Centered Mostly on Non-Economic IssuesRecent polls suggest that the outcome and policy implications of the July 1st electionscould be far from “business as usual” as they will likely change the overall balance ofpolitical power and could also herald a shift from the hitherto investment-friendly andconventional policy mix towards a potentially more inward-looking,heterodox/interventionist platform.
Exhibit 16: Debate Calendar
Date Time Location Topics
8 pm (CT)
9pm (EST)
8 pm (CT)
9pm (EST)
9 pm (CT)
10pm (EST)Jun 12 MØrida Economy & Development
Apr 22 Mexico City Politics & Government
May 20 Tijuana Mexico in the World Stage
Source: Goldman Sachs Global Investment Research
23 March 2018 12
Goldman Sachs Latin America Economics Analyst

The decades-old grip on power at the local and federal levels by the ruling PRI is
facing a serious challenge. The PRI’s bid to retain the presidency and hold on to localpower structures has been hindered by the eroding popularity of President Enrique PeñaNieto, and the growing rejection of the PRI at the national level (Exhibit 17). Rising voterdissatisfaction with the sitting president and the PRI has been driven by the perceptionof rising corruption, unsettled security and law-and-order issues, modest growth (andnow also high inflation), and, for some, the hesitant handling of the frictions and policyissues with the United States. High-profile, widely reported corruption scandalsinvolving former PRI governors and federal officials have also tarnished the reputation ofthe PRI.
There is among the electorate a deep-rooted dissatisfaction with law and order issues:corruption and impunity, and public insecurity. These have been key campaign themesfor AMLO, who portrays himself as determined to end a long cycle of corruption andviolence and also to shake up the traditional political and business establishment (in fact,AMLO seems also to be proposing a new economic model). Hence, rather than areferendum on the state of the economy or a deep voter desire for a new economicparadigm, the election debate seems to be skewed towards non-economic issues(Exhibit 18). In fact, qualitative polls show that for some voters, the desire to seetangible progress on law and order issues seems somewhat to trump concerns that anAMLO administration could be riskier in terms of overall macro management given theheterodox and unconventional nature of some of his campaign proposals.
López Obrador Is Positioning Himself as the Candidate of Change/RenewalOverall, voter dissatisfaction with the political, institutional and economic status-quo anda growing demand for political change/renewal seem to be favoring the relatively newleftist Morena party, and Andrés Manuel López Obrador’s populist-nationalist platform,rather than the center-right PAN (for the first time in an alliance at the national level withthe leftist PRD party) which held the presidency for two consecutive terms before theelection of Mr. Peña Nieto. Mr. López Obrador is a former mayor of Mexico City andcontinues to carry the banner of the political left, positioning himself as a nationalist,socially progressive, anti-corruption leader. He frequently highlights what he perceives
Exhibit 17: President Peña Nieto’s Approval Rating Exhibit 18: Poll: What is the most important issue in the 2018Elections?
53 57 56 50
48 49 47 41 40 39 36 33 33 32
29 24
17 19 22 26 21
35 38
41 49
51 50 51 57 57 57
61 65
61 62 65
69 77 76
73 71 69
0
10
20
30
40
50
60
70
80
90
Feb-13 Feb-14 Feb-15 Feb-16 Feb-17 Feb-18
(%)
Approve
Disapprove
1
19
20
26
34
0 5 10 15 20 25 30 35 40
Other
Poverty
Jobs/Economy
Corruption
Security
Source: Consulta Mitofsky Source: El Financiero
23 March 2018 13
Goldman Sachs Latin America Economics Analyst

to be the failures of a conniving political and economic establishment: crony capitalism,rampant corruption and impunity, violence and inequality. In essence, AMLO iscampaigning as an outsider, a candidate who is not corrupted by traditional politics andparty structures.
Nevertheless, despite all the negative perceptions of the PRI and voters’ broaddemands for change, the PRI remains a force to be reckoned with given its efficient,time-tested electoral machinery and other logistical advantages that may help tomitigate growing public dissatisfaction with the ruling PRI.
AMLO Espouses a Nationalist State-Centered Interventionist PolicyApproachAMLO holds a nationalistic/populist worldview and favors a policy mix that is likely tovalidate a more active and interventionist public sector, both directly and indirectlythrough (often inefficient) state-owned companies. This approach entails risks to theeconomy: for it would likely increase uncertainty and hinder much-needed domestic
and foreign investment, and could also lead to a broad misallocation of resources
in the economy that could, over time, erode macroeconomic efficiency and overall
productivity growth.
While an AMLO administration may not significantly compromise hard-won pricestability gains or the independence of the central bank, or significantly weaken the fiscalstance, it may ultimately be reluctant to approve necessary reforms and/or adopt themeasures required to attract investment and keep Mexico on a medium-term fiscallydisciplined path, particularly if its policies entail a significant unfunded increase ingovernment spending. Overall, a more interventionist state-centered policy approachcould undermine the economy’s broad macro efficiency through, for instance,under-investment and growing misallocation of resources. In essence, rather thanimmediate short-term macroeconomic damage, the cost of heterodox,
interventionist unconventional policies would likely materialize through the
steady accumulation of microeconomic inefficiencies and distortions that with the
passage of time could lead to visible macroeconomic imbalances. However, on thepositive side, there is also the perception that AMLO could eventually be tougher andmore effective than others in fighting large-scale corruption and it has also beenreported that the candidate has been building bridges to the local private sector and thebroader business community.
Uncertainty Could Undermine Investment in the Under-Invested EnergySectorAMLO has over the years been very vocal and critical of the 2014 energy sector reform(which opened Mexico’s oil and gas sectors to private investment, effectively ending 8decades of a state-owned monopoly) and in recent months public statements on energysector policy by the candidate and some of his campaign surrogates have beeninconsistent.
23 March 2018 14
Goldman Sachs Latin America Economics Analyst

In our assessment, an AMLO presidency would be unlikely to roll back the 2014 oilsector reform/opening. First, because AMLO is unlikely to have the needed two-thirdsqualified majority in Congress to change the constitution again. Second, because from amore pragmatic rather than dogmatic policy standpoint, cancelling the more than 90exploration contracts already awarded would be legally challenging, would not produceclear economic dividends, would generate a major negative shock to businessconfidence and would stop much-needed investment in the sector and the economy atlarge. But AMLO could change the oil sector status quo by slowing down theimplementation of the energy sector reform, making it less predictable and marketfriendly, and by intervening more in the sector directly, and indirectly by giving moremoney, power, and influence to the inefficient state-oil concern, Pemex.
AMLO has vowed to “to stop the privatization of the electricity sector” and to call for apopular consultation on the opening of the oil sector. A popular consultation may in theend not be legally binding, but could certainly stoke nationalist anti-reform sentiment.This could significantly increase uncertainty and reduce investment in the highlyinefficient and severely underinvested oil and gas sector. Furthermore, a morenationalist natural resources approach could slow down the process of opening the oilsector, by delaying or stopping additional bidding rounds, thereby denying to the privatesector new areas in which to invest and develop. In this regard, on March 18 AMLOstated that if elected, he would ask President Peña Nieto to stop the two new oilbidding rounds (July and September) scheduled between Election Day (July 1st) and theday the new administration is sworn in (December 1st). AMLO would like the departingPeña Nieto administration to stop new auctions so that the AMLO team can review theterms, including the contracts awarded during the previous eight bidding rounds in orderto ensure they “complied with the law”. AMLO has also stated that it is imperative toreview older contracts for signs of corruption, and suggested that he could cancelprojects that he views as deleterious to the country’s interest.
With regard to specific policies for the oil sector, AMLO’s program entails more publicinvestment to expand and upgrade the local refining capacity (upgrade six existing andbuild two big new refineries; something that could stretch the budget) and has vowed tostop fuel imports within three years. AMLO also stated that Mexico should stop
Exhibit 19: Oil Production Continues to DeclineMillions of barrels per day
Exhibit 20: Gasoline Import Volumes Increase As DomesticProduction Declines (12mma)
1.6
1.8
2.0
2.2
2.4
2.6
2.8
3.0
3.2
3.4
3.6
1.6
1.8
2.0
2.2
2.4
2.6
2.8
3.0
3.2
3.4
3.6
2001 2003 2005 2007 2009 2011 2013 2015 2017
(mbd) (mbd)
200
250
300
350
400
450
500
550
600
200
250
300
350
400
450
500
550
600
Jul-14 Jan-15 Jul-15 Jan-16 Jul-16 Jan-17 Jul-17 Jan-18
(Thnds b/d)
Imports
Domestic Production
(Thnds b/d)
Source: Haver Analytics Source: Pemex, Goldman Sachs Global Investment Research
23 March 2018 15
Goldman Sachs Latin America Economics Analyst

exporting crude in order to focus on higher valued-added petrochemical refined productsand to lower domestic fuel prices. Finally, as part of a broad inward lookingimport-substitution strategy, AMLO would also aim for food self-sufficiency by boostinglocal production and has controversially advocated minimum selling prices to someagricultural products.
Balance of Political Power in Congress Is Likely to Shift to the LeftBeyond the presidential race, investors should also be paying attention to the federallegislative election and the new composition of Congress, where the PRI is at risk oflosing the current simple majority in both houses of Congress.
Morena’s and AMLO’s message of a broad regeneration of political and economic life isgaining appeal. Morena did not win any governorships in the 2016 local elections (in 12of the 31 Mexican Federation States), but it did run competitively in two of thoseelections (Veracruz and Zacatecas). In the June 4, 2017 local election Morena did not dothat well either: the party ran competitively in the pivotal State of Mexico, but finishedsecond to the PRI candidate. Overall, Morena is yet to win a major local election in
close to three years. But that may be about to change as the Morena-led coalition
may well win the presidency and build a strong legislative bench in both
Chambers of Congress (mostly at the expense of the PRI). In fact, it is quite possiblethat, while short of a simple majority, Morena could elect the largest bench in both theSenate and Lower House; this would be at the expense of the decades-old dominanceof the legislative branch by the PRI.
Exhibit 21: AMLOs Morena Party Leads Voting Preferences for CongressVoter Preference by Party (%)
24.4 25.1
27.4 28.6 28.9
28.0 27.9 26.7
26.4 25.5
24.4 24.4
32.1 31.2 28.5
27.5 26.5 24.2
21.9 21.6 21.7 23.0
23.9 24.2
12.8 11.9 10.1 10.2 10.2 9.8 9.5 9.1 8.8 8.1 7.8 7.9
14.6 15.5
18.2 18.3 18.9
22.3
24.7 26.7
27.0 27.2 27.7 28.2
Feb-16 Apr-16 Jun-16 Aug-16 Oct-16 Dec-16 Feb-17 Apr-17 Jun-17 Aug-17 Oct-17 Dec-17
PAN PRI PRD Morena
Source: Oraculus
23 March 2018 16
Goldman Sachs Latin America Economics Analyst

Morena may emerge from this election as the most-voted party (with about 28% of thenational vote according to the Oraculus poll aggregator model), followed by the PAN andthe PRI with about 24% each. Overall, the national voting preference for Morena hasbeen rising while that for the ruling PRI has been declining, from as high as 32% twoyears ago. However, as the PRD-MC is polling at around 10%-11% of the national vote,the PVEM-Panal about 4% and PT-PES around 3.0%, in terms of major party coalitions,the PAN-PRD-MC alliance may get more votes (and potentially win more seats) than theMorena-PT-PES alliance. Nevertheless, given that the PAN (center-right) and the PRD(leftist) parties have traditionally been at opposing sides on the political spectrum, it isunclear how cohesive and effective a potential PAN-PRD-MC parliamentary alliancewould be. Finally, the PRI-PVEM-Panal alliance may well end up as only the third-mostimportant political force in Congress, down from its dominant position in the current andpast legislatures.
Exhibit 22: PAN-PRD led Alliance Polling Well in Voting Intention for Congress; Significant Erosion in PRISupportVoter Preference by Coalition (%)
40.1 39.8 40.2 41.5 41.8 40.5 40.2 38.5 37.9
36.3 34.9 35.0 37.6 36.8
33.9 32.7
31.5 29.1
26.9 26.4 26.5 27.7 28.2 28.1
17.4 18.4
21.1 21.4 22.1
25.5 28.1
30.1 30.3 30.7 31.0 31.1
4.9 4.9 4.8 4.3 4.5 4.8 4.7 4.8 5.3 5.2 5.8 5.8
Feb-16 Apr-16 Jun-16 Aug-16 Oct-16 Dec-16 Feb-17 Apr-17 Jun-17 Aug-17 Oct-17 Dec-17
PAN-PRD-MC PRI-PVEM-PANAL Morena-PT-PES Independent
Source: Oraculus
23 March 2018 17
Goldman Sachs Latin America Economics Analyst

Exhibit 23: 2018 Senate Composition
PRI
PVEM
PT
PAN
PRD
No Party
61 seats
19 seats
41 seats
Source: Goldman Sachs Global Investment Research
Exhibit 24: 2018 Lower House Composition
5
PRI
PVEM
PANAL
Morena
PES
PAN
PRD
MC
Independent/No Party
13
5
255 seats
60 seats
180 seats
Source: Goldman Sachs Global Investment Research
23 March 2018 18
Goldman Sachs Latin America Economics Analyst

Box 1: Electoral System for the Lower House and Senate
Senators and Lower House lawmakers are elected through a mixed system of proportional representationand State/District level voting. For the Lower House, bench sizes are based on a party’s share of thenational vote (200 seats), and district-level majority representation (300 seats): the most-voted party ineach of the 300 electoral districts elects one Lower House lawmaker. The 200 proportional representationseats are assigned generally without taking account the 300 majority-seats, but a party cannot get moreseats overall than 8% above its result for the proportional representation seats (a party needs to secure42% of the votes for proportional representation seats to reach an overall majority). Finally, a party cannever get more than 300 seats overall, or 60% of the chamber (even if it has more than 52% of the votesfor the proportional representation seats).
According to electoral rules, an absolute majority in the Lower House (251 out of 500 votes) can resultfrom several combinations between the percentage of national vote (proportional representation) and thenumber of electoral districts won (out of 300). With slightly more than 42% of the national vote a partycould obtain the majority of seats if it wins in at least 167 of the 300 districts. In the 128-seat Senate, a65-seat simple majority could be obtained, for instance, through a combination of 42% of the national vote(13 senators), a first-place finish in 20 States (40 senators) and a second-place finish in the remaining 12States (12 senators).
For the Senate, 32 seats are assigned according to the national share of the vote. and the other 96 seatsby a simple majority vote in the 32 States: the most-voted party in each of the 32 States elects twoSenators, and the runner-up (first minority) elects one Senator.
Exhibit 25: Lower House Electoral Method
50
49
48
47
46
45
44
43
42
41
40
39 No absolute majority
38
37
36
35151 153 155 157 159 161 163 165 170 175 180 185 200
Perc
enta
ge o
f nat
iona
l vot
es o
btai
ned
Number of districts won (out of 300)
Combination of districts won and share of national vote yielding absolute majority
Source: INE, Goldman Sachs Global Investment Research
23 March 2018 19
Goldman Sachs Latin America Economics Analyst

The End of an Era for the Dominant PRIAccording to a polling company that conducts robocalls to fixed and mobile numbers(Massive Caller) and which was more accurate than many other pollsters in the State ofMexico election in 2017, in the 32 states in play the PRI-PVEN-Panal coalition is leadingin just 3 states and is running in second place in another 8. This would give it only 14Senators and given its roughly 28% share of the national vote it could elect another 8-9Senators, for a total Senate PRI bench size of just 23 Senators, which would be wellshort of the current 55-seat PRI bench (61 with the PVEM). And it would not take muchfor the PRI’s outlook in the Senate to look even dimmer. After all, in the three states inwhich the PRI is ahead, the lead margin is in all cases less than 1%, and in the 8 statesin which it is currently the runner-up, in four of them the lead margin over the partyrunning in third place is less than 2.5 percentage points. Finally, in the 21 states in whichthe PRI is currently running third or fourth, in only 1 state is the PRI less than 3pts awayfrom getting into second place and elect 1 Senator.
The picture looks a lot brighter for Morena, which currently has no representation in theSenate (the PT coalition partner holds 19 seats). The Morena-PT-PES coalition iscurrently ahead is 12 States (the PAN-PRD-MC is ahead in 15) and in second place in 16(the PAN-PRD-MC in 8).
Exhibit 26: PRI-PVEM-PANAL only leading in 3 states
Morena-PT-PES PAN-PRD-MC PRI-PVEM-PANAL
1st place 12 15 3
2nd place 16 8 8
3rd place 4 8 19
4th place 0 1 2
Source: Massive Caller, Goldman Sachs Global Investment Research
23 March 2018 20
Goldman Sachs Latin America Economics Analyst

Overall, Morena seems bound to do quite well in the legislative elections and toeventually secure the largest individual party bench of legislators; but no party or partyalliance seems likely secure a simple 50% + 1 vote majority in Congress. This couldeventually limit the capacity of a potential AMLO administration to legislatemarket-unfriendly policies and/or reverse some of the recently approved structuralreforms, such as the opening of the oil and gas sectors.
Alberto M. Ramos
Gabriel Fritsch
Exhibit 27: Senate Race
State 1st place 2nd place 3rd placePRI in 1st: margin to 2nd place
PRI in 2nd: margin to 1st place
PRI in 2nd: margin to 3rd place
PRI in 3rd: margin to 2nd place
PRI in 4th: margin to 2nd place
Campeche PRI Morena PAN 0.4Sonora PRI Morena PAN 0.5
Zacatecas PRI Morena PAN 0.8Chiapas Morena PRI PAN -11.1 2.5
Chihuahua PAN PRI Morena -8.8 1.5Hidalgo Morena PRI PAN -0.7 6.2Oaxaca Morena PRI PAN -5.9 14.3Sinaloa Morena PRI Independent -5.3 1.1Tabasco Morena PRI PAN -8.3 8.4Tlaxcala Morena PRI PAN -3.9 1.6YucatÆn PAN PRI Morena -7.1 3.6
Aguascalientes PAN Morena PRI -14.7Baja California PAN Morena PRI -16.7
Baja California Sur Morena PAN PRI -17.4Coahuila PAN Morena PRI -11.9Colima PAN Morena PRI -15.0CDMX Morena PAN PRI -8.2
Durango PAN Morena PRI -4.5Guanajato PAN Morena PRI -2.7Guerrero Morena PAN PRI -4.3
Estado de MØxico Morena PAN PRI -6.0MichoacÆn PAN Morena PRI -4.8
Morelos Morena PAN PRI -10.8Nayarit PAN Morena PRI -18.2Puebla PAN Morena PRI -14.7
Queretaro PAN Morena PRI -8.4Quintana Roo Morena PAN PRI -13.0
San Luis Potosí PAN Morena PRI -15.8Tamaulipas PAN Morena PRI -11.2
Veracruz PAN Morena PRI -12.5Jalisco Independent PAN Morena -7.6
Nuevo León Other PAN Morena -13.4
Average 0.6 -6.4 4.9 -11.1 -10.5
Source: Massive Caller, Goldman Sachs Global Investment Research
23 March 2018 21
Goldman Sachs Latin America Economics Analyst

LatAm and Global Macroeconomic Outlook
Consolidated Latin America Selected Economic Indicators
I. Economic Activity and Prices
Nominal GDP (US$bn) 5,081 5,073 5,218 5,180 4,364 4,163 4,644 4,976 5,390 5,775 6,132Real GDP growth (% yoy) 4.5 2.6 2.8 1.3 0.3 -0.3 1.7 2.6 3.2 3.4 3.3CPI Inflation (% yoy) 7.3 6.6 7.0 8.6 9.0 8.8 6.6 5.5 4.7 3.9 3.6Domestic Demand (% yoy) 5.9 2.8 3.0 1.0 -0.6 -1.2 1.8 3.1 3.5 3.7 3.6
II. External Sector (US$bn)
Current Account Balance -111.6 -122.0 -152.0 -170.1 -139.6 -82.0 -76.6 -108.0 -129.3 -141.3 -155.9 Trade Balance 53.8 46.7 9.8 -3.6 -10.7 34.6 57.0 40.2 30.9 28.1 24.9Gross International Reserves 673.8 722.6 715.9 737.9 705.2 729.3 753.2 784.3 809.2 835.8 861.4 Change in Reserves 109.5 48.8 -6.8 22.0 -32.7 24.1 23.9 31.1 24.9 26.6 25.6Net Capital Inflows 221.1 170.9 145.2 192.0 107.0 106.1 100.5 139.0 154.2 167.9 181.5Foreign Direct Investment 153.4 155.2 167.7 176.0 163.9 150.0 144.6 167.2 179.2 188.5 203.7
III. Public Finance and Indebtness (% GDP)
Primary Fiscal Balance 1.3 0.9 0.5 -1.0 -1.7 -1.8 -1.0 -1.1 -0.5 0.0 0.5Overall Fiscal Balance -2.0 -2.1 -2.5 -4.3 -6.3 -5.6 -4.7 -5.0 -4.6 -4.1 -3.6Total Public Sector Debt 41.4 42.1 42.2 46.2 51.3 55.1 56.3 58.9 60.3 60.8 61.3Total External Debt 22.2 24.7 26.2 29.1 34.4 36.8 35.4 35.8 36.4 36.8 37.0
Note: Aggregates weighted by nominal GDP in US$ at PPP exchange rates.
2017F 2018F 2019F 2020F 2021F2015 201620142011 2012 2013
Source: Goldman Sachs Global Investment Research
Global Macroeconomic Framework
2016 2017F 2018F 2019F 2020F Q1 Q2 Q3 Q4F Q1F Q2F Q3F Q4F
Real GDP Growth (%, yoy)
United States 1.5 2.3 2.6 2.2 1.5 2.0 2.2 2.3 2.5 2.6 2.7 2.6 2.6
Euro Area 1.8 2.5 2.6 2.1 1.6 2.1 2.4 2.8 2.7 2.7 2.6 2.5 2.5
Japan 0.9 1.7 1.6 1.3 0.5 1.4 1.5 1.9 2.0 1.8 1.6 1.5 1.5
World Economy 3.1 3.8 4.1 4.0 3.8 3.5 3.7 4.0 4.1 4.1 4.1 4.0 4.1
CPI Inflation (%, yoy)
United States 0.9 2.1 2.4 2.0 2.1 2.6 1.9 2.0 2.1 2.3 2.7 2.6 2.2
Euro Area 0.2 1.5 1.3 1.1 1.5 1.8 1.5 1.4 1.4 1.4 1.4 1.4 1.2
Japan -0.1 0.5 1.0 1.1 1.5 0.3 0.4 0.6 0.6 0.8 1.0 1.1 1.1
Interest rates (%, e.o.p)
Fed Funds 0.54 1.30 2.38 3.38 3.38 0.79 1.04 1.15 1.30 1.63 1.88 2.13 2.38
UST 10-Years 2.40 2.90 3.25 3.60 3.60 2.50 2.65 2.75 2.90 2.99 3.08 3.16 3.25
2017F 2018F
Source: Goldman Sachs Global Investment Research
23 March 2018 22
Goldman Sachs Latin America Economics Analyst

LatAm Country Data Tables
Argentina
2016 2017 2018F 2019F Economic Recovery UnderwayActivity and Prices Real GDP Growth (% yoy) -1.8 2.9 3.0 3.3Nominal GDP (US$bn) 554 637 642 689Consumer Prices, IPC (yoy, e.o.p.)* N.A 25.0 19.2 13.4Consumer Prices, IPCBA (yoy, e.o.p.)* 41.0 26.1 19.8 13.6External Sector Current Account (% GDP) -2.7 -4.8 -5.9 -5.8Trade Balance (% GDP) 0.8 -0.9 -1.6 -1.6Exports (% yoy) 2.0 0.9 4.6 3.9Imports (% yoy) -7.1 19.6 11.3 5.2Exchange Rate ($/ARS, e.o.p.) 15.9 18.6 21.5 23.2Gross International Reserves (US$bn) 39.3 55.1 68.0 72.0Monetary Sector Monetary Base (% yoy) 26.6 24.7 22.0 17.0 Improving Inflation DynamicsCredit to the Private Sector (% GDP) 13.7 16.0 17.1 17.8Policy Interest Rate 24.75 28.75 22.50 14.00Fiscal Sector **Federal Govt Primary Balance (% GDP) -4.3 -3.9 -3.1 -2.4Federal Govt Overall Balance (% GDP) -5.9 -6.1 -5.6 -5.0Debt Indicators ***Gross Non-fin. Public Sector Debt (% GDP) 49.7 52.3 62.8 64.3 Domestic (% GDP) 27.6 36.1 44.4 45.0 External (% GDP) 13.6 16.2 18.4 19.3Total External Debt (%GDP) 36.3 33.7 36.5 36.4
Source: Goldman Sachs Global Investment Research.
Source: INDEC, Statistical Inst. City of Buenos Aires, Goldman Sachs Global Investment Research.
*IPC computed by INDEC, IPCBA by Statistical Institute City of Buenos Aires. **Before Rents from CB and Anses. Accumulated 4Q. *** Including non-performing debt. Source: INDEC, Statistical Inst. City of Buenos Aires, Goldman Sachs Global
Investment Research.
-1%
0%
1%
2%
3%
4%
5%
6%
7%
15%
20%
25%
30%
35%
40%
45%
50%
Feb-15 Feb-16 Feb-17 Feb-18
Buenos Aires (mom, rhs)National (mom; rhs)Buenos Aires (yoy, lhs)
(mom) (yoy)
-6
-4
-2
0
2
4
6
8
10
-6
-4
-2
0
2
4
6
8
10
12Q1 13Q1 14Q1 15Q1 16Q1 17Q1 18Q1
(%, yoy) (%, yoy)
Forecast
Brazil
2016 2017 2018F 2019F Headline/Core Inflation Continue to ModerateActivity and Prices Real GDP Growth (% yoy) -3.5 1.0 2.5 3.1Nominal GDP (US$bn) 1,806 2,055 2,213 2,360IPCA Inflation (yoy e.o.p) 6.3 2.9 3.9 4.3External Sector Current account (% GDP) -1.3 -0.5 -1.4 -2.0Trade balance (% GDP) 2.5 3.1 2.4 2.0Exports of goods (% yoy) -3.0 17.8 3.8 5.2Imports of goods (% yoy) -19.1 9.9 12.9 10.4Nominal Exchange Rate ($/BRL e.o.p.) 3.26 3.31 3.15 3.20Net International Reserves (US$bn) 365 374 385 395Monetary Sector Copom Cuts Selic Rate by 25bp to 6.50%Monetary base (% yoy) 5.9 9.8 7.0 8.0Credit to the Private Sector (%GDP) 45.9 43.7 44.1 45.9SELIC rate (e.o.p) 13.75 7.00 6.25 8.00Fiscal SectorPublic Sector Primary Balance (% GDP) -2.5 -1.7 -1.9 -0.8Public Sector Nominal Balance (% GDP) -9.0 -7.8 -7.7 -7.3Debt Indicators Gross general govt debt (% GDP) 70.0 74.0 76.0 79.0
Domestic public debt (%GDP) 66.3 0.0 72.5 75.4External public debt (%GDP) 3.6 0.0 3.5 3.6
Total external debt (% GDP) 30.4 26.8 27.1 27.5
Source: Goldman Sachs Global Investment Research.
Sources: Bloomberg; Goldman Sachs Global Investment Research; Haver Analytics; IBGE.
0
3
6
9
12
15
0
3
6
9
12
15
Feb-09 Aug-10 Feb-12 Aug-13 Feb-15 Aug-16 Feb-18
Selic
TJLP
(%) (%)
0.51.52.53.54.55.56.57.58.59.5
10.511.5
Aug-07 Feb-09 Aug-10 Feb-12 Aug-13 Feb-15 Aug-16 Feb-18
IPCA Core (avg 3 measures)
(% yoy; eop)
23 March 2018 23
Goldman Sachs Latin America Economics Analyst

Chile
2016 2017 2018F 2019F Headline/Core Inflation Tracking Below TargetActivity and Prices Real GDP Growth (% yoy) 1.3 1.5 3.8 3.6
Nominal GDP (US$bn) 250 277 326 360
Consumer Prices (% yoy, e.o.p.) 2.7 2.3 2.7 3.0
External Sector Current Account (% GDP) -1.4 -1.5 -1.6 -1.7
Trade Balance (% GDP) 2.2 2.9 2.5 2.2
Exports (% yoy) -2.1 14.0 7.6 4.5
Imports (% yoy) -5.7 10.9 8.0 5.4
Exchange Rate ($/CLP, e.o.p.) 667 615 570 570
Gross International Reserves (US$bn) 40.5 40.5 42.9 43.2
Monetary Sector Central Bank on Hold at 2.50% in MarchBroad Money (M3, % yoy) 8.2 7.0 9.0 9.0
Credit to the Private Sector (% GDP) 81.3 80.8 81.5 82.5
Policy Rate (e.o.p.) 3.50 2.50 3.00 4.00
Fiscal Sector Central Gov’t Primary Balance (% GDP) -2.0 -2.0 -1.2 -0.9
Central Gov’t Overall Balance (% GDP) -2.7 -2.8 -2.1 -1.8
Debt Indicators Central Govt Debt (% GDP) 21.3 23.7 24.5 25.1
Domestic (% GDP) 17.3 19.1 19.3 19.6
External (% GDP) 4.0 4.6 5.3 5.5
Total External Debt (% GDP) 65.5 63.1 57.2 54.8
Source: Goldman Sachs Global Investment Research. Source: Haver Analytics; INE; Central Bank of Chile.
0
2
4
6
8
10
2008 2010 2012 2014 2016 2018
(%)
0
1
2
3
4
5
6
Feb-13 Feb-14 Feb-15 Feb-16 Feb-17 Feb-18
Headline
Core
(%yoy)
Colombia
2016 2017 2018F 2019F Inflation Back to Target RangeActivity and Prices Real GDP Growth (% yoy) 2.0 1.8 2.5 3.3
Nominal GDP (US$bn) 281 309 345 368
Consumer Prices (% yoy, e.o.p.) 5.7 4.1 3.1 3.0
External Sector Current Account (% GDP) -4.3 -3.4 -2.8 -3.1
Trade Balance (% GDP) -3.3 -1.5 -1.7 -1.6
Exports (% yoy) -11.7 15.8 1.4 3.5
Imports (% yoy) -16.9 2.3 3.7 2.8
Exchange Rate ($/COP, e.o.p.) 3001 2984 2800 2800
Gross International Reserves (US$bn) 46.2 47.1 47.4 47.4
Monetary Sector Central Bank Kept Policy Rate On Hold at 4.50% in MarchMonetary Base (% yoy) 2.5 5.0 7.0 9.0
Credit to the Private Sector (% GDP) 49.6 51.2 53.1 54.4
Policy Rate (% e.o.p.) 7.50 4.75 4.00 4.50
Fiscal Sector Central Government Primary Balance (% GDP) -1.3 -0.9 -0.5 0.3
Central Government Overall Balance (% GDP) -3.8 -3.6 -3.2 -2.5
Debt Indicators Gross Non-fin. Public Sector Debt (% GDP) 54.9 54.2 55.6 56.1
Domestic (% GDP) 31.1 32.2 34.6 35.1
External (% GDP) 23.7 22.0 21.0 21.0
Total External Debt (% GDP) 42.5 43.0 43.0 44.0
Source: Goldman Sachs Global Investment Research. Source: Banco de la Repœblica.
1.0
2.0
3.0
4.0
5.0
6.0
7.0
8.0
9.0
Feb-13 Feb-14 Feb-15 Feb-16 Feb-17 Feb-18
HeadlineCore
(% yoy)
2
3
4
5
6
7
8
9
10
2007 2009 2011 2013 2015 2017
(%)
23 March 2018 24
Goldman Sachs Latin America Economics Analyst

Mexico
2016 2017 2018F 2019F Headline Inflation Has Likely PeakedActivity and Prices Real GDP Growth (% yoy) 2.9 2.0 2.1 3.0
Nominal GDP (US$ bn) 1077 1150 1216 1356
Consumer Prices (yoy, e.o.p.) 3.4 6.8 4.0 3.0
External Sector Current Account (% GDP) -2.1 -1.6 -1.6 -1.6
Trade Balance (% GDP) -1.2 -0.9 -0.8 -0.8
Exports (% yoy) -1.7 9.5 4.8 4.9
Imports (% yoy) -2.1 8.6 4.2 5.0
Exchange Rate ($/MXN, e.o.p.) 20.73 19.79 18.50 18.04
Net International Reserves (US$ bn) 176.5 172.8 178.0 188.0
Monetary Sector Monetary Base (% yoy) 14.4 9.0 12.0 12.0 Banxico Raised Policy Rate to 7.50% in FebruaryCredit to the Private Sector (% GDP) 18.0 18.6 19.0 19.2
Tasa de Fondeo Rate (e.o.p.) 5.75 7.25 7.50 6.00
Fiscal SectorPublic Sector Primary Balance (% GDP) -0.1 1.4 0.9 0.9
Public Sector Overall Balance (% GDP) -2.5 -1.1 -2.0 -2.0
Debt IndicatorsGross Federal Govt Debt (% GDP) 48.7 46.1 45.7 45.1
Domestic (% GDP) 30.9 29.1 29.0 28.6
External (% GDP) 17.8 17.0 16.7 16.5
Total External Debt (% GDP) 38.5 39.6 40.9 42.8
Note: *Public Sector Borrowing RequirementsSource: Goldman Sachs Global Investment Research. Source: Haver Analytics; INEGI; Goldman Sachs Global Investment Research.
0
1
2
3
4
5
6
7
8
9
0
1
2
3
4
5
6
7
8
9
Feb-08 Feb-10 Feb-12 Feb-14 Feb-16 Feb-18
(%) (%)
1
2
3
4
5
6
7
Feb-15 Aug-15 Feb-16 Aug-16 Feb-17 Aug-17 Feb-18
HeadlineCore
(% yoy)
Peru
2016 2017 2018F 2019F Headline Inflation Below Target Midpoint
Activity and PricesReal GDP Growth (% yoy) 4.0 2.5 3.2 4.0
Nominal GDP (US$bn) 195 215 235 256
Consumer Prices (% yoy, eop) 3.2 1.4 2.3 3.0
External SectorCurrent Account (% GDP) -2.7 -1.3 -1.7 -1.8
Trade Balance (% GDP) 1.0 2.9 2.0 1.6
Exports (% yoy) 7.6 21.3 1.5 8.3
Imports (% yoy) -5.9 10.0 6.1 10.5
Gross International Reserves (US$bn) 61.7 63.7 63.0 63.6
Exchange Rate ($/PEN, e.o.p.) 3.36 3.24 3.15 3.10
Monetary Sector Central Bank Cut Policy Rate by 25bp to 2.75% in March
Monetary Base (% yoy) 4.1 7.2 19.3 10.5
Credit to the Private Sector (% GDP) 24.3 23.6 27.0 29.0
Reference Interest Rate (e.o.p.) 4.25 3.25 2.75 4.00
Fiscal SectorNon-fin Pub. Sector Primary Balance (% GDP) -1.5 -2.1 -2.3 -1.6
Non-fin Pub. Sector Overall Balance (% GDP) -2.6 -3.2 -3.5 -2.8
Debt IndicatorsTotal Federal Govt Debt (% GDP) 23.8 25.5 27.6 29.1
Domestic Public Debt (% GDP) 13.5 14.6 16.0 17.1
External Public Debt (% GDP) 10.3 10.9 11.6 12.0
Total External Debt (% GDP) 38.2 38.7 39.7 40.3
Source: Goldman Sachs Global Investment Research. Source: BCRP; INEI; Goldman Sachs Global Investment Research.
0
1
2
3
4
5
6
7
0
1
2
3
4
5
6
7
2008 2009 2010 2011 2012 2013 2014 2015 2016 2017 2018
(% ) (% )
0
1
2
3
4
5
6
Feb-13 Feb-14 Feb-15 Feb-16 Feb-17 Feb-18
HeadlineCore
(% yoy)
23 March 2018 25
Goldman Sachs Latin America Economics Analyst

Venezuela
2015F 2016F 2017F 2018F From Recession to Depression (GDP yoy)Activity and Prices Real GDP Growth (% yoy) -6.2 -16.5 -12.1 -6.0
Nominal GDP (US$bn)* 243 236 215 208
Consumer Prices (yoy, e.o.p.) 180.9 294.4 920.4 841.1
External Sector Current Account (% GDP)* -7.5 -3.7 -0.7 0.6
Trade Balance (% GDP)* 0.2 2.8 5.8 7.0
Exports (% yoy) -50.0 -33.0 22.2 11.3
Imports (% yoy) -26.9 -46.8 -1.8 7.3
Exchange Rate ($/VEF, e.o.p.) 6.3 10.0 10.0 25.0
Gross International Reserves (US$bn) 16.4 11.0 8.7 7.0
Monetary Sector Source: BCV; Goldman Sachs Global Investment Research.
Monetary Base (% yoy) 111 160 180 150 Unstable Inflation DynamicsCredit to the Private Sector (% GDP) 17.1 8.8 3.0 0.7
90-day Deposit Rate (e.o.p.) 15.1 15.5 17.0 21.0
Fiscal Sector**Public Sector Primary Balance (% GDP) -15.6 -15.6 -16.4 -16.6
Public Sector Overall Balance (% GDP) -17.7 -17.8 -18.5 -18.7
Debt Indicators Total Public Sector Debt (% GDP)* 87.8 100.2 132.2 112.4
Domestic (% GDP)* 37.5 43.1 66.3 41.2
External (% GDP)* 50.3 57.1 66.0 71.2
Total External Debt (%GDP)* 57.7 64.5 73.8 79.6
Source: BCV; Goldman Sachs Global Investment Research.Source: Goldman Sachs Global Investment Research. *Based on IMF Nominal US$ GDP due to FX distortions** Restricted Public Sector
-12
-10
-8
-6
-4
-2
0
2
4
6
-12
-10
-8
-6
-4
-2
0
2
4
6
1Q11 1Q12 1Q13 1Q14 1Q15
(% yoy)
0
2
4
6
8
10
12
14
020406080
100120140160180200
Jan-13 Jun-13 Nov-13 Apr-14 Sep-14 Feb-15 Jul-15 Dec-15
Headline mom (rhs)
Headline (lhs)
(% yoy) (% mom)
LAIT-5 Annual Headline and Core Inflation Dynamics Since January 2016
0.0
1.0
2.0
3.0
4.0
5.0
6.0
7.0
8.0
9.0
10.0
11.0
12.0
Hea
dlin
e
Cor
e
Hea
dlin
e
Cor
e
Hea
dlin
e
Cor
e
Hea
dlin
e
Cor
e
Hea
dlin
e
Cor
e
Brazil Chile Colombia Mexico Peru
(yoy, %) Min-Max Range
Feb-18 25-75th percentile
IT Range
Source: Haver Analytics, Goldman Sachs Global Investment Research
23 March 2018 26
Goldman Sachs Latin America Economics Analyst
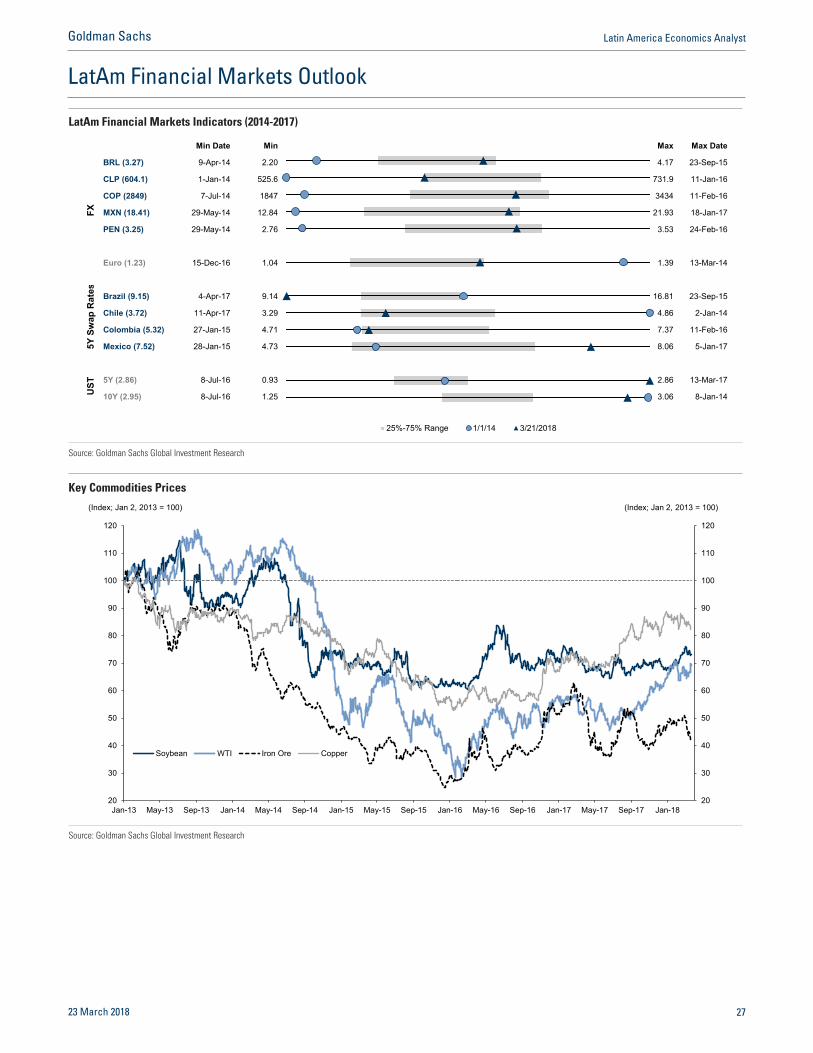
LatAm Financial Markets Outlook
LatAm Financial Markets Indicators (2014-2017)
Min Date Min Max Max Date
BRL (3.27) 9-Apr-14 2.20 4.17 23-Sep-15
CLP (604.1) 1-Jan-14 525.6 731.9 11-Jan-16
COP (2849) 7-Jul-14 1847 3434 11-Feb-16
MXN (18.41) 29-May-14 12.84 21.93 18-Jan-17
PEN (3.25) 29-May-14 2.76 3.53 24-Feb-16
Euro (1.23) 15-Dec-16 1.04 1.39 13-Mar-14
Brazil (9.15) 4-Apr-17 9.14 16.81 23-Sep-15
Chile (3.72) 11-Apr-17 3.29 4.86 2-Jan-14
Colombia (5.32) 27-Jan-15 4.71 7.37 11-Feb-16
Mexico (7.52) 28-Jan-15 4.73 8.06 5-Jan-17
5Y (2.86) 8-Jul-16 0.93 2.86 13-Mar-17
10Y (2.95) 8-Jul-16 1.25 3.06 8-Jan-14
FX5Y
Sw
ap R
ates
UST
25%-75% Range 1/1/14 3/21/2018
Source: Goldman Sachs Global Investment Research
Key Commodities Prices
20
30
40
50
60
70
80
90
100
110
120
20
30
40
50
60
70
80
90
100
110
120
Jan-13 May-13 Sep-13 Jan-14 May-14 Sep-14 Jan-15 May-15 Sep-15 Jan-16 May-16 Sep-16 Jan-17 May-17 Sep-17 Jan-18
Soybean WTI Iron Ore Copper
(Index; Jan 2, 2013 = 100) (Index; Jan 2, 2013 = 100)
Source: Goldman Sachs Global Investment Research
23 March 2018 27
Goldman Sachs Latin America Economics Analyst

Latin America Swap Rates
End-2016 End-2017 Current (03/21/2018) End-2016 End-2017
Brazil
2y 11.05 8.06 7.62 -342 -44
10y 11.66 10.78 9.81 -185 -97
Chile
2y 3.06 2.84 3.05 -2 21
10y 4.17 4.24 4.26 9 2
Colombia
2y 5.61 4.44 4.59 -102 15
10y 6.57 6.10 6.15 -42 6
Mexico
2y 7.20 8.02 7.68 47 -35
10y 7.93 7.98 7.81 -13 -18
United States
2y 1.45 2.08 2.63 117 55
10y 2.34 2.42 2.93 59 51
Swap Rates (%)
Change Since (bps)
Source: Goldman Sachs Global Investment Research
Latin America Forecasts
Current 1Q2018 2Q2018 3Q2018 4Q2018 1Q2018 2Q2018 3Q2018 4Q2018
Brazil 6.50 6.50 6.25 6.25 6.25 0 -25 -25 -25
Chile 2.50 2.50 2.50 2.50 3.00 0 0 0 50
Colombia 4.50 4.50 4.00 4.00 4.00 0 -50 -50 -50
Mexico 7.50 7.50 7.50 7.50 7.50 0 0 0 0
Peru 2.75 2.75 2.75 2.75 2.75 0 0 0 0
Brazil 3.31 3.10 3.12 3.13 3.15 -6.5% -6.0% -5.6% -5.1%
Chile 609.10 601.5 593.3 583.3 570.0 -1.3% -2.6% -4.2% -6.4%
Colombia 2850.69 2815 2800 2800 2800 -1.3% -1.8% -1.8% -1.8%
Mexico 18.64 19.50 19.50 19.00 18.50 4.6% 4.6% 2.0% -0.7%
Peru 3.26 3.24 3.18 3.17 3.15 -0.6% -2.3% -2.9% -3.4%
Argentina 20.22 20.00 20.50 21.00 21.50 -1.1% 1.4% 3.9% 6.3%
Venezuela 43912.50 10.00 10.00 25.00 25.00 -100.0% -100.0% -99.9% -99.9%
FX (Local / USD)
Policy Rates (%)
Policy Rates and FX Levels (End of Period) Implied Change by (Rates in bp; FX in %)
Source: Goldman Sachs Global Investment Research
23 March 2018 28
Goldman Sachs Latin America Economics Analyst
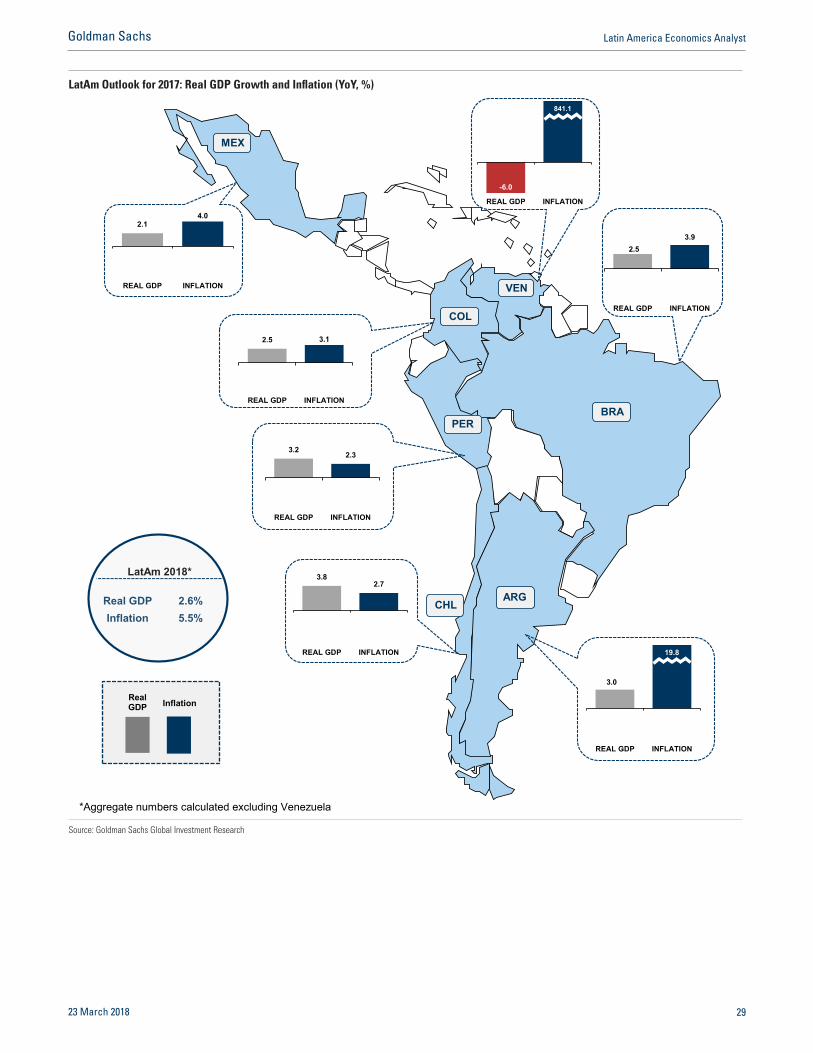
LatAm Outlook for 2017: Real GDP Growth and Inflation (YoY, %)
Real GDP 2.6%Inflation 5.5%
*Aggregate numbers calculated excluding Venezuela
LatAm 2018*
Inflation Real GDP
ARG CHL
COL
PER
VEN
MEX
BRA
2.5 3.9
REAL GDP INFLATION
3.0
19.8
REAL GDP INFLATION
3.8 2.7
REAL GDP INFLATION
3.2 2.3
REAL GDP INFLATION
2.5 3.1
REAL GDP INFLATION
-6.0
841.1
REAL GDP INFLATION
2.1 4.0
REAL GDP INFLATION
Source: Goldman Sachs Global Investment Research
23 March 2018 29
Goldman Sachs Latin America Economics Analyst

LatAm Outlook for 2017: Current Account and Fiscal Deficit (% of GDP)
CA Deficit 2.1%Fiscal Deficit 5.0%
*Aggregate numbers calculated excluding Venezuela
LatAm 2018*
Fiscal Deficit
Current Account Deficit
ARG CHL
COL
PER
VEN
MEX
BRA
1.4
7.7
CA Deficit Fiscal Deficit
5.9 5.6
CA Deficit Fiscal Deficit
1.6 2.1
CA Deficit Fiscal Deficit
1.7
3.5
CA Deficit Fiscal Deficit
2.8 3.2
CA Deficit Fiscal Deficit
-0.6
18.7
CA Deficit Fiscal Deficit
1.6 2.0
CA Deficit Fiscal Deficit
Source: Goldman Sachs Global Investment Research
23 March 2018 30
Goldman Sachs Latin America Economics Analyst

Forthcoming Data Releases
mom/qoq yoy mom/qoq yoy
27-Mar 16:00 Monetary Policy Meeting Mar 27.25% 27.25%28-Mar 15:00 Industrial Production Feb 6.90% 2.60%28-Mar 15:00 Economic Activity Index (yoy nsa) Jan 3.10% 0.60% 2.00%03-Apr - Tax Collection Mar ARS$235.6
27-Mar 7:00 Minutes of MPC Meeting Mar28-Mar 7:00 IGP-M Inflation Mar 0.70% 0.26% 0.07% -0.42%28-Mar 9:30 Primary Budget Balance Feb -R$20.0bn +R$$49.6bn29-Mar 9:30 Quarterly Inflation Report 1Q1829-Mar 8:00 Unemployment Rate Feb 12.60% 12.20%02-Apr 9:30 Trade Balance Mar US$6.3bn US$4.9bn03-Apr 8:00 Industrial Production Feb 0.70% -2.40% 5.70%
29-Mar 8:00 Manufacturing Production Feb 6.50% 5.70%29-Mar 8:00 Unemployment Rate Mar 6.50% 6.50%03-Apr 8:00 Retail Sales Feb 6.00% 3.80%05-Apr 7:30 IMACEC Feb 5.50% 0.80% 3.90%06-Apr 7:00 Consumer Price Index Mar 0.30% 1.90% 0.00% 2.00%
05-Apr 20:00 Consumer Price Index Mar 0.37% 3.27% 0.71% 3.37%06-Apr 14:00 Minutes of MPC Meeting Mar
26-Mar 11:00 Retail Sales Jan -0.50% -0.50% -2.00%27-Mar 11:00 Trade Balance Feb -US$4408mn27-Mar 11:00 Unemployment Rate Feb 3.15% 3.39%28-Mar 12:00 Bank Lending Feb02-Apr 11:00 Workers Remittances Feb US$2.20bn US$2.22bn05-Apr 10:00 Consumer Confidence Mar 82.005-Apr 10:00 Gross Fixed Investment Jan 0.50% 4.00% -0.40%
01-Apr 1:00 Consumer Price Index Mar 0.70% 0.58% 0.25% 1.18%
Argentina
Brazil
Colombia
Mexico
Peru
Date Time Economic Indicator PeriodForecast Previous
Chile
Source: Goldman Sachs Global Investment Research
23 March 2018 31
Goldman Sachs Latin America Economics Analyst

Calendar of Economic and Political Events
Date Forthcoming Events Comment
Argentina
27-Mar MPC Meeting Given unanchored inflation expectations and still intense inflationary pressures the centralbank is likely hold again; leaving the policy rate (7-day repo rate) unchanged at 27.25%.
Brazil
16-May COPOM Meeting The forward guidance suggest the Copom is very likely to cut the Selic policy rate byanother 25bp to a new record low 6.25%.
Chile
3-May MPC Meeting We expect BCCh to hold the policy rate at 2.50% through 3Q2018 and start normalizingmonetary policy in 4Q2018.
Colombia
4-Jan MPC Meeting We expect Banrep to cut the policy rate by 25bp to at 4.25%.
27-May Presidential Elections After a strong showing from right and center-right parties in the March 11 Congressionalelections, market-friendly candidate IvÆn Duque (Centro DemocrÆtico) is now leading thepolls, ahead of leftist candidate and former mayor of BogotÆ Gustavo Petro (MovimientoColombia Humana).
Mexico
12-Apr MPC Meeting Barring new negative shocks to inflation (actual and/or expected), if the MXN remains wellanchored, and the market digests well the expected +25bp FOMC March hike, the MPC willlikely decouple from the FOMC and remain on hold at 7.50%.
1-Jul Presidential and Congressional Elections
On July 1, voters will elect a new president and Congress (500 Lower Houserepresentatives and 128 senators). A number of state and local elections will also take place(gubernatorial, mayoral, and state legislations). AndrØs Manuel López Obrador (AMLO) ofthe Morena-PT-PES coalition is enjoying a solid lead in the polls for the presidential race,followed by Ricardo Anaya (PAN-PRD-MC) and JosØ Antonio Meade (PRI-PVEM-PANAL).
Peru
12-Apr MPC meeting We expect BCRP to keep the policy rate at 2.75%.
Source: Goldman Sachs Global Investment Research
23 March 2018 32
Goldman Sachs Latin America Economics Analyst

Disclosure Appendix
Reg ACWe, Alberto Ramos, Paulo Mateus and Gabriel Fritsch, hereby certify that all of the views expressed in this report accurately reflect our personal views,which have not been influenced by considerations of the firm’s business or client relationships.
Unless otherwise stated, the individuals listed on the cover page of this report are analysts in Goldman Sachs’ Global Investment Research division.
DisclosuresGlobal product; distributing entitiesThe Global Investment Research Division of Goldman Sachs produces and distributes research products for clients of Goldman Sachs on a global basis.Analysts based in Goldman Sachs offices around the world produce equity research on industries and companies, and research on macroeconomics,currencies, commodities and portfolio strategy. This research is disseminated in Australia by Goldman Sachs Australia Pty Ltd (ABN 21 006 797 897); inBrazil by Goldman Sachs do Brasil Corretora de Títulos e Valores Mobiliários S.A.; Ombudsman Goldman Sachs Brazil: 0800 727 5764 and / [email protected]. Available Weekdays (except holidays), from 9am to 6pm. Ouvidoria Goldman Sachs Brasil: 0800 727 5764 e/[email protected]. Horário de funcionamento: segunda-feira à sexta-feira (exceto feriados), das 9h às 18h; in Canada by either GoldmanSachs Canada Inc. or Goldman Sachs & Co. LLC; in Hong Kong by Goldman Sachs (Asia) L.L.C.; in India by Goldman Sachs (India) Securities PrivateLtd.; in Japan by Goldman Sachs Japan Co., Ltd.; in the Republic of Korea by Goldman Sachs (Asia) L.L.C., Seoul Branch; in New Zealand by GoldmanSachs New Zealand Limited; in Russia by OOO Goldman Sachs; in Singapore by Goldman Sachs (Singapore) Pte. (Company Number: 198602165W);and in the United States of America by Goldman Sachs & Co. LLC. Goldman Sachs International has approved this research in connection with itsdistribution in the United Kingdom and European Union.
European Union: Goldman Sachs International authorised by the Prudential Regulation Authority and regulated by the Financial Conduct Authority andthe Prudential Regulation Authority, has approved this research in connection with its distribution in the European Union and United Kingdom; GoldmanSachs AG and Goldman Sachs International Zweigniederlassung Frankfurt, regulated by the Bundesanstalt für Finanzdienstleistungsaufsicht, may alsodistribute research in Germany.
General disclosuresThis research is for our clients only. Other than disclosures relating to Goldman Sachs, this research is based on current public information that weconsider reliable, but we do not represent it is accurate or complete, and it should not be relied on as such. The information, opinions, estimates andforecasts contained herein are as of the date hereof and are subject to change without prior notification. We seek to update our research asappropriate, but various regulations may prevent us from doing so. Other than certain industry reports published on a periodic basis, the large majorityof reports are published at irregular intervals as appropriate in the analyst’s judgment.
Goldman Sachs conducts a global full-service, integrated investment banking, investment management, and brokerage business. We have investmentbanking and other business relationships with a substantial percentage of the companies covered by our Global Investment Research Division.Goldman Sachs & Co. LLC, the United States broker dealer, is a member of SIPC (http://www.sipc.org).
Our salespeople, traders, and other professionals may provide oral or written market commentary or trading strategies to our clients and principaltrading desks that reflect opinions that are contrary to the opinions expressed in this research. Our asset management area, principal trading desks andinvesting businesses may make investment decisions that are inconsistent with the recommendations or views expressed in this research.
The analysts named in this report may have from time to time discussed with our clients, including Goldman Sachs salespersons and traders, or maydiscuss in this report, trading strategies that reference catalysts or events that may have a near-term impact on the market price of the equity securitiesdiscussed in this report, which impact may be directionally counter to the analyst’s published price target expectations for such stocks. Any suchtrading strategies are distinct from and do not affect the analyst’s fundamental equity rating for such stocks, which rating reflects a stock’s returnpotential relative to its coverage group as described herein.
We and our affiliates, officers, directors, and employees, excluding equity and credit analysts, will from time to time have long or short positions in, actas principal in, and buy or sell, the securities or derivatives, if any, referred to in this research.
The views attributed to third party presenters at Goldman Sachs arranged conferences, including individuals from other parts of Goldman Sachs, do notnecessarily reflect those of Global Investment Research and are not an official view of Goldman Sachs.
Any third party referenced herein, including any salespeople, traders and other professionals or members of their household, may have positions in theproducts mentioned that are inconsistent with the views expressed by analysts named in this report.
This research is not an offer to sell or the solicitation of an offer to buy any security in any jurisdiction where such an offer or solicitation would beillegal. It does not constitute a personal recommendation or take into account the particular investment objectives, financial situations, or needs ofindividual clients. Clients should consider whether any advice or recommendation in this research is suitable for their particular circumstances and, ifappropriate, seek professional advice, including tax advice. The price and value of investments referred to in this research and the income from themmay fluctuate. Past performance is not a guide to future performance, future returns are not guaranteed, and a loss of original capital may occur.Fluctuations in exchange rates could have adverse effects on the value or price of, or income derived from, certain investments.
Certain transactions, including those involving futures, options, and other derivatives, give rise to substantial risk and are not suitable for all investors.Investors should review current options disclosure documents which are available from Goldman Sachs sales representatives or athttp://www.theocc.com/about/publications/character-risks.jsp. Transaction costs may be significant in option strategies calling for multiple purchase andsales of options such as spreads. Supporting documentation will be supplied upon request.
Differing Levels of Service provided by Global Investment Research:The level and types of services provided to you by the Global InvestmentResearch division of GS may vary as compared to that provided to internal and other external clients of GS, depending on various factors including yourindividual preferences as to the frequency and manner of receiving communication, your risk profile and investment focus and perspective (e.g.,marketwide, sector specific, long term, short term), the size and scope of your overall client relationship with GS, and legal and regulatory constraints.As an example, certain clients may request to receive notifications when research on specific securities is published, and certain clients may requestthat specific data underlying analysts’ fundamental analysis available on our internal client websites be delivered to them electronically through datafeeds or otherwise. No change to an analyst’s fundamental research views (e.g., ratings, price targets, or material changes to earnings estimates forequity securities), will be communicated to any client prior to inclusion of such information in a research report broadly disseminated through electronicpublication to our internal client websites or through other means, as necessary, to all clients who are entitled to receive such reports.
23 March 2018 33
Goldman Sachs Latin America Economics Analyst

All research reports are disseminated and available to all clients simultaneously through electronic publication to our internal client websites. Not allresearch content is redistributed to our clients or available to third-party aggregators, nor is Goldman Sachs responsible for the redistribution of ourresearch by third party aggregators. For research, models or other data related to one or more securities, markets or asset classes (including relatedservices) that may be available to you, please contact your GS representative or go to http://360.gs.com.
Disclosure information is also available at http://www.gs.com/research/hedge.html or from Research Compliance, 200 West Street, New York, NY10282.
© 2018 Goldman Sachs.
No part of this material may be (i) copied, photocopied or duplicated in any form by any means or (ii) redistributed without the prior writtenconsent of The Goldman Sachs Group, Inc.
23 March 2018 34
Goldman Sachs Latin America Economics Analyst