Crummy Cracker Company: Exercises for … Cracker Company: Exercises for managerial accounting...
32
Journal of Business Cases and Applications Crummy Cracker Company, page 1 Crummy Cracker Company: Exercises for managerial accounting Gerald M. Myers Pacific Lutheran University ABSTRACT The Crummy Cracker Company is a fictitious case designed to give students practice working with several of the concepts and tools encountered in a typical undergraduate managerial accounting course. The problems use a common data set and focus on the transition from financial accounting, cost classifications breakeven analysis, alternative income statement formats, operational budgeting and decision making. Keywords: managerial accounting, cost behavior, breakeven analysis, budgeting Note: This is a fictitious case developed for educational use. All statements, names, numbers, dates, etc. used herein were created for the purposes of this case and should not be construed as factual. Copyright statement: Authors retain the copyright to the manuscripts published in AABRI journals. Please see the AABRI Copyright Policy at http://www.aabri.com/copyright.html.
Transcript of Crummy Cracker Company: Exercises for … Cracker Company: Exercises for managerial accounting...

Journal of Business Cases and Applications
Crummy Cracker Company, page 1
Crummy Cracker Company: Exercises for managerial accounting
Gerald M. Myers
Pacific Lutheran University
ABSTRACT
The Crummy Cracker Company is a fictitious case designed to give students practice
working with several of the concepts and tools encountered in a typical undergraduate
managerial accounting course. The problems use a common data set and focus on the transition
from financial accounting, cost classifications breakeven analysis, alternative income statement
formats, operational budgeting and decision making.
Keywords: managerial accounting, cost behavior, breakeven analysis, budgeting
Note: This is a fictitious case developed for educational use. All statements, names, numbers,
dates, etc. used herein were created for the purposes of this case and should not be construed as
factual.
Copyright statement: Authors retain the copyright to the manuscripts published in AABRI
journals. Please see the AABRI Copyright Policy at http://www.aabri.com/copyright.html.

Journal of Business Cases and Applications
Crummy Cracker Company, page 2
INTRODUCTION TO THE STUDENT
This series of problems is designed to give you practice working with several of the
concepts and tools encountered in a typical undergraduate managerial accounting course. As is
evident from the title, the focus is on a fictitious small business selling a readily recognizable
item—crackers. Why focus on small businesses? Well, small businesses are familiar. The local
non-chain burger joint, the dry cleaner, your favorite spot to hang out with friends, and the
mechanic who fixes your car are all probably small businesses. Furthermore, Exxon’s mega
millions are simply beyond our frame of reference; it is hard to imagine financial numbers that
big. Finally, if someone in your family owns a small business, the sorts of issues in these
exercises may well be the subject of conversation around the dinner table at home; for those with
such a background, much of what follows may be familiar territory.
The problems that follow use a common data set. One advantage to the use of a common
set of data is that, with repeated use of the same data, the concepts and tools of managerial
accounting begin to make a little more sense. It becomes more obvious how the pieces of the
puzzle fit together and one sees the business in the larger context of the variety of problems and
issues facing a small business owner. The materials that follow are not a substitute for a
textbook, class attendance, participation in on-line learning sessions, or whatever other materials
your instructor may use.
Here is an overview of the modules that follow.
1. The first section focuses on the balance sheet. What will the balance sheet look like and how
will it change as a prospective small business owner invests in the business, gets a loan from
the bank and acquires assets? Obtaining a loan from the bank carries with it the presumption
of repayment, one of the exercises in this section involves setting up a mortgage amortization
table; the table will enable the Stevensons to determine how much principle and interest will
be repaid each month.
2. The next topic is costs, cost classifications, and where different kinds of costs show up on the
income statement.
3. There are two different income statement formats: absorption costing and variable costing.
Absorption costing is required for GAAP. Under absorption costing, fixed manufacturing
overhead is allocated to production, capitalized in inventory, and written off with cost of
goods sold. For internal decision making purposes, variable costing is often used; under
variable costing, only the variable costs of production are charged to inventory and expensed
through cost of goods sold. Fixed manufacturing overhead is expensed as a lump sum.
4. The next topic is operational budgeting, which is the development of comprehensive
projections of sales, expenses, cash flows, and the impact of transactions on the balance sheet
and the income statement.
5. One of the major topics covered in a managerial accounting course is incremental analysis
and decision making. Decisions about pricing, production and distribution can have a
significant impact on profitability. This section provides some examples of those decisions in
the context of the Crummy Cracker Company.
6. The final section focuses on variance analysis and performance evaluation. The case “fast-
forwards” to the end of Crummy Cracker’s first year of operations and see how they did.
Was net income higher or lower than expected? Why? There are numerous reasons why
income might be different from what was expected. Revenues might be higher [or lower]

Journal of Business Cases and Applications
Crummy Cracker Company, page 3
because more [or fewer] boxes of crackers were sold than anticipated. If they sold more
because the price was reduced, did they sell enough more crackers to offset the revenue lost
because they cut the price? These are some of the issues covered in this section.
PART 1: BALANCE SHEET RELATIONSHIPS
The objectives of this first unit are to [1] establish the context for the exercises that
follow, [2] to review the basics of balance sheet relationships, and [3] to illustrate the use of
Excel to calculate a mortgage payment and to create a mortgage amortization table.
Context: George Stevenson and his brother Bob have decided to form a new business—
the Crummy Cracker Company. This fictitious setting provides an opportunity to discuss many
of the issues covered in an introductory managerial accounting course. The first unit follows
George and Bob as they go through the steps necessary to get the business started. Because our
focus is on the accounting impact of each step, time is compressed. Getting a business like this
started would realistically take several months, so several simplifying assumptions are added.
The case assumes that they get everything done in a week. Let’s follow George and Bob as they
get the business started.
Early on December 26th
, 2011, the Stevensons invested $65,000 in the business. Later
that day, the Stevensons filed the necessary legal papers to incorporate their business in the state
of Washington. George wrote a check to cover the $2,000 in legal costs and other fees associated
with the preparation of the firm’s articles of incorporation.
Balance sheet #1: Use the template on the next page to prepare a balance sheet as of the
end of the day on December 26th
. Hint: Note that startup costs are not the same as an investment
in the firm or the use of invested funds to acquire capital assets. Work through the following
definitions to be sure you understand the difference between these concepts. They are things that
often give students trouble.
Investment: The investor exchanges money [or some other asset] for an ownership share
in the firm. Investment in the firm increases the firm’s assets and increases the equity in
the firm.
Capital assets: The firm uses invested or borrowed funds [= “money”] to acquire physical
stuff, such as buildings, land, machinery, rights to patents, or whatever. If cash is spent
for capital assets, total assets stay the same—they have just exchanged one type of asset
for another. If capital assets are acquired through the use of debt, both debt and assets
increase in equal amounts.
Startup costs: The firm spends money to do things [other than acquire capital assets] up
front before they actually open the door. The legal expenses are what are called a
“startup” cost—a one-time outlay required to get the business started. Other examples of
startup costs would include things like research about potential markets and the viability
of a particular business or business location, advertising prior to opening the business, or
wages and salaries incurred prior to the opening of the business. Under GAAP, startup
costs must be expensed as they are incurred. The major difference between startup costs
and investments is that startup costs are individually relatively small in amount and not
expenditures for capital assets—land, buildings, machinery, equipment, etc.
Expenses: Expenses represent the recurring consumption of a resource. They may be
outlays of cash [e.g., for rent, payroll, office supplies, or any number of other things] or

Journal of Business Cases and Applications
Crummy Cracker Company, page 4
they may be noncash recognition of the declining value of an asset [e.g., depreciation on
machinery or amortization of patents]. They major difference between startup costs and
expenses is that expenses are recurring; startup costs happen once.
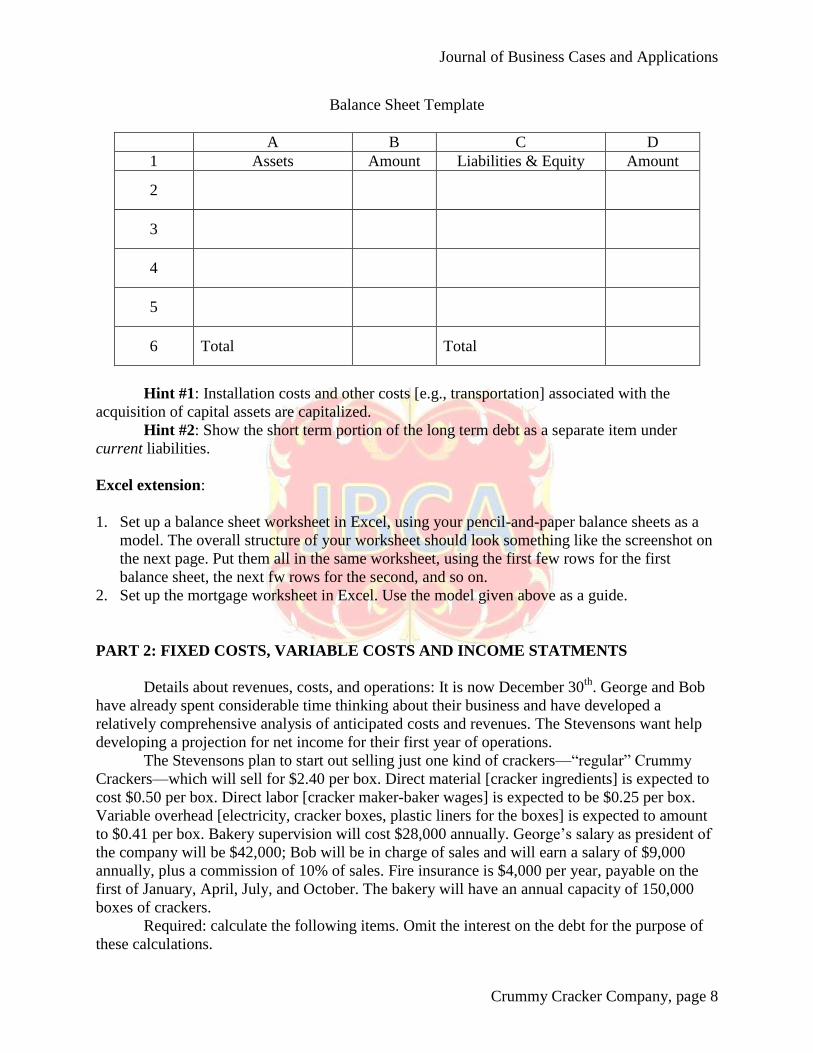
Balance Sheet Template
A B C D
1 Assets Amount Liabilities & Equity Amount
2
3
4
5
6 Total Total
On December 27h, George and Bob went to the First Last and Only National Bank of
Parkland, and because of their excellent credit ratings, were immediately able to secure a
$35,000, 5-year term loan at 8% annual interest to finance the start up of the business. The bank
transferred the proceeds of the loan directly into the company's bank account.
Balance sheet #2: Create a new balance sheet to reflect the situation at the end of the day
on December 27th
. Use the template below.
Balance Sheet Template
A B C D
1 Assets Amount Liabilities & Equity Amount
2
3
4
5
6 Total Total
About that mortgage
Late on December 27th
, as they drove home from the bank, George and Bob began to
wonder [and worry] about the size of the mortgage payment they would have to make for the

Journal of Business Cases and Applications
Crummy Cracker Company, page 5
$35,000 loan. They called us as soon as they got home and asked for help. The mortgage
calculations can be done on a financial calculator; this section illustrates the mechanics of setting
up the calculations in Excel.
Determining the monthly payment: Open a new worksheet in the same Excel workbook
as your balance sheets; rename the worksheet “Mtge” [no quotes]. Set up a worksheet that looks
like the screenshot below. Don’t worry about the shading and cross-hatching. That formatting is
used simply to indicate that those cells are blank. Note that CELL REFERENCING has been
used for all the calculations and for any information that was entered previously [like the amount
of the loan]. Note also that items are labeled in the cells to the left so that the amounts entered
can be used later in calculations.
The arguments for the =PMT( ) function are the interest rate, the number of periods over
which the debt will be repaid, and the original amount borrowed. It is important that the number
of payment periods and the interest rate be consistent. The Stevensons are making monthly
payments over 5 years, or 60 monthly payments; therefore, cell E5 will return a value of 60.
Since the payments are monthly, it is essential to use a monthly interest rate; cell E4 will return a
value of 0.67% or 0.00666666666667. Finally, use of the –C3 in cell C6 returns the payment as a
positive number. The folks who wrote the code for Excel elected to make the “normal” result
from the =PMT( ) function negative, presumably because the amount is typically a payment.
However, this can create problems unless you have your brain programmed to enter all payments
as negative values. To avoid this, simply force the function to give an unsigned value, thus
eliminating the possibility of a “sign” error in later calculations. The cell references in the top of
the mortgage worksheet looks like this:
After you are finished, your mortgage worksheet should look like the screenshot below.
Make corrections in your worksheet as necessary.

Journal of Business Cases and Applications
Crummy Cracker Company, page 6
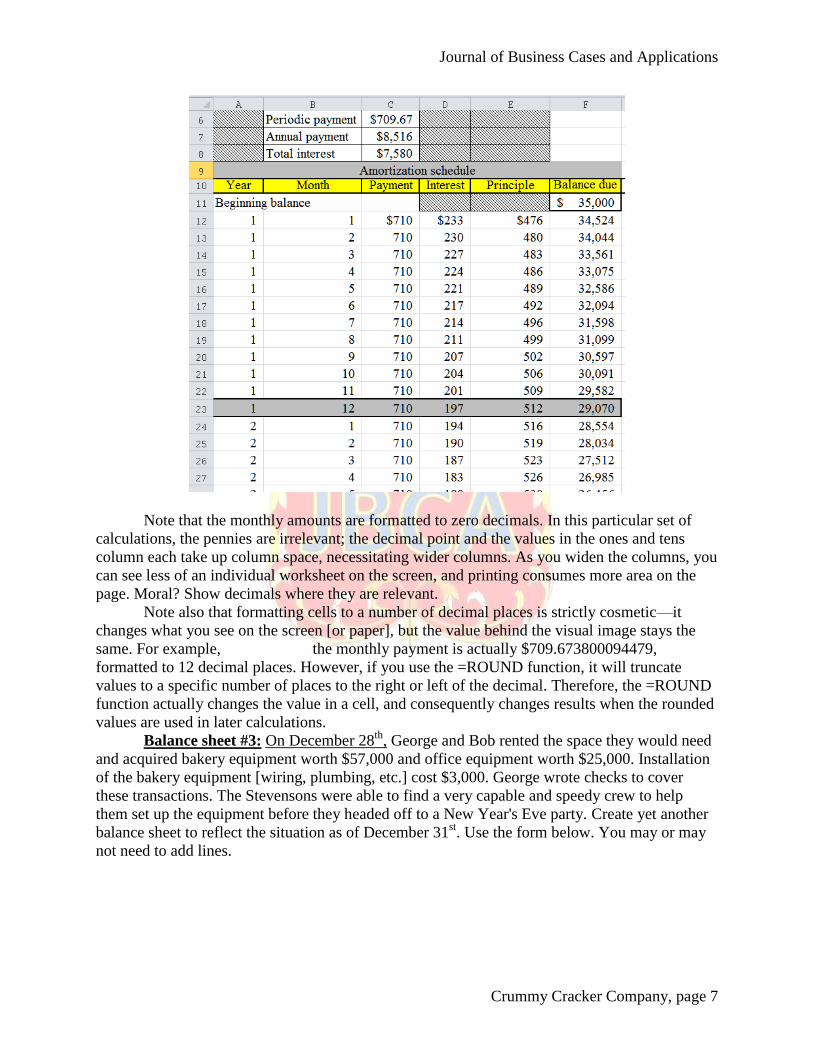
Setting up a mortgage amortization table: Now they know the total annual payment, but
George and Bob want to know how that breaks down between principle and interest. Let’s create
a mortgage amortization table for the Crummy Cracker Company. The screenshot below is in the
Mtge worksheet, starting with row 9. Once you have filled in row 13, the appropriate
combination of absolute and relative cell referencing enables you to simply copy columns C, D,
E, and F down and complete the entire table. Row 22 is highlighted in gray shading because it is
the 12th
month and therefore the end of year 1. Row 23 starts the next year.
The formulas in the screenshot above yield the numerical results in the screenshot below.
Journal of Business Cases and Applications
Crummy Cracker Company, page 7
Note that the monthly amounts are formatted to zero decimals. In this particular set of
calculations, the pennies are irrelevant; the decimal point and the values in the ones and tens
column each take up column space, necessitating wider columns. As you widen the columns, you
can see less of an individual worksheet on the screen, and printing consumes more area on the
page. Moral? Show decimals where they are relevant.
Note also that formatting cells to a number of decimal places is strictly cosmetic—it
changes what you see on the screen [or paper], but the value behind the visual image stays the
same. For example, the monthly payment is actually $709.673800094479,
formatted to 12 decimal places. However, if you use the =ROUND function, it will truncate
values to a specific number of places to the right or left of the decimal. Therefore, the =ROUND
function actually changes the value in a cell, and consequently changes results when the rounded
values are used in later calculations.
Balance sheet #3: On December 28th
, George and Bob rented the space they would need
and acquired bakery equipment worth $57,000 and office equipment worth $25,000. Installation
of the bakery equipment [wiring, plumbing, etc.] cost $3,000. George wrote checks to cover
these transactions. The Stevensons were able to find a very capable and speedy crew to help
them set up the equipment before they headed off to a New Year's Eve party. Create yet another
balance sheet to reflect the situation as of December 31st. Use the form below. You may or may
not need to add lines.
Journal of Business Cases and Applications
Crummy Cracker Company, page 8
Balance Sheet Template
A B C D
1 Assets Amount Liabilities & Equity Amount
2
3
4
5
6 Total Total
Hint #1: Installation costs and other costs [e.g., transportation] associated with the
acquisition of capital assets are capitalized.
Hint #2: Show the short term portion of the long term debt as a separate item under
current liabilities.
Excel extension:
1. Set up a balance sheet worksheet in Excel, using your pencil-and-paper balance sheets as a
model. The overall structure of your worksheet should look something like the screenshot on
the next page. Put them all in the same worksheet, using the first few rows for the first
balance sheet, the next fw rows for the second, and so on.
2. Set up the mortgage worksheet in Excel. Use the model given above as a guide.
PART 2: FIXED COSTS, VARIABLE COSTS AND INCOME STATMENTS
Details about revenues, costs, and operations: It is now December 30th
. George and Bob
have already spent considerable time thinking about their business and have developed a
relatively comprehensive analysis of anticipated costs and revenues. The Stevensons want help
developing a projection for net income for their first year of operations.
The Stevensons plan to start out selling just one kind of crackers—“regular” Crummy
Crackers—which will sell for $2.40 per box. Direct material [cracker ingredients] is expected to
cost $0.50 per box. Direct labor [cracker maker-baker wages] is expected to be $0.25 per box.
Variable overhead [electricity, cracker boxes, plastic liners for the boxes] is expected to amount
to $0.41 per box. Bakery supervision will cost $28,000 annually. George’s salary as president of
the company will be $42,000; Bob will be in charge of sales and will earn a salary of $9,000
annually, plus a commission of 10% of sales. Fire insurance is $4,000 per year, payable on the
first of January, April, July, and October. The bakery will have an annual capacity of 150,000
boxes of crackers.
Required: calculate the following items. Omit the interest on the debt for the purpose of
these calculations.

Journal of Business Cases and Applications
Crummy Cracker Company, page 9
1. Variable costs:
a. total variable manufacturing cost per box
b. total variable selling and administrative costs per box
c. total variable cost per box
2. Fixed costs
a. total fixed manufacturing costs per year
b. total manufacturing cost per box at a production level of
i. 120,000 boxes and
ii. 150,000 boxes.
c. What conclusion can you draw about the usefulness of total costs per box?
3. Determine the total fixed non-manufacturing costs per year
4. Determine the total fixed cost per year
5. Write an equation that will enable you to determine net income at any reasonable level of
sales, using X as the variable for the number of boxes of crackers sold.
6. Use your equation from #5 to determine the projected net income under absorption costing,
given the following alternative scenarios:
a. they produce and sell 120,000 boxes
b. they produce and sell 100,000 boxes
c. they produce 120,000 boxes but sell only 100,000 boxes.
Coming up next: a different income statement format
PART 3: INTRODUCING THE CONCEPT OF CONTRIBUTION MARGIN
The original data are repeated below for your reference.
The Stevensons plan to start out selling just one kind of crackers—“regular” Crummy
Crackers—which will sell for $2.40 per box. Direct material [cracker ingredients] is
expected to cost $0.50 per box. Direct labor [cracker maker-baker wages] is expected to be
$0.25 per box. Variable overhead [electricity, cracker boxes, plastic liners for the boxes] is
expected to amount to $0.41 per box. Bakery supervision will cost $28,000 annually.
George’s salary as president of the company will be $42,000; Bob will be in charge of sales
and will earn a salary of $9,000 annually, plus a commission of 10% of sales. Fire insurance
is $4,000 per year, payable on the first of January, April, July, and October. The bakery will
have an annual capacity of 150,000 boxes of crackers.
Required: Calculate the following items; ignoring the interest on the debt for now.
1. Contribution margin
a. contribution margin from production per unit
b. total contribution margin per unit
c. total contribution margin ratio
2. Breakeven
a. annual breakeven point in boxes
b. annual breakeven point in sales revenue

Journal of Business Cases and Applications
Crummy Cracker Company, page 10
3. Write an equation that will enable you to determine net income at any reasonable level of
sales, assuming variable costing. Use X as the variable for the number of boxes of crackers
sold.
4. Determine the projected net income under variable costing, given the following scenarios:
a. they produce and sell 120,000 boxes
b. they produce and sell 100,000 boxes.
5. Look at your answers to 4a and 4b, above.
a. Subtract your net income from 4b, above from your net income from 4a.
b. In 4b vs. 4a, what is the difference in the number of boxes produced and sold?
c. Divide the difference in net income by the difference in boxes.
d. Where have you seen this number before?
e. What conceptual relationship can you use to simplify the calculation of net income
under variable costing?
6. Use your equation from #3 to determine the net income under variable costing, assuming that
they produce 120,000 boxes but sell only 100,000 boxes. Would net income under absorption
costing be greater or less than net income under variable costing? Why? What is going on?
Ignore startup costs and interest.
After listening to your analysis of these numbers, the Stevenson’s have suddenly realized
that there is a whole lot more to planning business operations for a year then they had thought.
They have asked for much more detailed projections for their first year of operations. So that you
can respond to their needs, the next section deals with what is called operational budgeting.
PART 4: OPERATIONAL BUDGETING
After reviewing your work on the income statements, the Stevensons realize this is a
whole lot more complicated than they had expected. What about cash? Inventory? They have
decided a more comprehensive budget is necessary and have asked for your assistance. With a
bit of prodding, they are able to provide more information about their anticipated operations. The
Stevensons have projected annual sales of 120,000 boxes of crackers, distributed as follows:
They had initially hoped that they would be able to collect all the cash from sales within
the month of the sale, but after conversations with local businesses, they realize that their
assumption about cash collections was unrealistic. It appears that a more realistic scenario is as
follows: 50% of the sales would be collected in the month of sale, 25% in the month following
the sale, and 24% in the second month following the sale. It appears that even after careful credit
reviews and aggressive efforts at nagging delinquent accounts, 1% of the receivables will have to
be written off as bad debts.
George figures they will need to have one month’s worth a raw material inventory [=
cracker ingredients] on hand at any given time. Furthermore, they want to have 25% of the next
month’s sales in ending finished goods inventory. They will buy inventory on account, with 60%
of purchases paid in the month of purchase and 40% in the month following purchase.

Journal of Business Cases and Applications
Crummy Cracker Company, page 11
Sales commissions will be paid in the month following the month in which they are
earned. All other expenses will be paid as incurred.
George is also worried about cash flow. They have invested most of their savings in the
business, so they have little to fall back on if things don’t work out well. Consequently, they
made another trip to the bank and were able to secure a $20,000 line of credit at 10% annual
interest. Borrowing on the line will be as needed, with repayments as cash flows permit. Interest
will accrue on any balance outstanding, with interest payable on the first of the month following
accrual.
Required: Prepare the following schedules for the Stevenson’s first years of operation;
all are by month, except the balance sheet, for which an end-of-year balance sheet is all that is
needed. Use Excel. You will need a series of =IF() statements to determine the borrowing and/or
repayments on the line of credit.
1. Sales budget, in boxes of crackers and
dollar sales
2. Cash receipts budget
3. Production budget 4. Purchases budget, including a schedule of
payments for purchases
5. Selling and administrative expense budget 6. Cash budget
7. Profit plan [=budgeted income statement];
use a variable costing format.
8. Pro-forma year end balance sheet
Coming soon to a store near you…Crummy Low Fat Crackers—half the fat and twice the
flavor compared to Crummy Regular Crackers.
PART 5: LET’S PRODUCE LOW-FAT CACKERS, TOO!
The Stevensons realize that production of an additional cracker variety will complicate
their operations, so they would like to have a better idea of the financial impact of producing two
different kinds of crackers. After considerable research, they have developed the cost and
revenue numbers for a low fat cracker that they believe would appeal to their customers. Market
research has shown that the low fat crackers would sell for a twenty-five cent premium over the
regular crackers. Direct material would be $0.40 per box. Other variable production costs would
be the same as for regular crackers and sales commissions would remain at 10% of sales. Market
research indicates that 40% of the boxes sold would be low-fat and 60% would be regular. For
the purposes of this analysis, ignore the startup costs and interest.
1. Determine the breakeven point if the expectations regarding the low fat crackers are fulfilled.
2. Suppose the product mix is reversed—40% of the boxes sold are regular crackers and 60%
are low fat. BEFORE doing any calculations, think about whether the breakeven point will
go up or down, and why. Then verify your thinking by crunching the numbers.
3. Suppose that, out of their magnanimous concern for the health of their customers, the
Stevensons decide to drop regular crackers and produce only low-fat crackers. Costs,
production volumes and sales prices remain the same. Assuming that 120,000 boxes are
produced and sold, will net income go up or down? By how much?

Journal of Business Cases and Applications
Crummy Cracker Company, page 12
4. Assume that Crummy Cracker produces and sells only low fat crackers. Determine the
number of boxes of low fat crackers that would have to be sold to earn the same net income
that would be earned if they produced and sold 120,000 boxes of regular crackers.
Next up: excess inventory [which means stale crackers, unfortunately], and a special
order from a local supermarket chain.
PART 6: INCREMENTAL ANALYSIS AND DECISION MAKING
Each of the following scenarios is independent.
1. The Stevensons found that their sales estimates for the first few months were wildly
optimistic. Consequently, there are currently 10,000 boxes of “old” crackers in inventory
which cannot be sold through regular channels. Assume that annual production was 120,000
boxes. Determine the book value of the crackers:
a. under absorption costing.
b. under variable costing.
2. A number of options have been proposed for dealing with the excess inventory cited in #1..
For each of the following scenarios, determine the incremental impact on annual net income.
Some options may have qualitative implications for the company. Identify these and evaluate
the financial impact vs. the potential positive or negative qualitative implications.
a. A local farmer has offered to haul the crackers away in his truck. He would use them
for cattle feed. However, because the cattle can’t eat the packaging, a Crummy
Cracker employee would have to “unpackage” the crackers at a net cost to the
company of $0.05 per box.
b. Suppose the inventory value of the crackers was “astronomically higher” than either
of your answers to 1[a] and 1[b]; i. e., there were lots of zeros to the left of the
decimal point. Would your answer to 2[a] change? Why or why not?
c. The crackers can be hauled to the local landfill. The county solid waste department
charges $20.00 for the first 500 pounds; the fee for amounts in excess of 500 pounds
is $110 per ton. The gross weight of the crackers is 17 ounces per box.
d. Frozen Solid, Inc. a local frozen food processor would buy the crackers for a price
equal to Crummy Crackers’ variable cost per box. FSI would crush the crackers and
use the crumbs as part of the breading for frozen fish and chicken. Crummy Cracker
would have to unpackage the crackers at a cost of $0.05 per box. George Stevenson
favors this idea because “at least that way we would recover our variable cost.”
Evaluate George’s thinking.
e. Crummy Cracker can donate the crackers to the county food bank. Food bank
officials have said the crackers would “disappear quickly,” given the level of
unemployment in the area. The food bank would send their truck to pick up the
crackers and assist in loading the crackers on the truck, so any additional costs to
Crummy Cracker would be negligible.
3. Sooper Dooper Markets, a local supermarket chain, has offered to buy 10,000 boxes of
regular crackers under a private label arrangement. Sooper Dooper would provide the boxes,
reducing Crummy Cracker’s variable overhead by $0.06 per box, and the commissions would
be avoided on this order. Sooper Dooper would pay $1.20 per box. Upon hearing about the

Journal of Business Cases and Applications
Crummy Cracker Company, page 13
proposed $1.20 price, Bob Stevenson said that “…we would be fools to accept that offer. Our
average cost per box is $2.23; we would be losing over a dollar on every box.” George
Stevenson was pretty sure that Bob’s evaluation was “not quite right,” but he could not seem
to come up with a compelling argument. Who is right? Assume that the special order would
have no impact on regular sales.
4. Now assume that the special order in #2, above, would displace the sale of an equal number
of boxes of regular crackers at the regular sales price. Determine the impact on net income
for the year if the order is accepted.
Next on the agenda: performance evaluation and variance analysis
PART 8: PERFORMANCE REPORTING AND VARIANCE ANALYSIS
Fast forward to the end of the Stevenson’s first year of operations. Late on December 31,
George and Bob tally up their sales and costs for the year. Actual cracker sales volume turned
out to be 123,000 boxes of regular crackers. They thought they would have some left in
inventory, but thanks to several big Christmas and New Year’s parties, they were able to all
123,000 boxes. While they are pleased with the sales volume, they found that the average sales
price was $2.35 per box—a nickel less than they had planned. Unfortunately, $2,500 in sales
proved to be uncollectible and will have to be written off. Total direct labor costs for the year
were $31,500 and total direct material costs were $62,300. Variable overhead was $50,175. Sales
commissions were $28,905. Fixed costs turned out to be pretty much as expected; the main
exception was bakery supervision, which was $32,000. Interest on the line of credit turned out to
be $967.
Required: George and Bob would like a comprehensive report on their first year of
operations. Develop an analysis which compares the static budget, a flexible budget and actual
experience for Crummy Cracker’s first year. Compute whatever other performance indices you
believe a appropriate. Your analysis should include a brief written analysis which explains the
potential reasons for any variances that you find, and which provides an overall assessment of
Crummy Cracker’s first year of operations. The Stevenson’s original estimates of costs and sales
prices are repeated here for your convenience.
The Stevensons plan to start out selling just one kind of crackers—“regular” Crummy
Crackers—which will sell for $2.40 per box. Direct material [cracker ingredients] is expected
to cost $0.50 per box. Direct labor [cracker maker-baker wages] is expected to be $0.25 per
box. Variable overhead [electricity, cracker boxes, plastic liners for the boxes] is expected to
amount to $0.41 per box. Bakery supervision will cost $28,000 annually. George’s salary as
president of the company will be $40,000; Bob will be in charge of sales and will earn a
salary of $9,000 annually, plus a commission of 10% of sales. Rent is $6,000 per year. The
bakery will have an annual capacity of 150,000 boxes of crackers.
Assume a static budget of 120,000 boxes.

Journal of Business Cases and Applications
Crummy Cracker Company, page 14
Crummy Cracker Company: Exercises for managerial Accounting
Teaching Note
This set of exercise began as a simple breakeven problem. Over time, I added several of
the other topics typically covered in an introductory managerial accounting class. The sections at
the beginning are specifically designed to serve as a bridge from introductory financial
accounting. As with many such efforts, there tends to be an emphasis on those elements that
seem to cause the most difficulty for students. Hence the coverage of investment, purchase of
fixed assets, startup costs, and the initial focus on balance sheets.
The exercises are intended for use in an introductory undergraduate managerial
accounting class. The entire document can be handed out as a set at the start of the course or
individual sections can be handed out as needed. The exercises can be used as tutorials,
homework assignments, or quizzes. The topics are covered in the following order:
1. Balance sheets, including a section on mortgage amortization using Excel
2. Cost classifications and income statements; absorption costing
3. Contribution margins, breakeven points
4. Operational budgeting
5. Let’s produce low-fat crackers; multiple product break even analysis
6. Decision making and incremental analysis
7. Performance review and variance analysis
PART 1: BALANCE SHEETS
Balance sheet as of December 26th
, 2011:
Balance sheet on December 27th
:
Cash 63,000$ Owner equity 65,000$
Retained earnings (2,000)$
Total assets 63,000$ Total Liabilities + Equity 63,000$
Crummy Cracker Company
Balance Sheet #1 [12/26/2011]
Assets Liabilities and equity
Cash 98,000$ Mortgage [FL & O N B of P] 35,000$
Owner equity 65,000$
Retained earnings (2,000)$
Total assets 98,000$ Total Liabilities + Equity 98,000$
Liabilities and equityAssets
Crummy Cracker Company
Balance Sheet #2 [12/27/2011]

Journal of Business Cases and Applications
Crummy Cracker Company, page 15
Balance sheet on December 28th
:
The cash balance is $98,000 – 60,000 – 25,000.
PART 2: FIXED COSTS, VARIABLE COSTS, AND INCOME STATEMENTS
a. Variable costs:
a. total variable manufacturing cost per box $0.50 + 0.25 + 0.41 = $1.16
b. total variable selling and administrative costs per box 10% * $2.40 = $0.24
c. total variable cost per box $1.16 + 0.24 = $1.40
b. Fixed costs
a. total fixed manufacturing costs per year
Supervision $28,000
Depreciation on bakery equipment [$57,000 + $3,000 =
$60,000; 5 yr useful life, so annual depreciation is
$12,000]
12,000
Total annual fixed manufacturing costs $40,000
b. Total fixed manufacturing cost per box:
Variable mfg
cost per unit
Total fixed mfg
costs
Production
volume
Fixed mfg cost
per unit
Total cost
per unit
$1.16 $40,000 120,000 $0.333 $1.49
$1.16 $40,000 150,000 $0.267 $1.43
c. Total manufacturing costs per box is dependent on production volume. Since the cost
will be “correct” only at one specific volume, total costs per unit should be used with
extreme caution.
c. Total fixed non-manufacturing costs are the president’s salary [$42,000], the sales salaries
[$9,000], the annual insurance premium [$4,000], and the depreciation on office equipment
[$5,000], for a total of $60,000.
d. Total fixed costs per year are $100,000 [$40,000 + $60,000].
e. Income statement equation is
NI = $2.40X - $1.16X – [$40,000 * % of production sold] - $.24X - $60,000
Cash 13,000$ Mortgage [FL & O N B of P] 35,000$
Bakery equipment 60,000$ Owner equity 65,000$
Office equipment 25,000$ Retained earnings (2,000)$
Total assets 98,000$ Total Liabilities + Equity 98,000$
Assets Liabilities and equity
Crummy Cracker Company
Balance Sheet #3 [12/28/2011]

Journal of Business Cases and Applications
Crummy Cracker Company, page 16
f. Projected net incomes under absorption costing given the three scenarios follow below
If 120,000 boxes are produced and sold, the formula yields a net income of $20,000:
TotalProduction in units 120,000 - 120,000 Sales in units 120,000 - 120,000 Percentage of output sold 100% 0%
Percentage of output to inventory 0% 100%
Units to Inventory - - - Revenue 2.40$ 288,000$ 2.65 -$ 288,000$ Total cost of goods manufactured Per unit Total Per unit Total
Raw material 0.500$ 60,000$ 0.40 -$
Direct labor 0.250$ 30,000 0.25 -
Variable overhead 0.410$ 49,200 0.41 -
Fixed overhead 40,000 -
Total manufacturing costs incurred 179,200 -
Amt to CGS 179,200 - 179,200$ Amount to inventory - - Gross margin 108,800
Less selling and administrative costsCommissions 10.00% 28,800 10.00% -$ 28,800
Exec Salaries 42,000 Sales salaries 9,000 Depreciation 5,000 Insurance premium 4,000
Total selling and administrative costs 88,800
Net income before writeoff of startup
costs and interest20,000
Crummy Cracker Company: Income statement under absorption costing
Regular Low-Fat

Journal of Business Cases and Applications
Crummy Cracker Company, page 17
If 100,000 boxes are produced and sold, the formula reveals that they are at the breakeven point:
TotalProduction in units 100,000 - 100,000 Sales in units 100,000 - 100,000 Percentage of output sold 100% 0%
Percentage of output to inventory 0% 100%
Units to Inventory - - - Revenue 2.40$ 240,000$ 2.65 -$ 240,000$ Total cost of goods manufactured Per unit Total Per unit Total
Raw material 0.500$ 50,000$ 0.40 -$
Direct labor 0.250$ 25,000 0.25 -
Variable overhead 0.410$ 41,000 0.41 -
Fixed overhead 40,000 -
Total manufacturing costs incurred 156,000 -
Amt to CGS 156,000 - 156,000$ Amount to inventory - - Gross margin 84,000
Less selling and administrative costsCommissions 10.00% 24,000 10.00% -$ 24,000
Exec Salaries 42,000 Sales salaries 9,000 Depreciation 5,000 Insurance premium 4,000
Total selling and administrative costs 84,000
Net income before writeoff of startup
costs and interest-
Crummy Cracker Company: Income statement under absorption costing
Regular Low-Fat

Journal of Business Cases and Applications
Crummy Cracker Company, page 18
If they produce 120,000 boxes, but sell only 100,000, the income statement will look like
this:
TotalProduction in units 120,000 - 120,000 Sales in units 100,000 - 100,000 Percentage of output sold 83% 0%
Percentage of output to inventory 17% 100%
Units to Inventory 20,000 - 20,000 Revenue 2.40$ 240,000$ 2.65 -$ 240,000$ Total cost of goods manufactured Per unit Total Per unit Total
Raw material 0.500$ 60,000$ 0.40 -$
Direct labor 0.250$ 30,000 0.25 -
Variable overhead 0.410$ 49,200 0.41 -
Fixed overhead 40,000 -
Total manufacturing costs incurred 179,200 -
Amt to CGS 149,333 - 149,333$ Amount to inventory 29,867 - Gross margin 90,667
Less selling and administrative costsCommissions 10.00% 24,000 10.00% -$ 24,000
Exec Salaries 42,000 Sales salaries 9,000 Depreciation 5,000 Insurance premium 4,000
Total selling and administrative costs 84,000
Net income before writeoff of startup
costs and interest6,667
Crummy Cracker Company: Income statement under absorption costing
Regular Low-Fat
Journal of Business Cases and Applications
Crummy Cracker Company, page 19
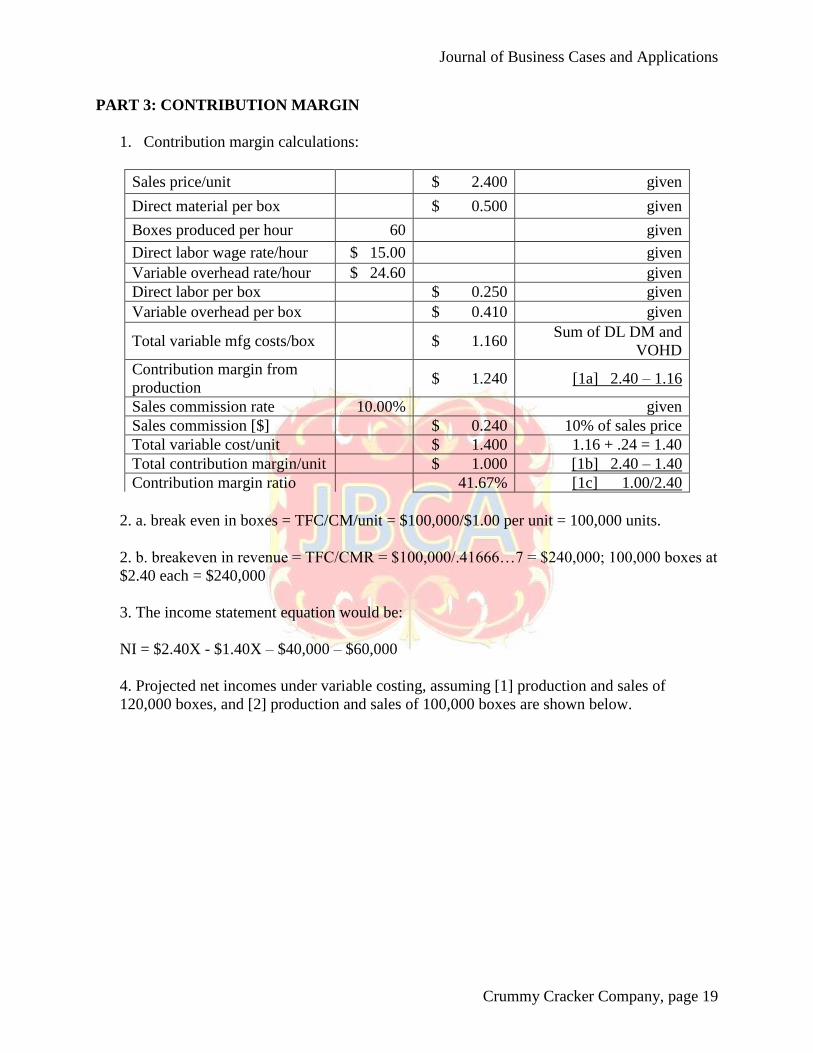
PART 3: CONTRIBUTION MARGIN
1. Contribution margin calculations:
Sales price/unit $ 2.400 given
Direct material per box $ 0.500 given
Boxes produced per hour 60 given
Direct labor wage rate/hour $ 15.00 given
Variable overhead rate/hour $ 24.60 given
Direct labor per box $ 0.250 given
Variable overhead per box $ 0.410 given
Total variable mfg costs/box $ 1.160 Sum of DL DM and
VOHD
Contribution margin from
production $ 1.240 [1a] 2.40 – 1.16
Sales commission rate 10.00% given
Sales commission [$] $ 0.240 10% of sales price
Total variable cost/unit $ 1.400 1.16 + .24 = 1.40
Total contribution margin/unit $ 1.000 [1b] 2.40 – 1.40
Contribution margin ratio 41.67% [1c] 1.00/2.40
2. a. break even in boxes = TFC/CM/unit = $100,000/$1.00 per unit = 100,000 units.
2. b. breakeven in revenue = TFC/CMR = $100,000/.41666…7 = $240,000; 100,000 boxes at
$2.40 each = $240,000
3. The income statement equation would be:
NI = $2.40X - $1.40X – $40,000 – $60,000
4. Projected net incomes under variable costing, assuming [1] production and sales of
120,000 boxes, and [2] production and sales of 100,000 boxes are shown below.

Journal of Business Cases and Applications
Crummy Cracker Company, page 20
Part a: Produce and sell 120,000 boxes
TotalProduction in units 120,000 - 120,000 Sales in units 120,000 - 120,000 Percentage of output sold 100% 0%Percentage of output to inventory 0% 100%Units to Inventory - -
Revenue 2.40$ 288,000$ 2.65 -$ 288,000$ Variable cost of goods manufactured Per unit Total Per unit Total
Raw material 0.500$ 60,000$ 0.400$ -$ 60,000$ Direct labor 0.250$ 30,000$ 0.250$ -$ 30,000$ Variable overhead 0.410$ 49,200$ 0.410$ -$ 49,200$
Total variable manufacturing costs 139,200$ -$ 139,200$ Less: Amount to inventory -$ -$ -$ Amount to Variable CGS 139,200$ -$ 139,200$
Contribution margin from production 148,800$ Less variable selling expenses 28,800 - 28,800$ Contribution margin 120,000$ Less fixed costs [none of which are allocated to either product]Manufacturing
Supervision 28,000 Depreciation 12,000 40,000
Selling & administrative expensesExec Salaries 42,000
Sales salaries 9,000 Depreciation 5,000 Insurance premium 4,000 60,000
Total fixed costs 100,000 Net income B/4 startup costs and interest 20,000$
Crummy Cracker Company: income statement under variable costing
Regular Low Fat
Journal of Business Cases and Applications
Crummy Cracker Company, page 21
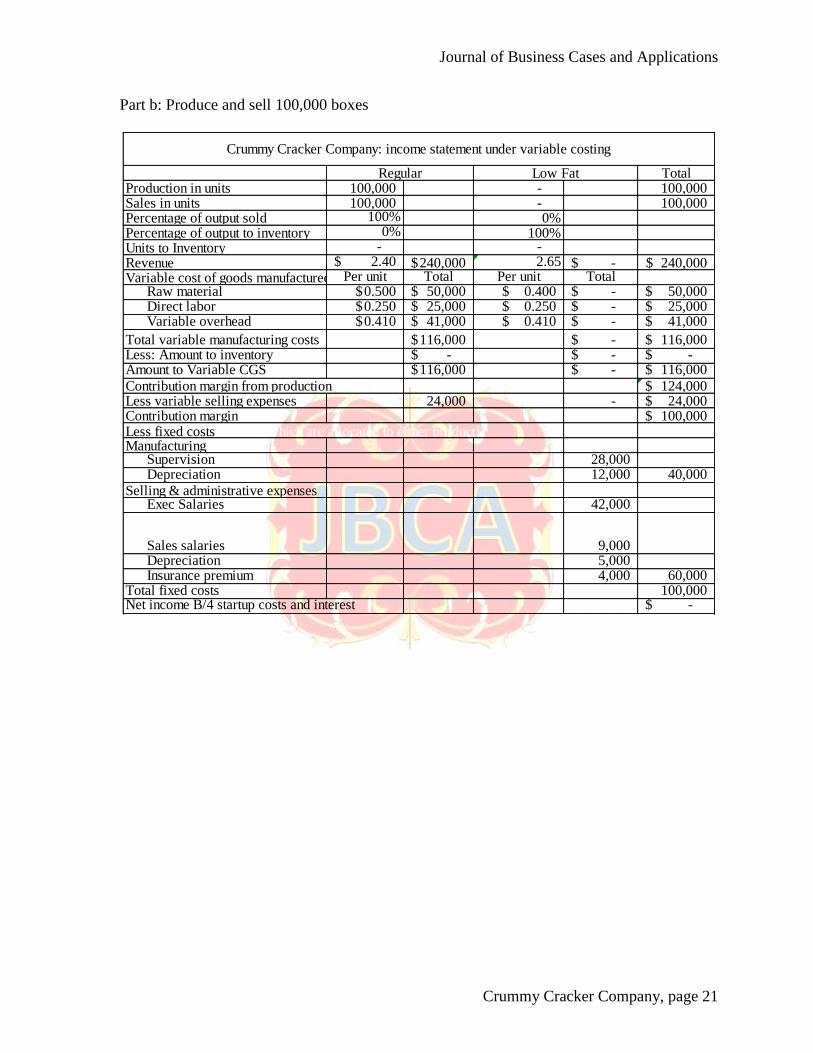
Part b: Produce and sell 100,000 boxes
TotalProduction in units 100,000 - 100,000 Sales in units 100,000 - 100,000 Percentage of output sold 100% 0%Percentage of output to inventory 0% 100%Units to Inventory - -
Revenue 2.40$ 240,000$ 2.65 -$ 240,000$ Variable cost of goods manufactured Per unit Total Per unit Total
Raw material 0.500$ 50,000$ 0.400$ -$ 50,000$ Direct labor 0.250$ 25,000$ 0.250$ -$ 25,000$ Variable overhead 0.410$ 41,000$ 0.410$ -$ 41,000$
Total variable manufacturing costs 116,000$ -$ 116,000$ Less: Amount to inventory -$ -$ -$ Amount to Variable CGS 116,000$ -$ 116,000$
Contribution margin from production 124,000$ Less variable selling expenses 24,000 - 24,000$ Contribution margin 100,000$ Less fixed costs [none of which are allocated to either product]Manufacturing
Supervision 28,000 Depreciation 12,000 40,000
Selling & administrative expensesExec Salaries 42,000
Sales salaries 9,000 Depreciation 5,000 Insurance premium 4,000 60,000
Total fixed costs 100,000 Net income B/4 startup costs and interest -$
Crummy Cracker Company: income statement under variable costing
Regular Low Fat

Journal of Business Cases and Applications
Crummy Cracker Company, page 22
5. Analysis of results from 3a and 3b:
Income at 120,000 units $20,000
Q. 4a Income at 100,000 units 0
Difference in income $20,000
Difference in boxes sold 20,000 Q. 4b
Divide difference in income by difference in boxes sold $1.00 per box Q. 4c
Q. 4d and 4e: Where have you seen this number before? The contribution margin per unit is
$1.00 per box. The conceptual relationship is as follows: Under variable costing, if you know
the breakeven point, you can use the contribution margin per unit to determine net income,
given a specific sales level. Each additional unit sold contributes $1.00 to Crummy Cracker’s
bottom line. Therefore, net income will increase by $1.00 per box as they move up from the
breakeven point. Conversely, if they are at the breakeven point, each additional box NOT
sold increases the net lost by $1.00.
6. NI = $2.40 [100,000] - $1.40 [100,000] – $40,000 – $60,000 = 0
They will break even if the startup costs and interest are ignored. Net income under
absorption costing would be $6,667 before the write-off of startup costs and interest. The
difference between this and the breakeven number under variable costing is due to the
respective treatments of fixed manufacturing overhead. Under variable costing, all the fixed
manufacturing overhead is written off against the revenue from the sale of 100,000 units,
irrespective of how many units were produced. Under absorption costing, fixed overhead is
written off in pro-rata fashion: they sold 10/12ths of the production [100K/120K] so 10/12ths
of the fixed costs will be expensed. 10/12 = 5/6; 5/6 * $40,000 in fixed overhead = $33,333,
which is the fixed cost portion of absorption cost of goods sold. Under absorption costing,
the remaining 1/6th
of the overhead will be capitalized into inventory and expensed whenever
the remaining units are sold. The difference between the total overhead [$40,000] and the
$33,333 written off under absorption costing is $6,667, which is the net income under
absorption costing. Since this amount is written off under variable costing, absorption costing
shows a higher net income. Ceteris paribus, when production exceeds sales, absorption
costing net income will be higher than variable costing net income. When sales exceeds
production [drawing on “old” inventory”], variable costing will show a higher net income,
since all of the fixed overhead associated with the “old” production will have been expensed
in a prior period.

Journal of Business Cases and Applications
Crummy Cracker Company, page 23
PART 4: OPERATIONAL BUDGETING
The sales and cash receipts budget is step 1. The results look like this.
The production budget and inventory analysis looks like this:
Month January February March April May June July August September October November December Total
Boxes 8,000 9,500 9,500 11,500 10,000 11,500 10,000 10,000 11,000 9,000 10,000 10,000 120,000
Sales ###### ###### 22,800$ 27,600$ 24,000$ 27,600$ 24,000$ 24,000$ 26,400$ 21,600$ 24,000$ 24,000$ 288,000$
Month of
sale
Next
Month
Second
monthBad Debts
50% 25% 24% 1%
January February March April May June July August September October November December January February Bad debtsProof of
Total
January 19,200$ 9,600$ 4,800$ 4,608$ 192$ 19,200$
February 22,800$ ###### 5,700$ 5,472$ 228$ 22,800$
March 22,800$ 11,400$ 5,700$ 5,472$ 228$ 22,800$
April 27,600$ 13,800$ 6,900$ 6,624$ 276$ 27,600$
May 24,000$ 12,000$ 6,000$ 5,760$ 240$ 24,000$
June 27,600$ 13,800$ 6,900$ 6,624$ 276$ 27,600$
July 24,000$ 12,000$ 6,000$ 5,760$ 240$ 24,000$
August 24,000$ 12,000$ 6,000$ 5,760$ 240$ 24,000$
September 26,400$ 13,200$ 6,600$ 6,336$ 264$ 26,400$
October 21,600$ 10,800$ 5,400$ 5,184$ 216$ 21,600$
November 24,000$ 12,000$ 6,000$ 5,760$ 240$ 24,000$
December 24,000$ 12,000$ 6,000$ 5,760$ 240$ 24,000$
Totals 288,000$ 9,600$ ###### 21,708$ 24,972$ 24,372$ 26,424$ 24,660$ 24,624$ 24,960$ 23,160$ 23,736$ 23,184$ 11,760$ 5,760$ 2,880$
Fro
m sales in
Cash collected in
Sales forecast and cash receipts for Crummy Cracker
Cash collections
pattern
Jan Feb Mar Apr May Jun Jul Aug Sep Oct Nov Dec Jan Feb Mar
Sales [boxes] 8,000 9,500 9,500 11,500 10,000 11,500 10,000 10,000 11,000 9,000 10,000 10,000 8,000 9,500 9,500
Desired ending FG
inventory [boxes] 2,375 2,375 2,875 2,500 2,875 2,500 2,500 2,750 2,250 2,500 2,500 2,000 2,375 2,375
Total inventory
requirement 10,375 11,875 12,375 14,000 12,875 14,000 12,500 12,750 13,250 11,500 12,500 12,000 10,375
Less BFG invty 0 2,375 2,375 2,875 2,500 2,875 2,500 2,500 2,750 2,250 2,500 2,500 2,000
Required production 10,375 9,500 10,000 11,125 10,375 11,125 10,000 10,250 10,500 9,250 10,000 9,500 8,375
Direct material
required for 5,188$ 4,750$ 5,000$ 5,563$ 5,188$ 5,563$ 5,000$ 5,125$ 5,250$ 4,625$ 5,000$ 4,750$ 4,188$
Add: req'd DM
ending invty 4,750$ 4,750$ 5,750$ 5,000$ 5,750$ 5,000$ 5,000$ 5,500$ 4,500$ 5,000$ 5,000$ 4,000$
Total direct mat'l 9,938$ 9,500$ 10,750$ 10,563$ 10,938$ 10,563$ 10,000$ 10,625$ 9,750$ 9,625$ 10,000$ 8,750$
Less beginning DM -$ (4,750)$ (4,750)$ (5,750)$ (5,000)$ (5,750)$ (5,000)$ (5,000)$ (5,500)$ (4,500)$ (5,000)$ (5,000)$ Required purchases
of DM 9,938$ 4,750$ 6,000$ 4,813$ 5,938$ 4,813$ 5,000$ 5,625$ 4,250$ 5,125$ 5,000$ 3,750$ 65,000$
Value of ending
finished goods 2,755.00$ 2,755$ 3,335$ 2,900$ 3,335$ 2,900$ 2,900$ 3,190$ 2,610$ 2,900$ 2,900$ 2,320$
Value of VCGS 9,280$ 11,020$ 11,020$ 13,340$ 11,600$ 13,340$ 11,600$ 11,600$ 12,760$ 10,440$ 11,600$ 11,600$
Crummy Cracker Production Budget

Journal of Business Cases and Applications
Crummy Cracker Company, page 24
Here is the analysis of payments for purchases of inventory, payroll, variable overhead, and
bakery supervision:
This is the analysis of selling and administrative expenses:
Mo. Of Next Mo.
60% 40%
Purchases Jan Feb Mar Apr May Jun Jul Aug Sep Oct Nov Dec Jan Proof
9,938$ 5,962.50$ 3,975.00$ 9,938$
4,750$ 2,850.00$ 1,900.00$ 4,750$
6,000$ 3,600$ 2,400$ 6,000$
4,813$ 2,888$ 1,925$ 4,813$
5,938$ 3,563$ 2,375$ 5,938$
4,813$ 2,888$ 1,925$ 4,813$
5,000$ 3,000$ 2,000$ 5,000$
5,625$ 3,375$ 2,250$ 5,625$
4,250$ 2,550$ 1,700$ 4,250$
5,125$ 3,075$ 2,050$ 5,125$
5,000$ 3,000$ 2,000$ 5,000$
3,750$ 2,250$ 1,500$ 3,750$
5,963$ 6,825$ 5,500$ 5,288$ 5,488$ 5,263$ 4,925$ 5,375$ 4,800$ 4,775$ 5,050$ 4,250$ 1,500$ 65,000.00$
2,594$ 2,375$ 2,500$ 2,781$ 2,594$ 2,781$ 2,500$ 2,563$ 2,625$ 2,313$ 2,500$ 2,375$
4,254$ 3,895$ 4,100$ 4,561$ 4,254$ 4,561$ 4,100$ 4,203$ 4,305$ 3,793$ 4,100$ 3,895$
2,333$ 2,333$ 2,333$ 2,333$ 2,333$ 2,333$ 2,333$ 2,333$ 2,333$ 2,333$ 2,333$ 2,333$
9,181$ 8,603$ 8,933$ 9,676$ 9,181$ 9,676$ 8,933$ 9,098$ 9,263$ 8,438$ 8,933$ 8,603$
1,000$ 1,000$ 1,000$ 1,000$ 1,000$ 1,000$ 1,000$ 1,000$ 1,000$ 1,000$ 1,000$ 1,000$
10,181$ 9,603$ 9,933$ 10,676$ 10,181$ 10,676$ 9,933$ 10,098$ 10,263$ 9,438$ 9,933$ 9,603$
Payments for purchases
Month January February March April May June July August September October November December Total
Boxes 8,000 9,500 9,500 11,500 10,000 11,500 10,000 10,000 11,000 9,000 10,000 10,000 120,000
Sales revenue 19,200$ 22,800$ 22,800$ 27,600$ 24,000$ 27,600$ 24,000$ 24,000$ 26,400$ 21,600$ 24,000$ 24,000$ 288,000$
Commissions
earned 1,920$ 2,280$ 2,280$ 2,760$ 2,400$ 2,760$ 2,400$ 2,400$ 2,640$ 2,160$ 2,400$ 2,400$ 28,800$
Commissions paid 1,920$ 2,280$ 2,280$ 2,760$ 2,400$ 2,760$ 2,400$ 2,400$ 2,640$ 2,160$ 2,400$ 26,400$
President's salary 3,500$ 3,500$ 3,500$ 3,500$ 3,500$ 3,500$ 3,500$ 3,500$ 3,500$ 3,500$ 3,500$ 3,500$ 42,000$
Sales salary 750$ 750$ 750$ 750$ 750$ 750$ 750$ 750$ 750$ 750$ 750$ 750$ 9,000$
Insurance premium 1,000$ 1,000$ 1,000$ 1,000$ 4,000$
Total S & A exp paid 5,250$ 6,170$ 6,530$ 7,530$ 7,010$ 6,650$ 8,010$ 6,650$ 6,650$ 7,890$ 6,410$ 6,650$ 81,400$
Add depreciation 417$ 417$ 417$ 417$ 417$ 417$ 417$ 417$ 417$ 417$ 417$ 417$ 5,000$
Total budgeted S
& A expenses
before interest 5,667$ 6,587$ 6,947$ 7,947$ 7,427$ 7,067$ 8,427$ 7,067$ 7,067$ 8,307$ 6,827$ 7,067$ 86,400$
Add mortgage interest 233$ 230$ 227$ 224$ 221$ 217$ 214$ 211$ 207$ 204$ 201$ 197$ 2,586$
Total cash outlay 5,900$ 6,817$ 7,174$ 8,170$ 7,647$ 7,284$ 8,641$ 7,277$ 7,274$ 8,511$ 7,027$ 7,264$ 88,986$
Crummy Cracker Company Selling & Administrative Expenses
Journal of Business Cases and Applications
Crummy Cracker Company, page 25
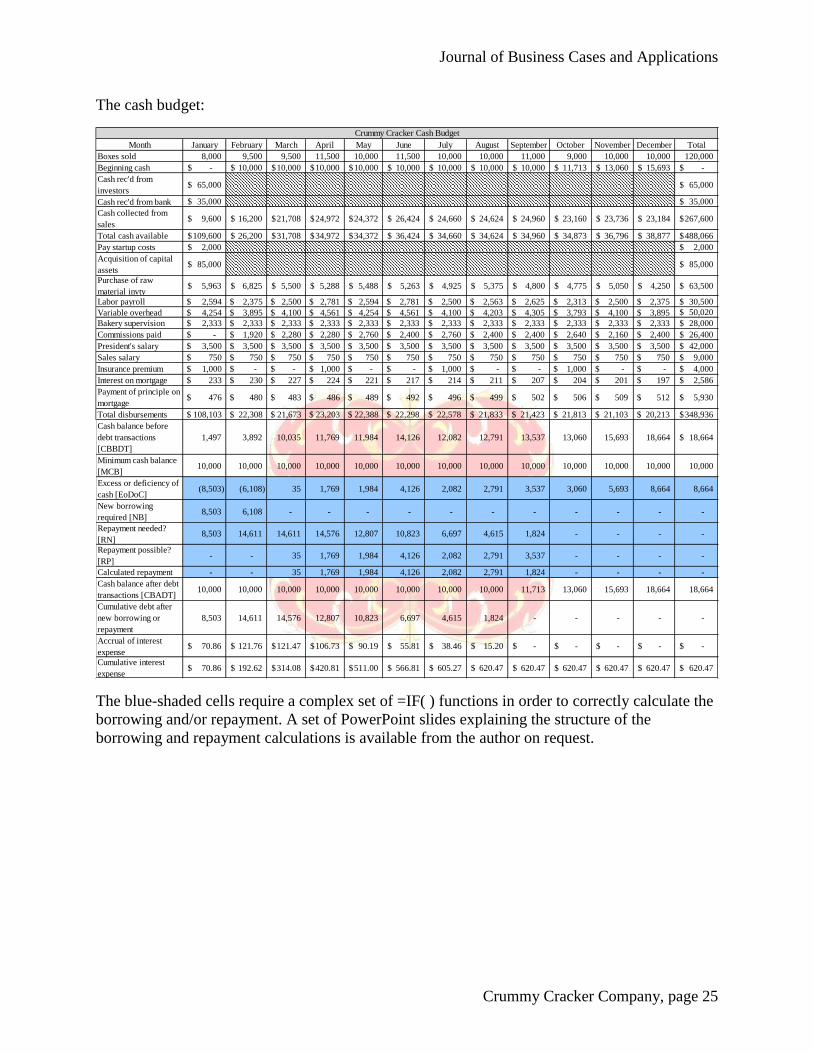
The cash budget:
The blue-shaded cells require a complex set of =IF( ) functions in order to correctly calculate the
borrowing and/or repayment. A set of PowerPoint slides explaining the structure of the
borrowing and repayment calculations is available from the author on request.
Month January February March April May June July August September October November December Total
Boxes sold 8,000 9,500 9,500 11,500 10,000 11,500 10,000 10,000 11,000 9,000 10,000 10,000 120,000
Beginning cash -$ 10,000$ 10,000$ 10,000$ 10,000$ 10,000$ 10,000$ 10,000$ 10,000$ 11,713$ 13,060$ 15,693$ -$
Cash rec'd from
investors65,000$ 65,000$
Cash rec'd from bank 35,000$ 35,000$
Cash collected from
sales9,600$ 16,200$ 21,708$ 24,972$ 24,372$ 26,424$ 24,660$ 24,624$ 24,960$ 23,160$ 23,736$ 23,184$ 267,600$
Total cash available 109,600$ 26,200$ 31,708$ 34,972$ 34,372$ 36,424$ 34,660$ 34,624$ 34,960$ 34,873$ 36,796$ 38,877$ 488,066$
Pay startup costs 2,000$ 2,000$
Acquisition of capital
assets85,000$ 85,000$
Purchase of raw
material invty5,963$ 6,825$ 5,500$ 5,288$ 5,488$ 5,263$ 4,925$ 5,375$ 4,800$ 4,775$ 5,050$ 4,250$ 63,500$
Labor payroll $ 2,594 $ 2,375 $ 2,500 $ 2,781 $ 2,594 $ 2,781 $ 2,500 $ 2,563 $ 2,625 $ 2,313 $ 2,500 $ 2,375 30,500$
Variable overhead $ 4,254 $ 3,895 $ 4,100 $ 4,561 $ 4,254 $ 4,561 $ 4,100 $ 4,203 $ 4,305 $ 3,793 $ 4,100 $ 3,895 50,020$
Bakery supervision $ 2,333 $ 2,333 $ 2,333 $ 2,333 $ 2,333 $ 2,333 $ 2,333 $ 2,333 $ 2,333 $ 2,333 $ 2,333 $ 2,333 28,000$
Commissions paid $ - $ 1,920 $ 2,280 $ 2,280 $ 2,760 $ 2,400 $ 2,760 $ 2,400 $ 2,400 $ 2,640 $ 2,160 $ 2,400 26,400$
President's salary $ 3,500 $ 3,500 $ 3,500 $ 3,500 $ 3,500 $ 3,500 $ 3,500 $ 3,500 $ 3,500 $ 3,500 $ 3,500 $ 3,500 42,000$
Sales salary $ 750 $ 750 $ 750 $ 750 $ 750 $ 750 $ 750 $ 750 $ 750 $ 750 $ 750 $ 750 9,000$
Insurance premium $ 1,000 $ - $ - $ 1,000 $ - $ - $ 1,000 $ - $ - $ 1,000 $ - $ - 4,000$
Interest on mortgage $ 233 $ 230 $ 227 $ 224 $ 221 $ 217 $ 214 $ 211 $ 207 $ 204 $ 201 $ 197 2,586$
Payment of principle on
mortgage $ 476 $ 480 $ 483 $ 486 $ 489 $ 492 $ 496 $ 499 $ 502 $ 506 $ 509 $ 512 5,930$
Total disbursements $ 108,103 $ 22,308 $ 21,673 $ 23,203 $ 22,388 $ 22,298 $ 22,578 $ 21,833 $ 21,423 $ 21,813 $ 21,103 $ 20,213 348,936$
Cash balance before
debt transactions
[CBBDT]
1,497 3,892 10,035 11,769 11,984 14,126 12,082 12,791 13,537 13,060 15,693 18,664 18,664$
Minimum cash balance
[MCB]10,000 10,000 10,000 10,000 10,000 10,000 10,000 10,000 10,000 10,000 10,000 10,000 10,000
Excess or deficiency of
cash [EoDoC](8,503) (6,108) 35 1,769 1,984 4,126 2,082 2,791 3,537 3,060 5,693 8,664 8,664
New borrowing
required [NB]8,503 6,108 - - - - - - - - - - -
Repayment needed?
[RN]8,503 14,611 14,611 14,576 12,807 10,823 6,697 4,615 1,824 - - - -
Repayment possible?
[RP]- - 35 1,769 1,984 4,126 2,082 2,791 3,537 - - - -
Calculated repayment - - 35 1,769 1,984 4,126 2,082 2,791 1,824 - - - -
Cash balance after debt
transactions [CBADT]10,000 10,000 10,000 10,000 10,000 10,000 10,000 10,000 11,713 13,060 15,693 18,664 18,664
Cumulative debt after
new borrowing or
repayment
8,503 14,611 14,576 12,807 10,823 6,697 4,615 1,824 - - - - -
Accrual of interest
expense70.86$ 121.76$ 121.47$ 106.73$ 90.19$ 55.81$ 38.46$ 15.20$ -$ -$ -$ -$ -$
Cumulative interest
expense70.86$ 192.62$ 314.08$ 420.81$ 511.00$ 566.81$ 605.27$ 620.47$ 620.47$ 620.47$ 620.47$ 620.47$ 620.47$
Crummy Cracker Cash Budget

Journal of Business Cases and Applications
Crummy Cracker Company, page 26
Here is the profit plan; projected first year profit is around $12,500:
And finally, here is the balance sheet:
Month January February March April May June July August September October November December Total
Boxes 8,000 9,500 9,500 11,500 10,000 11,500 10,000 10,000 11,000 9,000 10,000 10,000 120,000
Sales revenue 19,200$ 22,800$ 22,800$ 27,600$ 24,000$ 27,600$ 24,000$ 24,000$ 26,400$ 21,600$ 24,000$ 24,000$ 288,000$
Less VCGS 9,280$ 11,020$ 11,020$ 13,340$ 11,600$ 13,340$ 11,600$ 11,600$ 12,760$ 10,440$ 11,600$ 11,600$ 139,200$
Less Sales commissions 1,920$ 2,280$ 2,280$ 2,760$ 2,400$ 2,760$ 2,400$ 2,400$ 2,640$ 2,160$ 2,400$ 2,400$ 28,800$
TVC 11,200$ 13,300$ 13,300$ 16,100$ 14,000$ 16,100$ 14,000$ 14,000$ 15,400$ 12,600$ 14,000$ 14,000$ 168,000$
Contribution margin 8,000$ 9,500$ 9,500$ 11,500$ 10,000$ 11,500$ 10,000$ 10,000$ 11,000$ 9,000$ 10,000$ 10,000$ 120,000$
Fixed costs
Bakery supervision 2,333$ 2,333$ 2,333$ 2,333$ 2,333$ 2,333$ 2,333$ 2,333$ 2,333$ 2,333$ 2,333$ 2,333$ 28,000$
Depreciation 1,000$ 1,000$ 1,000$ 1,000$ 1,000$ 1,000$ 1,000$ 1,000$ 1,000$ 1,000$ 1,000$ 1,000$ 12,000$
President's salary 3,500$ 3,500$ 3,500$ 3,500$ 3,500$ 3,500$ 3,500$ 3,500$ 3,500$ 3,500$ 3,500$ 3,500$ 42,000$
Sales salary 750$ 750$ 750$ 750$ 750$ 750$ 750$ 750$ 750$ 750$ 750$ 750$ 9,000$
Insurance premium 1,000$ -$ -$ 1,000$ -$ -$ 1,000$ -$ -$ 1,000$ -$ -$ 4,000$
Depreciation 417$ 417$ 417$ 417$ 417$ 417$ 417$ 417$ 417$ 417$ 417$ 417$ 5,000$
Total fixed costs 9,000$ 8,000$ 8,000$ 9,000$ 8,000$ 8,000$ 9,000$ 8,000$ 8,000$ 9,000$ 8,000$ 8,000$ 100,000$
Net operating income (1,000)$ 1,500$ 1,500$ 2,500$ 2,000$ 3,500$ 1,000$ 2,000$ 3,000$ -$ 2,000$ 2,000$ 20,000$
Interest 233$ 230$ 227$ 224$ 221$ 217$ 214$ 211$ 207$ 204$ 201$ 197$ 2,586$
Startup costs 167$ 167$ 167$ 167$ 167$ 167$ 167$ 167$ 167$ 167$ 167$ 167$ 2,000$
Bad debts expense 192$ 228$ 228$ 276$ 240$ 276$ 240$ 240$ 264$ 216$ 240$ 240$ 2,880$
Net income (1,592)$ 875$ 878$ 1,834$ 1,373$ 2,840$ 379$ 1,383$ 2,362$ (587)$ 1,393$ 1,396$ 12,534$
Crummy Cracker Company Profit Plan
Cash 18,664$ Accounts payable 1,500$
Accts receivable 17,520 Commissions payable 2,400
Raw mat'l Inventory 4,000 Interest payable
Finished goods
invty 2,320 Mortgage payable 29,070
Bakery equipment 60,000
Depreciation on
bakery equipment (12,000)
Office equipment 25,000 Equity 65,000
Depreciation on
office equipment (5,000) Retained earnings 12,534
Total assets 110,504$ Total L + E 110,504$
Balance sheet

Journal of Business Cases and Applications
Crummy Cracker Company, page 27
PART 5: LOW FAT CRACKERS
1. Breakeven is 88,496 boxes if they sell regular and low-fat in a 60%/40% ratio:
2. If the ratio is reversed, the breakeven point will go down. Low-fat crackers have a higher
contribution margin ratio [roughly 50%] compared with the 42% for regular crackers. Selling
more of the more profitable item and less of the less profitable item will make things better.
3. If they produced and sold only regular crackers, variable costing net income would be
$20,000 at a volume of 120,000 boxes [20,000 boxes beyond the breakeven point at a
contribution of $1.00 per box]. If volume is 120,000 boxes of low-fat crackers, net income
will be $59,000 before the write off of the interest and startup costs:
Regular Low-FatCompany
as a whole
Sales price/unit 2.40$ 2.65$
Product mix 60.00% 40.00%
Weighted avg sales price 1.440$ 1.060$ 2.500$
Variable cost/unit 1.400$ 1.325$
Weighted avg VC/product 0.840$ 0.530$ 1.370$
Contribution margin per box 1.000$ 1.325$
Firm weighted CM/product 0.600$ 0.530$ 1.130$
Total fixed costs 100,000$
Breakeven point in total boxes 88,496
Required sales of each product [boxes] 53,097 35,398 88,496
Revenue @ B E Pt 127,434$ 93,805$ 221,239$
Breakeven calculations
Regular Low-FatCompany
as a whole
Sales price/unit 2.40$ 2.65$
Product mix 40.00% 60.00%
Weighted avg sales price 0.960$ 1.590$ 2.550$
Variable cost/unit 1.400$ 1.325$
Weighted avg VC/product 0.560$ 0.795$ 1.355$
Contribution margin per box 1.000$ 1.325$
Firm weighted CM/product 0.400$ 0.795$ 1.195$
Total fixed costs 100,000$
Breakeven point in total boxes 83,682
Required sales of each product [boxes] 33,473 50,209 83,682
Revenue @ B E Pt 80,335$ 133,054$ 213,389$
Breakeven calculations
Journal of Business Cases and Applications
Crummy Cracker Company, page 28
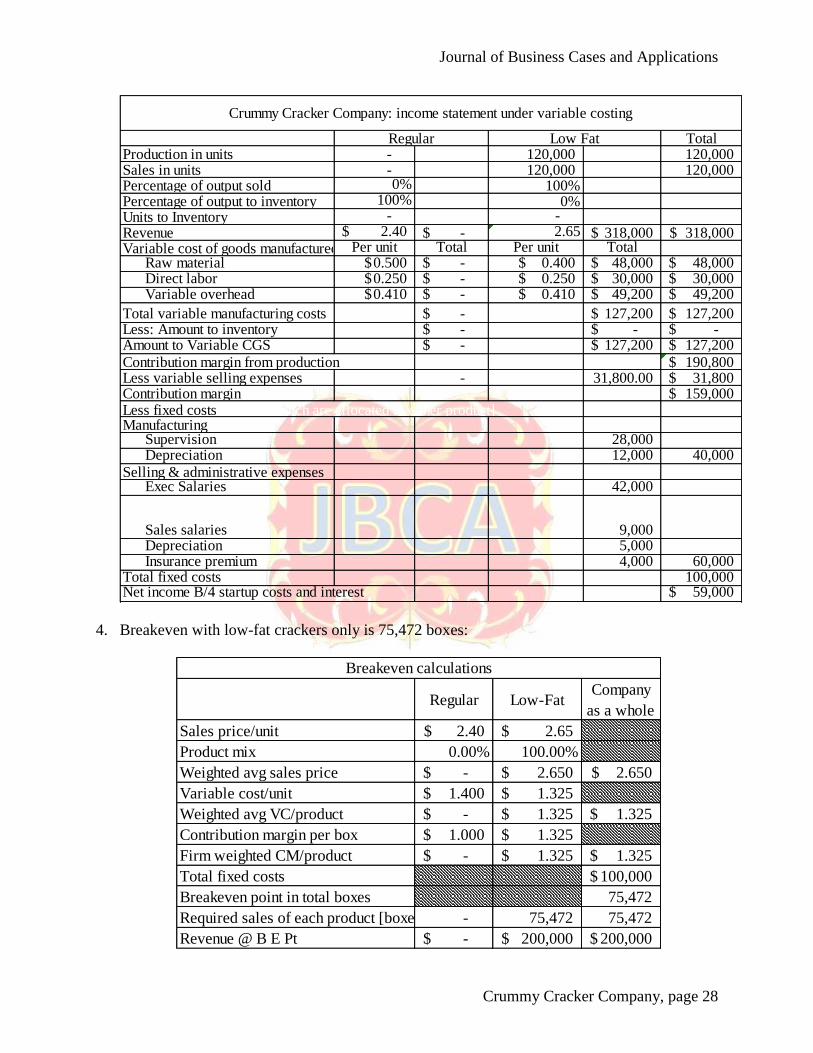
4. Breakeven with low-fat crackers only is 75,472 boxes:
TotalProduction in units - 120,000 120,000 Sales in units - 120,000 120,000 Percentage of output sold 0% 100%Percentage of output to inventory 100% 0%Units to Inventory - -
Revenue 2.40$ -$ 2.65 318,000$ 318,000$ Variable cost of goods manufactured Per unit Total Per unit Total
Raw material 0.500$ -$ 0.400$ 48,000$ 48,000$ Direct labor 0.250$ -$ 0.250$ 30,000$ 30,000$ Variable overhead 0.410$ -$ 0.410$ 49,200$ 49,200$
Total variable manufacturing costs -$ 127,200$ 127,200$ Less: Amount to inventory -$ -$ -$ Amount to Variable CGS -$ 127,200$ 127,200$
Contribution margin from production 190,800$ Less variable selling expenses - 31,800.00 31,800$ Contribution margin 159,000$ Less fixed costs [none of which are allocated to either product]Manufacturing
Supervision 28,000 Depreciation 12,000 40,000
Selling & administrative expensesExec Salaries 42,000
Sales salaries 9,000 Depreciation 5,000 Insurance premium 4,000 60,000
Total fixed costs 100,000 Net income B/4 startup costs and interest 59,000$
Crummy Cracker Company: income statement under variable costing
Regular Low Fat
Regular Low-FatCompany
as a whole
Sales price/unit 2.40$ 2.65$
Product mix 0.00% 100.00%
Weighted avg sales price -$ 2.650$ 2.650$
Variable cost/unit 1.400$ 1.325$
Weighted avg VC/product -$ 1.325$ 1.325$
Contribution margin per box 1.000$ 1.325$
Firm weighted CM/product -$ 1.325$ 1.325$
Total fixed costs 100,000$
Breakeven point in total boxes 75,472
Required sales of each product [boxes] - 75,472 75,472
Revenue @ B E Pt -$ 200,000$ 200,000$
Breakeven calculations

Journal of Business Cases and Applications
Crummy Cracker Company, page 29
Sale of 120,000 boxes is 44,528 boxes over the breakeven point. 44,528 boxes at a
contribution margin of $1.325 per box is $59,000 [rounded]. Q. E. D.! This question
effectively asks for the number of boxes of low-fat crackers they would have to sell to have
the same contribution they would get from selling 120,000 boxes of regular crackers. Here is
the equation needed to solve this:
120,000 boxes * $1.00/box = $1.325/box * X
X = 90,566 [rounded]
PART 6: INCREMENTAL ANALYSIS AND DECISION MAKING
1. Part a: Inventory value of 10,000 boxes of old crackers under absorption costing, assuming
initial production of 120,000. Variable manufacturing cost is $1.16/box; fixed costs are
$40,000 per year, or $0.33/box, for a total unit cost of $1.49/bos. $1.49/box * 10,000 boxes is
$14,900.
Part b. The same crackers under variable costing would have an inventory value of $11,600
[$1.16/box * 10,000].
2. Part a: The farmer is not going to pay for the crackers and it will cost Crummy Cracker $500
to “unpackage” the crackers. They would be $500 worse off than they would if they just
tossed the crackers in the trash [assuming disposal was free—but see part 2c!]. Other than the
animal welfare folks getting their noses out of joint, there are probably no particular
ramifications here.
Part b: The answer to part 2a would be the same--$500. The value of the inventory is a
classic example of a sunk cost. Even if the crackers had gold dust in them and cost gazillions
to produce, they are still a sunk cost.
Part c: Hauling the crackers to the landfill would cost nearly $577.
Part d: The cost of unpackaging the crackers would be the same as in requirement 2a.
However, they would be recovering the cost of the crackers themselves--$1.16/box * 10,000
boxes = $11,600. This is better than requirement 2a because at least they are recovering the
Gross weight per box in ounces 17
Number of boxes 10,000
Total ounces 170,000
Ounces per pound 16
Total pounds to be disposed of 10,625
First 500 pounds is a fixed charge 500
Pounds subject to variable charge 10125
Pounds per ton 2000
Tons subject to variable charge 5.0625
Charge per ton 110.00$
Tonnage charge 556.88$
Add fixed fee 20.00
Total cost to dispose of the stale crackers 576.88$

Journal of Business Cases and Applications
Crummy Cracker Company, page 30
variable production cost. They would be $11,100 [= $11,600 – 500] better off for having
recovered their variable costs.
Part e: There would be no impact on net income. However, the potential fallout from bad
publicity could be a public relations nightmare. The newspaper headline [or leader on the
11:00 pm news] might be “Local Cracker Baker Donates Stale Inventory to Food Bank; CEO
characterized as indifferent to the plight of those he laid off.”
3. Total variable cost per box is normally $1.40, but the commissions [$0.24] would be
avoided and they would save $0.06 on the boxes, reducing the variable cost per box to
$1.10. With a sales price of $1.20, Crummy Cracker would make a net contribution of
$1,000. But see question 4, below.
4. If the Sooper Dooper order displaced 10,000 boxes at the standard contribution of $1.00 per
box, they would be losing $0.90 of contribution on every box sold to Sooper Dooper that
could have been sold at the regular price.

Journal of Business Cases and Applications
Crummy Cracker Company, page 31
PART 7: PERFORMANCE REPORTING AND VARIANCE ANALYSIS
The analysis of the variances looks like this:
Line item
Actual
results
Price,
spending, and
efficiency
variances
Flexible
budget
Volume
variances
Static
budget
Cracker volume 123,000 - 123,000 3,000 120,000
Revenue 289,050$ (6,150)$ 295,200$ 7,200$ 288,000$
Direct material 62,300 800 61,500 1,500 60,000
Direct labor 31,500 750 30,750 750 30,000
Variable
overhead 50,175 (255) 50,430 1,230 49,200
Total variable
manufacturing
cost 143,975 1,295 142,680 3,480 139,200
Contribution
margin from
production 145,075 (7,445) 152,520 3,720 148,800
Sales
commissions 28,905 (615) 29,520 720 28,800
Contribution
margin 116,170 (6,830) 123,000 3,000 120,000
Depreciatioon on
bakery
equipment 12,000 - 12,000 - 12,000
Bakery
supervision 32,000 4,000 28,000 - 28,000
Fire insurance
premium 4,000 - 4,000 - 4,000
Sales salaries 9,000 - 9,000 - 9,000
Executive
salaries 42,000 - 42,000 - 42,000
Depreciation on
office equipment 5,000 - 5,000 - 5,000
Total fixed costs 104,000 4,000 100,000 - 100,000
Net income
before interest 12,170 (10,830) 23,000 3,000 20,000
Interest on
mortgage 2,586 - 2,586 - 2,586
Interest on line of
credit 967 347 620 - 620
Net income 8,617$ (11,177)$ 19,794$ 3,000$ 16,794$
Total profit
variance (8,177)$
Crummy Cracker Company Variance Analysis

Journal of Business Cases and Applications
Crummy Cracker Company, page 32
Students should make the following points:
1. They sold 3,000 boxes more than expected, but revenue was off $6,150 because of the nickel
cut in the average sales price.
2. Net variable manufacturing costs were almost $1,300 higher than the flexible budget amount.
Students should recognize that the $3,480 unfavorable volume variance was due to the fact
that they sold more boxes of crackers. Variable costs would be expected to increase in
proportion to sales.
3. Contribution margin was $7,445 less than the flexible budget. Variable manufacturing costs
were higher and the sales price was lower, leading to an unfavorable variance in the total
contribution margin.
4. Fixed costs were as expected, with the exception of bakery supervision and a small
unfavorable variance for the interest on the line of credit.
5. The overall net impact on profit was an unfavorable variance of $8,177. Unfavorable price,
spending, and efficiency variances amounting to $11,177 were offset by a favorable volume
variance of $3,000 arising from the sale of 3,000 more boxes of crackers.