Cruise Shipping and Urban Development
68
14 Discussion Paper 2015 • 14 Thanos Pallis University of the Aegean, Greece Cruise Shipping and Urban Development State of the Art of the Industry and Cruise Ports
Transcript of Cruise Shipping and Urban Development
14Discussion Paper 2015 • 14
Thanos Pallis University of the Aegean, Greece
Cruise Shipping and Urban DevelopmentState of the Art of the Industry and Cruise Ports
Cruise Shipping and Urban Development: State of the Art of the Industry
and Cruise Ports
Discussion Paper No. 2015-14
Thanos PALLIS
University of the Aegean
Chios Greece
May 2015

THE INTERNATIONAL TRANSPORT FORUM
The International Transport Forum at the OECD is an intergovernmental organisation with 54 member
countries. It acts as a strategic think-tank, with the objective of helping shape the transport policy agenda
on a global level and ensuring that it contributes to economic growth, environmental protection, social
inclusion and the preservation of human life and well-being. The International Transport Forum organises
an Annual Summit of Ministers along with leading representatives from industry, civil society and
academia.
The International Transport Forum was created under a Declaration issued by the Council of Ministers of
the ECMT (European Conference of Ministers of Transport) at its Ministerial Session in May 2006 under
the legal authority of the Protocol of the ECMT, signed in Brussels on 17 October 1953, and legal
instruments of the OECD.
The Members of the Forum are: Albania, Armenia, Australia, Austria, Azerbaijan, Belarus, Belgium,
Bosnia and Herzegovina, Bulgaria, Canada, Chile, the People’s Republic of China, Croatia, the Czech
Republic, Denmark, Estonia, Finland, France, the Former Yugoslav Republic of Macedonia, Georgia,
Germany, Greece, Hungary, Iceland, India, Ireland, Italy, Japan, Korea, Latvia, Liechtenstein, Lithuania,
Luxembourg, Malta, Mexico, the Republic of Moldova, Montenegro, the Netherlands, New Zealand,
Norway, Poland, Portugal, Romania, the Russian Federation, Serbia, the Slovak Republic, Slovenia, Spain,
Sweden, Switzerland, Turkey, Ukraine, the United Kingdom and the United States.
The International Transport Forum’s Research Centre gathers statistics and conducts co-operative research
programmes addressing all modes of transport. Its findings are widely disseminated and support
policymaking in member countries as well as contributing to the Annual Summit.
Discussion Papers
The International Transport Forum’s Discussion Paper Series makes economic research, commissioned or
carried out at its Research Centre, available to researchers and practitioners. The aim is to contribute to the
understanding of the transport sector and to provide inputs to transport policy design.
ITF Discussion Papers should not be reported as representing the official views of the ITF or of its member
countries. The opinions expressed and arguments employed are those of the authors.
Discussion Papers describe preliminary results or research in progress by the author(s) and are published to
stimulate discussion on a broad range of issues on which the ITF works. Comments on Discussion Papers
are welcomed, and may be sent to: International Transport Forum/OECD, 2 rue André-Pascal, 75775 Paris
Cedex 16, France.
For further information on the Discussion Papers and other JTRC activities, please email:
The Discussion Papers can be downloaded from:
www.internationaltransportforum.org/jtrc/DiscussionPapers/jtrcpapers.html
The International Transport Forum’s website is at: www.internationaltransportforum.org
This document and any map included herein are without prejudice to the status of or sovereignty over any territory, to the
delimitation of international frontiers and boundaries and to the name of any territory, city or area.

CRUISE SHIPPING AND URBAN DEVELOPMENT
A. Pallis — Discussion Paper 2015-14 — © OECD/ITF 2015 3
Table of Contents
1. Cruise Shipping: State of the Art and Growth Potential ..................................................... 4
1.1. Cruise industry characteristics .................................................................................................. 4 1.2. Cruise industry organisation ................................................................................................... 11 1.3. The geography of cruise shipping ........................................................................................... 18 1.4. Cruise fleet: Renewal and economies of scale ........................................................................ 24
2. Cruise Ports: Characteristics, Performance and Competition ........................................... 29
2.1. Cruise ports: Characteristics and categorisation ..................................................................... 29 2.2. Major cruise ports ................................................................................................................... 32 2.3. Specialisation patterns ............................................................................................................ 35 2.4. Governance of cruise ports ..................................................................................................... 40 2.5. Cruise port competition .......................................................................................................... 45
Notes .............................................................................................................................................
Bibliography ............................................................................................................................. 64
CRUISE SHIPPING AND URBAN DEVELOPMENT
4 A. Pallis — Discussion Paper 2015-14 — © OECD/ITF 2015
1. Cruise shipping: state of the art and growth potential
1.1. Cruise industry characteristics
What is cruise shipping?
Cruise shipping has first established as the transportation of pleasure-seeking upper class
travellers on seagoing vessels offering one or more ports of call in the United States and the
Caribbean. Today this is a highly efficient global business. Modern specialised ships – radically
different from cargo vessels – the use of an increasing number of cruise ports of call and turnaround
ports so as to provide their customers excellent in-port and destination experiences, and convenient
departures from proximal embarkation cities being fundamental tenets of the industry.
Defined as a mixture of maritime transport, travel and tourism services, facilitating the leisure
activity of passengers paying for an itinerary and, potentially, other services on board, and includes at
least one night on board on a seagoing vessel having a capacity of at least 100 passengers. Unlike
conventional forms of tourism, the transportation (the cruise ship) is the core element of the
experience instead of being a simple conveyance. As such, the cruise industry must address multiple
considerations related to on-board amenities, itineraries, ports of call, and shore excursions. This takes
place in specific markets, each having its own regional characteristics, with the Caribbean and the
Mediterranean being the most important.
Since the late 1960s, when specialised vessels of speed and comfort replaced the last liners,
cruise shipping has witnessed uninterrupted growth. While the global financial crisis of 2008-09 had a
major impact over maritime cargo shipping, cruise lines and cruise ports continued experiencing
steadily rising numbers of passengers. It did so even when an unfortunate event, the Costa Concordia
loss, created the most sustained period of negative publicity for the industry. The industry managed to
"cruise through the perfect storm1", and in 2014 almost 22 million passengers enjoyed a cruise on one
of the 296 cruise vessels taking place in one of the cruise regions of the world (North America,
Caribbean, South America, Mediterranean, North Europe, Australia, Asia, Africa). Ten years before
the number of people that had embarked on a cruise were just 11.8 million.
The modern cruise product is diversified. Throughout its history, the industry has responded to
vacation desires of its guests and embraced innovation to develop new destinations, new ship designs,
new and diverse on-board amenities, facilities and services, plus wide-ranging shore side activities.
Cruise lines have also offered their guests new cruise themes and voyage lengths to meet the changing
vacation patterns of cruise passengers and expand demographically the target groups.
Product specialisation has led to distinctive market segments, including budget/contemporary,
premium, and luxury cruises, with each type offered on-board vessels with different technical
characteristics and associated with different facilities, and services. Cruises of different types are today
provided with "floating hotels" accommodating a large number of passengers of different
socioeconomic status for at least two days offer itineraries in all five continents, with aim being the
provision of pleasure to the cruise passengers rather than the transportation itself.
CRUISE SHIPPING AND URBAN DEVELOPMENT
A. Pallis — Discussion Paper 2015-14 — © OECD/ITF 2015 5
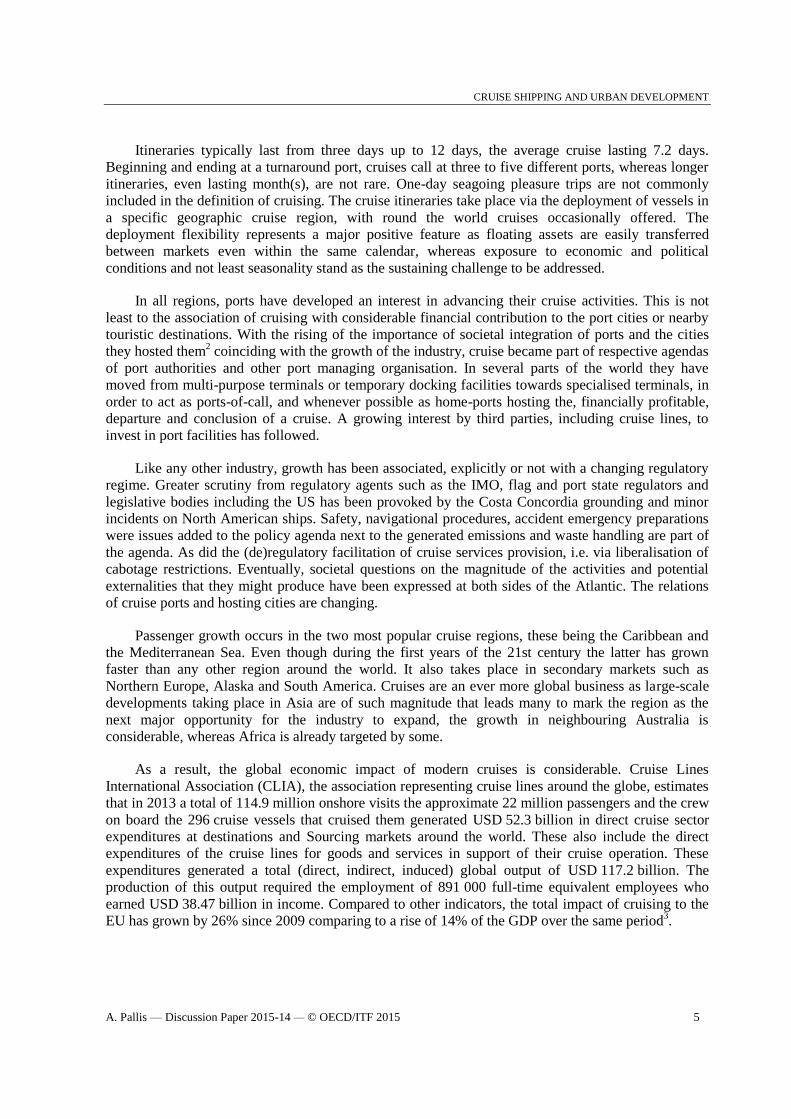
Itineraries typically last from three days up to 12 days, the average cruise lasting 7.2 days.
Beginning and ending at a turnaround port, cruises call at three to five different ports, whereas longer
itineraries, even lasting month(s), are not rare. One-day seagoing pleasure trips are not commonly
included in the definition of cruising. The cruise itineraries take place via the deployment of vessels in
a specific geographic cruise region, with round the world cruises occasionally offered. The
deployment flexibility represents a major positive feature as floating assets are easily transferred
between markets even within the same calendar, whereas exposure to economic and political
conditions and not least seasonality stand as the sustaining challenge to be addressed.
In all regions, ports have developed an interest in advancing their cruise activities. This is not
least to the association of cruising with considerable financial contribution to the port cities or nearby
touristic destinations. With the rising of the importance of societal integration of ports and the cities
they hosted them2 coinciding with the growth of the industry, cruise became part of respective agendas
of port authorities and other port managing organisation. In several parts of the world they have
moved from multi-purpose terminals or temporary docking facilities towards specialised terminals, in
order to act as ports-of-call, and whenever possible as home-ports hosting the, financially profitable,
departure and conclusion of a cruise. A growing interest by third parties, including cruise lines, to
invest in port facilities has followed.
Like any other industry, growth has been associated, explicitly or not with a changing regulatory
regime. Greater scrutiny from regulatory agents such as the IMO, flag and port state regulators and
legislative bodies including the US has been provoked by the Costa Concordia grounding and minor
incidents on North American ships. Safety, navigational procedures, accident emergency preparations
were issues added to the policy agenda next to the generated emissions and waste handling are part of
the agenda. As did the (de)regulatory facilitation of cruise services provision, i.e. via liberalisation of
cabotage restrictions. Eventually, societal questions on the magnitude of the activities and potential
externalities that they might produce have been expressed at both sides of the Atlantic. The relations
of cruise ports and hosting cities are changing.
Passenger growth occurs in the two most popular cruise regions, these being the Caribbean and
the Mediterranean Sea. Even though during the first years of the 21st century the latter has grown
faster than any other region around the world. It also takes place in secondary markets such as
Northern Europe, Alaska and South America. Cruises are an ever more global business as large-scale
developments taking place in Asia are of such magnitude that leads many to mark the region as the
next major opportunity for the industry to expand, the growth in neighbouring Australia is
considerable, whereas Africa is already targeted by some.
As a result, the global economic impact of modern cruises is considerable. Cruise Lines
International Association (CLIA), the association representing cruise lines around the globe, estimates
that in 2013 a total of 114.9 million onshore visits the approximate 22 million passengers and the crew
on board the 296 cruise vessels that cruised them generated USD 52.3 billion in direct cruise sector
expenditures at destinations and Sourcing markets around the world. These also include the direct
expenditures of the cruise lines for goods and services in support of their cruise operation. These
expenditures generated a total (direct, indirect, induced) global output of USD 117.2 billion. The
production of this output required the employment of 891 000 full-time equivalent employees who
earned USD 38.47 billion in income. Compared to other indicators, the total impact of cruising to the
EU has grown by 26% since 2009 comparing to a rise of 14% of the GDP over the same period3.

CRUISE SHIPPING AND URBAN DEVELOPMENT
6 A. Pallis — Discussion Paper 2015-14 — © OECD/ITF 2015
Evolution of cruise activities
Within the first 14 years of the 21st century cruise recorded an admirable growth. A total of
21.6 million people took cruise vacations within 2014. This number is more than double the one
recorded a decade before; 10.5 million passengers cruised in 2004. The number of people that cruised
at the turn of the century in 2000, was just one-third of today’s 7.2 million. Since 1990, over
196.4 million passengers have taken a two or more days' cruise, with each of them visiting more than
one port.
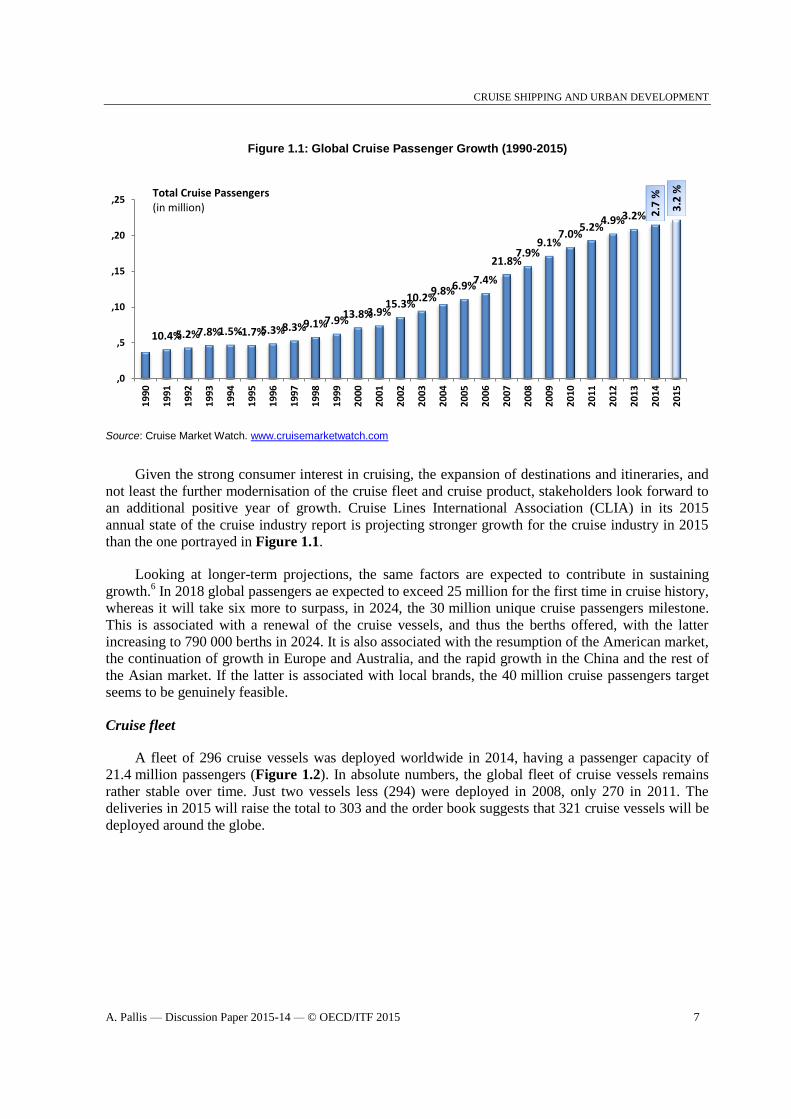
Figure 1.1 visualises the global cruise passenger growth since 1990, when 3.8 million people
decided to cruise. The global growth rate of the cruise industry has been enduring and stable, at around
seven percent per year in spite of economic cycles of growth and recession. The year 1997 was the
first year ever that more than 5 million people took a cruise, whereas 2004 was the first year that more
than 10 million people decided to take a cruise within a single year. Over a similar period global
tourist arrivals have risen by 57% to an estimated 1.09 billion tourists in 2013. The UNWTO reports
that 5% of global tourists arrived at their destinations by water, cruise and ferry4.
These trends confirm the remarkable dynamics of the industry and its resilience in the face of the
economic, social, political, or any other crises that regularly challenge the tourism sector. Stagnation
did not occur even when the Costa Concordia grounding in 2012, generated some catastrophic public
relations, when minor incidents on ships operated by leading firms, or environmental challenges (i.e.
emissions) were seemingly ready to deteriorate the operating context and growing prospects. Despite
the rising insurance costs, the lowering yields, cruise companies managed to gain trust and more
passengers on-board.
Looking at the shortest-term comparison, in 2014 the total number of passengers equals to 2.7%
higher than the number of those that had cruised the year before. While for other industries this would
be an achievement, a note of caution is needed in the case of cruising. This growth means that 2014
was the year with the slowest increase in number of cruising passengers over the last 19 years. Along
with some concerns about the externalities produced in some of the most heavily visited cities, the
year concluded with some analysts arguing that this is the "end of the beginning" for the cruise
industry, and the sector needs to explore the best ways to "move to another level in order to achieve
the king of consistently improving profitability that a mature industry is expected to deliver for its
stakeholders5."
CRUISE SHIPPING AND URBAN DEVELOPMENT
A. Pallis — Discussion Paper 2015-14 — © OECD/ITF 2015 7
Figure 1.1: Global Cruise Passenger Growth (1990-2015)
Source: Cruise Market Watch. www.cruisemarketwatch.com
Given the strong consumer interest in cruising, the expansion of destinations and itineraries, and
not least the further modernisation of the cruise fleet and cruise product, stakeholders look forward to
an additional positive year of growth. Cruise Lines International Association (CLIA) in its 2015
annual state of the cruise industry report is projecting stronger growth for the cruise industry in 2015
than the one portrayed in Figure 1.1.
Looking at longer-term projections, the same factors are expected to contribute in sustaining
growth.6 In 2018 global passengers ae expected to exceed 25 million for the first time in cruise history,
whereas it will take six more to surpass, in 2024, the 30 million unique cruise passengers milestone.
This is associated with a renewal of the cruise vessels, and thus the berths offered, with the latter
increasing to 790 000 berths in 2024. It is also associated with the resumption of the American market,
the continuation of growth in Europe and Australia, and the rapid growth in the China and the rest of
the Asian market. If the latter is associated with local brands, the 40 million cruise passengers target
seems to be genuinely feasible.
Cruise fleet
A fleet of 296 cruise vessels was deployed worldwide in 2014, having a passenger capacity of
21.4 million passengers (Figure 1.2). In absolute numbers, the global fleet of cruise vessels remains
rather stable over time. Just two vessels less (294) were deployed in 2008, only 270 in 2011. The
deliveries in 2015 will raise the total to 303 and the order book suggests that 321 cruise vessels will be
deployed around the globe.
10.4% 5.2% 7.8% 1.5% -1.7% 5.3% 8.3% 9.1% 7.9% 13.8% 3.9%
15.3% 10.2%
9.8% 6.9% 7.4%
21.8% 7.9%
9.1% 7.0%
5.2% 4.9% 3.2% 2
.7 %
3.2
%
,0
,5
,10
,15
,20
,25
19
90
19
91
19
92
19
93
19
94
19
95
19
96
19
97
19
98
19
99
20
00
20
01
20
02
20
03
20
04
20
05
20
06
20
07
20
08
20
09
20
10
20
11
20
12
20
13
20
14
20
15
Total Cruise Passengers (in million)

CRUISE SHIPPING AND URBAN DEVELOPMENT
8 A. Pallis — Discussion Paper 2015-14 — © OECD/ITF 2015
Figure 1.2: Global Cruise Fleet 2008-2019 (Ships & Berths)
Source: Cruise Industry News, 2014-2015 Annual Report.
The latter number does not include an estimation of withdraws though, thus should be treated
with caution. The fact that the global cruise fleet increased by two during the period 2008-2014 even
though 50 new cruise vessels were delivered over the same period, suggests that the rise of the
numbers might be questionable. It also gives a clear sign that a major fleet renewal has been a core
foundation of the continuous growth of the cruise industry, and this story is hardly evident when
noting the numbers of ships.
Emphasis on the number of vessels would be misleading for another reason as well. Major cruise
vessels are becoming bigger than in the past. The two vessels hosting more than 6 000 passengers, the
eight vessels with a capacity of more than 4 000 passengers and 19 of the 37 cruise ships having a
capacity of more than 3 000 passengers have been delivered since 2009. The total of berths deployed
increased by 26.5% within the last seven years, from 373 400 in 2009 to 472 200 in 2015.
The rise of the passengers cruising per year from 7.2 million in 2000 to almost 22 million in 2014
has been the outcome of the renewals and rising capacity scale of cruise vessels, the improvements in
shipbuilding, ports, and the growing interest of destinations that allow for planning of more complex
itineraries, the sophistication and specialisation of the product offered. Cruise ships offer a new
generation of onboard features and a world of innovation and services that exceed the expectations of
a growing population of travelers. They also offer facilities to accommodate family members of all
generations traveling together or even passengers cruising solo expanding also the demographics of
potential cruisers. Cruisers can easily find a cruise line, ship, stateroom and itinerary to perfectly suit
them. Notably, 89% of cruisers were highly satisfied with their cruise vacations, and 89% would
recommend cruise to a friend7. Carnival Cruise Lines, the world’s largest cruise company, has
renewed the largest fleet in the world with more than 30 new ship additions since 2007. The second
biggest cruise company, Royal Caribbean Cruise Lines (RCCL) has led the race towards bigger cruise
ships with the Oasis class vessels accommodating more than 6 000 passengers and a crew of 2 000.
The estimated sales revenues for these vessels reached USD 33.8 billion in 2014 (Table 1.1).
America hosted the major share, 156 cruise ships were deployed in the region and hosted 13.1 million
passengers, generating revenue of USD 20.7 billion, the latter standing at 61.2% of the global market
,294 ,277 ,281 ,270 ,284 ,292 ,296 ,303 ,313 ,318 ,319 ,321
372.0 373.4 397.3 404.1
426.3 443.2 454.9 472.2 498.7 511.7 512.6 518.0
0
100
200
300
400
500
600
2008 2009 2010 2011 2012 2013 2014 2015 2016 2017 2018 2019
No of ships Berths (in .000)

CRUISE SHIPPING AND URBAN DEVELOPMENT
A. Pallis — Discussion Paper 2015-14 — © OECD/ITF 2015 9
sales. A total of 114 cruise ships deployed in Europe hosted in 2014 6.4 million passengers with the
estimated revenue standing at 10.1 billion dollars, or 29.9% of the global revenues. The 26 cruise ships
that provided cruises in Asia/Pacific recorded 1.9 million passengers, generating estimated revenue of
USD 3 billion, or 8.9% of the global revenues produced by cruising8.
Table 1.1: Cruise Industry Overview, 2014
Cruise fleet Passengers
(in million)
Estimated Sales Revenues
(in billion US dollars)
Global Market
share ($)
Worldwide 296 21.4 33.8
America 156 13.1 20.7 61.20%
Europe 114 6.4 10.1 29.90%
Asia/Pacific 26 1.9 3 8.90%
Source: Cruise Industry News (2015). 2014-2015 Annual Report
As in 2013, a total of 114.9 million onshore visits by passengers and crew generated
USD 52.3 billion in direct cruise sector expenditures at destinations and source markets around the
world.9 These also include the direct expenditures of the cruise lines for goods and services in support
of their cruise operation. These expenditures generated a total (direct, indirect, induced) global output
of USD 117.1 billion. The production of this output required the employment of 891 000 full-time
equivalent employees who earned USD 38.5 billion in income. In the USA, the total impact of
cruising has growth by 26% since 2009 comparing to a rise of 14% of the GDP over the same period.
In Europe, a number of economies enjoy cruise spending that exceeds one billion Euros, including the
two major source market UK & Ireland (3.2 billion) and Germany (3.1 billion), the third major source
market which is Italy that including shipbuilding reaches 4.6 billion, Spain (2.3 billion), Scandinavian
countries (1.5 billion), and France (1.1 billion).
Cruise source markets
North America has been the major source market over time, with more than half of the total
cruise passengers per year coming from this geographical region of the world (Table 1.2). In 2014 this
equals over 12 million people, out of the total 21.7 million cruise passengers, coming from North
America, which in absolute terms is the biggest number ever. The global share of the North American
market has been stabilised in recent years at around 55% as expansion in Europe has slowed down
comparing to the earlier period.
Beyond North America demand for cruising is mostly expressed in Europe. According to the
2013 data, 6.4 million European decided to cruise, with almost one out of four living in UK and
Ireland. A total of 3.2 million of passengers came from the rest of the world. These other markets have
demonstrated a stronger growth in recent years. Australasia and Asia (excluding Japan) have been the
most dynamic source markets of all. Even though these higher percentages are to a certain extend the
result of the small penetration levels of cruising in the particular markets in past years, it is also
indicative of the advancement of stakeholders strategies aiming to expand cruising in the particular
areas. Japan and Europe (excluding UK & Ireland) have also been regions that experienced a double-
digit growth since 2010. This is despite the fact that the very same years continental Europe
experienced conditions of a turbulent economic environment and the southern part of it austerity
measures. Latin America is the only source market that experienced a decline since 2010.
10

CRUISE SHIPPING AND URBAN DEVELOPMENT
10 A. Pallis — Discussion Paper 2015-14 — © OECD/ITF 2015
Table 1.2: Global Cruise source markets 2010-2013 (thousands)
2010 2011 2012 2013 Var 13/12 Var 13/10
North America 11 111 11 582 11 996 12 051 0.5% 8.5%
UK & Ireland 1 622 1 700 1 701 1 726 1.5% 6.4%
Europe
(excluding UK & Ireland)
3 945 4 368 4 438 4 631 4.3% 17.4%
Asia
(excluding Japan)*
915 855 1 124 1 260 12.1% 37.7%
Japan* 188 160 217 240 10.6% 27.7%
Australasia 451 632 699 839 20.0% 86.0%
Latin America and
others*
1 030 1 150 1 100 953 -13.4% -7.5%
TOTAL 19 262 20 447 21 275 21 700 2.0% 12.7%
Year-on-year growth (%) 8.2% 6.2% 4.0% 2.0%
* Estimates
Notes: North America totals are based on CLIA figures (which include river passengers) but adjusted for passengers travelling with non-CLIA brands | Other totals include only ocean passengers.
Source: Peisley, T. (2014).
The ten-year growth of this demand (2004-2014) provides evidence of two facts. First, that the
cruise industry has offered a product for which more and more people are interested in experiencing.
The total of cruise passengers per year increased by 10 million within this period. Second, there is a
trend towards a globalised cruise industry. Demand in North American experienced a 43.6% growth.
Europe was the drive for cruising though; the total of passengers increased by 136.2% as further
interest to cruise in the region provided the incentive to cruise lines to build more itineraries
throughout the continent, and foremost in the Mediterranean sea. In terms of percentages though, it
was the total of the regions located in the rest of the world that were the most dynamic ones over the
last decade. Demand for cruise in the "rest of the world" grew by 186.1%, yet the aggregate of cruise
passengers in these regions remains small and stands today at half of the European market stand10
.
Despite the remarkable growth of the last decade, these numbers correspond to notably low levels
of penetration in respective source countries (Table 1.3). USA which is the source market of 51.5% of
global passengers, but this corresponds to only 3.5% penetration to its 319 million population. In UK
& Ireland and Germany, the two biggest European markets, penetration levels stand at 2.8% and 2.1%
of the respective populations. With 2014 data subject to confirmation, it has been reported that
Germany grew by 5% to overtake the UK to become the first European source market with
1.77 million passengers in 2014, mainly due to capacity increases from German cruise lines AIDA
Cruises and TUI Cruises. In aggregate, less than 3% of the European population has taken a cruise. In
Asia the number is even lower, at below 1%. In strong emerging economies, such as South America or
Africa, the number of people cruising is negligible. Looking further into the list, it is noted that all the
other major source countries contribute with less than one million passengers per year, with the level
of penetration being lower than those of the three major markets. The only exception is Australia
where market penetration is comparatively higher, yet standing at 3.4% only. These low levels of
penetration allow thinking of further growth potential.

CRUISE SHIPPING AND URBAN DEVELOPMENT
A. Pallis — Discussion Paper 2015-14 — © OECD/ITF 2015 11
Table 1.3: Cruise penetration in global markets 2013
Market Pax
(in
thousands)
Share of
global pax -
%
5- year
growth -
%
Market
penetration -
%
Population
(in million)
USA 11,016 51.5 15 3.5 319
UK & Ireland 1,726 8.1 17 2.8 61
Germany 1,687 7.9 86 2.1 82
Italy 869 4.1 28 1.5 58
Australia 784 3.6 137 3.4 23
Canada 734 3.4 1 2.1 22
Brazil 732 3.4 85 0.4 183
France 522 2.4 69 0.8 62
Spain 475 2.2 -4 1.2 40
Scandinavia &
Finland
289 1.4 135 1.5 19
Note: USA and Canada totals are for CLIA member only lines, which account for 97.5% of those markets’ passengers. They are also the only markets where river cruise passengers are included in the totals shown here.
Sources: Seatrade & CLIA Global.
1.2 Cruise industry organisation
Cruise lines: Companies and Brands
The expansion of cruise has taken place based on a highly concentrated organisational structure,
Today 52 brands operate around the globe with few cruise lines controlling the major part of the
industry (Table 1.4). The founders of modern cruise industry, Carnival Corporation (founded in
1972), Royal Caribbean Cruise Ltd (RCCL) (founded in 1968), and Norwegian Cruise Lines (founded
in1966), are the three major groups of today.
In combination the major two corporations, Carnival and RCCL controlled in 2014 a total of
143 vessels, 16 different brands and shared the accommodation of 72.5% of worldwide cruise
passengers. Carnival is the largest group in all measurements, with 10 different brands operating 102
vessels and hosted 48.1% of the cruise passengers in 2014. The six brands associated with RCCL
hosted a 24.1% share of worldwide passengers on board 41 cruise ships. Two other companies have a
substantial global share, Norwegian Cruise Line Holdings (NCLH) (10.4% of global passengers) and
MSC (5.2%), and three more companies (Disney, Hurtigruten, Thomson) carried more than 1% of the
cruise passengers in 2014. 29 smaller brands with lesser shares complete the list of the companies
offering cruises around the globe.
The model of development of the top two corporations involves an extensive present
consolidation of different brands aiming to cover a variety of market segments. Beyond different and
potentially more effective corporate entities, these policies allow for differentiated services to be
offered and the marketing of each brand as a unique of its kind. Some cruise lines have specialties; for
example, Saga Cruises only allows passengers over 50 years old aboard their ships, Windstar Cruises
only operate tall ship and Regent Seven Seas operates medium-sized vessels designed such that 90%
of their suites are balconies. Several specialty lines offer "expedition cruising" or only operate small
ships, visiting certain destinations such as the Arctic and Antarctica.

CRUISE SHIPPING AND URBAN DEVELOPMENT
12 A. Pallis — Discussion Paper 2015-14 — © OECD/ITF 2015
Table 1.4: Cruise Companies and Brands in operation (as in 2014)
Parent Brand name Sector % share of
worldwide
passengers
Carnival Corporation
Ships: 2014: 102 | 2015:
107
AIDA Contemporary 3.7%
Carnival Cruise Lines Contemporary 21.3%
Costa Cruises Contemporary 7.4%
Cunard Line Premium 0.9%
Holland America Line Premium 3.0%
Princess Cruises Premium 7.9%
Iberocruceros* Contemporary 0.8%
P&O Cruises Premium 1.7%
P&O Cruises Australia Budget/Contemporary 1.2%
Seabourn Cruises Luxury 0.2%
Total 48.1%
Royal Caribbean Cruises
Ships: 2014: 41 | 2015: 48
Azamara Club Cruises Premium Plus 0.2%
Celebrity Cruises Premium 4.2%
Croisières de France Budget 0.5%
Pullmantur Budget 1.6%
Royal Caribbean International Contemporary 16.7%
TUI Cruises Contemporary/ Premium 1.3%
Total 24.4%
Norwegian Cruise Line
Ships: 2014: 22 | 2015: 24
Norwegian Contemporary 9.5%
Oceania Cruises Premium 0.6%
Regent Seven Seas Luxury 0.3%
Total 10.4%
MSC
Ships: 2014: 12 | 2015: 14
MSC Cruises Contemporary 5.2%
TOTAL OF MAJOR-4
Ships: 2014: 187 | 2015:
193
88.1%
All other
Ships: 2014: 119 | 2015:
110
Disney 2.8
Hurtigruten 1.4
Thomson 1.3
(29 brands; each hosting less than 1% of worldwide
passengers)
6.4 * Costa Cruises integrated Iberocruceros at the end of 2014
Sources: Cruise Market Watch 2015; Peisley, 2014; CLIA 2014; Cruise Line websites.
Of the 52 cruise line brands operating around the globe Carnival Corporation is associated with
10 brands. Four of them offer Premium cruises (Cunard, Holland America Line, Princess Cruises,
P&O Cruises) four of them Contemporary cruises (AIDA, Costa Cruises, Carnival Cruise Lines, and
Iberocruceros, which was integrated in Costa Cruises at the end of 2014), one of them Luxury
(Seabourn) and one budget/contemporary (P&O Cruises Australia). RCCL operates 6 different brands;
a Premium Plus (Azamara), a Premium (Celebrity Cruises), a Contemporary/Premium (TUI Cruises,
which is a German-based joint venture with TUI AG) and Budget (Pullmantur, Croisières de France).
NCL has also moved towards this direction at the end of 2014 through the acquisitions of a Premium
(Oceania) and a Luxury (Regent Seven Seas) brand, in a combination that further the consolidation of
the cruise industry.
All three major parent companies are listed corporations. The major two have between them
many years of strong profitability, though profits of recent years standing at lower levels comparing to

CRUISE SHIPPING AND URBAN DEVELOPMENT
A. Pallis — Discussion Paper 2015-14 — © OECD/ITF 2015 13
those of a decade earlier. NCL has enjoyed years of lower profitability, yet following restructuring it
has achieved highest operating and returns on capital margins. MSC Cruises stands as the one brand
that differs, as is part of a family owned shipping group that is among the major global container
shipping lines. Operating mostly in the Mediterranean Sea in the past, the company has expanded its
deployment patterns to include other regions as well. Notably, six brands dominate, Carnival, Princess,
Costa, Royal Caribbean, Norwegian and MSC, with the financial well-being of the respective
corporations depending on the performance of these brands. The magnitude and the evolution of the
direct revenues of the major three corporations are detailed in Table 1.5.
Table 1.5: Largest three cruise companies - Revenue & Net income 2006-2014 (in million USD)
Year Carnival Corporation
& plc
Royal Caribbean
Cruises Ltd
Norwegian Cruise
Line Holdings Ltd
All three
Revenue Net
Income
Revenue Net Income Revenue Net
Income
Revenue Net
Incom
e
2006 11 839 2 279 5 229 634 2 000 -131 19 068 2 782
2010 14 469 1 978 6 752 516 2 000 23 23 221 2 517
2011 15 793 1 912 7 537 607 2 200 127 25 530 2 646
2012 15 832 1 298 7 688 18 2 200 173 25 720 1 489
2013 15 456 1 078 7 959 474 2 570 101 25 985 1 653
2014 15 884 1 245 8 073 764 2 336 368* 26 293 2 009
*January-September 2014
Source: Cruise Business Review (2015).
All cruise lines continue expanding with the battle for market shares linked with new build
orders. Based on the vessels that are expected to reach the market until 2019, the Carnival Group will
reach 107 vessels and the RCCL group 48 vessels. RCCL has already confirmed that it has ordered
two vessels of the Quantum Class accommodating 4,905 passengers, to reach the market in 2016 and
2019 respectively and one of the Oasis class, of 6,294 passengers to be delivered in 2018. Projections
suggest that the growth in terms of berths for Carnival over the next five years will be 8.3%, (from
263,505 to 285,324); that of RCCL standing at 26.8% (reaching 150,174 from 118,441 in 2014) and
that of NCL at 22.2% to reach 52,925 berths in 1992. Of the top-4 the most aggressive one in
expansion is MSC, which following a 65.4% capacity expansion is on course to become the third
largest.
Beyond considerations of the type of product and amenities that cruise lines want to offer,
legislative trigger developments as regards the types of vessels ordered. In the aftermath of the
decision of Italian authorities to limit the size of vessels visiting the marquee port of Venice, the
presence of "Venice class", i.e. cruise ships that are small enough to avoid regulatory limitations
imposed in big vessels and sail into the Italian city, emerged.
As a result, all top 10 brands in terms of capacity expected to retain their inclusion in the top-10
list with only some minor changes and swapping positions, including the one between the top two
(Figure 1.3). These 10 brands (Carnival Cruise Lines; Royal Caribbean International; Princess
Cruises; Norwegian Cruise Line; Costa Cruises; MSC Cruises; Holland America Line; Celebrity
Cruises; AIDA Cruises; P&O Cruises) shared a combined capacity of 500,854 berths in 2014 and are
expected to reach 592,146 by 2019.

CRUISE SHIPPING AND URBAN DEVELOPMENT
14 A. Pallis — Discussion Paper 2015-14 — © OECD/ITF 2015
Figure 1.3: Top 20 cruise brands capacity in 2014 and 2019
Source: Peisley T. (2014).
The different brands follow a variance of strategies in order to achieve increased market shares.
Carnival is rebuilding through a strategy of restructuring deployment and itineraries, RCCL does so
based on board revenues and investment in mega-ships that allow moving to pay-for entertainments.
Aiming to fulfill these plans, a transfer of ships between brands is not uncommon. During
2015 Celebrity Century will transfer a vessel (Mein Schiff 3) to the TUI brand, Holland America will
transfer two ships to P&O Australia (Ryndam and Statendam), whereas Seabourn will transfer two
to Windstar (Legend and Seabourn Spirit).
Mergers and acquisitions are also rather common. Norwegian Cruise Lines purchased in 2014
from Prestige Cruise Holdings two brands, Oceania Cruises and Regent Seven Seas Cruises. In the
same year Carnival Corporation decided to absorb Iberocruceros into the Costa Brand. It was a most
significant consolidation, in 2003, the takeover of one of the four major players (P&O Princess
Cruises) by Carnival Corporation, which provided the foundations of today’s structures of cruise
shipping. With market concentration, consolidation, and management restructuring, being parts of
modern cruise companies, the concentration in the international cruise business might extend further
from year to year, and further consolidation take place.
Changing structures (1990s -2010s)
Two decades ago the global fleet of cruise ships had one third of the present passenger capacity,
whereas passengers per year were less than 20% of those that cruise today. The total of cruisers in
1990 was just 4.2 million passengers. In 1993 just 162 000 berths capacity and itineraries offered
attracted approximately 5 million cruise passengers. Yet, the global cruise fleet was standing at 294
vessels, in 2014 only two cruise vessels were added to the fleet.
With nine different groups having considerable stakes, the structures of the cruise lines were also
different. The biggest three groups of today were already present and even standing as the biggest of
all, yet their organisations were different. The Carnival Group operated five different brands, a total of
20 vessels of 22 000 berths. Royal Caribbean was a single brand operating nine vessels of 14,326
81
.93
8
72
.69
3
52
.76
2
43
.32
5
40
.55
36
.27
6
29
.30
3
27
.76
9
22
.47
17
.04
13
.4
11
.01
8
10
.81
6
8.2
4
8.0
83
7.4
3
5.6
22
4.6
64
3.7
59
3.6
96
85
.93
8
97
.82
1
52
.81
8
52
.92
5
47
.39
3
59
.27
6
28
.70
9
25
.61
9
28
.97
20
.65
1
13
.4
13
.16
8
19
.81
6
11
.03
8.0
83
7.4
3
8.8
76
4.6
64
3.7
59
1.8
0
20
40
60
80
100
1202014 Total berths 2019 Total berths

CRUISE SHIPPING AND URBAN DEVELOPMENT
A. Pallis — Discussion Paper 2015-14 — © OECD/ITF 2015 15
berths. NCL was also presented, standing fourth, but was operating as part of the three-brand group
Kloster that was later restructured to provide the foundations of the present corporation.
While the biggest three remain part of modern cruising, the other groups have been either
acquired or seized to exist. The P&O group, which was operating 12 vessels and standing marginally
third in terms of capacity, was to be overtaken in 2000s by Carnival. This was the major overtaking of
all and contributed to the present concentration of the industry. Similar were the fortunes, and thus the
contribution, of the then fifth major group, Costa/Paquet and its three brands (10 vessels, 8,376 berths)
and then sixth major group, Cunard/EffJohn and its three brands (11 vessels; 7 831 berths).
The three other corporations in the list were Greek-owned, Greek-flagged companies.
Epirotiki/Ulysses, Lelakis, and Chandris that were operating four, three, and two different brands
respectively. Whilst their role in introducing modern cruise to broader audience, and professionalise
the operations of cruise lines corporations have been instrumental, all of them have disappeared since
then, either due to disinvestment decisions or else. Whereas the Greek market remains a key one, in
terms of size and image of cruising, Greek flagged cruising has cease to exist since 2011 as the
decision of the Cypriot-interests Louis Cruises (renamed Celestyal in 2014) to shift its vessels to a
third flag, there are no more vessels operating under the Greek flag.
Market segmentation
The growth of cruising has led to market segmentation. Different types of vessels, associated with
different amenities offered on board and ashore, and itineraries, define types of cruises offered, in turn
having as target different groups of potential cruisers. In an attempt to broaden the group of potential
customers, cruise lines, or specific brands of the bigger corporations, provide and market its presence
in one, in some case more, of the major segments, namely contemporary, premium and luxury cruises,
or the fourth distinctive one, that of speciality cruises (Table 1.6). In North America, the major cruise
region of the world, contemporary cruises share of cruise passenger nights is 69.4% that of premium
cruises 26.9% and those of luxury and speciality cruises 1.9% and 0.8% respectively11
.
Contemporary cruises are popular amenity-packed cruises for people looking for lots of activities
and a great value. These mainstream cruises rival land based vacation by offering a comprehensive
and amenity filled vacation, inclusive of accommodations, meals, and entertainment, in a casual
environment, with newer (or extensively renovated) ships offer modern design and comforts, and
many more activities. Premium cruises are more upscale cruises also offering many amenities, with
increased focus on refined service and more space. Priced inclusive of accommodations, meals, and
entertainment, premium cruising's value still exceeds or rivals the best packages offered by upscale
hotels and resorts. Luxury cruises are defined by the highest levels of quality and personalized service
offered on luxury cruise ships and ashore to exotic ports. Expensive when compared to the rest of the
industry, luxury lines deliver value by offering more inclusive pricing than other cruise lines and
opportunities to travel to exotic destinations. A fourth market segment is speciality cruises. These
focus on a destination niche or a special style of cruising including expedition-style cruises, sailing
ships and a growing number of river cruises. They visit some of the world's most remote and unspoiled
places to offer a unique experience that guests find educational and adventurous.

CRUISE SHIPPING AND URBAN DEVELOPMENT
16 A. Pallis — Discussion Paper 2015-14 — © OECD/ITF 2015
Table 1.6: General Characteristics of different cruise market segments
Contemporary
Cruise Lines Premium Cruise
Lines Luxury Cruise
Lines Specialty Cruise Lines
Keyword Quantity Quality Exclusivity Adventure
Ships Large ships Medium-sized Ships Small Ships Very Small ships
Typical Pax
capacity
2 000 –5 600 1 500 – 2 500 100-800 100-300
Cabins Small cabins Large cabins Huge cabins or all
suites
Mixed cabin
accommodations
Food Good food Fine dining Gourmet cuisine Mixed dining options
Orientation Family friendly Family friendly, but
more adult-oriented Not family-friendly Not suitable for most
families
Amenities Fitness/Sports Spa-oriented Spa-oriented Few fitness/spa options
Length of
itineraries
3-7+ night 7-14 night itineraries 10+ night 3-20 night
Quality of
service
3-4 star service 4-5 star service 5-6 star service 3-5 star service
Price point $-$$$ $$-$$$ $$$$$ $$$$-$$$$$
Cruise Lines Carnival Cruise Line; Costa Cruise Line; Disney Cruise Line; MSC;
Norwegian Cruise
Line; Royal Caribbean
International
Azamara Cruise Line; Celebrity Cruises;
Holland America; Oceania Cruises; Princess Cruises
Crystal Cruises
Cunard Line
Regent Seven Seas
Cruises
Seabourn
Sea Dream
Silversea Cruises
Cruise West;
Delta Queen Steamboat;
Discovery World Cruises;
Hurtigruten;
Peter Deilmann;
Star Clippers;
Viking River Cruises
Windstar Cruises
Source: Mintel Academic (2013).
For at least contemporary and premium cruises, technology, and smart processes are used, for
example for check-in, connections, etc. A key innovation is the “online check-in”, completed at home
and verified via the cruise line’s system, and self-service machines whereby guests receive room
key/RFID wristbands and proceed to the ship. Along with advanced applications, such as holograms
throughout port directing guests to ship, and applications for guests, referring boarding time, on-board
entertainment, luggage tracking, tour transfers, last minute shore excursions offers and not least
ground handling support systems, improve the overall experience generating conditions for market
expansion.
Market concentration
The cruise industry is highly concentrated as the number of operating branches and involved
corporation is limited. Focusing on the different cruise regions, the level of concentration differs. The
North American market, the biggest of all is more concentrated than others, with the big three
corporations are sharing 90.3% and 4 brands control 76.5% of the market (Table 1.7). In the
Mediterranean, the second most popular region is far less concentrated, as 46 different brands operate
the four major brands (Costa, MSC, Norwegian, Royal Caribbean) which operate 51.3% of the
existing capacity.
The size of capital investment needed to enter the market, when most incumbent, publicly listed
cooperation’s have already access to substantial capital, and the bundling of services and activities that
is essential and has been achieved by those brands already operating in the young market of modern
cruise, make the variation of the present market structures rather unlikely in the forthcoming future.
However, while the market is concentrated in terms of ownership, the variation of the product is such
CRUISE SHIPPING AND URBAN DEVELOPMENT
A. Pallis — Discussion Paper 2015-14 — © OECD/ITF 2015 17
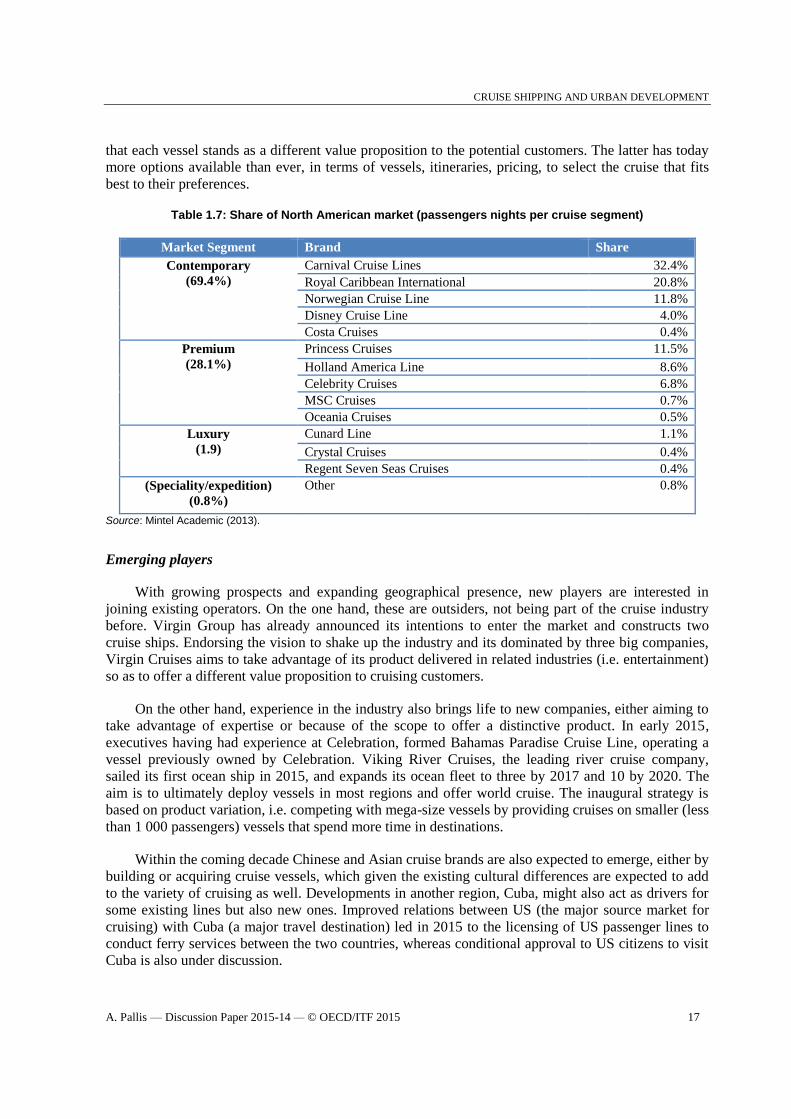
that each vessel stands as a different value proposition to the potential customers. The latter has today
more options available than ever, in terms of vessels, itineraries, pricing, to select the cruise that fits
best to their preferences.
Table 1.7: Share of North American market (passengers nights per cruise segment)
Market Segment Brand Share
Contemporary
(69.4%)
Carnival Cruise Lines 32.4%
Royal Caribbean International 20.8%
Norwegian Cruise Line 11.8%
Disney Cruise Line 4.0%
Costa Cruises 0.4%
Premium
(28.1%)
Princess Cruises 11.5%
Holland America Line 8.6%
Celebrity Cruises 6.8%
MSC Cruises 0.7%
Oceania Cruises 0.5%
Luxury
(1.9)
Cunard Line 1.1%
Crystal Cruises 0.4%
Regent Seven Seas Cruises 0.4%
(Speciality/expedition)
(0.8%)
Other 0.8%
Source: Mintel Academic (2013).
Emerging players
With growing prospects and expanding geographical presence, new players are interested in
joining existing operators. On the one hand, these are outsiders, not being part of the cruise industry
before. Virgin Group has already announced its intentions to enter the market and constructs two
cruise ships. Endorsing the vision to shake up the industry and its dominated by three big companies,
Virgin Cruises aims to take advantage of its product delivered in related industries (i.e. entertainment)
so as to offer a different value proposition to cruising customers.
On the other hand, experience in the industry also brings life to new companies, either aiming to
take advantage of expertise or because of the scope to offer a distinctive product. In early 2015,
executives having had experience at Celebration, formed Bahamas Paradise Cruise Line, operating a
vessel previously owned by Celebration. Viking River Cruises, the leading river cruise company,
sailed its first ocean ship in 2015, and expands its ocean fleet to three by 2017 and 10 by 2020. The
aim is to ultimately deploy vessels in most regions and offer world cruise. The inaugural strategy is
based on product variation, i.e. competing with mega-size vessels by providing cruises on smaller (less
than 1 000 passengers) vessels that spend more time in destinations.
Within the coming decade Chinese and Asian cruise brands are also expected to emerge, either by
building or acquiring cruise vessels, which given the existing cultural differences are expected to add
to the variety of cruising as well. Developments in another region, Cuba, might also act as drivers for
some existing lines but also new ones. Improved relations between US (the major source market for
cruising) with Cuba (a major travel destination) led in 2015 to the licensing of US passenger lines to
conduct ferry services between the two countries, whereas conditional approval to US citizens to visit
Cuba is also under discussion.

CRUISE SHIPPING AND URBAN DEVELOPMENT
18 A. Pallis — Discussion Paper 2015-14 — © OECD/ITF 2015
River cruise seems to enjoy a spring as well. The major operator alone, Viking Rivers, has
recently ordered more than 20 vessels itself in a year. Other operators have also invested in new
vessels, with European rivers and US river cruises being the ones that develop faster than other
markets.
1.3 The geography of cruise shipping
Deployment shares per region
The deployment shares of each region are a combination of the existing demand for cruises, and
the willingness of cruise lines to develop new markets. Looking at the capacity of the cruise vessels
deployed in each region (Table 1.8), Caribbean stands as the dominant, with 37.3% of the global
capacity. The Mediterranean Sea is the second biggest region of all, with a share of 19.9% of the
globally deployed capacity. The non-Mediterranean European market reaches 11.1% standing as the
third major region of all. In aggregate, in these three regions are deployed cruise vessels corresponding
to 68.3% of the global passenger capacity.
Table 1.8: Global Deployment Shares Deployment of Capacity (shares; 2004-2014)
Region 2004 2008 2014
Caribbean 40.4% 37.2% 37.3%
Alaska 7.7% 7.6% 4.5%
South America 1.4% 2.9% 3.3%
Europe (No Med) 9.8% 8.3% 11.1%
Mediterranean 12.6% 17.6% 19.9%
Asia 0.5% 1.2% 4.4%
Australasia 0.9% 2.2% 5.9%
Other markets 26.7% 23.0% 13.6%
Source: CLIA (2014).
Exploring the longer trends and the changes in shares that happened over the last decade, it is
evident that the Caribbean has lost ground as the Mediterranean was the success of the decade,
however in most recent times growth in the Mediterranean has slowed down as Asia and Australasia
are gaining interest. The Mediterranean has seen its share of the global deployment increasing from
12.6% in 2004 to 19.9% transforming it into the most dynamic cruise region of the world the last
decade. Europe beyond the Med has realised its share rising from 9.8% in 2004 to 11.1%. South
America is also among the regions that gained ground the last decade as 3.3% of global deployment
took place there in 2014 compared to just 1.4% in 2004. In North America, both Alaska and the
Caribbean have lowering shares. In the former case the share lowered to 4.5% from7.7% a decade ago.
The share of Caribbean stands at 37.3% of the global - compared to 40.4% a decade ago.
The most dynamic region of the recent years is Asia. The first half of the decade under
examination its share has grown from 0.5% to 1.2% in 2008. The deployment of cruise vessels in the
region has accelerated in a remarkable way over the last five years; in 2014 it grew by almost four
times compared to 2008. Even though this is still a tiny 4.4% of global deployment, the region
deserves further attention and is thus examined in forthcoming sections.

CRUISE SHIPPING AND URBAN DEVELOPMENT
A. Pallis — Discussion Paper 2015-14 — © OECD/ITF 2015 19
Deployed vessels are involved in different types of itineraries, so as to allow maximum capacity
utilisation in combination with the maximisation of earnings per passengers and lowering of expenses
(mostly via lower fuel consumption). The factors affecting the deployment patterns include the
geographical distribution of passenger source markets, the need to match brands and ships to source
market demographics; the seasonality of a region; the links with airlift, and landside transportation; the
opportunity to balance marquee destinations with lesser known gems, or that of developing new routes
and generating itineraries for new markets, the potential shore executions revenues comparing to on-
board spending; fuel sourcing, availability and cost consideration. All these are examined in parallel
with the time, speed and distance formula in order to decide where and how to deploy cruise ships.
One might identify three types of itineraries structured by cruise lines12
: (a) perennial, responding
to a region that is served throughout the year due to the resilient demand (with high/low periods) and
stable weather conditions; Caribbean end to a lesser extend the Mediterranean are such markets (b)
seasonal, to serve periodical market potential in periods with good weather conditions; with the Baltic,
Norway, Alaska and New England standing as typical examples and (c) repositioning, between
perennial or seasonal markets; a practice evident between the Caribbean and Mediterranean, and
Alaska and Hawaii, though following the globalisation of the market in recent times has expanded to
additional markets (i.e. Mediterranean and the Indian Ocean). New ships are deployed in more than
one region to incite additional demand by the new amenities they offer. The new Quantum class of
RCCL, among the advanced cruise ships, is splitting its deployment and respective sailings between
the Caribbean (late 2014), Mediterranean (early 2015), and Asia (mid 2015).
The typical number of itineraries is 4-7 days, though this is subject to regional variation. Looking
at the North American example, 41.8% of the cruises last 7 days, whereas 22% last 4 or 5 days, and
only 9.4% than 10 days or more; whereas Bahamas and Western Caribbean 3-5 days are dominant, in
South Pacific one might identify cruises lasting 14 days or more. According to CLIA data, the average
cruise length has increased from 6.4 days in the 1990s to 6.9 days in the 2000s and 7.2 in 201313
.
Modern deployment and existing demand translate into the deployment of 48.1 million bed days
in the Caribbean, 15 million in other North America regions, including Alaska, It also corresponds to
49.6 million bed days in Europe, of which 35.7 are offered in the Mediterranean Sea, and 13.9 million
in Northern Europe (Table 1.9). Europe has benefited from a172.5% growth over the last decade,
compared to 27.4% in North America. Yet, it is the comparatively recent rise of the other regions of
the world – with Asia being instrumental that has secured the most significant growth of all, almost
tripled within the period 1993-2013. In North America alone, the overall industry load factor stands at
over 90%, whereas the bed-days utilisation has increased from 80-85% in the 1990s to over 92% in the
most recent years.
CRUISE SHIPPING AND URBAN DEVELOPMENT
20 A. Pallis — Discussion Paper 2015-14 — © OECD/ITF 2015
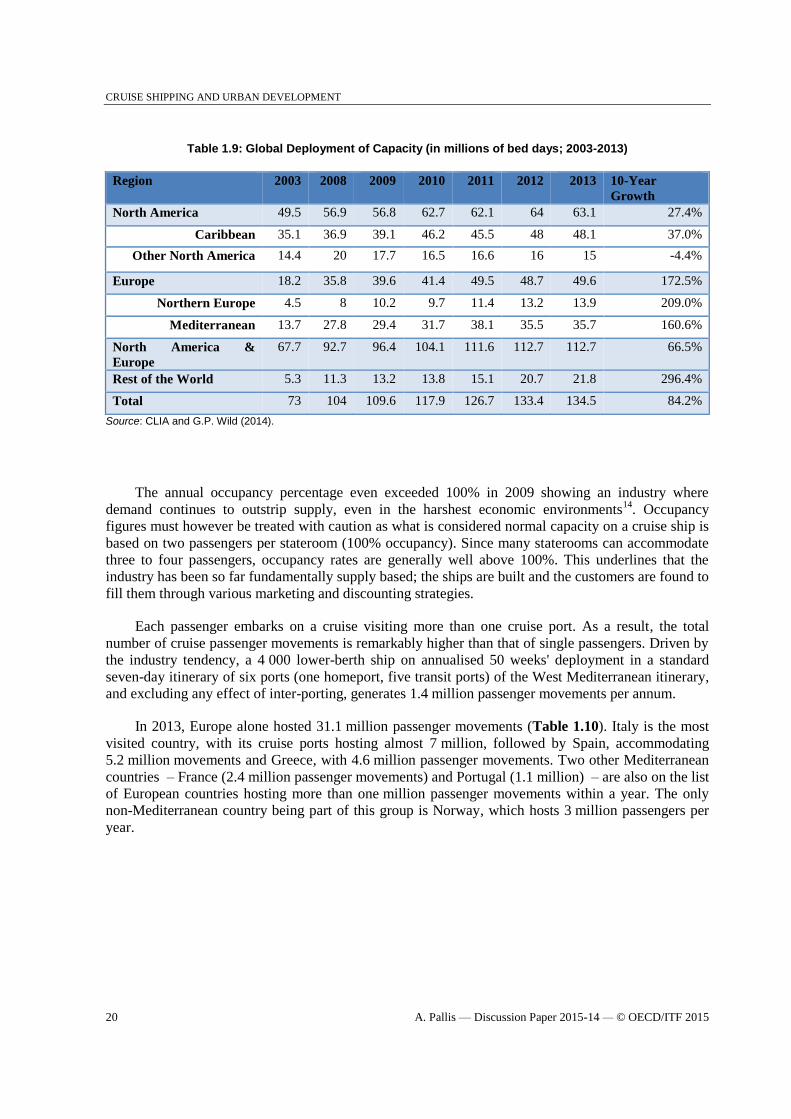
Table 1.9: Global Deployment of Capacity (in millions of bed days; 2003-2013)
Region 2003 2008 2009 2010 2011 2012 2013 10-Year
Growth
North America 49.5 56.9 56.8 62.7 62.1 64 63.1 27.4%
Caribbean 35.1 36.9 39.1 46.2 45.5 48 48.1 37.0%
Other North America 14.4 20 17.7 16.5 16.6 16 15 -4.4%
Europe 18.2 35.8 39.6 41.4 49.5 48.7 49.6 172.5%
Northern Europe 4.5 8 10.2 9.7 11.4 13.2 13.9 209.0%
Mediterranean 13.7 27.8 29.4 31.7 38.1 35.5 35.7 160.6%
North America &
Europe
67.7 92.7 96.4 104.1 111.6 112.7 112.7 66.5%
Rest of the World 5.3 11.3 13.2 13.8 15.1 20.7 21.8 296.4%
Total 73 104 109.6 117.9 126.7 133.4 134.5 84.2%
Source: CLIA and G.P. Wild (2014).
The annual occupancy percentage even exceeded 100% in 2009 showing an industry where
demand continues to outstrip supply, even in the harshest economic environments14
. Occupancy
figures must however be treated with caution as what is considered normal capacity on a cruise ship is
based on two passengers per stateroom (100% occupancy). Since many staterooms can accommodate
three to four passengers, occupancy rates are generally well above 100%. This underlines that the
industry has been so far fundamentally supply based; the ships are built and the customers are found to
fill them through various marketing and discounting strategies.
Each passenger embarks on a cruise visiting more than one cruise port. As a result, the total
number of cruise passenger movements is remarkably higher than that of single passengers. Driven by
the industry tendency, a 4 000 lower-berth ship on annualised 50 weeks' deployment in a standard
seven-day itinerary of six ports (one homeport, five transit ports) of the West Mediterranean itinerary,
and excluding any effect of inter-porting, generates 1.4 million passenger movements per annum.
In 2013, Europe alone hosted 31.1 million passenger movements (Table 1.10). Italy is the most
visited country, with its cruise ports hosting almost 7 million, followed by Spain, accommodating
5.2 million movements and Greece, with 4.6 million passenger movements. Two other Mediterranean
countries – France (2.4 million passenger movements) and Portugal (1.1 million) – are also on the list
of European countries hosting more than one million passenger movements within a year. The only
non-Mediterranean country being part of this group is Norway, which hosts 3 million passengers per
year.

CRUISE SHIPPING AND URBAN DEVELOPMENT
A. Pallis — Discussion Paper 2015-14 — © OECD/ITF 2015 21
Table 1.10: Cruise passenger movements in European countries 2010/2013
Rank Country Pax movements
(2010 ; in 000)
%
share
Pax movements
(2013;in 000)
%
share
Embarked
pax
(2013; in 000)
%
share
1 Italy 5 403 21.4% 6 970 22.4% 2 137 35.2%
2 Spain 4 911 19.5% 5 236 16.8% 1 298 21.4%
3 Greece 4 473 17.8% 4 601 14.8% 212 3.5%
4 Norway 1 793 7.1% 3 023 9.7% 40 0.7%
5 France 2 010 8.0% 2 410 7.7% 232 3.8%
6 Portugal 925 3.7% 1 138 3.6% 27 0.4%
7 UK 541 2.1% 866 2.8% 1 038 17.1%
8 Sweden 517 2.1% 529 1.7% 48 0.8%
9 Estonia 391 1.6% 509 1.6%
10 Denmark 529 2.1% 483 1.5% 224 3.7%
11 Benelux 193 0.8% 472 1.5% 96 1.6%
12 Finland 315 1.3% 429 1.4%
13 Malta 462 1.8% 378 1.2% 51 0.8%
14 Germany 210 0.8% 367 1.2% 565 9.3%
15 Gibraltar 319 1.3% 278 0.9%
16 Cyprus 271 1.1% 214 0.7% 50 0.8%
17 Ireland 177 0.7% 209 0.7%
18 Iceland 147 0.6% 204 0.7%
19 Poland 140 0.6% 95 0.3%
Other EU (+3) 161 0.8% 244 0.8% 34 0.6%
EU+3 23 888 91.9% 28 655 94.8% 6 052 99.7%
Other Europe 1 312 8.1% 2 530 5.2% 18 0.3%
Total 25 200 100.0% 31 185 6 070 100.0%
Note: Passengers make multiple port calls in single countries
Source: CLIA Europe (2014).
The Mediterranean and its adjoining seas have been a driving force for the growth of the industry
over the last two decades. In 2014, 47 different brands and 138 vessels with a capacity of 3.8 million
passengers operated in the region15
and according to MedCruise, the association representing cruise
ports in the Mediterranean and its adjoining seas, its 70 member ports alone hosted 25.8 million
passenger movements, with this standing at 80% of the region. These ports hosted over 25 million
each year of the 2010s when in the turn of the century they were hosting 8.6 million movements16
. The
growth of numbers is the outcome of the rising scale of cruise ships rather than other factors. The most
significant increase in the Mediterranean region took place without increasing at the same ratio. The
total cruise calls in 2000 were 10 146, they reached the record 15 451 in 2010, before declined to
13 716 in 2014.
In recent years growth has stagnated, with a deployment capacity decline took place in 2013 (7%)
and in 2014 (5%). This resulted from the fact that cruise lines put to the growth of the Asian market,
and due to regulatory changes that obliged cruise lines to limit the presence of the biggest vessels in
Venice – along with the comparatively slow growth of cruise activities around the globe the same
years.
Growing markets
CRUISE SHIPPING AND URBAN DEVELOPMENT
22 A. Pallis — Discussion Paper 2015-14 — © OECD/ITF 2015
Cruise lines restructure their deployment strategies, trying to better understand what fits best in
each case and which strategies respond to the global presence of cruising. Differences among markets
and regions exist, the most obvious being the variance of profitability. The emerging multi-region
industry development is directly linked with a changing geography. Whereas the Mediterranean has
experienced the major growth of all in the last decade, standing as the "star" region of the world, Asia
is increasingly appearing in the strategies of cruise lines, both as a deployment region and a source
market.
The Mediterranean Sea is today the second biggest cruising region, following Caribbean, with the
two regions combining 67% of the global capacity. Increased demand and effective work by regional
stakeholders (including ports, destinations and others) satisfactory served this growth. Yet given cruise
lines search for new dynamic markets further efforts are essential for this growth to sustain. On the
positive side, CLIA member cruise lines are scheduled to introduce 22 new cruise ships in the
Mediterranean Sea in 201517
, while concepts suitable for the European market (i.e. drive and cruise)
are applied. Being at the crossroads of three continents, the region offers a combination of numerous
destinations, richness in history, cultural diversity, while weather conditions allow for extended cruise
seasons. Given the levels of yields that the region has offered, the presence of several cruise ports that
offer operational alternatives, even when considering a single destination, the region is expected to
sustain as a major cruise regional market.
The most dynamic region of the recent years is one of the smallest ones. The Asian cruise market
has a tiny 4.4% of global deployment, but increasing capacity combined with the opening of sales
offices by many cruise lines in China, Hong Kong, Korea, Singapore, and Taiwan has quickly made
the Asian region rank fourth in passenger capacity deployment, tied with Australasia. Forecasts
suggest that the number of Asian passengers could grow from 1.3 million in 2012 to almost
four million in 2020 (Table 1.11). The growth is mostly based on the number of Chinese cruise
passengers, which from 2012 to 2014 jumped by 79% to 697 000, making it nearly as big as all other
Asian markets combined (701 000)18
.
China appears to be a market of great strategic importance for the global cruise industry. Several
brands aiming to advance it to the second largest cruise market in the world by 2017. RCCL has
already operated a 4 180-guest, Quantum-class vessel and will deploy a second new one in 2016,
aiming to introduce a cruise culture of bigger vessels and longer stays. Carnival deploys (either on
four-month or year-round deployment) four ships in Shanghai in 2015, increasing its cruise capacity in
China by 140% from 2013. Since mid-2000s, several major cruise companies have opened offices in
the region, irrespective of whether they operate in the region or not (MSC), in order to promote the
concept of cruising, market their product in a potential source market, and not lest prepare the ground
for future deployment in China and Asia.

CRUISE SHIPPING AND URBAN DEVELOPMENT
A. Pallis — Discussion Paper 2015-14 — © OECD/ITF 2015 23
Table 1.11: Asia cruise traffic projections to 2020 (passengers, in .000)
Source
market
Passengers
2012
Passengers
2020
Var 2020/2012
(estimate)
China 472 1 617 242.6%
Japan 217 766 253.0%
Malaysia 144 288 100.0%
India 133 242 82.0%
Singapore 91 181 98.9%
South
Korea
73 219 200.0%
Indonesia 59 238 303.4%
Hong Kong 53 124 134.0%
Taiwan 47 163 246.8%
Other 52 102 96.2%
Asia (all) 1 341 3 940 193.8% Source: Chart Management (2014).
In a nutshell, a total of 2.17 million passengers capacity will be available in 2015, as the capacity
of cruises offered the Asian market itself increased by 18.3% within two years. Itinerary planners for
global voyages are expected to double their ship capacity covering Asia as part of itineraries. Today,
26 cruise brands are already active in Asia. CLIA data19
suggest that a total of 52 ships will be
deployed in Asian waters in 2015, with nine of them being year-round in Asia. This will result a total
of 1 065 separate cruises offered through 2015, with 981 being Asia-Asia Cruises (compared to 802 in
2013), and the rest 84 (comparing to 59 in 2013) being voyages that pass through Asia (World, “Circle
Pacific” and repositioning itineraries). Operating days in Asian market will also continue to increase,
the 4 307 days of 2013 are expected to reach 5 824 in 2015, a remarkable 35.2% increase within just
two years. These vessels are mostly operating in East Asia (2,934 days) and South East Asia (2 529),
with the share of South Asia being comparatively small (361 days).
The type of vessels deployed, and the length of cruises offered hint the peculiarities of the Asian
cruise market. Large and mega ships offering cruises in Asia are still few (two mega and nine large in
2015). Seasonally operated mid (22) and small (14) size ships are most common. Short cruises
dominate, as 43% of the offered cruises last 2-3 days and 37% more last 4-6 days. The peculiarities
result by the geographical features and the cultural differences of this market comparing to the ones
that cruise developed in recent times. First, the very short, or short, distances between calling ports and
destinations that are available in the Caribbean, the Mediterranean, and the rest of the European
market are not present. To combine destinations of interest, or broader geographical parts distances are
longer and a full day, or more, at the sea might be an essential itinerary feature. In addition shorter
vacations are most common, as people have limited vacation entitlements. Thus, people need to
familiarise with both the idea of cruising, the idea of vacation trips lasting longer, and the cruising in
other regions – 91% of Asian passengers cruise within Asia with the remaining 9% flew to cruise
destinations outside the region, primarily in Europe, followed by Alaska and Caribbean
Nonetheless, given the size of the population, and the potential numbers of passengers that small
numbers of penetration would result in, Asia in general and China in particular have been the centre of
the attention of cruise lines who are banking on a potential million passengers market. They do so
cruising with local characteristics, such as local cuisines, language services, and high-end shopping. It
is also targeted by other stakeholders, including destinations and cruise ports in other regions of the
world (i.e. ports in the Mediterranean and its adjoining seas) which have embarked on campaigns to
generate interest of Asian for cruising in the respective regions).

CRUISE SHIPPING AND URBAN DEVELOPMENT
24 A. Pallis — Discussion Paper 2015-14 — © OECD/ITF 2015
Cuba stands as the unpredictable variable, as it is a potentially growing market to change the
structures of cruising in the Caribbean. Cuba and the changing landscape insofar the regulations
concerning the US trade embargo might also act as game changers. Cruise lines follow with interest as
the rich in history and culture Cuba is of significance from a passenger-interest perspective. Cruise
lines are already exploring possible itinerary options for variety of different ports in Cuba in order to
add several destinations for cruises of various lengths that begin and end in Florida or at one of many
island nations near Cuba. That development though is conditioned by the political developments, but
also by the fact that many ports require infrastructural changes.
1.4 Cruise Fleet: Renewal and Economies of scale
The growth of the industry is extensively based on cruise lines investing in modern and bigger
vessels. The continuous change that is taking place is detailed in Table 1.12, 108 vessels were ordered
in the 1990s, 127 more in the 21st century. Following the delivery of new builds over the last fifteen
years the average age of the global cruise fleet stands today at 19 years, with the stable number of the
global cruise fleet at a number just shy of 300, confirm the extensive renewal of the product that cruise
is offering to present and potential passengers. Nonetheless, it is also evident that the pace slowed
down in the first half of the 2010s, as orders and deliveries stand at lower levels compared with
previous periods of similar time-span.
Table 1.12: Cruise ship orders and deliveries (1990-2014)
Time period No. of ships ordered No. of ships delivered
1990-1994 35 47
1995-1999 73 47
2000-2004 38 72
2005-2009 62 44
2010-2014 38 34
1990-2014 246 244
Source: Barry Rogliano Sales (BRS).
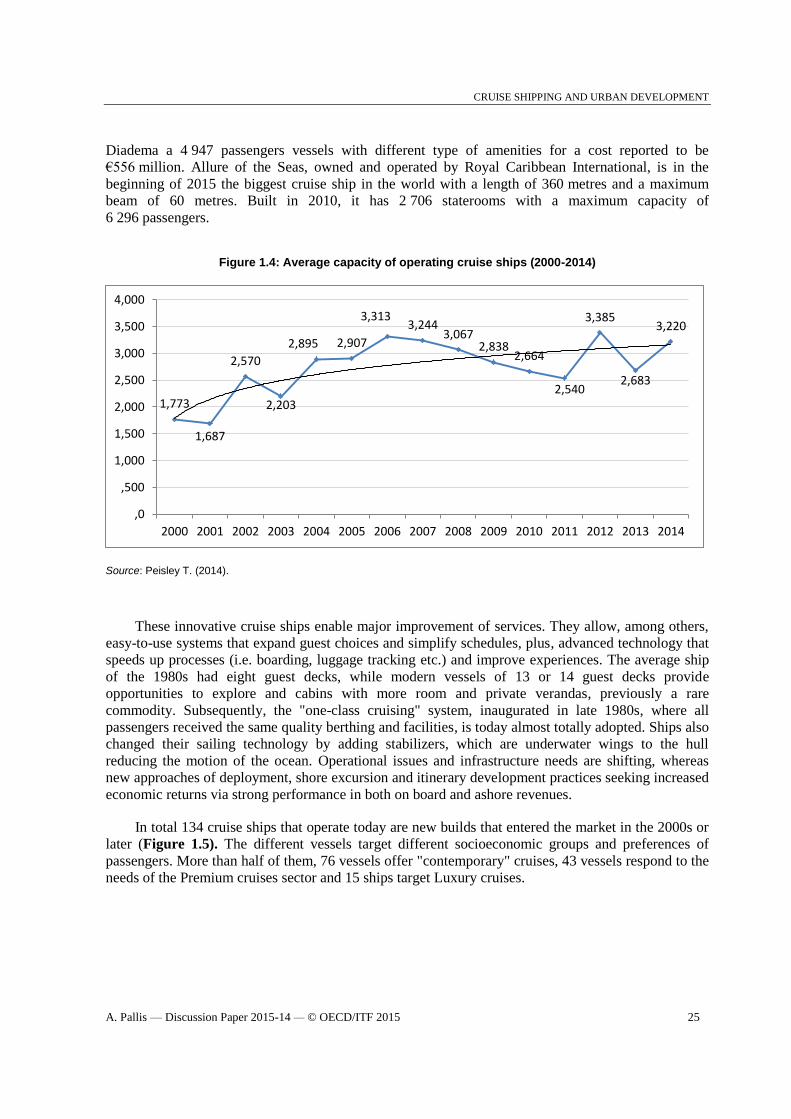
The average dimension of a current cruise ship is 200 metres long, 26 meters beam, and a
passenger capacity of 3 220 passengers (Figure 1.4); though standard deviation is big and such
measurements need to be treated with caution. These fleet specifications have no relation with the
picture observed a decade earlier. In the early 2000s large cruisers with a transport capacity in excess
of 2000 passengers were few and cruisers with a specification approximating 3 000 passengers were
thought to be "gigantic". The average capacity of cruise fleets exceeds 2 000 passengers for the first
time in 2002, and 3 000 passengers in 2006. Calculations of current orders to be delivered over the
coming two years suggest a clear trend of stabilization at an average capacity that is bigger than 2 700
passengers, though this does not include potential withdraws from the market.
Carnival, the world’s largest cruise company has already announced a fleet capacity increase by
nearly 10% from 2014 through 2016, while it had renewed the largest fleet in the world with more
than 30 new ship additions since 2007. RCCL, the second biggest cruise corporation, has led the race
towards bigger cruise ships with the Oasis class vessels accommodating more than 6 000 passengers
and a crew of 2 000. In late 2014, Royal Caribbean introduced the Quantum ship class, underlining the
preference in extending amenities over accommodating additional passengers, since the new class
built at a cost of USD 1.1 million, carries about 4 200 passengers. The same year Costa received Costa
CRUISE SHIPPING AND URBAN DEVELOPMENT
A. Pallis — Discussion Paper 2015-14 — © OECD/ITF 2015 25
Diadema a 4 947 passengers vessels with different type of amenities for a cost reported to be
€556 million. Allure of the Seas, owned and operated by Royal Caribbean International, is in the
beginning of 2015 the biggest cruise ship in the world with a length of 360 metres and a maximum
beam of 60 metres. Built in 2010, it has 2 706 staterooms with a maximum capacity of
6 296 passengers.
Figure 1.4: Average capacity of operating cruise ships (2000-2014)
Source: Peisley T. (2014).
These innovative cruise ships enable major improvement of services. They allow, among others,
easy-to-use systems that expand guest choices and simplify schedules, plus, advanced technology that
speeds up processes (i.e. boarding, luggage tracking etc.) and improve experiences. The average ship
of the 1980s had eight guest decks, while modern vessels of 13 or 14 guest decks provide
opportunities to explore and cabins with more room and private verandas, previously a rare
commodity. Subsequently, the "one-class cruising" system, inaugurated in late 1980s, where all
passengers received the same quality berthing and facilities, is today almost totally adopted. Ships also
changed their sailing technology by adding stabilizers, which are underwater wings to the hull
reducing the motion of the ocean. Operational issues and infrastructure needs are shifting, whereas
new approaches of deployment, shore excursion and itinerary development practices seeking increased
economic returns via strong performance in both on board and ashore revenues.
In total 134 cruise ships that operate today are new builds that entered the market in the 2000s or
later (Figure 1.5). The different vessels target different socioeconomic groups and preferences of
passengers. More than half of them, 76 vessels offer "contemporary" cruises, 43 vessels respond to the
needs of the Premium cruises sector and 15 ships target Luxury cruises.
1,773
1,687
2,570
2,203
2,895 2,907
3,313 3,244
3,067 2,838
2,664
2,540
3,385
2,683
3,220
,0
,500
1,000
1,500
2,000
2,500
3,000
3,500
4,000
2000 2001 2002 2003 2004 2005 2006 2007 2008 2009 2010 2011 2012 2013 2014

CRUISE SHIPPING AND URBAN DEVELOPMENT
26 A. Pallis — Discussion Paper 2015-14 — © OECD/ITF 2015
Figure 1.5: New Ships by product sector (2001-2015)
Source: Peisley, T. (2014).
The picture will further change by 2020 as 37 more ships will reach the market (Table 1.13).
While for most of these vessels the region to be deployed will be decided at a later stage, in the case of
the 17 for which a decision has already been made the vast majority (13) will be deployed in Europe.
The aim to achieve economics scale, which in the cruise industry is combined with economies of
scope, is supported by the know-how of shipbuilding, will be served by the fact that 14 of the ordered
vessels are bigger than 4 000 capacity, whereas the capacity of 15 more of them will be able to host
more than 2 000 passengers. The details also suggest an average increase of beam by 35% to 270
meters, and an increase of length by 35%, or 70 meters, to 270 metres. Beyond additional amenities
and product variation on-board, llarger cruise ships tend to have lower average labor costs than smaller
ships - for example, a 5 000 plus-cruise vessel has one crew member for every 2.6 passengers, while a
2 000 passenger one has one crew member for every 2.1 passengers – leading to the continuous
increase of cruise fleet.
Table 1.13: Ocean cruise ships on order to 2020
Region to be deployed
Shipbuilding company
Capacity
(passengers)
Number
of Ships
Ca
rib
bea
n
Eu
rop
e
Eu
rop
e/
Ca
rib
bea
n
Asi
a
Wo
rld
TB
A
Fin
can
teri
Mey
er
Wer
ft
Mey
er
Tu
rku
Mit
sub
ish
i
ST
X
Fra
nce
6 000-6,400
5 000-5,999 2 2 2
4 000-4,999 12 1 1 1 9 3 6 3
3 000-3,999 7 2 2 3 3 2 2
2 000-2,999 8 6 2 1 5 2
1 000-1999
500-999 7 4 2 1 7
100-499 1 1 1
Total 37 1 13 1 2 3 17 15 8 5 2 7 Source: Peisley, T. (2014).
6 7 7 7
3 5 6 5 6 6
4 5 3 3 3
5 3 3 5
1
2 2 5 2
4
2 2
1 3 3
3
1 2
2
2
2
2
1
-1
1
3
5
7
9
11
13
15
2001 2002 2003 2004 2005 2006 2007 2008 2009 2010 2011 2012 2013 2014 2015
Contemporary Premium Luxury

CRUISE SHIPPING AND URBAN DEVELOPMENT
A. Pallis — Discussion Paper 2015-14 — © OECD/ITF 2015 27
Shipbuilding is taking place mostly in Europe, providing considerable input to the local
economies, a picture contrasting the cargo vessels shipbuilding that is increasingly taking place in Far
East Asian countries. The number of shipyards is limited, owned by five companies, with further
consolidation of the latter being on the table. Fincantieri, Italy (13 vessels, 1.21 grt) and Meyer Werft,
Germany (nine vessels, 1.47 million grt), were the shipyards dominating the market shares in 2014 in
terms of vessels and of gross tons respectively, These are the two ones that have the biggest order
group in early 2015, and are expected to strengthen further this share. Meyer Werft already owns 70%
stake in Meyer Turku and is in the process of completing within 2015 the buying the Finnish
Government's 30% stake in the shipyard that has currently orders for five vessels. STX France, a
Korean owned shipyard is the fourth shipbuilding company involved in the construction of cruise
vessels, currently having seven orders. The only non-European company is the Japanese Mitsubishi
with current orders standing at 2 vessels. Even though the strategy of cruise lines to enter the China
market has been reported to be accompanied by a search for suitable Chinese dry-dock and shipyard
facilities, this is not expected to be a game changer for the next decade.
Latest developments (April – May 2015) suggest that the above is a picture that will continue
further. Carnival Corp. announced plans to order nine new ships for delivery between 2019 and 2022.
Other details were absent though, i.e. which of its nine brands would use the vessels including the cost
of the ships, their size, the number of passengers they would hold, the features they would include or
the timeline for their delivery. Carnival said it had signed a strategic memorandum of agreement with
both Fincantieri and Meyer Werft for vessels based on next-generation ship designs. Fincantieri will
build five of the ships, while Meyer Werft will handle four. The agreements include options for more
vessels in the future and are subject to conditions including financing. In May 2015, RCCL announced
that it has entered into an agreement with Meyer Werft in Germany to order a fourth Quantum-class
ship for delivery in 2019.
Implications for shore side activities
A key implication of the scale of economies of scale is the increasing number of passenger
movements per call. The example of the Mediterranean is illustrative. Within the last five years, the
average number of passengers per cruise call increased by 13.3%, from 1,657 to 1,878 passengers per
call (Figure 1.6). A decade before, a cruise port and thus a destination would host 734 less cruisers.
Five ports in the Mediterranean host each year more than 3 000 passengers per call, whereas nine more
ports host more than 2 000 passengers per call. The trends observed in the new buildings will sustain
the overall trend of growing numbers of cruise passengers per visit. This increase demands that for a
destination to sustain the presence of the cruise activity suitable port infrastructure that enables calls of
bigger vessels needs to go hand-in-hand with sufficient levels of increased level of coordination
between involved stakeholders, in order to ensure satisfactory operations without bottlenecks at times
of arrivals and departures.

CRUISE SHIPPING AND URBAN DEVELOPMENT
28 A. Pallis — Discussion Paper 2015-14 — © OECD/ITF 2015
Figure 1.6: Average Passengers/Call in Mediterranean cruise ports (2000-2014)
Note: Data from 70 ports, representing approximately 80% of the market.
Source: MedCruise (2015).
The cruise ship supply is another important element of the economic footprint from cruise
tourism. This relates to both the direct supply of goods and services through local companies and the
infrastructure required to support the logistics of "non-local" supply, usually by container. The past
decade has seen dramatic change in the nature of the on board cruise product and also in the size and
design of the tonnage. There has also been a change in the nature of the logistics and supply chain, for
reasons including technological advancements, and the re-engineering of the procurement processes
within the major cruise lines. A decade ago, for instance, the supply chain requirements for most
US-based cruise lines were centred around Miami and the Caribbean. Today, however, those same
ships, as well as bigger newer ships operate in several regions of the world. This, together with the
development of logistics and supporting IT management systems, has changed the face of cruise line
supply. As a result, in several (major) ports and destinations there has been a large increase in traffic
not only in terms of tourism/passengers and related goods but also, as a result of this, in logistics
volume in general.
This change created many opportunities for the consolidation and globalisation of supplies. It has
also an impact on the local and regional supply bases as improvements in the speed and smoothness of
logistics operations requires several companies, both public and private, to coordinate. At the same
time the major cruise lines have also developed their supply chain infrastructure and support so that
they now have strategic control points within the major cruise destination hubs (i.e. Venice and
Barcelona are two such hubs in the Mediterranean. However, there is an ever-increasing requirement
by the cruise lines to offer more local, regional and specialised products as part of the on-board guest
experience and, therefore, there is something of a reversal to the overall trend with increased local
purchasing taking place. There is also an increased focus on the "real" cost of supplying goods to the
ship - rather than simply the commodity cost itself. Increasingly, there is also focus on the
environmental cost related to ship supply - and this is becoming much more prominent.
,848 ,872 ,900 1,017 1,058
1,144 1,271
1,366 1,409
1,572 1,657
1,787 1,828 1,855 1,878
,500
1,000
1,500
2,000
2000 2001 2002 2003 2004 2005 2006 2007 2008 2009 2010 2011 2012 2013 2014
Pas
sen
gers
pe
r C
all
Evolution 1-year : +1.26% 5-year: +13.34%
10-year: +64.16%
CRUISE SHIPPING AND URBAN DEVELOPMENT
A. Pallis — Discussion Paper 2015-14 — © OECD/ITF 2015 29
2. Cruise Ports: Characteristics, Performance and Competition
2.1 Cruise ports: Characteristics and Categorisation
With the growth in cruise business, cruise ports are gaining in importance. Selection of
destinations is to some extent conditioned by the state of the cruise port to visit. The port is vital for
assuring schedule reliability and for allowing a continuous passenger (dis)embarkation and transfer to
onward journeys and/or day excursions. Once market characteristics result in cruise lines expressing
an interest in established or potential destinations, and economic and geopolitical conditions permit,
the competency of a destination relies on port and shore characteristics. The presence of sufficient port
specific and port related infrastructures, the absence of intense use that might lead to congestion and
process disruption, and the modernisation of infrastructures and processes so as to provide efficient
and effective port services, are key to allowing the usage of a port as part of an itinerary.
Ports also realise the opportunity to provide services to an industry with wider local economic
impacts. With the direct and indirect impact, including passengers and crew spending that can be
diffused to the port cities or nearby touristic destinations, the ports interest to increase the cruise
passenger movements has been supported, in general, by broader communities and decision makers.
The rising importance of societal integration of ports with the associated port-cities20
coincides with
the growth of cruise shipping. Cruise activities turn to part of the agendas of port authorities and other
port-managing organisations within an effort to link the port with visible benefits for the local
economies.
While principal cruise ports serve derived demand, their own competitiveness stands to a certain
degree as a cause for attracting cruise calls. Seeking to develop a new product, cruise lines have added,
and continue to search, new cruise ports to add to itineraries and attract land based holidaymakers or
cruises that would like to return. This search is associated with the features of destination, i.e. tourist
attractions, shore excursions potential, geopolitical tensions. However, the state of ports and their
infrastructure complexities, i.e. berth access, land infrastructure and logistics, maritime services such
as pilot tugs, and landside operation such as security, procedures and luggage handling, affect the
growth of cruising in a given port. Besides, the geographical monopoly does not exist in all cases, as
many ports share proximity to tourist attractions with others.
A cruise port success relies on five different factors in order to succeed in becoming a chosen
destination attracting calls and hosting cruise passenger movements. First, the extent to which the port
is well positioned for integration in popular itineraries, in other words the location of the port. While
cruise lines are interested in offering certain destinations, inclusion of ports in itineraries is also
determined by the attractiveness of a port. A second factor is the tourist attractiveness of the
destination/region. This is primarily determined by characteristics of the area (climate, social/cultural
and/or natural factors, or proximity to touristic attractions), with the port industry and stakeholders
having only a secondary influence, i.e. upgrading "tourist friendliness" via information and
multilingualism availability. The third factor is the accessibility of the destination/region. Port
proximity to airport that has airlifts to source markets, train station with good connections, and
highways to serve the increasingly popular drive and cruise concept, might determine the potential of

CRUISE SHIPPING AND URBAN DEVELOPMENT
30 A. Pallis — Discussion Paper 2015-14 — © OECD/ITF 2015
the port to host turnaround or just transit traffic. The fourth factor is the port facilities and services on
offer, with different types of facilities expected from transit and turnaround ports (Table 2.1). Port
fees stand as the fifth success factor. The latter two factors are generally the most easily adaptable
compared to the other success factors, yet a port that performs more weakly on location, tourist
attractiveness and accessibility than another port is not likely to match the performance by making
changes in facilities/services or fees.
To all these, one needs to consider the geographical proximity to other cruise ports. The
conformity of its geographical location with the time and speed preferences of cruise lines, particularly
the possibility to be included in itineraries involving several ports is a vital parameter, particularly for
the development of a non-marquee cruise port. Today this formula results by the fact that ships ideally
travel at 18 knots for 14 hours. This means that the maximum overnight distance is 252 nautical miles,
whereas with the high speed of 20 knots the maximum overnight increases 280 nautical miles.
20 Table 2.1: Expected cruise port facilities and services
Entrance & berth
facilities
Cruise ship & services Passenger services
Gen
eric
Fa
cili
ties
Manoeuvrability Dedicated cruise ship piers Separation of pier uses in port
Draught Berth reservation process Pedestrian paths
Berth dimensions Tug boats Tourist information
Anchorages Pilotage Cleanliness
Bollards Fuel services Immigration quickness
Fenders Fresh water services Port aesthetics
Food and drink/ beverages Ship to coach quickness
Waste reception facilities Sufficient availability of coaches/
taxis
Quality of shipping agents
Speed of ship clearance
Stakeholders cooperation (port and other
local stakeholders)
Ho
me-
po
rt o
nly
Presence of passenger terminal
Parking facilities (short & long term)
Shops
Passenger throughput range
Security procedures
Availability of baggage storage Sources: Vaggelas & Pallis (2010); Policy Research Corporation (2013).
Cruise Ports Categories
Ports offering services to cruise lines vary in many respects (Table 2.2). The first group of the
criteria for constructing a typology are similar to the ones observed in any port market. Τhe second
group reflects the peculiarities of the cruise market, including the catalytic influence of the "tourism"
element of cruise shipping.
The nature of the facility – i.e. the presence of a dedicated terminal, or pier, or the usage of a
facility used for more purposes than cruising – is among the first group of criteria. A second criterion
relates to the ownership of the infrastructure and the operation of the terminal or facility. A growing
interest by third parties, including cruise lines and specialised cruise terminal operators, to invest in
port facilities, either via concessions or via greenfield projects, has been generated by the growth of

CRUISE SHIPPING AND URBAN DEVELOPMENT
A. Pallis — Discussion Paper 2015-14 — © OECD/ITF 2015 31
cruising. The size of the passenger movements hosted per year forms a third distinctive criterion,
given that it corresponds to the serving of different cruise vessels and segments. The latter is also true
as regards the fourth criterion, which is the function of the port in the cruise itinerary as a home-port
from which a cruise departs and/or ends, or as a port of call visited by a cruise ship during the cruise
itineraries. Home-porting also affects the numerical size as it secures double movement of a unique
passenger at the same port. A fifth criterion for classifying cruise ports is the seasonality of the calls,
which combines the transportation and the tourism elements of cruising.
The tourism element defines the type of attractiveness that a port generates21
. Marquee ports are
world-famous ones, absolutely necessary for every itinerary, as they attract passengers and form the
most selling feature of the cruise itinerary. A discovery port is one that is not world-famous, but
provides the sense of discovering an unknown treasure. Some home-ports are also marquee
destinations, i.e. the three major home-ports in the Mediterranean Sea, namely Barcelona;
Civitavecchia (Rome), and Venice. These are tourism hubs that have well-developed tourism
infrastructure and an airport with direct international flights. Other ports-of-call are linked with
marquee destinations (i.e. Naples (Pompeii) and Livorno (Florence, Pisa).
Table 2.2: Cruise Ports: A typology
Adapted from: Pallis and Rodrigue (2013); Rodrigue (2015).
The presence of different tourism attractions at a proximate or distant location results in a
different classification of cruise ports. Destination cruise ports are the sole destination of a cruise
visiting them. Beyond security and safety issues, they need to develop high-quality cultural or physical
amenities, as neither excursions outside the port area nor significant amenities in proximity are
important [examples: Labadee (Haiti), Cococay (Bahamas), Venice, Barcelona]. Gateway cruise ports
act as the point serving major touristic destination, with shore excursions outside the port area are
important (Civitavecchia, Livorno). A cruise port might be both a destination and a gateway port
offering various balances between the amenities offered at the port and in the region (Miami,
San Juan, Nassau, Piraeus, Lisbon).
Finally, ports might serve different cruise segments based on their accessibility i.e. whether they
are closely linked with airport and dense flight network, or they provide an efficient train or highway
Criteria Elements
1. Cruise Terminal 1. Dedicated terminal | 2. Dedicated pier | 3. Multi-purpose facility
2. Ownership & operations 1. Public | 2. Private | 3. Concession
3. Size Major (>1 million passenger movements)
Very Large (500 000 to 1 million passenger movements)
Large (250 000 to 500 000 passenger movements)
Medium (100 000 to 200 000 passenger movements);
2. Small (Less than 100 000 passenger movements)
4. Function in itinerary 1. Home-port | 2. Port of Call | 3. Both turnaround & port-of-call
5. Seasonality 2. Low (perennial port; 4 peak months less than 40% of visits);
3. Average (4 peak months 40 to 60% of visits);
4. High (4 peak months 60 to 80% of visits);
5. Very high (4 peak months more than 80% of visits)
6. Attractiveness 1. Marquee (“must see”) port | 2. Discovery port
7. Local and regional integration 1. Destination port | 2. Gateway port | 3. Balanced port
8. Accessibility 1. Air hub port | 2. Drive / 3. Train to port
CRUISE SHIPPING AND URBAN DEVELOPMENT
32 A. Pallis — Discussion Paper 2015-14 — © OECD/ITF 2015
network to reach the port. Each group is associated with different concepts of cruising, whereas in
some cases, especially island destinations, the quality of the airport facilities, the diversity and the
density of the links are important.
2.2 Major cruise ports
Of the 12 major cruise ports, i.e. ports that hosted more than one million passenger movements in
2005, 11 ports were located in the Caribbean. The four major ones, all located in North America
(Miami, Everglades, Canaveral in the USA and Cozumel in Mexico) hosted more than two million
passenger movements. Six more Caribbean cruise ports (Nassau, Georgetown, St Thomas, San Juan,
St Maarten), one port in the Pacific coast (Los Angeles) and one in Europe (Barcelona), were
concluding the list of major cruise ports in the globe. The three big ones (Miami, Everglades,
Canaveral) and Los Angeles were the ports of the world hosting more than one million home-porting
passenger movements22
. The picture of today is remarkably different. All port size groups referring to
the hosting of passenger movements are far more populated, as the number of the ports hosting any
cruise activities has increased and the size of cruise ports in terms of traffic accommodated per year is
much bigger (Table 2.3). 20 major ports and 34 very large ones exist in Caribbean, Mediterranean and
North America alone.
In North America there are today 7 major cruise ports. Neither the ranking order of the top four
ports nor their classification as the biggest cruise ports of the world has changed during the last
decade. What has changed though is the scale of the passenger movements they host. In 2014 Miami
reached 4.47 million passengers, whereas the three others, namely Everglades (3.93) and Canaveral
(3.87) in Florida, and Cozumel (3.4) in Mexico, hosted more than three million passengers. In total,
the list of the USA port system includes 7 major, 8 very large, 8 large, and 9 medium-size cruise ports
of recorded any cruise traffic in 2014, out of accommodating more than 200 000 passenger
movements. The list of the 14 Canadian and 22 Mexican cruise ports includes two other very large
cruise ports and six large ones.
Since 2005 three more ports have joined Nassau, Bahamas in the list of major ports. While
Nassau is the biggest cruise port of the world hosting 3.57 million passenger movements, the Out
Islands in Bahamas have almost reached a three million passenger traffic (2.95). Point Blanche
exceeded two million passengers in 2014, and Georgetown in the Cayman Islands reached
1.61 million passenger movements. The Caribbean cruise port system also includes nine very large
ports and five large ports. In addition to these, a substantial part of the traffic is accommodated in
private islands or private facilities developed by cruise lines.
The total of major ports in the Mediterranean Sea stands at eight. The growth of the
Mediterranean has been associated with the effective capacity of several ports to develop their
activities and operations to serve the rapidly increasing number of vessels deployed and volumes of
passengers wishing to cruise. Civitavecchia (2.14), a port constructed to serve Rome in the suburbs of
the city, is the second port after Barcelona (2.36) hosting more than two million passengers per year.
There are also 15 very large and 14 large ports and more than 100 other ports accommodating cruise
passenger traffic. North Europe has also seen the development of a major port, Southampton, that in
2013 hosted 1.48 million passenger movements or the annual traffic of the UK, two very large ports,
Hamburg and Copenhagen, and several more of smaller scale.
With recent strong growth in the region, ports in Asia have responded by undertaking a number
of significant expansion projects. Singapore and Hong Kong remain the region’s main cruise centres.
Both of them have developed new state of the art terminals over the last years in a move to sustain
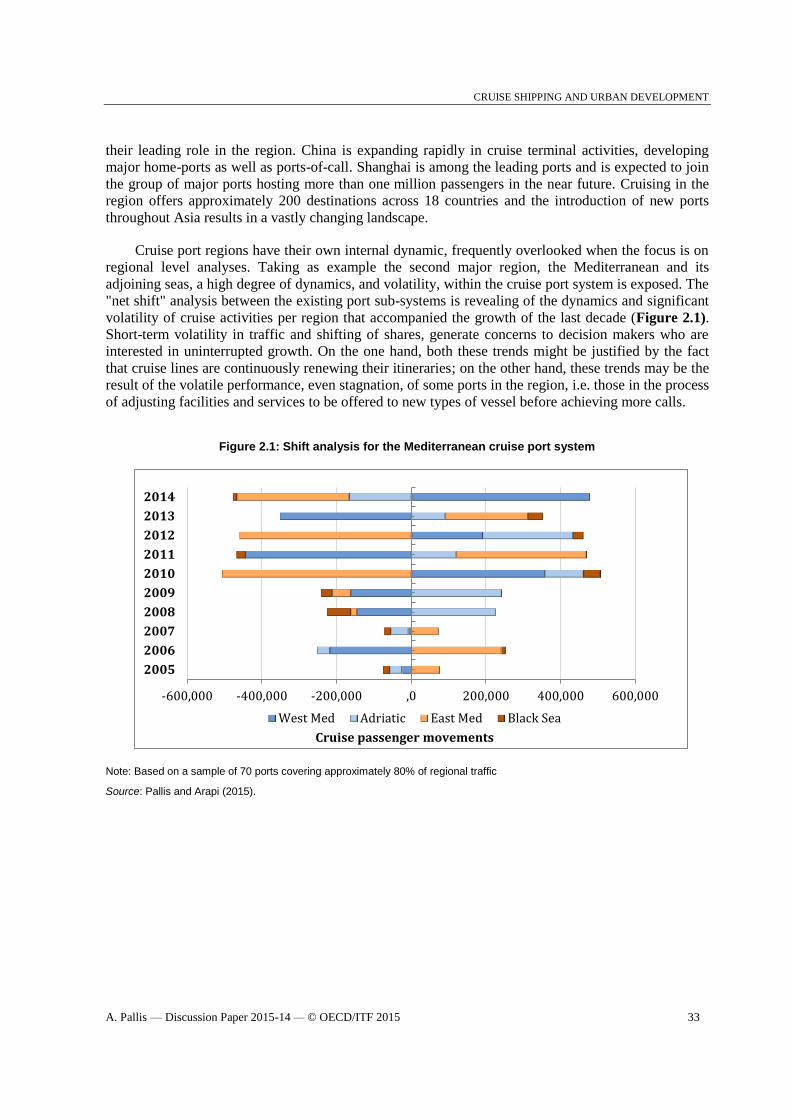
CRUISE SHIPPING AND URBAN DEVELOPMENT
A. Pallis — Discussion Paper 2015-14 — © OECD/ITF 2015 33
their leading role in the region. China is expanding rapidly in cruise terminal activities, developing
major home-ports as well as ports-of-call. Shanghai is among the leading ports and is expected to join
the group of major ports hosting more than one million passengers in the near future. Cruising in the
region offers approximately 200 destinations across 18 countries and the introduction of new ports
throughout Asia results in a vastly changing landscape.
Cruise port regions have their own internal dynamic, frequently overlooked when the focus is on
regional level analyses. Taking as example the second major region, the Mediterranean and its
adjoining seas, a high degree of dynamics, and volatility, within the cruise port system is exposed. The
"net shift" analysis between the existing port sub-systems is revealing of the dynamics and significant
volatility of cruise activities per region that accompanied the growth of the last decade (Figure 2.1).
Short-term volatility in traffic and shifting of shares, generate concerns to decision makers who are
interested in uninterrupted growth. On the one hand, both these trends might be justified by the fact
that cruise lines are continuously renewing their itineraries; on the other hand, these trends may be the
result of the volatile performance, even stagnation, of some ports in the region, i.e. those in the process
of adjusting facilities and services to be offered to new types of vessel before achieving more calls.
Figure 2.1: Shift analysis for the Mediterranean cruise port system
Note: Based on a sample of 70 ports covering approximately 80% of regional traffic
Source: Pallis and Arapi (2015).
-600,000 -400,000 -200,000 ,0 200,000 400,000 600,000
2005
2006
2007
2008
2009
2010
2011
2012
2013
2014
Cruise passenger movements
West Med Adriatic East Med Black Sea

CRUISE SHIPPING AND URBAN DEVELOPMENT
34 A. Pallis — Discussion Paper 2015-14 — © OECD/ITF 2015
Table 2.3: Cruise Ports by Size in Major Cruise Markets (2014)
SIZE USA MEXICO /CANADA CARIBBEAN MEDITTERANEAN SEA NORTHERN
EUROPE
Major Cruise ports
(7)
Miami (4.47)
Port Everglades (3.94)
Port Canaveral (3.86)
-------
St. Thomas/St. John (1.98)
New York/New Jersey (1.63)
Galveston (1.29)
San Juan (1.16)
(Mexico: 1)
Cozumel (3.40)
-------
(4)
Nassau/Paradise Island,
Bahamas (3.57)
The Out Island, Bahamas (2.95).
Pointe Blanche, St Martin (2.00)
-------
Georgetown, Cayman Islands
(1.61)
(8)
Barcelona (2.36).
Civitavecchia (2.14)
---
Venice (1.73)
Balearic Islands (1.58)
Marseille (1.31)
Naples (1.11)
Piraeus (1.05)
Savona (1.01)
(1)
Southampton (1.50)
Very Large Cruise
ports
(8)
New Orleans;
Juneau; Tampa; Ketchikan;
Seattle; Skagway; Key West;
Los Angeles
(Mexico: 1 / Canada: 1)
Ensenada; Metro
Vancouver
(9)
Grand Turk Cruise Center;
Grand Bahama, Falmouth; Port
Zante, Bridgetown Oranjestad,
Castries; Willemstad, St. John’s.
(15)
Dubrovnik; Tenerife Ports; Genoa;
Kusadasi; Santorini,; Corfu, GR;
Livorno; Mykonos; French Riviera
Ports; Istanbul; Katakolo, Bari,
Palermo; Valletta; Lisbon
(2)
Kopenhagen; Hamburg
Large Cruise Ports
(8)
Honolulu; Baltimore,; Palm
Beach; Jacksonville; Boston;
Hilo; San Francisco;
Nawiliwili
(Mexico: 4 / Canada: 2)
Majahual; Progreso; Cabo
San Lucas; Puerto
Vallarta; Victoria; Halifax
(5)
Montego Bay, Roseau, Ochos
Rios, St. George, Pointe à Pitre
(14)
La Spezia, Madeira Ports, Tunisian
Ports, Málaga, Valencia, Toulon-
Var Provence, Messina, Rhodes,
Kotor, Gibraltar, Heraklion,
Monaco
(12)
St. Petersburg; Tallinn;
Stockholm; Bergen;
Geirangerfjord;
Stavanger; Le Havre;
Oslo; Amsterdam;
Zeebrugge; Flåm;
Dover
Medium Cruise ports 9 - 1 > 10 >5
Small Cruise ports 13 25 2 > 100 >100 Note: Major Cruise ports: more than 1 million passenger movements; Very Large Cruise ports: 500 000 to 1 million passenger movements; Large Cruise Ports: 200 000 to 500 000 passenger movements; Medium Cruise ports: 100 000 to 200 000 passenger movements; Small Cruise ports: less than 100 000 passenger movements Sources: AAPA (2015a); AAPA (2015b); MedCruise (2015); various ports websites.
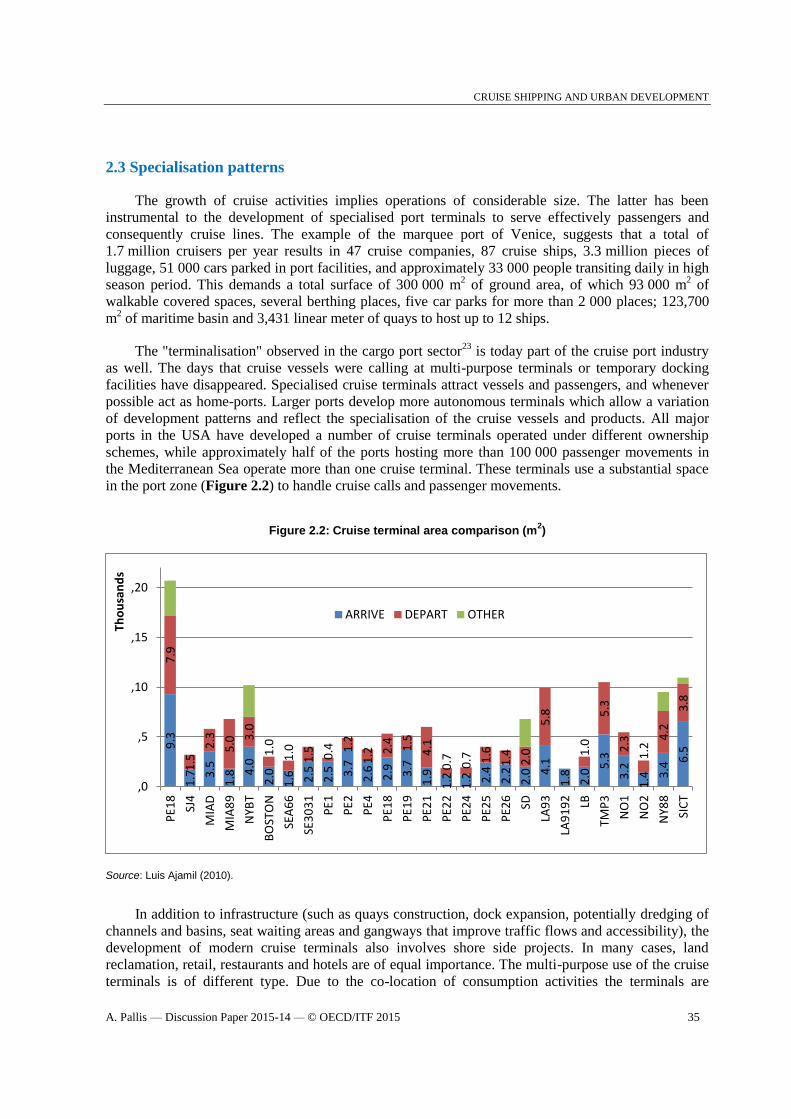
CRUISE SHIPPING AND URBAN DEVELOPMENT
A. Pallis — Discussion Paper 2015-14 — © OECD/ITF 2015 35
2.3 Specialisation patterns
The growth of cruise activities implies operations of considerable size. The latter has been
instrumental to the development of specialised port terminals to serve effectively passengers and
consequently cruise lines. The example of the marquee port of Venice, suggests that a total of
1.7 million cruisers per year results in 47 cruise companies, 87 cruise ships, 3.3 million pieces of
luggage, 51 000 cars parked in port facilities, and approximately 33 000 people transiting daily in high
season period. This demands a total surface of 300 000 m2 of ground area, of which 93 000 m
2 of
walkable covered spaces, several berthing places, five car parks for more than 2 000 places; 123,700
m2 of maritime basin and 3,431 linear meter of quays to host up to 12 ships.
The "terminalisation" observed in the cargo port sector23
is today part of the cruise port industry
as well. The days that cruise vessels were calling at multi-purpose terminals or temporary docking
facilities have disappeared. Specialised cruise terminals attract vessels and passengers, and whenever
possible act as home-ports. Larger ports develop more autonomous terminals which allow a variation
of development patterns and reflect the specialisation of the cruise vessels and products. All major
ports in the USA have developed a number of cruise terminals operated under different ownership
schemes, while approximately half of the ports hosting more than 100 000 passenger movements in
the Mediterranean Sea operate more than one cruise terminal. These terminals use a substantial space
in the port zone (Figure 2.2) to handle cruise calls and passenger movements.
Figure 2.2: Cruise terminal area comparison (m
2)
Source: Luis Ajamil (2010).
In addition to infrastructure (such as quays construction, dock expansion, potentially dredging of
channels and basins, seat waiting areas and gangways that improve traffic flows and accessibility), the
development of modern cruise terminals also involves shore side projects. In many cases, land
reclamation, retail, restaurants and hotels are of equal importance. The multi-purpose use of the cruise
terminals is of different type. Due to the co-location of consumption activities the terminals are
9.3
1.7
3.5
1.8
4.0
2.0
1.6
2.5
2.5
3.7
2.6
2.9
3.7
1.9
1.2
1.2
2.4
2.2
2.0
4.1
1.8
2.0
5.3
3.2
1.4
3.4
6.5
7.9
1.5
2.3
5.0
3.0
1.0
1.0
1.5
0.4
1.2
1.2
2.4
1.5
4.1
0.7
0.7
1.6
1.4
2.0
5.8
1.0
5.3
2.3
1.2
4.2
3.8
,0
,5
,10
,15
,20
PE1
8
SJ4
MIA
D
MIA
89
NYB
T
BO
STO
N
SEA
66
SE3
03
1
PE1
PE2
PE4
PE1
8
PE1
9
PE2
1
PE2
2
PE2
4
PE2
5
PE2
6
SD
LA9
3
LA9
19
2 LB
TMP
3
NO
1
NO
2
NY8
8
SIC
T
Tho
usa
nd
s
ARRIVE DEPART OTHER

CRUISE SHIPPING AND URBAN DEVELOPMENT
36 A. Pallis — Discussion Paper 2015-14 — © OECD/ITF 2015
"people friendly", rather than "cargo friendly"; thus they might be used with open accessibility to
public, for the organisation of events, or other usages. It is especially the case when the seasonality of
cruise activities implies that several of these terminals host cruise ship calls only some months of the
year.
Beyond the change of usage of existing infrastructure, or the development of greenfield projects,
recent developments have also revolved around adaptive reuse of brownfield assets; in the US alone
such cases can be found at both the East (Brooklyn – Galveston) and the West (San Francisco – San
Diego) coast. In all cases, cruise port infrastructure development takes far longer than building new
cruise ships so ports might lag to market developments.
Seasonality
The seasonality of cruise activities is one of the major characteristics of the cruise markets. A
40-week cruise season is considered by many as maximum for cruising a region per year, yet this is
achievable only by some operators. One of the implications is that cruise terminals remain unused for
a lengthy period. Those responsible for developing cruise ports might also be more sceptical for the
devotion of bigger parts of the port zone to cruising. The reason is that this is an activity marked by
seasonality when other factors, such as the port land scarcity, and the request for more space by cargo
port activities, add pressures to devote available port land to cargo. Societal pressures for year round
utilisation, so that the port-city and related destinations that enjoy the benefits of cruise tourism put
pressure on ports to develop conditions for expanding the existing.
Some cruise regions are less affected by the seasonality of activities. Caribbean is one of the
cases that cruises run throughout the year and the number of monthly passengers is fairly stable
throughout the year in markets serviced by North American ports with passengers between 800 000
and one million per month and a December/January peak season. However, a closer look at the North
American market reveals specific seasonality patterns24
. The Caribbean market and its sub-regions
obviously dominate to account for more than 90% of the passengers during the high winter season and
around 55% of the passengers during the low summer season. The seasonality of Alaska, Bermuda and
Canada/New England is also evident, with cruise lines attempting to optimize the utilization of their
assets year round by repositioning to take advantage of the seasonality of cruise markets. An
unexpected pattern is the lack of seasonality for the Bahamas, mainly the outcome of the strategies of
the main cruise lines to build private ports reserved for their exclusive use.
Seasonality does not restrict the development of a cruise region. The Mediterranean and its
adjoining seas evolved as a most dynamic cruise region with a very seasonal pattern of cruise activities
(Table 2.4). Each month of the May-October period host, in a most balanced way, traffic shares of
10-12%. In total, 81.3% of the 2014 cruise passenger movements occurred during this six-month
period. The share of the total passenger movements registered during the three winter months
(January, February, December) stands at only 7.5%, of the total annual movements. This has triggered
discussion among stakeholders on how to achieve year-round activities – without concrete results for
the moment.
Detailing the total number of cruise calls per month reveals that winter activities are linked with
single call operations of different size than during the rest of the year. In the Mediterranean example,
less than 400 calls happen from December to February, yet these months each call is associated on
average with more passengers per month; January is the month of 2014 with the highest rate of
passengers per call (2,314), followed by February (2,153) and December (2,095). Cruise lines develop
less itineraries, as repositioning of vessels is taking place, with cruises marked by a substantially
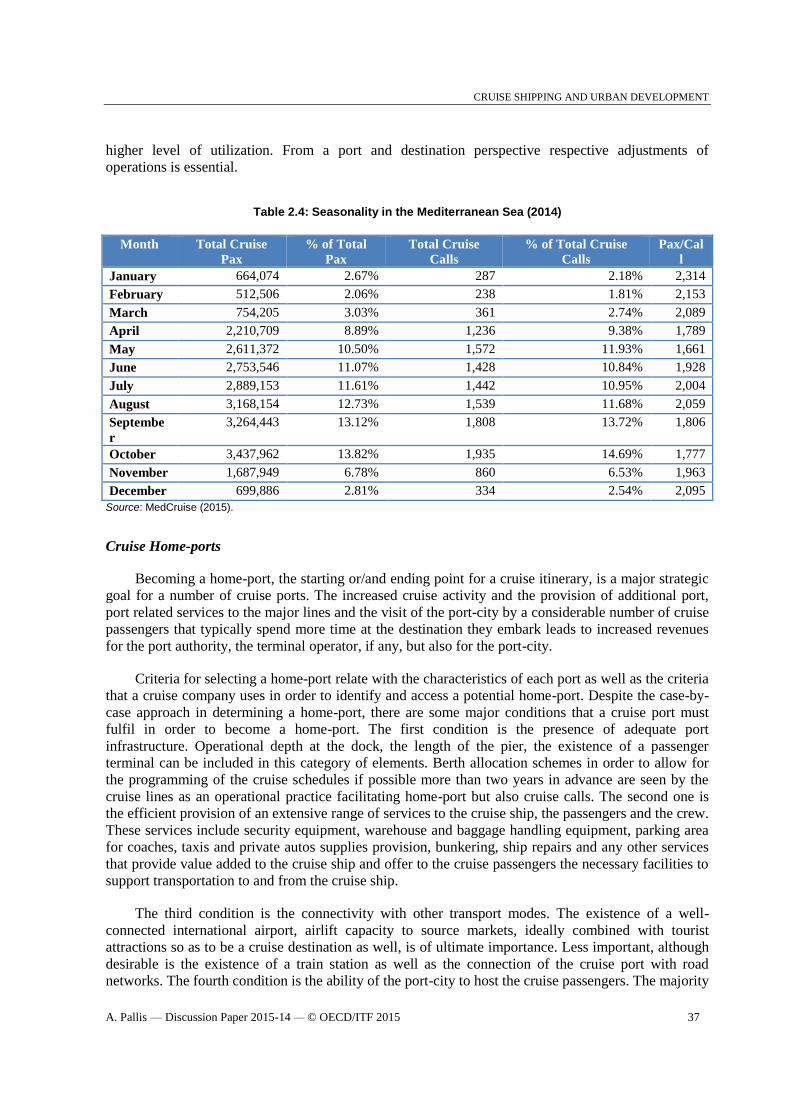
CRUISE SHIPPING AND URBAN DEVELOPMENT
A. Pallis — Discussion Paper 2015-14 — © OECD/ITF 2015 37
higher level of utilization. From a port and destination perspective respective adjustments of
operations is essential.
Table 2.4: Seasonality in the Mediterranean Sea (2014)
Month Total Cruise
Pax
% of Total
Pax
Total Cruise
Calls
% of Total Cruise
Calls
Pax/Cal
l
January 664,074 2.67% 287 2.18% 2,314
February 512,506 2.06% 238 1.81% 2,153
March 754,205 3.03% 361 2.74% 2,089
April 2,210,709 8.89% 1,236 9.38% 1,789
May 2,611,372 10.50% 1,572 11.93% 1,661
June 2,753,546 11.07% 1,428 10.84% 1,928
July 2,889,153 11.61% 1,442 10.95% 2,004
August 3,168,154 12.73% 1,539 11.68% 2,059
Septembe
r
3,264,443 13.12% 1,808 13.72% 1,806
October 3,437,962 13.82% 1,935 14.69% 1,777
November 1,687,949 6.78% 860 6.53% 1,963
December 699,886 2.81% 334 2.54% 2,095
Source: MedCruise (2015).
Cruise Home-ports
Becoming a home-port, the starting or/and ending point for a cruise itinerary, is a major strategic
goal for a number of cruise ports. The increased cruise activity and the provision of additional port,
port related services to the major lines and the visit of the port-city by a considerable number of cruise
passengers that typically spend more time at the destination they embark leads to increased revenues
for the port authority, the terminal operator, if any, but also for the port-city.
Criteria for selecting a home-port relate with the characteristics of each port as well as the criteria
that a cruise company uses in order to identify and access a potential home-port. Despite the case-by-
case approach in determining a home-port, there are some major conditions that a cruise port must
fulfil in order to become a home-port. The first condition is the presence of adequate port
infrastructure. Operational depth at the dock, the length of the pier, the existence of a passenger
terminal can be included in this category of elements. Berth allocation schemes in order to allow for
the programming of the cruise schedules if possible more than two years in advance are seen by the
cruise lines as an operational practice facilitating home-port but also cruise calls. The second one is
the efficient provision of an extensive range of services to the cruise ship, the passengers and the crew.
These services include security equipment, warehouse and baggage handling equipment, parking area
for coaches, taxis and private autos supplies provision, bunkering, ship repairs and any other services
that provide value added to the cruise ship and offer to the cruise passengers the necessary facilities to
support transportation to and from the cruise ship.
The third condition is the connectivity with other transport modes. The existence of a well-
connected international airport, airlift capacity to source markets, ideally combined with tourist
attractions so as to be a cruise destination as well, is of ultimate importance. Less important, although
desirable is the existence of a train station as well as the connection of the cruise port with road
networks. The fourth condition is the ability of the port-city to host the cruise passengers. The majority

CRUISE SHIPPING AND URBAN DEVELOPMENT
38 A. Pallis — Discussion Paper 2015-14 — © OECD/ITF 2015
of cruise passengers choose to stay at the port-city prior their embarkation or after their
disembarkation from a cruise ship. As such the port-city must have the necessary infrastructures able
to accommodate the cruise passengers. These infrastructures include hotels, restaurants etc. Finally,
proximity to a source market provides drive from home to port convenience advances the potential of
securing cruise lines selection as a home-port. The proximity reduces the time needed as well as the
relevant cost for passengers in order to travel from their place of residence to the cruise ship and vice
versa.
Asked to rank the most important factors determining the selection of home-port issues out of 81
potential criteria25
, cruise lines prioritise first the issues related to air transport (availability and
capacity of international airport; air lifting connections and their reliability), followed by port
infrastructure related factors (capacity for handling large numbers of passengers at same time; depth of
the cruise port; infrastructure for (dis)embarkation; services related with security), and then criteria
related with the external environment, such as political stability and the feeling of safety and security
in the destination. Once these conditions exist, cruise lines examine potential incentives offered to start
home-port operations and the cost of services to cruise ships. As the cruise industry’s external and
internal environment is changing, the crucial elements also include considerations about the potential
to develop new and more fuel-efficient itineraries. As expected, the functionality of port operations,
port infrastructures and superstructures are also vital parameters.
Variation exists between regions as regards the preferences of passengers to embark from a
specific port. In the US market driving distance from home, parking, and customs immigration
procedures, are top of the list along with convenient airlift into port city, with cruise terminal facilities
and options for pre/post stays and surrounding port area interest following26
. However, when in the
USA driving up to four hours is acceptable (i.e. Houston to Galveston Texas), in Europe the respective
limit is lower to a maximum two hours (i.e. Milano to Savona). On the other hand, Europe has shorter
train access to ports, and major markets such as the British and the German one have taken advantage
convenient train-to-cruise patterns of less than three hours train journeys (i.e. Southampton and Kiele,
respectively).
Home-ports tend to be linked with specific source markets. This is due to proximity, access
options, and not least preferences of cruise passengers to visit certain destinations. In Europe where
multiple home-ports exist, Americans use extensively Southampton and Dover in the UK, Barcelona
in Spain, Venice and Civitavecchia in Italy. British passengers depart from the UK (Southampton;
Dover), Spain (Malaga, Mallorca) and Malta. Germans depart from Hamburg, Kiel and various
Mediterranean ports, whereas other nationalities (i.e. Italians, Spaniards, French and Scandinavians)
take advantage of the presence of home-ports in their countries.
Each cruising area has its home-ports, with the balance of traffic between the hosted home-
porting and transit passenger movements varying from port to port (Table 2.5). The biggest home-
ports in terms of size are located in the U.S.A., as this is this is the major source market for cruise
passengers. The biggest of all is Miami, with passengers moving in and out of a cruise trip standing at
50% of the total movements. The port is favoured by its proximity to the biggest cruising area in the
world in terms of passengers, the Caribbean. Also Miami has managed to attract a significant number
of cruise lines have their premises in Miami. The same ration 50:50 of transit/home-port passenger
movements is observed in the case of the other two major world home-ports, Port Everglades and Port
Canaveral. Some other ports though, i.e. New York, Galveston, passengers beginning or returning
from a cruise represent the total.

CRUISE SHIPPING AND URBAN DEVELOPMENT
A. Pallis — Discussion Paper 2015-14 — © OECD/ITF 2015 39
Table 2.5: Major home-ports per region
Cruising Region Major home-ports Home-porting
passengers
Total cruise
passengers
Home-porting as
% of total cruise
traffic
North America
& Caribbean
Miami (USA) * 2 015 000 4 079 000 49.4%
Port Everglades (USA) * 1 845 000 3 600 636 51.2%
Port Canaveral (USA) * 1 701 000 3 717 586 45.7%
Galveston (USA) * 1 208 802 1 208 802 100%
New York (USA) * 600 000 620 265 96.7%
Mediterranean Venice 1 509 097 1 733 839 87.0%
Barcelona 1 222 487 2 364 292 51.7%
Civitavecchia 730 938 2 140 039 34.2%
Savona 668 473 1 018 794 65.6%
Balearic Islands 606 549 1 587 064 38.2%
Rest of Europe Southampton (UK) * 1 592 000 1 646 000 96.7%
Hamburg (Germany) * 560 500 590 000 95.0%
Copenhagen (Denmark) 144 000 740 000 19.5%
Stockholm (Sweden) * 64 000 467 000 13.2%
Lisbon (Portugal) 41 465 500 872 8.3%
* 2013 data Sources: FCCA & BREA (2013); CLIA Europe (2014); MedCruise (2015); official websites of the port authorities.
In the Mediterranean, the leading homeport is Venice, which also has the highest percentage of
home-port movements (87%). For Barcelona and Savona the number of home-porting movements is
of lower share, and the share is lower than 40% in the case of the two other ports, Balearic Islands and
Civitavecchia. Three of the five major home-ports (Venice, Civitavecchia and Savona) are in Italy.
The country is strategically located at the centre of the Mediterranean Sea, allowing the development
of cruise itineraries both to the West and the East Mediterranean. It is a major source market for
cruise passengers, but also close to other major source markets like Germany and France and, easily
reachable via all means of transportation. Regarding North Europe, the major home-ports are
Southampton, UK and Hamburg, Germany. The proximity to cruise source markets seems to play a
vital role for the rising of these home-ports, as UK is the biggest source market in Europe and
Germany holds the second place.
Private Islands
As ships get bigger and cruise line fleets grow, some Caribbean ports have generated traffic jams
and crowded shopping malls due to the visit of 15 000-plus passengers disembarking by as many as 8
to 10 calls on an average day. Responding to this challenge in the Caribbean and Bahamas Cruise
Lines operate and offer private islands, peninsulas, or beaches as a port of call on many of their
Caribbean and Bahamas itineraries (Table 2.6).
All the mainstream lines except Carnival have private islands, or parts of islands, that are
included as a port of call on many of their Caribbean and Bahamas itineraries. While few have any
true Caribbean culture, they do allow cruisers a guaranteed and more private experience. These private
facilities are all within one cruise day from the home-ports of Florida, offering the option of short
three to four days cruises to a quiet and safe destination. This represents a mass market that remains
constantly serviced by large ships since it is the least expensive to service from southern Florida ports
of call. Aside from few, neither the islands nor private facilities have a large dock, so passengers are
ferried ashore by tender. Private resorts are a business solution to the fact that most cruise destinations
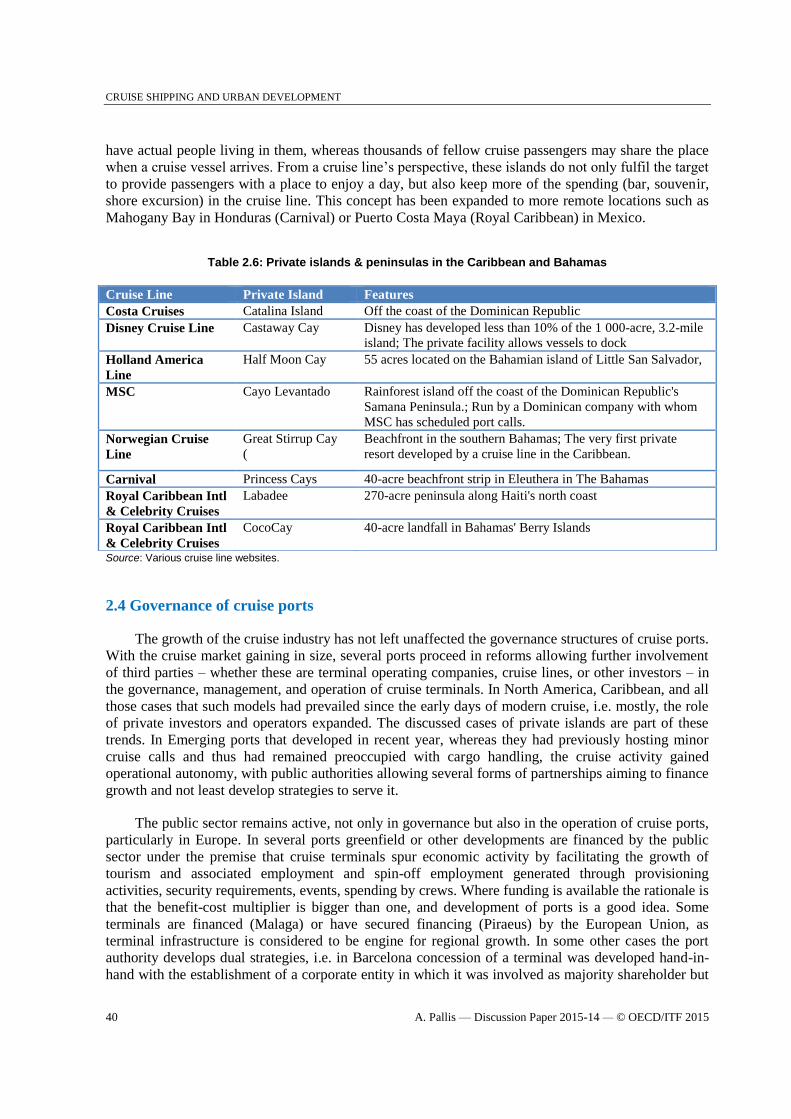
CRUISE SHIPPING AND URBAN DEVELOPMENT
40 A. Pallis — Discussion Paper 2015-14 — © OECD/ITF 2015
have actual people living in them, whereas thousands of fellow cruise passengers may share the place
when a cruise vessel arrives. From a cruise line’s perspective, these islands do not only fulfil the target
to provide passengers with a place to enjoy a day, but also keep more of the spending (bar, souvenir,
shore excursion) in the cruise line. This concept has been expanded to more remote locations such as
Mahogany Bay in Honduras (Carnival) or Puerto Costa Maya (Royal Caribbean) in Mexico.
Table 2.6: Private islands & peninsulas in the Caribbean and Bahamas
Source: Various cruise line websites.
2.4 Governance of cruise ports
The growth of the cruise industry has not left unaffected the governance structures of cruise ports.
With the cruise market gaining in size, several ports proceed in reforms allowing further involvement
of third parties – whether these are terminal operating companies, cruise lines, or other investors – in
the governance, management, and operation of cruise terminals. In North America, Caribbean, and all
those cases that such models had prevailed since the early days of modern cruise, i.e. mostly, the role
of private investors and operators expanded. The discussed cases of private islands are part of these
trends. In Emerging ports that developed in recent year, whereas they had previously hosting minor
cruise calls and thus had remained preoccupied with cargo handling, the cruise activity gained
operational autonomy, with public authorities allowing several forms of partnerships aiming to finance
growth and not least develop strategies to serve it.
The public sector remains active, not only in governance but also in the operation of cruise ports,
particularly in Europe. In several ports greenfield or other developments are financed by the public
sector under the premise that cruise terminals spur economic activity by facilitating the growth of
tourism and associated employment and spin-off employment generated through provisioning
activities, security requirements, events, spending by crews. Where funding is available the rationale is
that the benefit-cost multiplier is bigger than one, and development of ports is a good idea. Some
terminals are financed (Malaga) or have secured financing (Piraeus) by the European Union, as
terminal infrastructure is considered to be engine for regional growth. In some other cases the port
authority develops dual strategies, i.e. in Barcelona concession of a terminal was developed hand-in-
hand with the establishment of a corporate entity in which it was involved as majority shareholder but
Cruise Line Private Island Features
Costa Cruises Catalina Island Off the coast of the Dominican Republic
Disney Cruise Line Castaway Cay Disney has developed less than 10% of the 1 000-acre, 3.2-mile
island; The private facility allows vessels to dock
Holland America
Line
Half Moon Cay 55 acres located on the Bahamian island of Little San Salvador,
MSC Cayo Levantado Rainforest island off the coast of the Dominican Republic's
Samana Peninsula.; Run by a Dominican company with whom
MSC has scheduled port calls.
Norwegian Cruise
Line
Great Stirrup Cay
(
Beachfront in the southern Bahamas; The very first private
resort developed by a cruise line in the Caribbean.
Carnival Princess Cays 40-acre beachfront strip in Eleuthera in The Bahamas
Royal Caribbean Intl
& Celebrity Cruises
Labadee 270-acre peninsula along Haiti's north coast
Royal Caribbean Intl
& Celebrity Cruises
CocoCay 40-acre landfall in Bahamas' Berry Islands

CRUISE SHIPPING AND URBAN DEVELOPMENT
A. Pallis — Discussion Paper 2015-14 — © OECD/ITF 2015 41
latter decided to disinvest. Of course, any option is subject to location or marine infrastructure
restrictions.
A key part of the governance of public or private entities managing cruise ports lies in achieving
a balanced relation with cruise lines so as to secure inclusion in itineraries. Relations between ports,
cruise lines, and, if present, operators are different from port to port. Structured around infrastructure
conditions supplied, coordination mechanism involving other stakeholders, financing, risk distribution,
local traditions, labour practices, there are not many such relationships being the same. Terms of
services such as competition on berths, long-term engagement, the setting of port tariffs, berth
allocation schemes, practices in place of cancellation of calls for other reasons than major force, the
way to promote excursions when competition by local entities and cruise lines is frequently tense, taxi
and other public transport availability, are also shaping the relationship between the industry
demanding the service (cruise lines) and the industry supplying them (cruise ports).
Coordination of stakeholders
At the same time, managing bodies of cruise ports retain a key role in the coordination of
stakeholders. With ports investing in new terminals, the coordination to provide efficient
transportation links and access to destination is a complementary investment, as it generates further
interest of cruise lines in including the port in their itineraries. They also retain a leading role in the
promotion of the cruise related cluster developing in and around a port, and mobilize destination
authorities, entrepreneurs and chambers in order to maximize economic returns for the port and the
local economy.
The latter includes interactions with government and private stakeholders that guarantee the
presence of professional services in different sectors such as customs, health authorities, crew services,
as well as an effective supply chain. This chain is important as increasing investments in new
terminals are accompanied by investments in facilities for supplies, services and logistics. Cruise ship
supply is an important element of the economic footprint from cruise tourism. The volume of the of
goods and services and the supporting logistics for supplying both the local and the "non-local" goods
that are essential for completing a cruise, has increased in the recent past. The changes in the nature of
the on-board cruise product are combined with changes in the nature of the logistics and supply chain
that develops in the visiting ports. Technological advancements, the changing needs of the cruise lines,
and the re-engineering of the procurement processes within the major cruise lines are all combined
with expanding range of passenger requirements and consumer demands and expectations. Major
cruise lines have also developed their supply chain infrastructure and support so that they now have
strategic control points within the major cruise destination hubs (i.e. the Mediterranean, and
specifically Barcelona, is one of those main hubs). However, there is an ever-increasing requirement
by the cruise lines to offer more local, regional and specialist products as part of the on-board guest
experience and, therefore, there is kind of a reversal to the overall trend with increased local
purchasing taking place. Developing conditions to provide such supplies, but also addressing
congestion and any environmental costs related to cruise ship supply continue to rely on cruise port
authorities.
To secure coordination, several cruise ports managing authorities develop strategic partnerships
with other stakeholders. Reviewing practices in the Mediterranean, these strategic partnerships most
commonly include tourist organisations and organisations representing the destination and, to a lesser
extent, other stakeholders or cruise lines. Integrating port and the destination stakeholders is not an
easy task though. While there is need for cohabitation between ports and all involved stakeholders,
there is no clear of what is the share of responsibilities in enhancing this cohabitation. This is because
there are many stakeholders potentially involved at multiple levels. From a port perspective, it is clear

CRUISE SHIPPING AND URBAN DEVELOPMENT
42 A. Pallis — Discussion Paper 2015-14 — © OECD/ITF 2015
that the port authority leads the way. Private actors express themselves either through chambers or
corporate entities, yet from local and municipal authorities this participation is perceived in different
ways by different authorities, with policy regimes and bureaucracy making the expression of interest
in contributing more difficult. On the other hand, schemes of joint direct investments are rare. The
most popular type of strategic coordination develops between port authorities. Cruise is based on the
developments of itineraries rather than destinations, thus working together with other ports in the
region is part of the governance tools used frequently. Besides several cruise ports have only recently
evolved and benchmarking and know-how exchanges are vital for many.
Cruise terminal concessions
The development of cruise terminals is not anymore an issue addressed by public port managing
entities. Several cruise ports operate under government concessions to third parties. Generally a
concession model requires the end-user to make a lease payment to the public entity in charge of
ownership and regulation. Port authorities facilitate the presence of concessioners committing
investments and volumes while they enjoy lease revenues and destinations enjoy further benefits such
as retail, and passenger spending ashore. As regards the spectrum of concession formats, the landscape
of cruise ports is not differing from what happens in the cargo sector, especially containers. Variations
between local practices also exist (Table 2.7). A major difference exists though, and that is the fact
that in cruise ports it is the cruise lines rather than the role of stevedoring companies that have a most
dynamic presence.
Cruise lines have demonstrated a keen interest in investing in cruise ports to give growing berth
availability and resolve capacity issues in a number of ports of call. These and other cruise line
companies do so in order to guarantee access for their ships at port infrastructure they consider of best
quality, optimal port experiences and atmosphere to cruisers, and that allows to integrate
transportation operations on core itineraries. Cruise lines invest either alone or with partners,
endorsing case-by-case approaches. Generally, they collaborate with local, private or governmental
entities by providing management and/or financial assistance and often enter into long-term usage
arrangements. Partnering with ports is not rare. In this vein, cost-sharing schemes, even with direct
government involvement (i.e. St Petersburg), represent one of the existing models. Another model is a
cruise line securing long-term commitments and loans subordination for building new docks and
developing infrastructure. There are also cases that the cruise lines invest with the relevant
government authority and various other strategic partners established to develop and/or operate the
port facilities, by providing direct development and management expertise, or certain in limited
circumstances, by providing direct or indirect financial support. In exchange of their involvement
cruise lines generally secure preferential berthing rights for their ships. Yet cruise ports and facilities
remain a very small investment for cruise lines that are mainly investing in cruise ships. In 2012,
investments in cruise infrastructures, together with lands and buildings owned by the cruise lines,
represent 2.8% of the assets owned by Carnival Corporation and 1.8% of those owned by RCCL.
Private investors have also been involved, through traditional joint ventures or else. There are
examples of ports developing through cost sharing between private investors and cruise lines in the
context of a concession (La Goulette, Tunisia), cases of privates that have gained the right to develop
and operate ports (i.e. Istanbul), as well as rising multinationals involved in the operation of several
ports. Global Ports Holding (GPH) operates alone or in partnership terminals in different countries,
and following the recent addition of Lisbon to the existing ports portfolio of Barcelona, Malaga,
Singapore, Kusadasi, Bodrum and Antalya, it will reach 10 million cruise passenger movements
worldwide, making it the world’s largest cruise operator.

CRUISE SHIPPING AND URBAN DEVELOPMENT
A. Pallis — Discussion Paper 2015-14 — © OECD/ITF 2015 43
Table 2.7: Examples of Cruise Terminals Concessions in the US and the Med
Port Private Party Contractor/ Operators Years Since
US
A
Galveston Royal Caribbean International, Carnival Cruise Lines, and CH2MHILL
Design-Build Greenfield cruise terminal project; Innovative financial
scheme; Fee waiver and revenue rebate in exchange for minimum
passenger guarantees
10 2002
Port Everglades Redevelop waterfront facility and infrastructure around Terminal 18
Initial investment in exchange for a 10 year minimum passenger;
guarantees with Royal Caribbean International
10 2009
Canaveral Design-Build project for Cruise Terminal 6 to enhance embarkment &
dismemberment function
n.a. 2011
Med
iter
ran
ean
Sea
Bar, Montenegro Global Ports Holding (GPH) (cruise terminal operator) 30 2013
Barcelona, Spain Carnival (Cruise Line) operates Palacruceros Terminal. 25 2007
Barcelona, Spain Creuers Del Port de Barcelona – (purpose company created by PA and
investors; in 2014 the PA decided to disinvest and RCCL and Global
Ports became the new shareholders)
30 2000
Bodrum, Turkey Bodrum Cruise Ports (owned by GPH 60%, and investing companies
Setur and Yuksel Cağlar)
13 2008
Cagliari, Italy Partnership between RCCL (cruise line) and Venezia Terminal
Passeggeri Spa (purpose company).
n.a. 2012
Cannes Chamber of Commerce of Nice Cote d’Azur 50 1965
Civitavecchia Roma Cruise Terminal (purpose company created by three cruise lines
(33.33%): Costa Crociere, RCCL, MSC Crociere Spa (participating
through its financial holding Marinvest Ltd)
n.a. 2006
Istanbul Doğuş Group (conglomerate active in eight service sectors (81%) and
BLG Capital (real estate private equity) (19%).
30 2013
Kusadasi Partnership between RCCL (cruise line), (27.5%) and Global Ports
Holding (GPH) (cruise terminal operator) (72.5%)
30.
2003
Lisbon Consortium comprised of RCCL (cruise line) (20%), and Global Ports
Holding (GPH) (cruise terminal operator) (40%) Creuers del Port de
Barcelona, S.A. (10%) and Grupo Sousa – Investimentos (30%)
35 2014
Marseille Marseille Provence Cruise Terminal (private company owned by three
cruise lines: Costa Crociere - 40%, MSC - 40% and Louis Cruises-
20%).
25 2009
Updated information based on: Wang et al (2014).
While in Europe the managing port authorities of the ports decided to dissociate from the
operation of cruise terminals, matching the American cruise port model of landowner port authorities,
some endorsed a different path of involvement in cruise operations. They created companies to operate
cruise terminal facilities taking advantage of their experience and very specific know-how they have
already developed, with port authorities retaining stakes. Some of these companies are expanding
offering services to other ports in Mediterranean and abroad (Table 2.8). The Italian Stazioni
Marittima (Genoa, 21.8% owned by the Port of Genoa) and Port of Livorno 2000 (owned for 72% by
the Port of Livorno), have decided to expand their activities in managing other cruise infrastructures
within Italy; as did the owned by private and public regional investors Venezia Terminal Marittima in
Venice. The Spanish Creuers del Port de Barcelona started its operations as a public port authority
subsidiary. It then expanded its portfolio at national level by operating an additional cruise port in
Spain, and at international by investing in the development and operation of a new cruise terminal in
Singapore.
Private entry in cruise ports is associated with potential challenges. While this presence acts as an
enabler for the growth of the cruise sector, it also implies a need to secure long-term access for all.
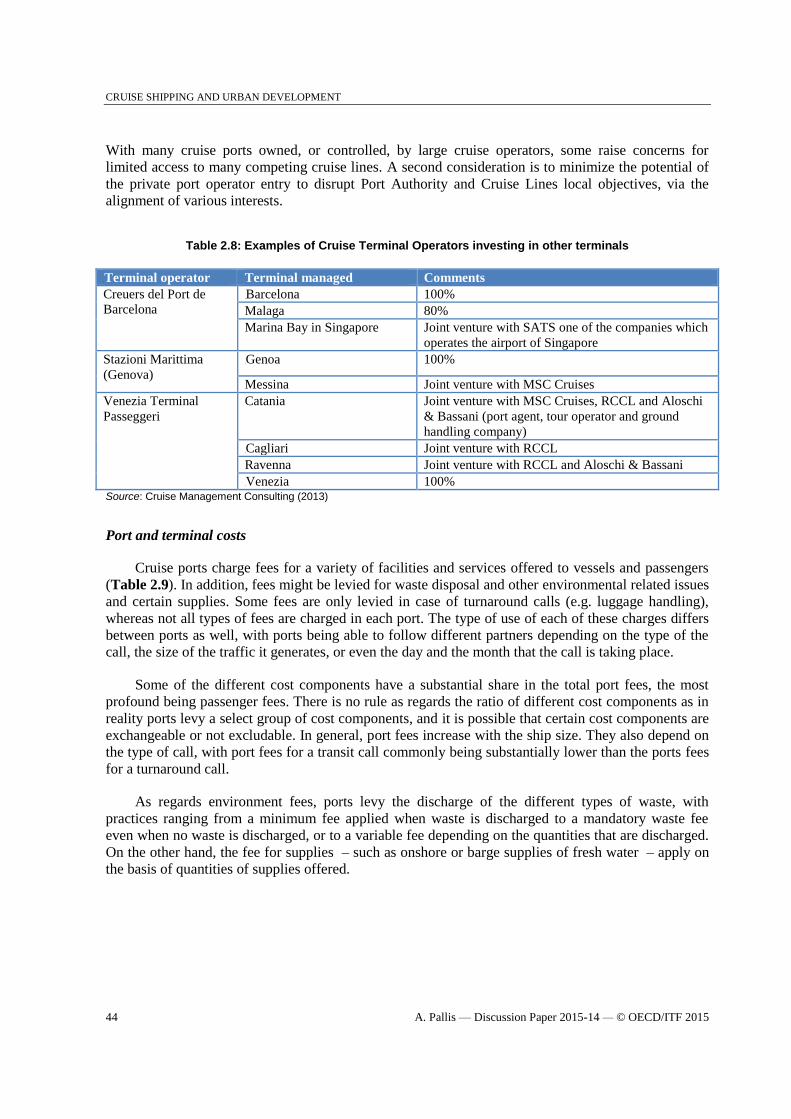
CRUISE SHIPPING AND URBAN DEVELOPMENT
44 A. Pallis — Discussion Paper 2015-14 — © OECD/ITF 2015
With many cruise ports owned, or controlled, by large cruise operators, some raise concerns for
limited access to many competing cruise lines. A second consideration is to minimize the potential of
the private port operator entry to disrupt Port Authority and Cruise Lines local objectives, via the
alignment of various interests.
Table 2.8: Examples of Cruise Terminal Operators investing in other terminals
Terminal operator Terminal managed Comments
Creuers del Port de
Barcelona
Barcelona 100%
Malaga 80%
Marina Bay in Singapore Joint venture with SATS one of the companies which
operates the airport of Singapore
Stazioni Marittima
(Genova)
Genoa 100%
Messina Joint venture with MSC Cruises
Venezia Terminal
Passeggeri
Catania Joint venture with MSC Cruises, RCCL and Aloschi
& Bassani (port agent, tour operator and ground
handling company)
Cagliari Joint venture with RCCL
Ravenna Joint venture with RCCL and Aloschi & Bassani
Venezia 100% Source: Cruise Management Consulting (2013)
Port and terminal costs
Cruise ports charge fees for a variety of facilities and services offered to vessels and passengers
(Table 2.9). In addition, fees might be levied for waste disposal and other environmental related issues
and certain supplies. Some fees are only levied in case of turnaround calls (e.g. luggage handling),
whereas not all types of fees are charged in each port. The type of use of each of these charges differs
between ports as well, with ports being able to follow different partners depending on the type of the
call, the size of the traffic it generates, or even the day and the month that the call is taking place.
Some of the different cost components have a substantial share in the total port fees, the most
profound being passenger fees. There is no rule as regards the ratio of different cost components as in
reality ports levy a select group of cost components, and it is possible that certain cost components are
exchangeable or not excludable. In general, port fees increase with the ship size. They also depend on
the type of call, with port fees for a transit call commonly being substantially lower than the ports fees
for a turnaround call.
As regards environment fees, ports levy the discharge of the different types of waste, with
practices ranging from a minimum fee applied when waste is discharged to a mandatory waste fee
even when no waste is discharged, or to a variable fee depending on the quantities that are discharged.
On the other hand, the fee for supplies – such as onshore or barge supplies of fresh water – apply on
the basis of quantities of supplies offered.

CRUISE SHIPPING AND URBAN DEVELOPMENT
A. Pallis — Discussion Paper 2015-14 — © OECD/ITF 2015 45
Table 2.9: Types of fees levied in cruise ports
Frequently levied fees Less frequently levied fees
Pilotage Chamber of shipping / commerce fee
Passenger fees Gangway fee
Port dues Immigration
Mooring and unmooring Navigation dues
Tug / Towage Passenger luggage storage
Dockage / Anchorage fee Shuttle bus
Light(house) dues Tender
Security costs Crew fees
Passenger luggage handling Customs / clearance
Terminal dues Other compulsory fees
Anchorage dues Sanitary dues Based on: Policy Research Corporation (2013)
Performance assessment
There are two groups of criteria applied when assessing the performance of a cruise port. The
first group relates to the cruise lines, and the type and quality of services offered when calling a port.
The second group of criteria refers to cruise passengers with the emphasis being on the experience
when visiting a port and the destination. To these, one might add the level of compliance to an
increasing set of relevant legislation, i.e. on environment-related themes, via the application of best
practices.
In the first category, accompanying quality port infrastructure with efficient terms and execution
of operations, together with acceptable costs of usage, stand as top performance criteria. Addressing
infrastructure needs is the major issue with different elements conditioning a competitive cruise port.
The infrastructure of the terminal (quay, waiting areas, security etc.), and the transport infrastructure in
and outside the port offered at both the maritime and the landside need to ensure a good reception of
port guests and their mobility to and from the port. Terminal performance to match frequency or
likelihood of demand is linked with the time to clear the ship in a given terminal design. From a cruise
line perspective, performance increases through improved flow and capacity, i.e. providing maximum
processing capacity at the peak load. From a cruise terminal operator it also concentrates on
throughput improvements to reduce space needs. Guaranteeing an optimal security for cruise
passengers is equally perceived as a vital performance parameter for cruise ports.
The passenger experience is the second theme defining the performance of cruise ports. Variable
such as time spent, flow during embarkation and disembarkation, absence of queues in procedures,
spaciousness of the area, and the friendliness of the terminal produce positive assessments by the
passengers. Disembarkation processing time (with customs and immigration) and minimum queue
time at all functions is a key operational performance indicator from a port user perspective, whether
cruise line or a single passenger. Passengers’ assessments of the port experience stand as a
performance indicator first because "word of mouth" and recommendations are key for generating
interest in visiting specific cruise destinations27
and, consequently influence cruise lines decisions on
itinerary planning.

CRUISE SHIPPING AND URBAN DEVELOPMENT
46 A. Pallis — Discussion Paper 2015-14 — © OECD/ITF 2015
2.5 Cruise port competition
The growth of last years has led to the evolution of complex relationships between cruise ports.
The major element is a key feature of the expansion of the sector, the fact that cruising develops on the
basis of itineraries rather than destinations. There is an interdependent relationship between ports.
Competition and cooperation simultaneously occur between two or more rival ports in a given market.
Ports compete with each other aiming at being included in the itineraries organised by the few or
many brands deploying vessels in a specific cruise port region. Yet not all compete for the same prize.
The development of distinctive market segments (i.e. contemporary, premium, luxury cruises) means
that several ports are targeted either by choice or due to capacity and destination restrictions, a share of
some of these segments rather than all. Contemporary cruises and luxury stand as the most popular
market segments. The competition is more intense between ports of the same category. Cruise lines
are interested in creating itineraries including ports of different sizes, as each type of port provides
different kinds of experience, blending different types of attractiveness; and permitting future
passengers to select among variable options for accessing their departing port. For example,
competition develops between marquee ports aiming to be part of most itineraries possible, or between
different destination ports. It also exists between small ports or between ports enabling the application
of "drive-to-cruise" concepts. With the number of ports entering the market increasing, this
competition is intensifying, thus the increase in market size sustains the levels of passenger
movements.
In the case of home-ports, competition is even more intense than in the case of ports of call. In
this case the geographical location of the competing ports tends to be of limited importance, or even
almost irrelevant. Especially in the case of marquee ports, the geographical concern is more limited to
the location of other ports available to confirm attractive itineraries, than the location of the home-port
per se. For these, features and facilities of the cruise port and destination are most significant, as are
the quality and variety offered by the existing chain of suppliers (i.e. bunkering, provisioning) having
the capacity to serve home-porting calls.
While competing, cruise ports also develop cooperation practices as key strategy to develop their
market position. The phenomenon is also observed in the cargo ports28
, but in the case of cruising,
ports do so to an extent that their relationship can be described as the perfect case of "coopetition".
The latter refers to the aim of competing entities to generate a number of advantages and opportunities
produced via active inter-organizational relationships29
. The key concept is to collectively benefit from
the growth of the cruise industry via networking and promotion of regions as a cruise destination,
instead of individual ports. Recalling that the size of a market has rapidly expanded and changed in the
last decade alone, sharing of knowledge on best practices on cruise ports development and
management are also part of the observed cooperation of cruise ports.

CRUISE SHIPPING AND URBAN DEVELOPMENT
A. Pallis — Discussion Paper 2015-14 — © OECD/ITF 2015 47
3. Maximising Benefits and Reaching Potential
Economic impact of cruising
Forecasts for cruise activities suggest that the uninterrupted growth of the last two decades will
continue, with cruise line operators tapping into new markets and destinations, and more ports hosting
increased passenger movements. The magnitude of the benefits produced by cruise activities provides
incentives to communities hosting cruise calls, or start-ups, to seek the best ways to increase the size
of the market share that visits the respective destinations. Despite any challenges, many cities are keen
to develop cruise port activity, aspiring to foster local tourist industries as well.
The positive impact of cruise shipping
Cruise activities are an income generator for the industries that are directly involved in their
provision. These are cruise lines, cruise ports, travel agents, and all those involved in the cruise supply
chain and the related logistics. It is also an income generator for destinations, as shore excursions and
daily staying of cruise passengers are associated with tourism related spending. Port-cities and related
destinations enjoy benefits resulting from three major spending sources. These are cruise lines,
passengers, and crew spending. The direct expenditures made by each of these sources are one of the
different types of positive impact alone. An indirect impact is produced by an economy that supports
cruising. In addition the direct expenditures act as multipliers for an economy, a re-expenditure
producing induced impacts. The different types of the impact are commonly estimated in terms of
direct expenditures, overall economic contribution, employment and income for employees, and taxes.
The global economic impact of the cruise industry for 2013 stands at USD 117.1 billion, while
the cruise industry and its related activities maintains 891 000 jobs. In the same year, the impact of the
cruise industry on the US economy accounted for USD 44 billion and 363 133 jobs, equal to
USD 18.3 billion in wages30
. For Europe alone, the economic impact of cruise activity on the
European economy is estimated at EUR 39.4 billion, while the direct impact from cruise lines, the
passengers and the crew accounted for EUR 16.2 billion. The cruise industry maintains 339 417 jobs
in Europe31
. This impact is mainly enjoyed by a number of marquee and other destinations that have
for long been included in cruise line itineraries. The impact is spread through to more communities.
With cruise lines seeking the expansion of the industry, smaller ships, and in some cases larger ones,
are able to bring tourists to new ports which were previously inaccessible or off the beaten path.
The port-city is benefiting from the expenses of cruise passengers and crew members during their
stay at the destination. These expenses are related with tourism, food and beverages, travel services,
shopping, entrance to historical and cultural sightseeing etc. When the cruise port acts as a homeport
the economic impact for the port-city is bigger. Cruise passengers stay more at the destination, either
by early arrival or by extending their stay after the end of the cruise. This means additional spending,
including benefits for the hotel industry that is not benefiting in case that the port is operating as transit
port only. Finally, cruise sector expansion benefits the image of the destination, and increases the port-
city reputation as a touristic destination. During a cruise, passengers have the opportunity to see
several destinations and this experience is affecting their decision to return to some port-cities for
vacations, of even as repeat cruisers.

CRUISE SHIPPING AND URBAN DEVELOPMENT
48 A. Pallis — Discussion Paper 2015-14 — © OECD/ITF 2015
According to cruise line statistics, in 2013 the economic impact created by cruise passengers and
crew at the port cities worldwide accounted for USD 14 579 billion. The major spending categories
were food and beverages, tours and local transit services, and retail expenses. For home-porting
passengers the average spend per visit was USD 316.3 while for transit passengers the average
spending was USD 92 per visit. The frequently overlooked crew spending was also considerable,
standing on average at USD 56.7 per visit32
.
Cruise lines benefit local communities via expenditures for the operation of the cruise ships.
These expenditures include costs for bunkering, supplies, spare parts, lubricants, repairs as well as the
crew related costs. A cruise operator might procure supplies for companies located in the port city, as
well as for those services related with the facilitation of the cruise ship (i.e. shipping agents, shore
excursions etc.). There are additional benefits produced by the operation of the cruise company.
Indicatively these benefits include the operation of headquarters or local offices, the spending in
advertising and promotion activities, and other business services. These benefits are not spread in all
cruise destinations. In general, cruise companies tend to prefer major homeports in order to establish
their headquarters, i.e. Miami is hosting the headquarters of some of the biggest cruise companies,
whereas in Europe, such homeport cases include Genoa (Italy), Southampton (U.K.) and Hamburg
(Germany).
Shipbuilding and the construction cost for new cruise ships is the activity where cruise spends the
biggest amounts of all. In 2014, the economic impact derived from the building of new cruise ships
reached USD 3.9 billion, where new buildings already ordered by CLIA members for 2015-2020 cost
USD 25.65 billion33
. As cruising is increasing its market share of tourism, and new capacity is added
to the global cruise fleet, these types of economic impact are expected to increase further.
The positive impact of cruise port development
Cruise ports enjoy a share of the benefits that cruise shipping generates. They do so receiving
significant revenues for hosting cruise calls and the respective passenger movements. In turn, port
strategies to attract cruise lines provide a value added non-tangible benefit to the local community.
This is the investment in the promotion of the destination to the cruise and tourism communities.
The major economic benefit for the port itself is the result of the dues paid for the cruise call and
for the disembarking and embarking passengers. Typical fees collected from cruise ships are the
entrance fees, normally calculated on the basis of the cruise ships gross register tonnage, and the
berthing fees, normally calculated per day and per length meter of vessel. There are a number of other
potentially applicable dues, an example being the pilot fees or the reception of on-board generated
waste through a lump sum. These might also be calculated according to the vessel gross registered
tonnage, or according to the use or not of the service, yet these might be collected for third parties
providing services rather than the port itself. A cruise passenger fee is imposed for transit as well as
homeport passengers, while in the latter case the fee is higher. Passengers (dis)embarkation is also
subject to other fees such as the passenger security fee for the use of the provisions of the International
Ship and Port Facility Security (ISPS) Code. This charge is usually a fixed rate per cruise passenger
embarking, disembarking, or transiting through the cruise port.
Apart from the aforementioned charges there are also charges based on the provision of specific
port services as for example, bunkering, provision of water and electricity to the cruise ship, provision
of cruise ship supplies etc. Ports normally apply discount policies for cruise ships and passengers, as a
promoting tool for attracting cruise traffic. These discounts are based on the number of passengers per
year or the number of calls.

CRUISE SHIPPING AND URBAN DEVELOPMENT
A. Pallis — Discussion Paper 2015-14 — © OECD/ITF 2015 49
To reach an increased number of calls, and the subsequent direct economic benefits, cruise port
develop marketing and promotional activities that are not limited to the promotion of the terminals, or
other port infrastructure capacities. Cruise ports also promote port-cities and nearby cultural/tourist
sites, in an attempt to generate passenger interest and influence the cruise lines' route schedules.
Beyond marketing per se, cruise ports develop cluster activities aiming to coordinate operations and
allow for uninterrupted processes; or collectively promote the destination with other stakeholders.
A public agenda for sustaining growth and maximising benefits
Combined with the described shapes of cruise shipping and cruise ports, the magnitude of the
economic impact of cruising for hosting communities and its potential inform an evolving public
agenda. Whereas this is an activity resulting in multiple forms of positive economic impact, it is also
linked with a number of challenges. As any other international economic activity, cruise operations
create footprints at local, national and international levels; the size of their positive impact is qualified
by the condition applying, as does the magnitude of the externalities they produce.
A condition to enable local communities to extract the most benefits from the rapid cruise market
growth is the definition and endorsement of the best practices and policy options at the disposal of
cities, ports and related stakeholders in order to use cruise shipping for both revenues collection and
urban economic development. It is also linked with the ability to mitigate in port-cities the
externalities produced by cruise shipping, such as traffic or environmental ones. While these problems
are normally of local concerns, an international cruise related agenda would help advancing
meaningful proposals, but also minimize concerns of absence of a level playing field. The existing
challenges to be addressed are of operational, social and environmental nature.
Operational challenges
Cruise ports and destinations aim to host an increased number of passengers. While the benefits,
in term of spending at destinations are profound, this growth might be associated with congestion and
related externalities. In small picturesque destinations cruise calls might mean the relatively
unpleasant situations of a crowded location at certain days or hours, even distortion of other tourist
activities. In bigger ports this might take the form of congestion at the time of arrival of bigger ships
on which thousands of people are cruising. The arrival of two average size cruise vessels at a given
port means more than 6 000 passengers disembarking at the same time. Hosted passengers might
increase without an increase of the number of cruise calls. Yet, congestion in small and medium
destinations is in some cases produced simply because of small additional number of calls. Without
effective planning, during some days these destinations are subject to the pressure and the negative
effect of too many passengers that can hardly be accommodated in a way allowing for a positive
experience. The fact that in several cases the presence of cruises is marked by seasonality deteriorates
the problem that smaller tourist attractive destinations face.
Relevant issues to be addressed include the availability of adequate infrastructure and the
organisation of the terminal operations in an efficient way. They also include safety and security for
passengers, crew and vessels. Beyond matters worth consideration in all ports, such as number of
berths, water and sewage facilities, customs, agents, pilots, security and immigration processes,
gangways usage etc., additional ones are present in the case of home-ports. Luggage handling, air-sea
linkages, improved visa procedures and check-in processes that provide accessibility and convenience
for those embarking and disembarking are some of the latter. The development of transport and
tourism services, such as buses, taxis, drivers, guides and translators, are also critical. These concerns
need to be addressed following a better understanding of the exact implications that the enduring

CRUISE SHIPPING AND URBAN DEVELOPMENT
50 A. Pallis — Discussion Paper 2015-14 — © OECD/ITF 2015
increase of the size and capacity of cruise vessels and the resulting scale of operations produce. Such
discussion would help the understanding of operational, social and environmental limitations of the
economies of scale, and any potential differentiation depending on specific variables.
The optimal planning of cruise ports and their terminals would enable the best operations
possible. Inevitably this has brought in the agenda of cruise lines and port managers the issue of long-
term arrangements. The parameters that would enable a location, or a port, to secure a long-term
commitment of cruise lines that would provide the motive to proceed to product and process
adjustments need to be defined. Destinations and ports seek ways to reach ways of collaboration with
cruise lines towards this end and broader expertise on what needs to be done towards this direction is
essential.
Berth allocation is another type of long-term planning by the ports, which cannot be efficiently
implemented by one port alone. This practice refers to the advance planning of which cruise vessels
will visit the given port a specific day for a specific timespan. Given the limitations imposed by the
geographical distances between ports included in an itinerary and the lengths of cruises, the
phenomenon of many operators having berthing requests for the same hours is not rare. The debate on
berth allocation remains at the top of the agenda between the key stakeholders, in many respects
however it is inconclusive. Technical issues of its application (time scale, details of the berthing
allocation) but also issues of essence, such as the need of all ports included in an itinerary to
synchronize with the system, the treatment of double bookings, and cancellations of booked cruise
berths, are vital. With the number of players involved, this discussion can hardly be resolved at local
or national level.
Stakeholders' coordination
Resolving most of the above problems demands more that an agreement on some technical issues
(i.e. berth allocation details). It also demands the development of two types of coordination. The first
one is the coordination between cruise ports and cruise lines in order to synchronise the system at the
port and the operations taking place at the port terminal. A number of complex challenges exist,
insofar as the relations between cruise lines and ports are concerned (Table 3.1) and systematic action
to successful address them is subject to coordination The second one is the coordination of tourist
destinations, including local public authorities, museums, retailers and, foremost transport service
providers (coaches, buses, taxis) and travel related industries, so as to create a pleasant experience for
cruise passengers and smooth embarkation and disembarkation processes. Even port arrangements
such as the berthing planning cannot be efficiently implemented if there are no means to involve other
actors at the visited destination so as to orchestrate the entire cruise supply chain.
Table 3.1 Key themes requesting cruise lines and ports coordination
Conditions for long-term engagement Shore excursions
Cooperation when scheduling/ planning itineraries Land-side transportation (buses; taxis; coaches, etc.)
Port tariffs Organization of cruise supply chain
Berth allocation Environmental issues (Shore electricity supply)
Cancelation of calls Improving the involvement of stakeholders (i.e. travel
agents)
Other port services (pilotage mooring, waste
reception etc.)
Operational coordination (visa procedures, luggage
handling etc.)
The coordination of actors with the aim to efficiently integrate the cruise ship supply chain is an
additional challenge for many cruise ports. Provisioning of vessels with supplies is an operation of
substantial size. For some lines local provisioning of food, drink, and clean water is done in calling

CRUISE SHIPPING AND URBAN DEVELOPMENT
A. Pallis — Discussion Paper 2015-14 — © OECD/ITF 2015 51
ports, particularly for longer cruises, thus the choice of destinations might be affected by the presence
of such capacity. A growing trend is to carry nearly all goods from the home-port, due to the concerns
regarding food safety, and economies of scale at major ports. This means a challenge for smaller ports
that would like to see the retaining or expansion of the respective local business. It also means a
challenge of home-ports, or big ports, that feel the pressure of increased scale and concentration of
such provisioning in fewer destinations. Policy practices (i.e. customs, hygiene controls etc.), that
would facilitate cruise lines to provide to their passengers access to all they would prefer, is of
importance and might affect the quantities purchased and the level of spending at certain destinations.
All the above types of coordination are beneficial in an additional respect. Given the low levels of
penetration of cruise in various destinations, the coordinated efforts allow the industry to develop an
attractive value proposition to broader populations. This would facilitate the expansion of the existing
passenger source markets and potentially create new ones.
Interaction of destinations and passengers
A key question refers to the forms of the interactions that hosting destinations develop with cruise
passengers so as to secure an increased benefit for cruise destinations. These benefits do not result in
direct spending alone. They also result in an improvement of the image of the destination with long-
term benefits. From a non-monetary perspective, offering to multi-cultural cruise passenger groups an
experience sharing the local culture, rather than simply copying and enforcing cruisers own home-
town habits and preferences, or even offering a selection of which of two he would like to experience,
is important. Cruise lines serving specific destinations benefit from improved passengers satisfaction
rates, so they have all the potential to be involved in partnership with ports and other stakeholders to
improve the attractiveness of the experiences of their passengers. Noting that the typical American
cruise passenger will enjoy 3.8 cruises in his lifetime34
, pursuing him to return is a competitive
position-improving factor.
Both these interactions and the level of the economic impact created by a cruise are strongly related
with the business strategy that the cruise operator has adopted. On the one hand, the development of
partnerships with other players in the cruise industry, including local partnerships for handling shore
side activities, increases the value added for a given destination. On the other hand, the on-going trend
of vertical integration strategies allows cruise operators to self-handle shore excursions and other
tourist services. The consequent offer of an all-inclusive type of services means that most of the
revenues return to cruise operator. Then, cruise lines build even bigger cruise ships offering a variety
of activities on-board for cruise passengers. These ships invite cruise passengers staying on-board
even during cruise calls, or spending larger shares of their budget while at sea. The longer a cruise
passenger spends on board a cruise ship, the bigger the revenue for the cruise line. Some estimates
suggest that the cruise operators increasingly depend on on-board revenue to cover their operational
costs (Table 3.2). Beyond this, cruise passengers frequently purchase shore excursions organized by
the cruise company, and are hardly visible by the local communities.
The quality and variety of amenities that exist on younger cruise ships and the large-scale, new
buildings have generated considerable scepticism as regards the sharing of the benefits that hosting
destinations will enjoy in the future. While the concept that "the ship is the destination" is a perception
rather than a fact, the implications of these trends deserve attention and, potentially, association with
the level of cruise lines' established implantation in the destinations visited.

CRUISE SHIPPING AND URBAN DEVELOPMENT
52 A. Pallis — Discussion Paper 2015-14 — © OECD/ITF 2015
Table 3.2: A financial breakdown of revenues and expenses of a typical cruiser
Revenues Expenses
US $ % US $ %
Ticket 1,350 75.9 Agent commission 231 13.0
On-board Spending 429 24.1 Ship fuel costs 192 10.8
Casino & Bar 236 13.3 Corporate Operating Costs 206 11.6
Shore excursions (cruise line portion) 86 4.8 Payroll 196 11.0
Spa 43 2.4 Depreciation/Amortization 171 9.6
All other on-board spending 94 5.3 Victualing (food) 107 6.0
On-board and other 78 4.4
Other operating costs 258 14.5
Other and transportation 59 3.3
Interest Expense 55 3.1
Total Passenger spending 1,779 Total Expenses 1,553
Profit before taxes 226 12.7
Note: Worldwide, across all cruise lines
Source: Cruise Market Watch, www.cruisemarketwatch.com/home/financial-breakdown-of-typical-cruiser
Expanding capacity in line with local economic development strategies
Securing most of the potential local gains via an expansion of the cruise activities requests a consensus
of how this might be done and how it might be integrated with the local economic development
strategies. Destinations and cruise ports have no unlimited spaces for the development of all different
activities that they might wish to advance. There is frequently a restriction of space, either at the city
or its waterfront, or at the port. The antagonism of different actors and industries to maintain or
increase the shares of the space they use is not rare.
The development of cruise activities, or just cruise terminals might be associated with restrictions to
residents’ access at the waterfront. On the one hand, the growth of the industry is based on the
modernization of existing infrastructures, but also on the presence of new facilities and the spatial
expansion of the terminals and the cruise related activities. On the other hand, waterfront development
is appreciated in many cases as the way to preserve alternative uses and respect traditions of the cities.
Given this appreciation, citizens’ objections to develop tourist activities or related infrastructures
(parking slots, restricted access zones etc.) are not rare. The definition of the principles to be adopted
and the parameters to be examined would secure a balanced approach.
The same stands true for port development. The limited port zone marks imply choices as regards a
wide spectrum of activities that might develop. As multi-purpose terminals are no longer a viable
option for the development of cruise activities, the growth of cruising may potentially engender
interference with other maritime transport markets. Cargo ports also seek to spatially and functionally
expand so as to improve the level of their own integration in supply chains. Stakeholders involved in
these markets would like to see biggest parts of the port devoted to their activities, rather than the
expansion of cruise ports. A balanced port planning needs to take into account contradicting potentials
of different segments development. How this might be done is a question deserving attention.
Cruise terminal site location is the question that follows. Which site, in which way should be planned
cannot be decided apart from broader destination or regional planning. When several potential port

CRUISE SHIPPING AND URBAN DEVELOPMENT
A. Pallis — Discussion Paper 2015-14 — © OECD/ITF 2015 53
sites can be considered, broader goals, such as spreading tourism to new areas, strengthening
infrastructure, creating tourism routes, providing investment for key facilities, are all part of the
equation. Plans for other sector development and for other forms of tourism create cumulative effects.
The forms of involvement of stakeholders in location choice and, when essential, spatial and traffic
planning, is increasingly important.
The planning of the port and the hosting of cruise activities does not, however, end at the gate of the
terminal. The transfer of passengers from terminal to city and transport for shore excursions are
conversely important. Efficient location choices are conditioned by the efficiency of private, or public,
transport strategies (i.e. services provision to the terminal but also avoid interference with urban road
traffic when a cruise call arrives or departs). Location choices depend on the connection capability of
various tourism-related industries as well as the ongoing urban tourism strategies formulated by tourist
organisations and other relevant decision-makers.
Addressing social challenges
The expansion of cruise activities has not left unaffected the image of cruising. The elite activity of
some passengers per year has been replaced by the mass transportation of thousands of cruise
passengers at once. A community’s decision to seek cruise ship visits requires a number of industries
to be involved but will also affect many, either directly or not. Besides, cruise is not dissimilar with
the impacts generated by any other tourism development on the milieu and services of visited
communities and sites. It might displace current activities by other tourists or by local residents,
causing changes in costs, access and variety. These changes can be positive or negative, i.e.
overloading dock facilities or causing improved ones to be built; creating new services, or pricing the
locals out of existing ones. The same change may be viewed as positive by those who benefit and
negative by those who may not benefit. All these lead to societal approaches that conceive cruise
growth being associated with the deterioration of the quality of life.
A marquee destination that has experienced the negative effect of such approaches is Venice. A ban on
large cruise ships passing through the centre of Venice was imposed in late 2014, preventing all ships
over 96 000 gross tons from sailing to the city’s main cruise terminal, and limit the number of bigger
ships over doing so to five per day. The debate had gained momentum as citizens and local protest
groups, were discontent with the presence of the bigger vessels, arguing that they produce pollution
and result in substantial levels of emissions, with the acid nature of the pollution thought to be
potentially speeding up the erosion of the city’s medieval buildings, which are already sinking into the
lagoon surrounding Venice, itself a UNESCO heritage site. Even with environmental assessment
pending, the image of giant vessels next to traditional buildings led to an overheated reaction by local
communities. Italian authorities are discussing an overturn of the decision in early 2015, as the actual
impact of cruising was better understood, and environmental friendly practices of cruise ship
operators, i.e. the commitment to not using fuel with more than 0.1 per cent sulphur. Cruise liners
anticipated implementations and limited number of big ships to Venice, and given the long-term
nature of cruise lines planning (i.e. itineraries are decided two years in advance) the reverse of
business decisions in the forthcoming future seems improbable.
Whether these are unsubstantiated or not, these are conceptions and perceptions that have to be
addressed in order to achieve sustainable growth. Cruise is inextricably linked with the carrying
capacity of a destination, a concept applicable in tourism development strategies. i.e. the ability of the
destination to absorb tourism before negative impacts are felt from host country, or the maximum
number of people who can use a site without causing unacceptable changes to physical environment or
affect negatively the quality of visitors’ experience. Of course, answering how many cruise passengers
can be hosted or how many can be wanted are questions associated with several parameters (i.e. who

CRUISE SHIPPING AND URBAN DEVELOPMENT
54 A. Pallis — Discussion Paper 2015-14 — © OECD/ITF 2015
decides, which are the management objectives, which are the attributes and capabilities of the
destination) all of them associated with what local communities perceive35
.
The enhancement of community identity in the model of economic growth is in several cases
important. The requirement for local communities to reach optimum levels of exploitation of
traditions, or collectively make decisions concerning the abandonment of local practices so as to
match the preferences of cruise passengers (i.e. the presence of malls and retail centres at specific
locations may run counter to the traditions of small communities), demands inclusive consultation
processes.
A related social challenge is worth to be noted. Cruising brings to a destination people of various
nationalities and cultures, who may have different customs and behaviours than local residents. Cruise
passengers might also be the source of noise and occupation of spaces (churches, restaurants, parks,
beaches etc.), which were previously exclusively used by the local community. The host destination
needs to be prepared to accommodate increased presence of tourists, while the latter adds to the pre-
existing the need of practices that limit any xenophobic attitudes at the hosting communities.
Optimal entry in cruise terminal operations
The intense use of public infrastructures to serve a growing demand and the changing size of cruise
vessels result in the demand of new investments for cruise terminals. Securing funding for upgrading
infrastructures is important. Issues of best use of public funds when available, or the principles of
providing public funds so that they do not distort competition, are of primary importance. In Europe,
beyond ports themselves, or private actors, the states or the European Union institutions might provide
funds for to develop the basic infrastructure. What constitutes the latter is under debate at international
level, as is the whole issue of state aid provision to port infrastructure development, in particular the
suitable level of discussion and best practices and their implementation.
Cruise lines, and most recently global cruise terminal operators, develop a major interest in assuming
responsibility of cruise ports operation, with the type of involvement based on local peculiarities. In
the dynamic industry there have been phases of development. The first phase took place in the 1990s,
with the first cruise terminals. In this period cruise lines were acting most advisors. In the 2000s
several ports developed different development, and berthing police, with cruise lines acting as
collaborators. The third phase in the 2010s cruise lines act also as investors in cruise terminals.
Concessions of rights to operate, and occasionally to build and operate cruise terminals, are preferred
in Europe. The Caribbean offers opportunities for investments in developing private islands and for
expanding to development of cruise related activities such as shopping malls and other retail shopping
entertainment. This trend implies a high level of dependency on cruise lines.
Cruise lines commitment to port investments needs to be in line not only with the port but also with
the city. A gigantic investment has sense when it brings wealth to the destination community, by
creating jobs and business and not interfering in the well-being of the citizens. Cruise lines and
destinations have to work together to maximize the benefit of the cruise tourism. Cities managers
should know that the cruise tourism has its own idiosyncrasy, different from other kind of tourism, and
then define adequate policies with a dedicated approach. On the other hand ports and destinations must
be very careful when considering investments, not least because of the level of the cost of developing
brand new dedicated cruise port infrastructure (pier, breakwaters, etc.) projects that are difficult to
recover.
The advancement of conditions (contractual or else) that increase local/regional attachment and
embedded ness, and minimize the dependence on external control by foreign actors – who extract a

CRUISE SHIPPING AND URBAN DEVELOPMENT
A. Pallis — Discussion Paper 2015-14 — © OECD/ITF 2015 55
large share of the economic rent produced by ports and who are guided by the aim of creating
shareholder value – is more than relevant. With the economic effects of any port activities being no
limited to the local environment, but spreading over a much wider geographical area and among a
large number of international players, port authorities and regional/national governments are
challenged to ensure that the broader region gets a fair share of the economic rent created. This is
needed as a large part of the population takes ports for granted and community groups typically argue
that there is an imbalance at the sharing of the benefits for the local community of having larger and
larger ports. This viewpoint is a breeding ground for socioeconomic confrontations related to cruise
port development. Overlooking a consensus of the conditions to enhance regional implantation and of
a fair return to the local/regional community may jeopardize a cruise port’s future development and its
societal "licence to operate".
Application of innovative technologies
Continuous improvements in the port and its associations with hinterlands are subject to the
application of innovative technologies. The latter are also increasingly vital for optimum cruise
services offering. Infrastructures, such as mobile gangways and the innovative application of existing
technologies so as to further lower the environmental impacts of a growing economic activity might
provide competitive edge to a particular port or destination.
The development of smart, technologically advanced, cruise ships might be a game changer. On the
one hand, key innovations, such as the online check-in are already applied in specific cases. On the
other hand, a wide spectrum of applications that would advance further smart operations, i.e. practical
information, on-board entertainment, luggage tracking, tour transfers, last minute shore excursions
offers or handling support systems, deserve investments, technological advancements and innovative
applications of any technological advancements. Providing smart experiences and taking advancement
of technological adaptations cruises broaden the target groups and increase passenger numbers.
The path towards innovation and digitalisation for the cruise, sector, includes stakeholders
cooperation, skills training development, research based policy decisions and promotion of innovative
information and communication technologies.
Limitation of environmental externalities
In recent times the environmental impacts generated from port and maritime operations have received
attention. Ports in particular are economically, socially, culturally and administratively complex
organizations considered as the source of multiple environmental, economic and social impacts36
. The
emerging question is how cruise shipping, ports and the related economic chain can operate
efficiently, within a socially responsible and acceptable framework. The various environmental
externalities refer to the handling of waste produced, water quality, air emissions, noise, and soil,
whereas other issues (i.e. constructions that alters natural or build environment, fauna, energy
resources, etc.) are also part of the relevant agendas.
Addressing two key externalities produced by the provision of cruise shipping and the hosting of
vessels and cruise passengers at cruise ports stand today as priorities. The same externalities are
illustrative of the need for discussion and conclusions on measures to take place at international level.
These externalities are waste management, and the various forms of emissions, including air and noise
emissions, respectively.

CRUISE SHIPPING AND URBAN DEVELOPMENT
56 A. Pallis — Discussion Paper 2015-14 — © OECD/ITF 2015
Waste reception
A key issue on the relation of cruising and the environment is the development of effective policies
and practices for the collection and handling of the on-board produced waste and garbage. The amount
and types of waste might vary from one cruise ship to another, yet cruises are generators of the highest
amount of garbage. A cruise ship with 3 000 passengers and crew generates about 50 tonnes of solid
waste in a single week. An average cruise passenger generates a minimum of one kilogram of solid
waste plus two bottles and two cans per day and an average of 50 tonnes of sewage (black water) per
day. As cruise activities grow, the size of the waste produced during every single cruise is such that
cannot be ignored.
An international policy agenda has already developed referring to the availability and adequacy of port
reception facilities of ship-generated waste and cargo residues. Together with the establishment of
systems that provide incentives for ships to use, these facilities contribute to a reduction of ships'
discharges into the sea. Relevant provisions have been adopted in the Annex V and VI of International
Convention for the Prevention of Pollution from Ships (MARPOL). These define which wastes can be
discharged into the sea and imposes obligations to provide facilities for the reception of ship-generated
residues and garbage. The EU has followed with a regional piece of legislation addressing the legal,
financial and practical responsibilities of the different operators involved37
.
Most cruise lines and port authorities have implemented environmental management systems in order
to ensure improved operations. Cruise lines have put efforts into reducing, selecting, and managing the
garbage generated on-board, in compliance to the MARPOL requirements. An environmental policy
goal of "zero discharge" for solid waste at sea has been endorsed by several of them. Similarly, cruise
ports have implemented solid waste management processes. They developed facilities, technologies
and services aiming to allow continuity to a cruise ship’s garbage life cycle in a more efficient way.
Today, port reception facilities are generally available and the volumes of waste delivered, comparing
to that discharged at sea, have increased.
A major concern for cruise operators, ports and third parties involved, is how to further improve the
existing processes in place. A related one is the development of efficient information and monitoring
systems allowing for the best use of the mechanisms present. Reducing solid waste and increasing
recycling via availability of garbage reception facilities at all berths, 24 hours, seven days per week,
demands stakeholders cooperation for a better management of the ship generated waste and, not least,
the application of innovative technologies. Both cruise lines and ports need to adjust. Cruise lines need
to demonstrate the willingness to bear a significant part of the cost and thus support the cost recovery
systems in order to encourage the delivery of waste on land. The latter might comprise by a built-in,
fixed element and, possibly, by a variable element according to the amount and type of waste actually
delivered. Cruise ports need to advance handling services such as segregation, biological reprocessing,
inactivation and composting, recycling and storage. Together, these actors can explore the possibilities
of waste treatment on ships via investment in advancing innovative new technologies. These efforts
could decrease the large disparity between waste management ashore and disposal services at
destination. Improving IMO relevant legislation in order to match industrial practices and the potential
of technological advancements are also themes to be tackled via an international agenda.
Improving waste water treatment capacities is another process of importance. In this case the IMO has
already designated "special areas" for passenger ships (i.e. the Baltic Sea) where the discharge of
sewage from a cruise ship will be prohibited, through a gradual process ending not later than 2018.
Stakeholders need to undertake initiatives in order to ensure that facilities for the reception of sewage
are provided in ports and terminals where coastal countries shall report that the sewage reception
facilities in their ports fulfil the criteria of adequacy.
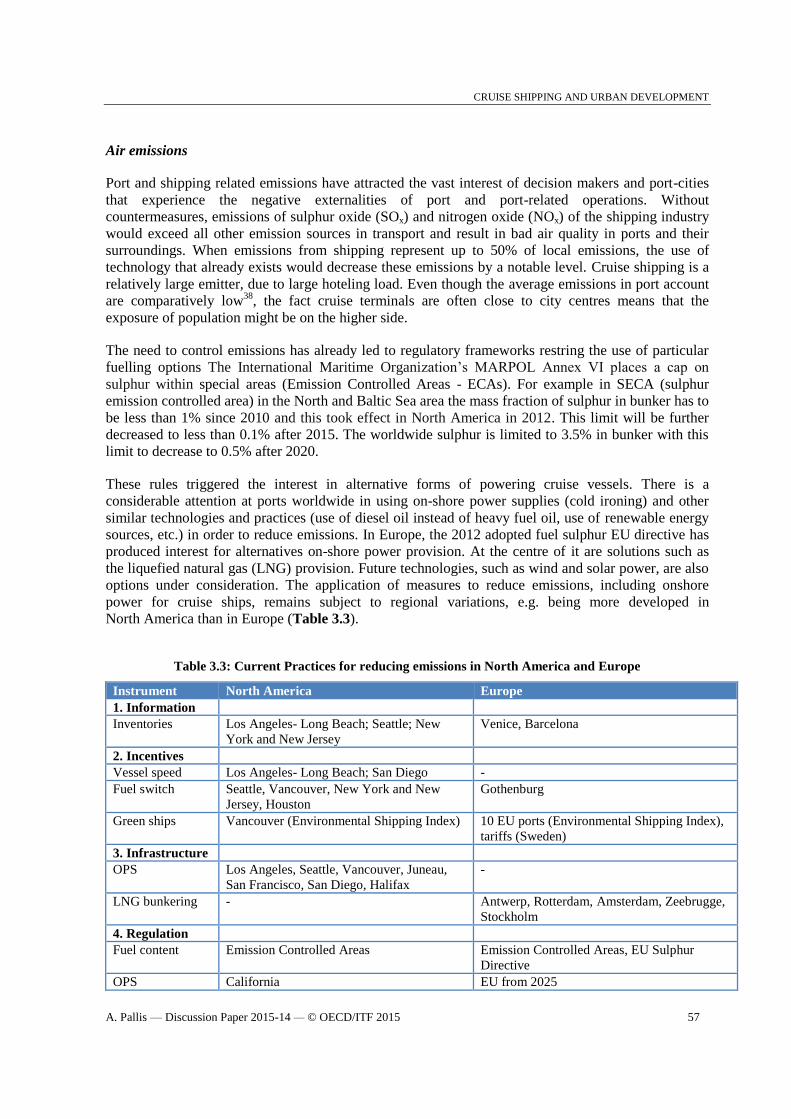
CRUISE SHIPPING AND URBAN DEVELOPMENT
A. Pallis — Discussion Paper 2015-14 — © OECD/ITF 2015 57
Air emissions
Port and shipping related emissions have attracted the vast interest of decision makers and port-cities
that experience the negative externalities of port and port-related operations. Without
countermeasures, emissions of sulphur oxide (SOx) and nitrogen oxide (NOx) of the shipping industry
would exceed all other emission sources in transport and result in bad air quality in ports and their
surroundings. When emissions from shipping represent up to 50% of local emissions, the use of
technology that already exists would decrease these emissions by a notable level. Cruise shipping is a
relatively large emitter, due to large hoteling load. Even though the average emissions in port account
are comparatively low38
, the fact cruise terminals are often close to city centres means that the
exposure of population might be on the higher side.
The need to control emissions has already led to regulatory frameworks restring the use of particular
fuelling options The International Maritime Organization’s MARPOL Annex VI places a cap on
sulphur within special areas (Emission Controlled Areas - ECAs). For example in SECA (sulphur
emission controlled area) in the North and Baltic Sea area the mass fraction of sulphur in bunker has to
be less than 1% since 2010 and this took effect in North America in 2012. This limit will be further
decreased to less than 0.1% after 2015. The worldwide sulphur is limited to 3.5% in bunker with this
limit to decrease to 0.5% after 2020.
These rules triggered the interest in alternative forms of powering cruise vessels. There is a
considerable attention at ports worldwide in using on-shore power supplies (cold ironing) and other
similar technologies and practices (use of diesel oil instead of heavy fuel oil, use of renewable energy
sources, etc.) in order to reduce emissions. In Europe, the 2012 adopted fuel sulphur EU directive has
produced interest for alternatives on-shore power provision. At the centre of it are solutions such as
the liquefied natural gas (LNG) provision. Future technologies, such as wind and solar power, are also
options under consideration. The application of measures to reduce emissions, including onshore
power for cruise ships, remains subject to regional variations, e.g. being more developed in
North America than in Europe (Table 3.3).
Table 3.3: Current Practices for reducing emissions in North America and Europe
Instrument North America Europe
1. Information
Inventories Los Angeles- Long Beach; Seattle; New
York and New Jersey
Venice, Barcelona
2. Incentives
Vessel speed Los Angeles- Long Beach; San Diego -
Fuel switch Seattle, Vancouver, New York and New
Jersey, Houston
Gothenburg
Green ships Vancouver (Environmental Shipping Index) 10 EU ports (Environmental Shipping Index),
tariffs (Sweden)
3. Infrastructure
OPS Los Angeles, Seattle, Vancouver, Juneau,
San Francisco, San Diego, Halifax
-
LNG bunkering - Antwerp, Rotterdam, Amsterdam, Zeebrugge,
Stockholm
4. Regulation
Fuel content Emission Controlled Areas Emission Controlled Areas, EU Sulphur
Directive
OPS California EU from 2025

CRUISE SHIPPING AND URBAN DEVELOPMENT
58 A. Pallis — Discussion Paper 2015-14 — © OECD/ITF 2015
Source: Merk (2015).
Noise emissions
There are different noise sources on ships during their dockage at ports, classified as diesel generator
engine exhaust, ventilation inlets/outlets and secondary noise sources, e.g. pumps or reefers. Cruise
ships operations generate disturbing noise for nearby areas and the crew, whereas they are also a
source of low frequency noises. The IMO has already defined a Code “on noise levels on board ships”
detailing limits for the different types of noise, setting limits of the noise that is emitted into the
surroundings. However, the existing international framework covers only the noise on board ships but
not in a port or during manoeuvring. While the latter activities are in some countries subject of
additional regulations, an international discussion for global rules would facilitate an effective and
sustaining answer on the limits of noise emissions produced by cruise vessels at the port.
What type of action might an international public agenda imply?
The cruise industry has for long demonstrated a remarkable capacity to seize opportunities for growth
and develop beyond expectations. The extensive list of adjustments described has the potential to
facilitate further and sustainable growth and limit the externalities produced by cruise. The
commonality of the problems that cruise lines, cruise ports and hosting destinations need to tackle, the
international dimension of several of the issues in question, and the on-going globalisation of cruising,
indicate that efficient and effective answers might develop at broader international levels rather than
via local efforts.
Generally cruise growth is linked with the advancement of coordination between all relevant
stakeholders. With local conditions and principles of engagement in cruise differing, an international
agenda could act as a facilitator for stakeholders to develop a common understanding, to benchmark
existing practices, to promote specific solutions, and to define principles of actions.
Economic related challenges refer to business models definitions and the endorsement of the best
practices, rather than to the necessity, or the potential, of regulatory intervention. Thus, meeting the
challenges at international level does not necessarily imply the endorsement of economic and
environmental regulatory initiatives. Nor does it imply the a priori absence of any such initiatives.
Distinctive approaches might be endorsed in an attempt to address each of these challenges separately.
With this sector marked for long by successful and admirable adjustments, the presence of regulations
deserves further foundation before any initiative is endorsed.
Besides, the requirements, but also the maturity of cruise markets in different regions of the world, are
diverse. Destinations, waterfronts, and social acceptability of cruise growth, are rarely similar.
Seasonality results in different situations in the case of ports and destinations hosting cruises only
some months of the year, comparing to those serving year round cruises. Technical characteristics and,
not least, the different hosting capacities of destinations and size of port-cities (i.e. cruise port cities in
Europe are remarkably smaller comparing to the North American ones) underline difficulties of
uniformity, while they generate grounds for sharing successful practices. The variable distances
between cruise ports in a given region, and the types of competition that these distances induce, might
result in variations of stakeholder strategies. Destinations have their own dynamics and cruise ports
are diverse in the many respects that have been already been described. In line with the truism that
"each port is unique", state legislation and incentives provided for the development of cruise activities
also differ, making the acceptance of similar practices and policies even more difficult.

CRUISE SHIPPING AND URBAN DEVELOPMENT
A. Pallis — Discussion Paper 2015-14 — © OECD/ITF 2015 59
In this context, stakeholders seek to enact practices satisfying economic demands and reducing costs
and risks, aiming to enable sustainable development, in compliance with legislation. The scope for
international exchanges and resolutions is hinted in the formats of interest representation and
associability that are observed. Cruise Lines International Association (CLIA) integrated in 2013
regional branches so that the industry speaks with one voice. Ports in the Caribbean have formed their
own regional association, whereas in north and south Europe cruise ports are organised in respective
associations (i.e. MedCruise, Cruise Europe, Cruise Baltic) and collaborate at a pan-European network
aiming to identify common stances on issues of interest. European institutions have also expressed an
interest to encourage the involvement of stakeholders in promoting an integrated approach between
cruise shipping, ports and coastal tourism stakeholders for cruise tourism at local, regional, national
and European level, and in the decision making process.
In the cases of environmental challenges, international regulations are highly appropriate when a
legislative approach is found wanted. The most appropriate way to deal with environmental
externalities in a uniform way, hence securing a level playing field for the entire cruise industry, is the
endorsement of international policy instruments. In the major parts of the market (i.e. North America,
European level) legislation is already endorsed as the main driver of needs for environmental
management tools. In emerging areas, such as Asia, environmental considerations remain for the
moment of secondary importance. Beyond legislation, agreements on associated issues - such as the
presence of remote monitoring systems as tools for improving the level cruise and port environmental
conditions - which request complex and expensive processes are better assessed at international level
rather than being causes of distorting competition
This said, the industry has put in place a number of shelf-regulatory practices that have secured growth
but also an operating framework of remarkable records. Even on the environmental front, self-
regulation at international level is not rare. Cruise companies spend heavily to install exhaust gas
cleaning technology (scrubbers) to reduce air emissions from cruise ships. Receiving support from
governmental organisations (i.e. Carnival has established links with the US Coast Guard and Transport
Canada on this issue, while RCCL is developing similar initiatives) and discussing would help the
development and implementation of environmental technology in order to comply with existing
regulation or even pre-empty future ones. Cooperation aiming to advance innovation and alternative
approaches at international level would also facilitate adjustments and solutions meeting the
challenges related to shore power for cruise ships. Incentives referring to fuel switch and the
construction of greener ships are worth to be examined internationally given that reference is on
mobile assets that need to compete on a level playing field. In a similar way, meaningful international
cruise emissions inventories would provide information on a number of unknown factors, such as the
precise emissions of ships while docked comparing when they are on the sea, or the comparison with
emissions from other shipping sectors. All these would inform adjustments of the related regulatory
frameworks.
Environmental externalities have been the theme of initiatives collectively developed by the port
industry within respective port associations. Individual ports make use of environmental management
systems in accordance with ISO14001 along with other practices and tools available to manage
environmental issues. Incentive pricing is also applied as a mean to address environmental challenges.
Ships producing reduced quantities of ship-generated waste are subject of lower dues, as discounts are
offered on the basis of green award certificates or on the basis of an environmental ship index. Yet
even in this case the presence of common principles would facilitate the identification of such ships,
while it would limit questions on the effectiveness of the tools in application and not least the potential
of cross-subsidization between ship types depending on the markets served.

CRUISE SHIPPING AND URBAN DEVELOPMENT
60 A. Pallis — Discussion Paper 2015-14 — © OECD/ITF 2015
Other issues in the environmental agenda also call for an international approach. Ship recycling that
affects the disposing of cruise ships is illustrative. Whereas the IMO Hong Kong International
Convention for the Safe and Environmentally Sound Recycling of Ships (subject to ratification since
2009) provides its own details, regional (i.e. European) authorities have recently developed their own
regulatory regime. Once the former is ratified, it will create a dualism that would be avoided only if
the applied cruise ship recycling regime is harmonized at international level.
Overall environmental issues with reference to shipping and those with reference to ports are strongly
interconnected. Thus the tools, measures, and policies to combat the externalities caused by these two
industries require a holistic study and approach developed internationally. Reports, studies and
essential inventories of measures for internalizing external costs are another field, beyond regulations
that the international level discussions might advance facilitating growth of cruise activities.
Concluding remarks
This report detailed the structures of modern cruise shipping and reviewed the major challenges that
need to be addressed in order to enhance the continuation and sustainability of the uninterrupted
growth that the industry experienced during the last decades. This study has developed with the aim to
provide a background analysis for an international public debate on how best to facilitate the
continuation of the growth of cruise activities around the globe.
The examination of the structures of cruise shipping revealed that the uninterrupted evolution of cruise
activities has developed hand-in-hand with the globalisation of the industry and the exploitation of
new market opportunities by a rather small number of brands, belonging to an even smaller number of
corporations. Capacity growth has been based on the presence of economies of scale, but also on
market segmentation. The former multiply amenities on board, the latter matches distinctive demand
characteristics. In combination they offer passengers a product variety that increase the number of
cruise passengers per year. Similar is the effect of dynamic itinerary building so as to increase choices
offered. Despite the globalisation trends, Caribbean and the Mediterranean sustain as the two major
regions, and new ones, i.e. Asia, are developing. The passenger source markets are also limited and
population penetration in these ones remains low. The potential of exploring more markets, and
increase the number of passenger source markets, along with the confirmed fleet renewal trend,
establish the foundations for further growth.
The analysis of cruise ports characteristics suggests that this industry has also experienced structural
changes aiming to an effective adaptation to the requests of the demand. With the number of
passengers expanding, cruise ports grew in size and expanded in terms of facilities and services
offered. The development of specialized terminals and locations has replaced casual use of multi-
purpose docks. New forms of investment facilitate ports to cope with seasonality, specialization.
Meanwhile, a dynamic environment of cruise port competition has produced short and long term shifts
of market shares. More ports target their inclusion in cruise itineraries, while others attempt to benefit
by developing home-porting activities. Cruise port governance structures have changed, with the
targets being to develop relations with private actors, to orchestrate the coordination of ports and
cruise lines, destinations and other stakeholders, and to improve performance.
The above adjustments and strategies are inextricably linked with the magnitude of the economic
impact of cruise shipping. As more and more passengers enjoy the pleasure of cruising around the
globe, ports and destinations enjoy direct, indirect, and induced positive economic impacts. Port-cities,
destinations and stakeholders have all justifiable reasons to explore strategies to increase their share in

CRUISE SHIPPING AND URBAN DEVELOPMENT
A. Pallis — Discussion Paper 2015-14 — © OECD/ITF 2015 61
hosting passengers and cruise ships calls. When conditions enable it, cruise ports seek to increase
returns by hosting home-porting activities.
A condition to enable local communities to extract the most benefits from the rapid cruise market
growth is the definition and endorsement of the best practices and policy options at the disposal of
cities, ports and related stakeholders in order to use cruise shipping for both revenues collection and
sustainable economic development. The report detailed the various types of key challenges
conditioning the growth of cruise activities. It also detailed the key externalities that are accompanying
this growth.
An international cruise related public discussion would help advancing meaningful proposals for
market expansion. The report provides a provisional agenda, as well as background information of
observed structures and trends. The dialogue between stakeholders and policy makers, studies,
inventories, and consultation can now detail realistic proposals and principles for developing actions at
local or international level, and inform efficient and effective initiatives in order to address
operational, social and environmental challenges and facilitate the continuation of cruise activities
growth.
CRUISE SHIPPING AND URBAN DEVELOPMENT
62 A. Pallis — Discussion Paper 2015-14 — © OECD/ITF 2015
Notes and References
1. Peisley (2012).
2. OECD (2014).
3. CLIA (2015).
4. UNWTO (2014), Tourism Highlights, 2014 Edition.
5. Peisley (2014).
6. Peisley (2014).
7. CLIA (2015).
8. Cruise Industry News (2015)
9. CLIA (2015).
10. CLIA and G.P. Wild (International) (2014), The Global Economic Contribution of Cruise
Tourism 2013.
11. Mintel Academic (2013).
12. Rodrigue and Notteboom (2013).
13. www.f-cca.com
14. www.f-cca.com
15. Cruise Industry News (2015).
16. MedCruise (2015).
17. CLIA (2015).
18. CLIA (2015)
19. CLIA data (Asia Cruise Trends, 2014)
20. OECD (2014)
21. Analysis of different categories also draws on: Rodrigue (2015).

CRUISE SHIPPING AND URBAN DEVELOPMENT
A. Pallis — Discussion Paper 2015-14 — © OECD/ITF 2015 63
22. G.P. Wild from various sources.
23. Slack (2007).
24. Rodrigue and Notteboom
25. Lekakou et al. (2009).
26. Kushuma (2015).
27. Satta et al. (2014).
28. Song and Lee (2012).
29. Bengtsson, M. and Kock (2000).
30. BREA (2014a).
31. CLIA Europe (2014).
32. BREA (2014b).
33. CLIA (2015a).
34. CLIA (2015b)
35. Stefanidaki (2015).
36. OECD (2011).
37. EU Directive 2000/59/EC.
38. Habibi and Rehmatulla (2009).
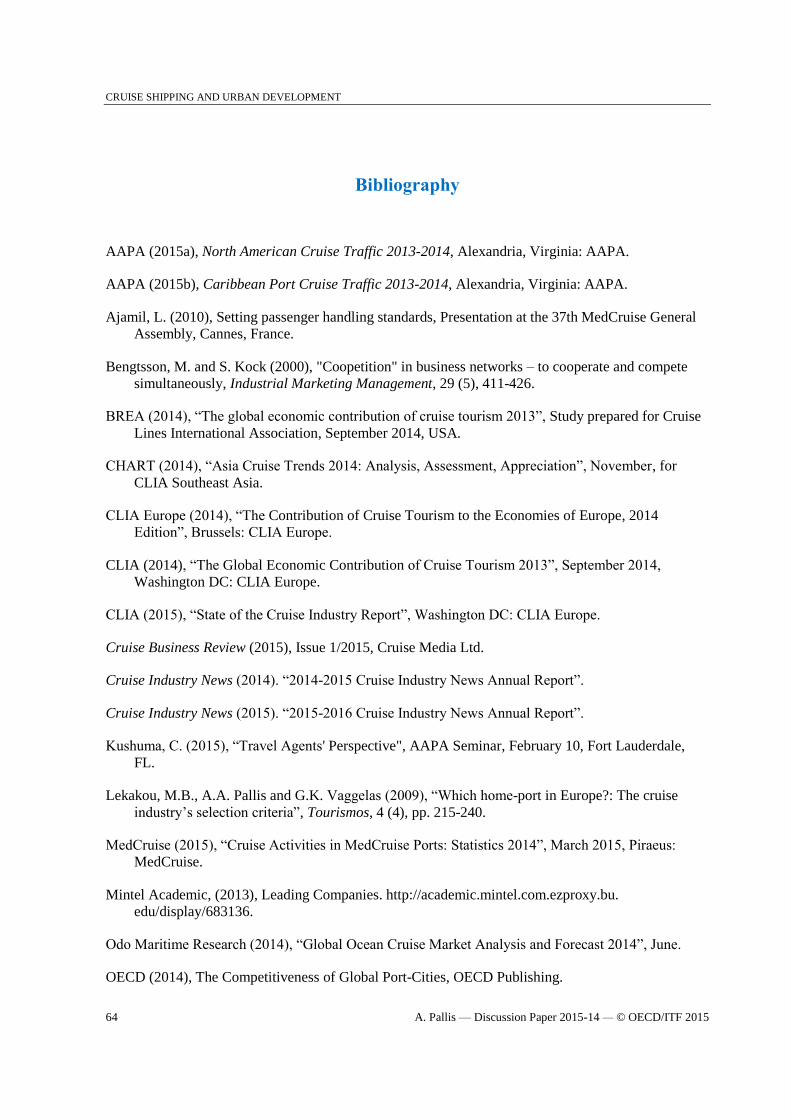
CRUISE SHIPPING AND URBAN DEVELOPMENT
64 A. Pallis — Discussion Paper 2015-14 — © OECD/ITF 2015
Bibliography
AAPA (2015a), North American Cruise Traffic 2013-2014, Alexandria, Virginia: AAPA.
AAPA (2015b), Caribbean Port Cruise Traffic 2013-2014, Alexandria, Virginia: AAPA.
Ajamil, L. (2010), Setting passenger handling standards, Presentation at the 37th MedCruise General
Assembly, Cannes, France.
Bengtsson, M. and S. Kock (2000), "Coopetition" in business networks – to cooperate and compete
simultaneously, Industrial Marketing Management, 29 (5), 411-426.
BREA (2014), “The global economic contribution of cruise tourism 2013”, Study prepared for Cruise
Lines International Association, September 2014, USA.
CHART (2014), “Asia Cruise Trends 2014: Analysis, Assessment, Appreciation”, November, for
CLIA Southeast Asia.
CLIA Europe (2014), “The Contribution of Cruise Tourism to the Economies of Europe, 2014
Edition”, Brussels: CLIA Europe.
CLIA (2014), “The Global Economic Contribution of Cruise Tourism 2013”, September 2014,
Washington DC: CLIA Europe.
CLIA (2015), “State of the Cruise Industry Report”, Washington DC: CLIA Europe.
Cruise Business Review (2015), Issue 1/2015, Cruise Media Ltd.
Cruise Industry News (2014). “2014-2015 Cruise Industry News Annual Report”.
Cruise Industry News (2015). “2015-2016 Cruise Industry News Annual Report”.
Kushuma, C. (2015), “Travel Agents' Perspective", AAPA Seminar, February 10, Fort Lauderdale,
FL.
Lekakou, M.B., A.A. Pallis and G.K. Vaggelas (2009), “Which home-port in Europe?: The cruise
industry’s selection criteria”, Tourismos, 4 (4), pp. 215-240.
MedCruise (2015), “Cruise Activities in MedCruise Ports: Statistics 2014”, March 2015, Piraeus:
MedCruise.
Mintel Academic, (2013), Leading Companies. http://academic.mintel.com.ezproxy.bu.
edu/display/683136.
Odo Maritime Research (2014), “Global Ocean Cruise Market Analysis and Forecast 2014”, June.
OECD (2014), The Competitiveness of Global Port-Cities, OECD Publishing.
CRUISE SHIPPING AND URBAN DEVELOPMENT
A. Pallis — Discussion Paper 2015-14 — © OECD/ITF 2015 65
Pallis, A.A. and K.P. Arapi (2015, in press), Cruise Port Market dynamics: The Mediterranean Sea as
a multi-port cruise region, Proceedings of the IAME 2015 Annual Conference, Kuala Lumpur,
Malaysia, August.
Peisley, T. (2012), "Cruising Through the Perfect Storm: Will Draconian New Fuel Regulations in
2015 Change the Cruise Industry's Business Model Forever?", Colchester: Seatrade
Communications Ltd.
Peisley, T. (2014), End of the Beginning for Cruising, Colchester: Seatrade Communications Ltd.
Peisley, T. (2003), “Cruising: A global view of the challenge and the opportunity”, Paper presented at
the International Association Cities and Ports Days, Le Port, La Réunion, 19-22 November.
Policy Research Corporation (2013), “Benchmark of Mediterranean Cruise Ports”.
Rodrigue, J.-P. (2015), The Geography of Transport Systems. E-edition available at:
http://people.hofstra.edu/geotrans.
Rodrigue, J.-P. and T. Notteboom (2012), “The geography of cruise shipping: itineraries, capacity
deployment and ports of call”, in: Proceedings of IAME 2012 Conference, Taiwan.
Rodrigue, J.-P. and T. Notteboom (2013), The Geography of Cruises: Itineraries, not Destinations.
Applied Geography, 38, 31-42.
Satta, G., F. Parola, L. Penco and L. Persico (2014), Word of mouth and satisfaction in cruise port
destinations, Tourism Geographies, DOI: 10.1080/14616688.2014.938689.
Slack, B. (2007), The Terminalisation of Seaports, in: J. Wang, D. Olivier, T. Notteboom and B. Slack
(eds.), Ports, Cities, and Global Supply Chains, Aldershot: Ashgate, pp. 41-50.
Song, D.-W. and E.-S. Lee (2012), "Coopetitive" networks, knowledge acquisition and maritime
logistics value, International Journal of Logistics Research and Applications, 15(1), 15-35.
UNWTO (2014), Tourism Highlights, 2014 Edition.
Wild, G.P. (1994), The Cruise Market, London: Lloyd’s of London Press.
Websites:
Cruise Market Watch, www.cruisemarketwatch.com
Florida-Caribbean Cruise Association, www.f-cca.com
Seatrade Insider, www.seatrade-insider.com
Cruise Line websites:

CRUISE SHIPPING AND URBAN DEVELOPMENT
66 A. Pallis — Discussion Paper 2015-14 — © OECD/ITF 2015
www.aida.de, www.azamaraclubcruises.com, www.carnival.com, www.celebritycruises.com,
www.costacrociere.it, www.costacruises.com, www.cdfcroisieresdefrance.com,
www.crystalcruises.com, www.cunard.com, www.disneycruise.com,
www.fredolsencruises.co.uk, www.hlkf.de, www.hollandamerica.com, www.hurtigruten.us,
www.thomson.co.uk/cruises, www.celestyalcruises.com, www.msccruisesusa.com,
www.ncl.com, www.oceaniacruises.com, www.pocruises.com, www.princess.com,
www.pullmanturcruises.com, www.rssc.com, www.royalcaribbean.com, www.seabourn.com,
www.SeaDream.com, www.silversea.com, www.swanhellenic.com, www.thomson.co.uk/cruises,
www.tuicruises.com, www.voyagesofdiscovery.com, www.voyagestoantiquity.com,
www.windstarcruises.com

International Transport Forum2 rue André Pascal 75775 Paris Cedex [email protected]