Crude Oil - WordPress.com Canada and U.S. Crude Oil Demand by Market Region Eastern Canada In 2015,...
52
CANADA’S OIL & NATURAL GAS PRODUCERS JUNE 2016 Crude Oil FORECAST, MARKETS AND TRANSPORTATION
-
Upload
vuongnguyet -
Category
Documents
-
view
226 -
download
0
Transcript of Crude Oil - WordPress.com Canada and U.S. Crude Oil Demand by Market Region Eastern Canada In 2015,...
Crude Oil Forecast, Markets & Transportation 1
CANADA’S OIL & NATURAL GAS PRODUCERS
JUNE 2016
Crude Oil FORECAST, MARKETS AND TRANSPORTATION
2 CANADIAN ASSOCIATION OF PETROLEUM PRODUCERS
Executive Summary
The oil industry is in the midst of the most severe downturn in recent history. Lower earnings have led to cost cutting and reduced capital investments in exploration and production. The Canadian oil industry must not only contend with a lower oil price environment but in the near term will have to recover from the damage caused by the recent wildfires in Fort McMurray. As the industry adjusts to these challenges, the prospect for long term supply growth can be fostered through better market access.
CAPP’s annual Crude Oil Forecast, Markets and Transportation report provides the association’s latest long term outlook for Canadian crude oil supply in combination with an update on oil markets and transportation infrastructure developments.
Key observations from this year’s report are:
• Totaloilsupplycontinuestogrowbutataslowerpacethanseeninrecentyears.
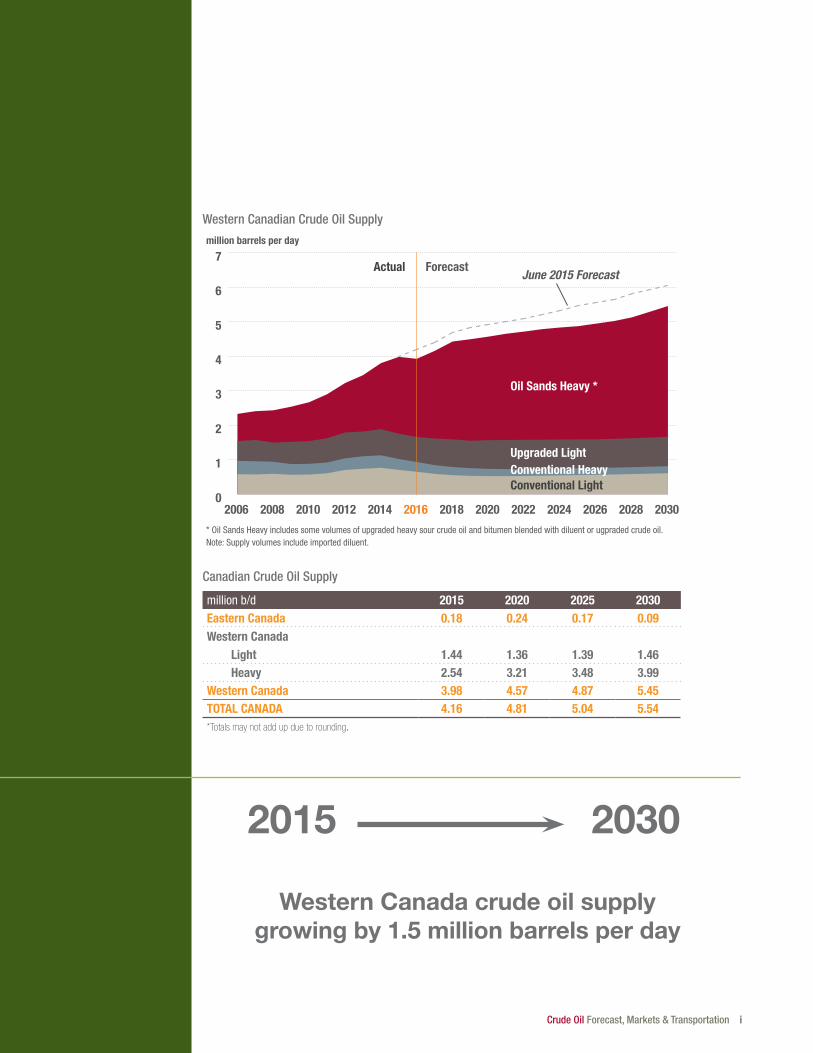
• WesternCanadiansupplygrowsfrom4.0millionb/din2015to5.5millionb/din2030.
• FuturegrowthisdrivenprimarilybytheoilsandsproductioninWesternCanada.
• 2016oilsandsproductionisseverelyimpactedbytheFortMcMurraywildfires.
• Oilsandsprojectscurrentlyunderconstructionareexpectedtocontinuetoproceedasplannedandcontributetoadditionalproductionto2020.
• Oilsandsprojectsfurtheroutintheoutlookfacegreateruncertainty,whichisreflectedbydeferred startup timings.
• Bothconventionalandoilsandsproductionhavenotableupsidepotentialaboveandbeyondthatreflectedinthisoutlook.
• AccesstotidewaterisneededtodiversifymarketsbeyondregionalU.S.markets.
• Canada’sfuturesuccessintheglobaloilmarketreliesontheexistenceoftransportationinfrastructure to provide market access for growing supplies. New extensions to the regulatory process have resulted in delays and uncertainty to in service dates for the proposed pipeline projects.
Disclaimer: ThispublicationwaspreparedbytheCanadianAssociationofPetroleumProducers(CAPP).Whileitisbelievedthattheinformation contained herein is reliable under the conditions and subject to the limitations set out, CAPP does not guarantee the accuracy or completeness of the information. The use of this report or any information contained will be at the user’s sole risk, regardless of any fault or negligence of CAPP.
© Material may be reproduced for public non-commercial use provided due diligence is exercised in ensuring accuracy of information reproduced; CAPP is identified as the source; and reproduction is not represented as an official version of the information reproduced nor as any affiliation.
ON THE COVERTop: Workers at Shell Scotford; photo courtesy of Shell.Bottom Right: Christina Lake in situ project; photo courtesy of Cenovus.
Crude Oil Forecast, Markets & Transportation i
Western Canadian Crude Oil Supply
0
1
2
3
4
5
6
7
2030202820262024202220202018201620142012201020082006
Conventional Heavy
million barrels per day
Actual Forecast
Conventional Light
June 2015 Forecast
Conventional Heavy
Oil Sands Heavy *
Upgraded Light
* Oil Sands Heavy includes some volumes of upgraded heavy sour crude oil and bitumen blended with diluent or ugpraded crude oil.Note: Supply volumes include imported diluent.
Canadian Crude Oil Supply
million b/d 2015 2020 2025 2030Eastern Canada 0.18 0.24 0.17 0.09Western Canada Light 1.44 1.36 1.39 1.46 Heavy 2.54 3.21 3.48 3.99Western Canada 3.98 4.57 4.87 5.45TOTAL CANADA 4.16 4.81 5.04 5.54*Totals may not add up due to rounding.
2015 2030
Western Canada crude oil supply growing by 1.5 million barrels per day
ii CANADIAN ASSOCIATION OF PETROLEUM PRODUCERS
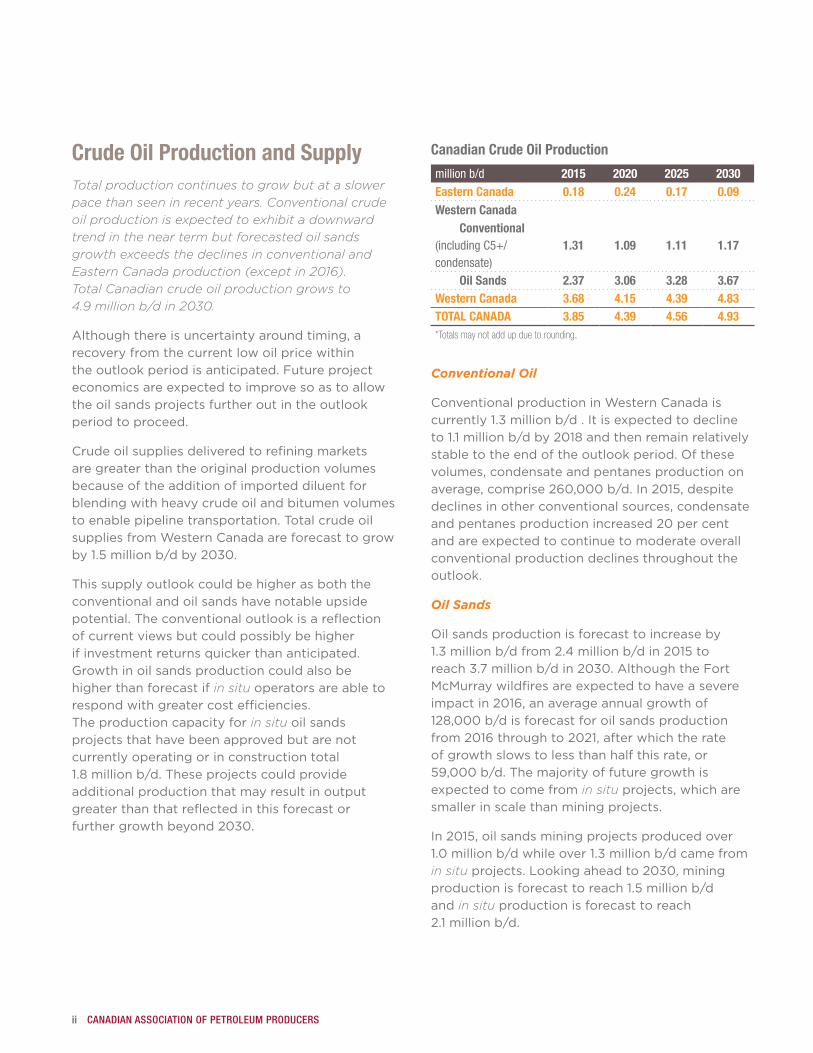
Crude Oil Production and SupplyTotal production continues to grow but at a slower pace than seen in recent years. Conventional crude oil production is expected to exhibit a downward trend in the near term but forecasted oil sands growth exceeds the declines in conventional and Eastern Canada production (except in 2016). Total Canadian crude oil production grows to 4.9 million b/d in 2030.
Although there is uncertainty around timing, a recovery from the current low oil price within the outlook period is anticipated. Future project economics are expected to improve so as to allow the oil sands projects further out in the outlook period to proceed.
Crude oil supplies delivered to refining markets are greater than the original production volumes because of the addition of imported diluent for blending with heavy crude oil and bitumen volumes to enable pipeline transportation. Total crude oil suppliesfromWesternCanadaareforecasttogrowby1.5millionb/dby2030.
This supply outlook could be higher as both the conventional and oil sands have notable upside potential.Theconventionaloutlookisareflectionof current views but could possibly be higher if investment returns quicker than anticipated. Growth in oil sands production could also be higher than forecast if in situ operators are able to respond with greater cost efficiencies. The production capacity for in situ oil sands projects that have been approved but are not currently operating or in construction total 1.8 million b/d.Theseprojectscouldprovideadditional production that may result in output greaterthanthatreflectedinthisforecastorfurthergrowthbeyond2030.
Canadian Crude Oil Production
million b/d 2015 2020 2025 2030Eastern Canada 0.18 0.24 0.17 0.09Western Canada Conventional (including C5+/condensate)
1.31 1.09 1.11 1.17
Oil Sands 2.37 3.06 3.28 3.67Western Canada 3.68 4.15 4.39 4.83TOTAL CANADA 3.85 4.39 4.56 4.93*Totals may not add up due to rounding.
Conventional Oil
ConventionalproductioninWesternCanadaiscurrently1.3millionb/d.Itisexpectedtodeclineto1.1 million b/dby2018andthenremainrelativelystabletotheendoftheoutlookperiod.Ofthesevolumes, condensate and pentanes production on average,comprise260,000b/d.In2015,despitedeclines in other conventional sources, condensate andpentanesproductionincreased20 per centand are expected to continue to moderate overall conventional production declines throughout the outlook.
Oil Sands
Oilsandsproductionisforecasttoincreaseby1.3 million b/dfrom2.4 million b/din2015toreach3.7 million b/din2030.AlthoughtheFortMcMurray wildfires are expected to have a severe impactin2016,anaverageannualgrowthof128,000b/disforecastforoilsandsproductionfrom2016throughto2021,afterwhichtherateof growth slows to less than half this rate, or 59,000 b/d.Themajorityoffuturegrowthisexpected to come from in situ projects, which are smaller in scale than mining projects.
In2015,oilsandsminingprojectsproducedover1.0 million b/dwhileover1.3 million b/dcamefromin situprojects.Lookingaheadto2030,miningproductionisforecasttoreach1.5 million b/dand in situ production is forecast to reach 2.1 million b/d.
Crude Oil Forecast, Markets & Transportation iii
AB, BC, SK[573]
PADD V [2,391]
PADD IV [602]
PADD III - Gulf Coast[8,531]
PADD II[3,561]
PADD I - East Coast [1,121]
[2015 total refinery receipts]
Sources: CAPP, CA Energy Commission, EIA, Statistics Canada
ON [354]
QC+ Atlantic Canada [726]
thousand barrels per day
U.S. - Alaska onlyU.S. (excluding Alaska)Other ImportsA. CanadaW. Canada
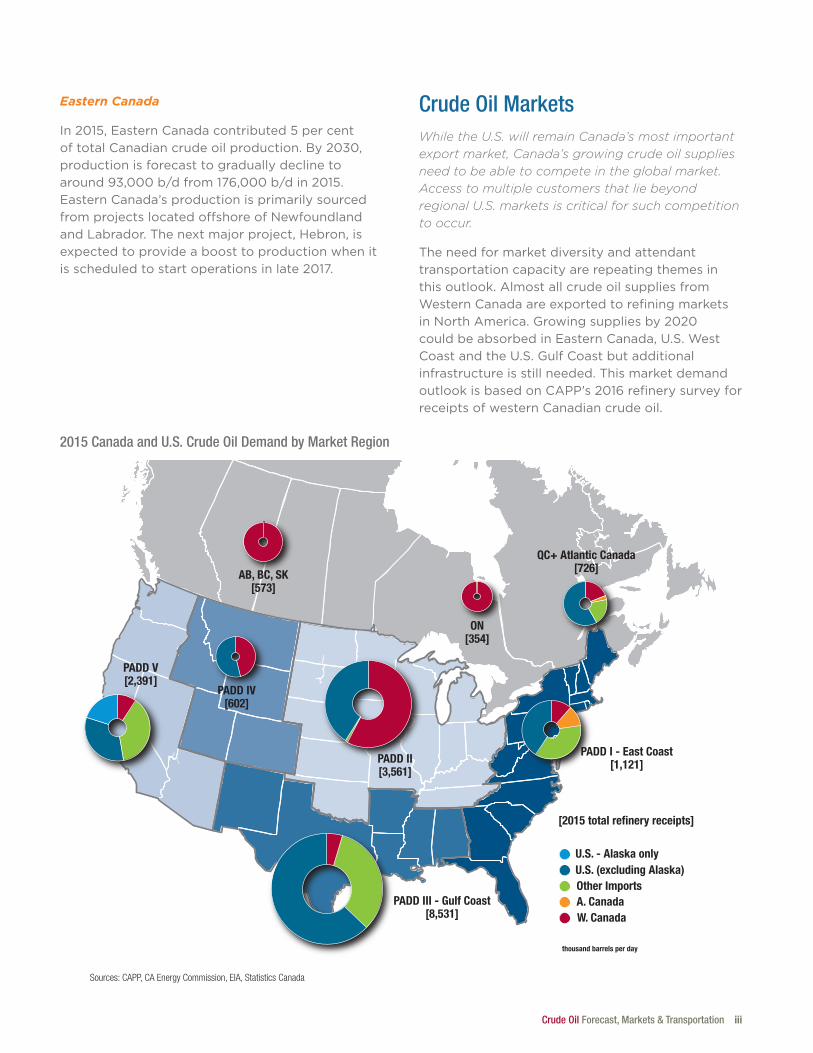
2015 Canada and U.S. Crude Oil Demand by Market Region
Eastern Canada
In2015,EasternCanadacontributed5percentoftotalCanadiancrudeoilproduction.By2030,production is forecast to gradually decline to around93,000b/dfrom176,000b/din2015.EasternCanada’sproductionisprimarilysourcedfrom projects located offshore of Newfoundland and Labrador. The next major project, Hebron, is expected to provide a boost to production when it isscheduledtostartoperationsinlate2017.
Crude Oil Markets While the U.S. will remain Canada’s most important export market, Canada’s growing crude oil supplies need to be able to compete in the global market. Access to multiple customers that lie beyond regional U.S. markets is critical for such competition to occur.
The need for market diversity and attendant transportation capacity are repeating themes in this outlook. Almost all crude oil supplies from WesternCanadaareexportedtorefiningmarketsinNorthAmerica.Growingsuppliesby2020couldbeabsorbedinEasternCanada,U.S.WestCoastandtheU.S.GulfCoastbutadditionalinfrastructure is still needed. This market demand outlookisbasedonCAPP’s2016refinerysurveyforreceipts of western Canadian crude oil.
iv CANADIAN ASSOCIATION OF PETROLEUM PRODUCERS
Growing supplies of western Canadian production will need to compete to displace other foreign importstothesemarkets.Inordertoobtainmaximum value for these resources, access to tidewater is essential to reach international markets andtoreducedependenceontheU.S.market.
Eastern Canada
In2015,refineriesinQuébecandAtlanticCanadaimported566,000 b/dofforeign-sourcedcrudeoil to fulfull their feedstock needs. These refineries typicallyprocesslightcrudeoil.Sincelate2015,infrastructure has been in place, with the startup ofthereversedEnbridgeLine9pipeline,toenablethe delivery of western Canadan crude oil all the waytoMontréal.RefineriesinOntarioalreadysource their crude oil feedstock needs mainly from WesternCanada.
United States
RefineriesintheU.S.GulfCoastprocessed8.5 million b/dofcrudeoilin2015,including2.2 million b/dofforeignheavyoilimports.Canadian producers are displacing more of these imported volumes and could supply at least 608,000 b/dtothismarketby2020.
TheU.S.MidwestisexpectedtoremainCanada’slargestexportmarket.In2015,almost1.9 million b/dofwesternCanadiancrudeoilwasdelivered to this market. According to CAPP’s 2016RefinerSurvey,almost2.2 million b/dcouldbeabsorbedbythisregionin2020.ReceiptsintoPADD IIcouldbedeliveredtorefineriesorinto storage and then distributed later to other locations,includingrefineriesinPADDIII.
RefineriesinWashingtonandCalifornianeedtoreplace their declining traditional sources of supply from Alaska. These refineries are expected to increase their demand for western Canadian crude oilfrom225,000 b/dcurrentlyto369,000 b/dby2020.
Portland
Montréal
St.Paul
St. James
Slaughter
Freeport
Edmonton
AnacortesBurnaby
BP
Hardisty
WoodRiver
Cromer
Clearbrook
Kitimat
Mus
tang
Lima
Superior
Platte
Express
Flanagan
Mid
Val
ley
Pegasus
Minnesota
Crane
Québec CitySaint John
Port Arthur
Sarnia
Westover
Warren
Longhorn
Basi
n
Sandpiper
Line 6, 14
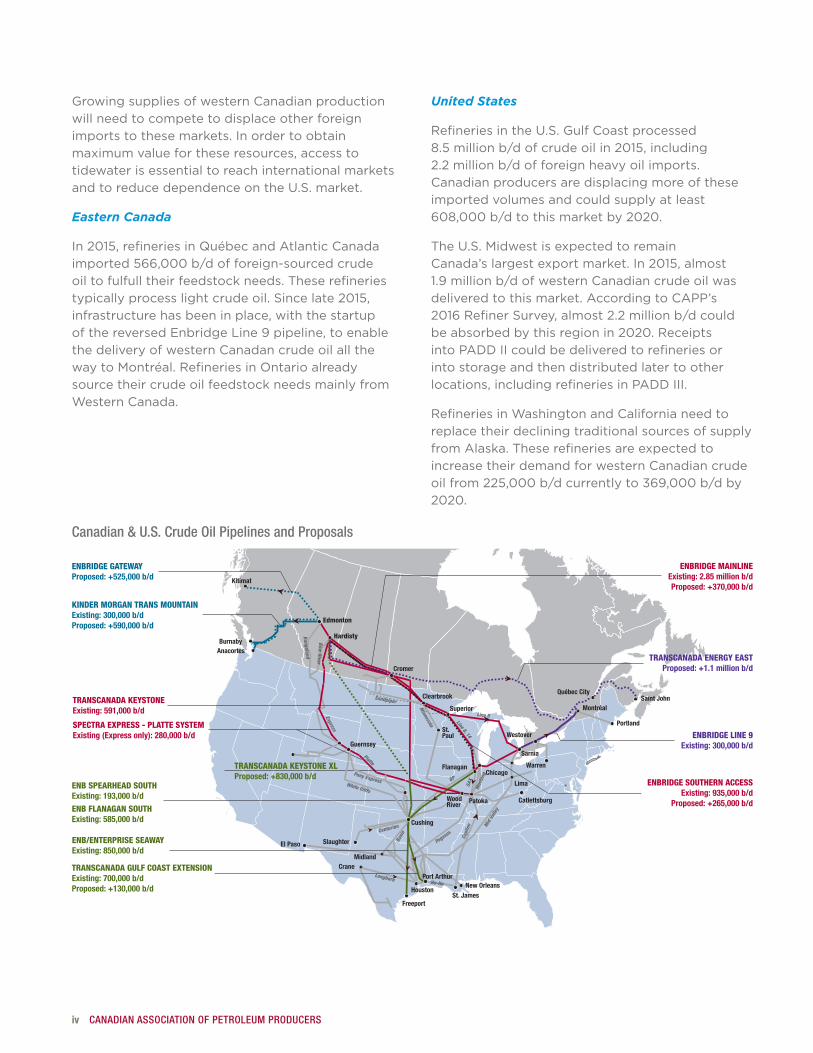
ENBRIDGE GATEWAYProposed: +525,000 b/d
ENB/ENTERPRISE SEAWAY Existing: 850,000 b/d
White Cliffs
Pony Express
TRANSCANADA GULF COAST EXTENSIONExisting: 700,000 b/d Proposed: +130,000 b/d
Patoka
New Orleans
Catlettsburg
Midland
SAX
Ho-Ho
Capl
ine
Rangeland
Bow River
Chicago
KINDER MORGAN TRANS MOUNTAINExisting: 300,000 b/d Proposed: +590,000 b/d
ENBRIDGE LINE 9Existing: 300,000 b/d
TRANSCANADA ENERGY EASTProposed: +1.1 million b/d
ENBRIDGE SOUTHERN ACCESSExisting: 935,000 b/d
Proposed: +265,000 b/d
TRANSCANADA KEYSTONEExisting: 591,000 b/d
SPECTRA EXPRESS - PLATTE SYSTEMExisting (Express only): 280,000 b/d
TRANSCANADA KEYSTONE XLProposed: +830,000 b/d
ENB SPEARHEAD SOUTH Existing: 193,000 b/d
ENB FLANAGAN SOUTH Existing: 585,000 b/d
CenturionCushing
Line 5
El Paso
Houston
Guernsey
ENBRIDGE MAINLINEExisting: 2.85 million b/dProposed: +370,000 b/d
Canadian & U.S. Crude Oil Pipelines and Proposals
Crude Oil Forecast, Markets & Transportation v
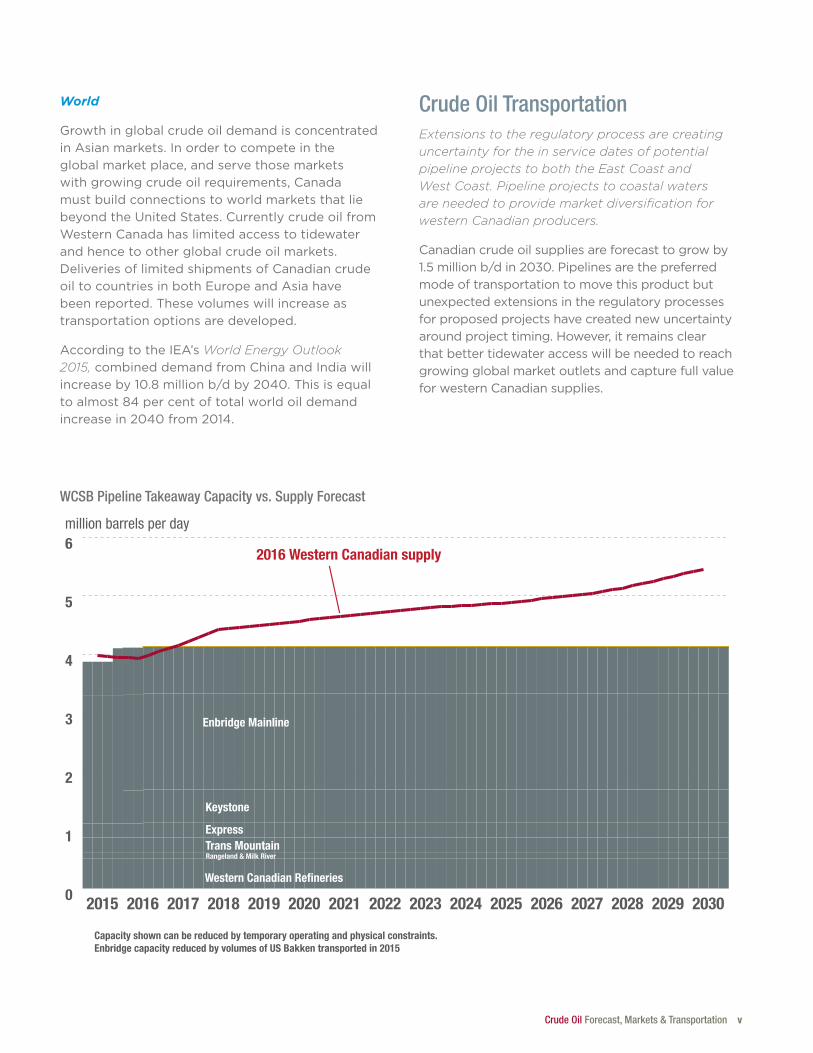
WCSB Pipeline Takeaway Capacity vs. Supply Forecast
0
1
2
3
4
5
6
2030202920282027202620252024202320222021202020192018201720162015
million barrels per day
Western Canadian Refineries
ExpressTrans Mountain
Enbridge Mainline
Rangeland & Milk River
2016 Western Canadian supply
Capacity shown can be reduced by temporary operating and physical constraints.Enbridge capacity reduced by volumes of US Bakken transported in 2015
Keystone
World
Growth in global crude oil demand is concentrated inAsianmarkets.Inordertocompeteintheglobal market place, and serve those markets with growing crude oil requirements, Canada must build connections to world markets that lie beyondtheUnitedStates.CurrentlycrudeoilfromWesternCanadahaslimitedaccesstotidewaterand hence to other global crude oil markets. Deliveries of limited shipments of Canadian crude oiltocountriesinbothEuropeandAsiahavebeen reported. These volumes will increase as transportation options are developed.
AccordingtotheIEA’sWorld Energy Outlook 2015,combineddemandfromChinaandIndiawillincreaseby10.8 million b/dby2040.Thisisequaltoalmost84 per centoftotalworldoildemandincreasein2040from2014.
Crude Oil TransportationExtensions to the regulatory process are creating uncertainty for the in service dates of potential pipeline projects to both the East Coast and West Coast. Pipeline projects to coastal waters are needed to provide market diversification for western Canadian producers.
Canadian crude oil supplies are forecast to grow by 1.5 millionb/din2030.Pipelinesarethepreferredmode of transportation to move this product but unexpected extensions in the regulatory processes for proposed projects have created new uncertainty around project timing. However, it remains clear that better tidewater access will be needed to reach growing global market outlets and capture full value for western Canadian supplies.
vi CANADIAN ASSOCIATION OF PETROLEUM PRODUCERS
TABLE OF CONTENTSEXECUTIVE SUMMARY iLIST OF FIGURES AND TABLES vii
1 INTRODUCTION 11.1 Production & Supply Forecast Methodology 1
1.2 Market Outlook Methodology 2
1.3 Transportation Outlook Methodology 2
2 CRUDE OIL PRODUCTION & SUPPLY FORECAST 32.1 Canadian Production 3
2.2 Eastern Canada Production 4
2.3 Western Canada Production 5
2.4 Western Canada Supply 9
2.5 Crude Oil Production & Supply Summary 10
3 CRUDE OIL MARKETS 113.1 Canada 12
3.2 United States 14
3.3 International 21
3.4 Markets Summary 21
4 TRANSPORTATION 224.1 Existing Crude Oil Pipelines Exiting Western Canada 23
4.2 Oil Pipelines to the U.S. Midwest 25
4.3 Oil Pipelines to the U.S. Gulf Coast 26
4.4 Oil Pipelines to the West Coast of Canada 27
4.5 Oil Pipelines to Eastern Canada 28
4.6 Diluent Pipelines 29
4.7 Crude Oil by Rail 30
4.8 Transportation Summary 32
GLOSSARY 33
APPENDIX A.1: List of Approved Oil Sands In Situ Projects 35
APPENDIX A.2: List of Approved Oil Sands Mining Projects 35
APPENDIX B.1: CAPP Canadian Crude Oil Production Forecast 2016 – 2030 37
APPENDIX B.2: CAPP Western Canadian Crude Oil Supply Forecast 2016 – 2030 39
APPENDIX C: Acronyms, Abbreviations, Units and Conversion Factors 40
APPENDIX D: Crude Oil Pipelines and Refineries 41
Crude Oil Forecast, Markets & Transportation vii
LIST OF FIGURES AND TABLESFiguresFigure 2.1 Canadian Oil Sands & Conventional Production 4Figure 2.2 Western Canada Crude Oil Production 5Figure 2.3 Western Canada Conventional Production 6Figure 2.4 Oil Sands Regions 7Figure 2.5 Western Canada Oil Sands Production 8Figure 2.6 Western Canada Oil Sands & Conventional Supply 9
Figure 3.1 Canada and U.S.: 2015 Crude Oil Receipts by Source 11Figure 3.2 Western Canadian Crude Oil Demand: Actual 2015 and 2020 12Figure 3.3 Western Canada: Crude Oil Receipts from Western Canada 13Figure 3.4 Eastern Canada: Crude Oil Receipts from Western Canada 13Figure 3.5 2015 PADD I: Foreign Sourced Supply by Type and Domestic Crude Oil 14Figure 3.6 2015 PADD II: Foreign Sourced Supply by Type and Domestic Crude Oil 16Figure 3.7 PADD II: Crude Oil Receipts from Western Canada 16Figure 3.8 2015 PADD III: Foreign Sourced Supply by Type and Domestic Crude Oil 17Figure 3.9 2015 PADD IV: Foreign Sourced Supply by Type and Domestic Crude Oil 18Figure 3.10 PADD IV: Crude Oil Receipts from Western Canada 18Figure 3.11 2015 PADD V: Foreign Sourced Supply by Type and Domestic Crude Oil 19Figure 3.12 PADD V (WA & CA): Crude Oil Receipts from Western Canada 19Figure 3.13 Global Net Oil Imports: 2014 to 2040 21
Figure 4.1 Existing and Proposed Canadian & U.S. Crude Oil Pipelines 22Figure 4.2 Canadian Fuel Oil and Crude Petroleum Moved by Rail: Car Loadings & Tonnage 30Figure 4.3 Rail Loading Terminals in Western Canada 31Figure 4.4 Existing WCSB Takeaway Capacity vs. Supply Forecast 32
TablesTable 2.1 Canadian Crude Oil Production 3Table 2.2 Atlantic Canada Projects and Recent Discoveries 5Table 2.3 Western Canada Crude Oil Production 6Table 2.4 Oil Sands Production 7Table 2.5 Western Canada Crude Oil Supply 10
Table 3.1 Rail Offloading Terminals in Eastern Canada and PADD I 15Table 3.2 Proposed Refinery Upgrades in PADD II 17Table 3.3 Recent and Proposed Refinery Upgrades in PADD III 18Table 3.4 Proposed Refinery Upgrade Projects in PADD IV 18Table 3.5 Rail Offloading Terminals in Western Canada & PADD V 20Table 3.6 Total Oil Demand in Major Asian Countries 21
Table 4.1 Major Existing & Proposed Crude Oil Pipelines Exiting the WCSB 23Table 4.2 Enbridge Mainline System: Upstream Superior 24Table 4.3 Summary of Crude Oil Pipelines to the U.S. Midwest 26Table 4.4 Summary of Crude Oil Pipelines to the U.S. Gulf Coast 27Table 4.5 Summary of Crude Oil Pipelines to the West Coast of Canada 28Table 4.6 Summary of Crude Oil Pipelines to Eastern Canada 29Table 4.7 Summary of Diluent Pipelines 30
1 CANADIAN ASSOCIATION OF PETROLEUM PRODUCERS
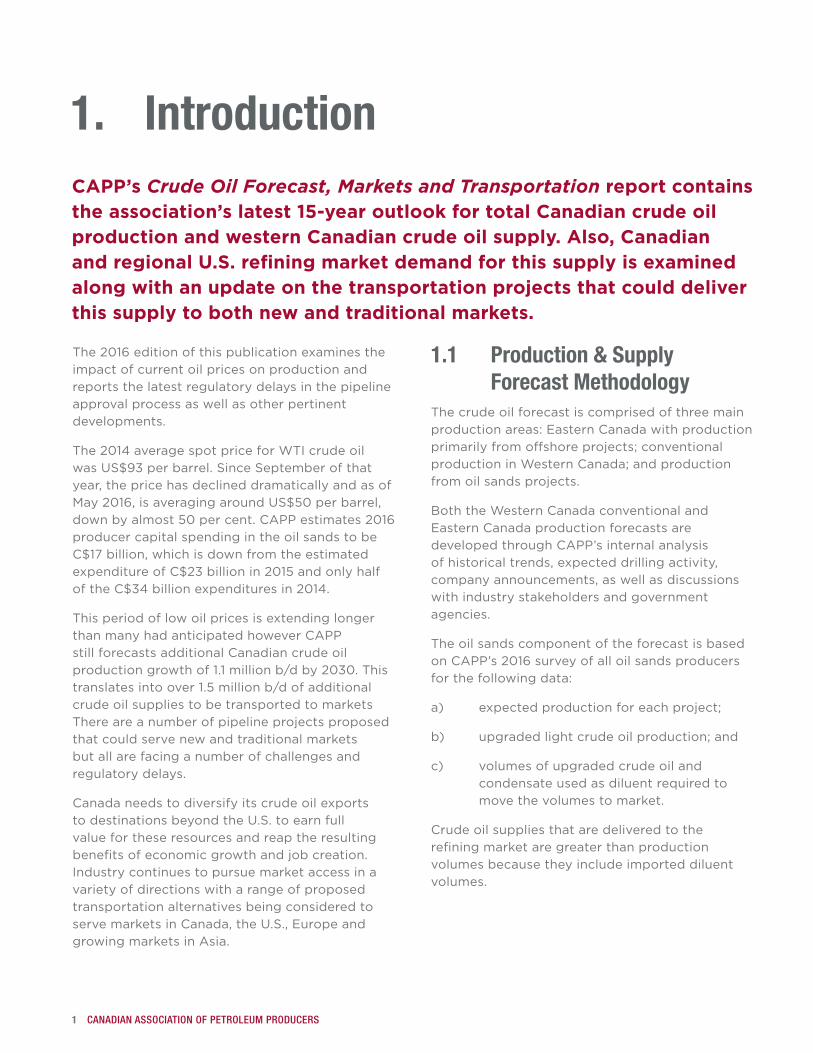
IntroductionCAPP’s Crude Oil Forecast, Markets and Transportation report contains the association’s latest 15-year outlook for total Canadian crude oil production and western Canadian crude oil supply. Also, Canadian and regional U.S. refining market demand for this supply is examined along with an update on the transportation projects that could deliver this supply to both new and traditional markets.
1.
The2016editionofthispublicationexaminestheimpact of current oil prices on production and reports the latest regulatory delays in the pipeline approval process as well as other pertinent developments.
The2014averagespotpriceforWTIcrudeoilwasUS$93 per barrel.SinceSeptemberofthatyear, the price has declined dramatically and as of May2016,isaveragingaroundUS$50perbarrel,downbyalmost50 per cent.CAPPestimates2016producer capital spending in the oil sands to be C$17billion,whichisdownfromtheestimatedexpenditureofC$23billionin2015andonlyhalfoftheC$34billionexpendituresin2014.
This period of low oil prices is extending longer than many had anticipated however CAPP still forecasts additional Canadian crude oil productiongrowthof1.1 million b/dby2030.Thistranslatesintoover1.5 million b/dofadditionalcrude oil supplies to be transported to markets There are a number of pipeline projects proposed that could serve new and traditional markets but all are facing a number of challenges and regulatory delays.
Canada needs to diversify its crude oil exports todestinationsbeyondtheU.S.toearnfullvalue for these resources and reap the resulting benefits of economic growth and job creation. Industrycontinuestopursuemarketaccessinavariety of directions with a range of proposed transportation alternatives being considered to servemarketsinCanada,theU.S.,Europeandgrowing markets in Asia.
1.1 Production & Supply Forecast Methodology
The crude oil forecast is comprised of three main productionareas:EasternCanadawithproductionprimarily from offshore projects; conventional productioninWesternCanada;andproductionfrom oil sands projects.
BoththeWesternCanadaconventionalandEasternCanadaproductionforecastsaredeveloped through CAPP’s internal analysis of historical trends, expected drilling activity, company announcements, as well as discussions with industry stakeholders and government agencies.
The oil sands component of the forecast is based onCAPP’s2016surveyofalloilsandsproducersfor the following data:
a) expected production for each project;
b) upgraded light crude oil production; and
c) volumes of upgraded crude oil and condensate used as diluent required to move the volumes to market.
Crude oil supplies that are delivered to the refining market are greater than production volumes because they include imported diluent volumes.
Crude Oil Forecast, Markets & Transportation 2
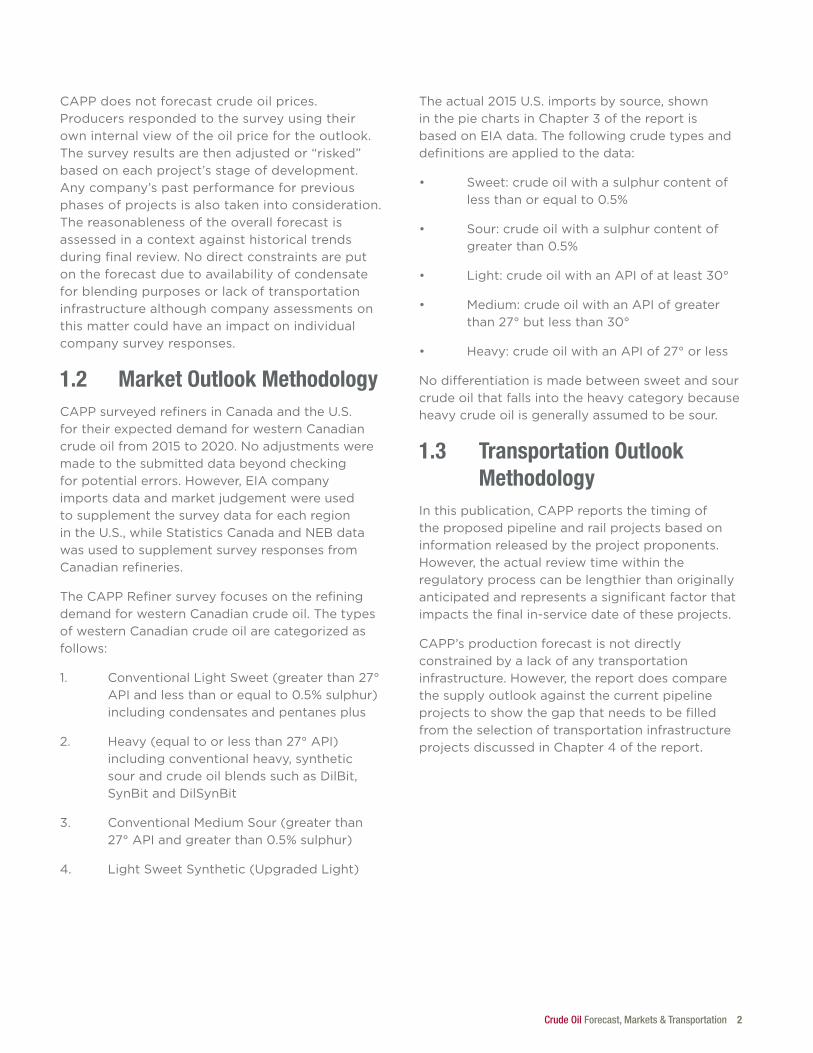
CAPP does not forecast crude oil prices. Producers responded to the survey using their own internal view of the oil price for the outlook. The survey results are then adjusted or “risked” based on each project’s stage of development. Any company’s past performance for previous phases of projects is also taken into consideration. The reasonableness of the overall forecast is assessed in a context against historical trends during final review. No direct constraints are put on the forecast due to availability of condensate for blending purposes or lack of transportation infrastructure although company assessments on this matter could have an impact on individual company survey responses.
1.2 Market Outlook Methodology
CAPPsurveyedrefinersinCanadaandtheU.S.for their expected demand for western Canadian crudeoilfrom2015to2020.Noadjustmentsweremade to the submitted data beyond checking forpotentialerrors.However,EIAcompanyimports data and market judgement were used to supplement the survey data for each region intheU.S.,whileStatisticsCanadaandNEBdatawas used to supplement survey responses from Canadian refineries.
TheCAPPRefinersurveyfocusesontherefiningdemand for western Canadian crude oil. The types of western Canadian crude oil are categorized as follows:
1. ConventionalLightSweet(greaterthan27°APIandlessthanorequalto0.5%sulphur)including condensates and pentanes plus
2. Heavy(equaltoorlessthan27°API)including conventional heavy, synthetic sourandcrudeoilblendssuchasDilBit,SynBitandDilSynBit
3. ConventionalMediumSour(greaterthan27°APIandgreaterthan0.5%sulphur)
4. LightSweetSynthetic(UpgradedLight)
Theactual2015U.S.importsbysource,showninthepiechartsinChapter3ofthereportisbasedonEIAdata.Thefollowingcrudetypesanddefinitions are applied to the data:
• Sweet:crudeoilwithasulphurcontentoflessthanorequalto0.5%
• Sour:crudeoilwithasulphurcontentofgreaterthan0.5%
• Light:crudeoilwithanAPIofatleast30°
• Medium:crudeoilwithanAPIofgreaterthan27°butlessthan30°
• Heavy:crudeoilwithanAPIof27°orless
No differentiation is made between sweet and sour crude oil that falls into the heavy category because heavy crude oil is generally assumed to be sour.
1.3 Transportation Outlook Methodology
Inthispublication,CAPPreportsthetimingofthe proposed pipeline and rail projects based on information released by the project proponents. However, the actual review time within the regulatory process can be lengthier than originally anticipated and represents a significant factor that impacts the final in-service date of these projects.
CAPP’s production forecast is not directly constrained by a lack of any transportation infrastructure. However, the report does compare the supply outlook against the current pipeline projects to show the gap that needs to be filled from the selection of transportation infrastructure projectsdiscussedinChapter4ofthereport.
3 CANADIAN ASSOCIATION OF PETROLEUM PRODUCERS
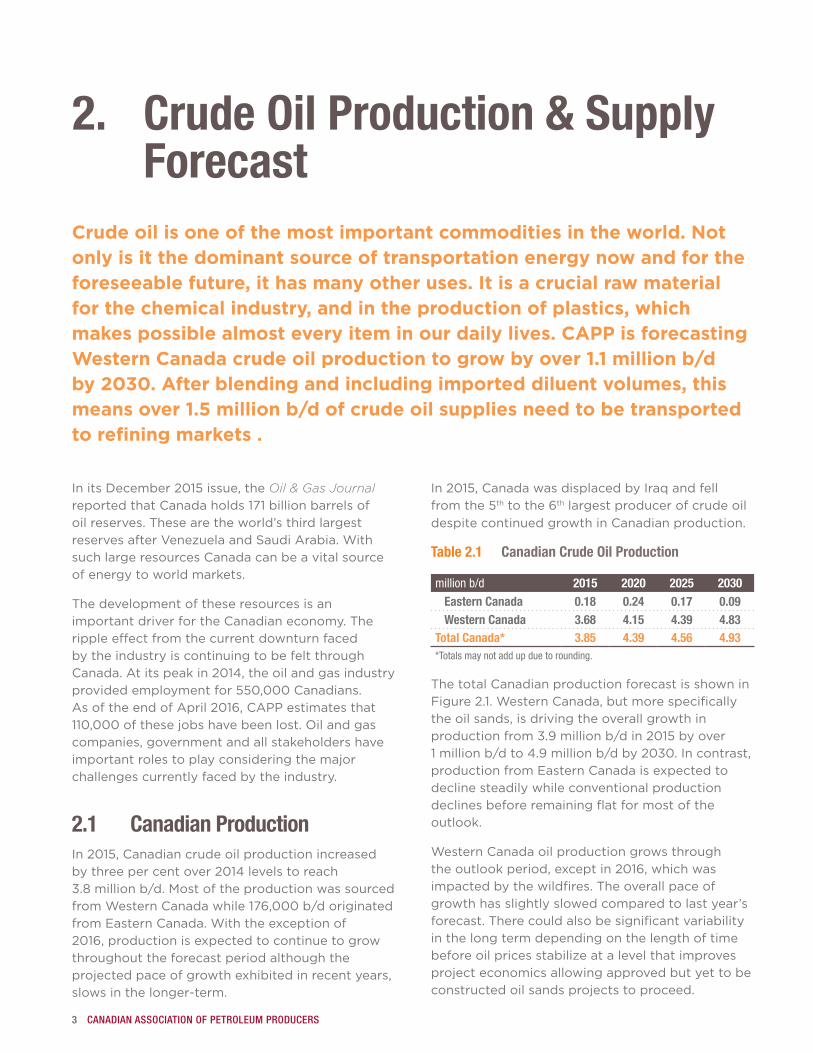
InitsDecember2015issue,theOil & Gas Journal reportedthatCanadaholds171billionbarrelsofoil reserves. These are the world’s third largest reservesafterVenezuelaandSaudiArabia.Withsuch large resources Canada can be a vital source of energy to world markets.
The development of these resources is an important driver for the Canadian economy. The ripple effect from the current downturn faced by the industry is continuing to be felt through Canada.Atitspeakin2014,theoilandgasindustryprovidedemploymentfor550,000Canadians.AsoftheendofApril2016,CAPPestimatesthat110,000ofthesejobshavebeenlost.Oilandgascompanies, government and all stakeholders have important roles to play considering the major challenges currently faced by the industry.
2.1 Canadian ProductionIn2015,Canadiancrudeoilproductionincreasedbythree per centover2014levelstoreach3.8 million b/d.MostoftheproductionwassourcedfromWesternCanadawhile176,000 b/doriginatedfromEasternCanada.Withtheexceptionof2016,productionisexpectedtocontinuetogrowthroughout the forecast period although the projected pace of growth exhibited in recent years, slows in the longer-term.
In2015,CanadawasdisplacedbyIraqandfellfromthe5thtothe6th largest producer of crude oil despite continued growth in Canadian production.
Table 2.1 Canadian Crude Oil Production
million b/d 2015 2020 2025 2030 Eastern Canada 0.18 0.24 0.17 0.09 Western Canada 3.68 4.15 4.39 4.83Total Canada* 3.85 4.39 4.56 4.93*Totals may not add up due to rounding.
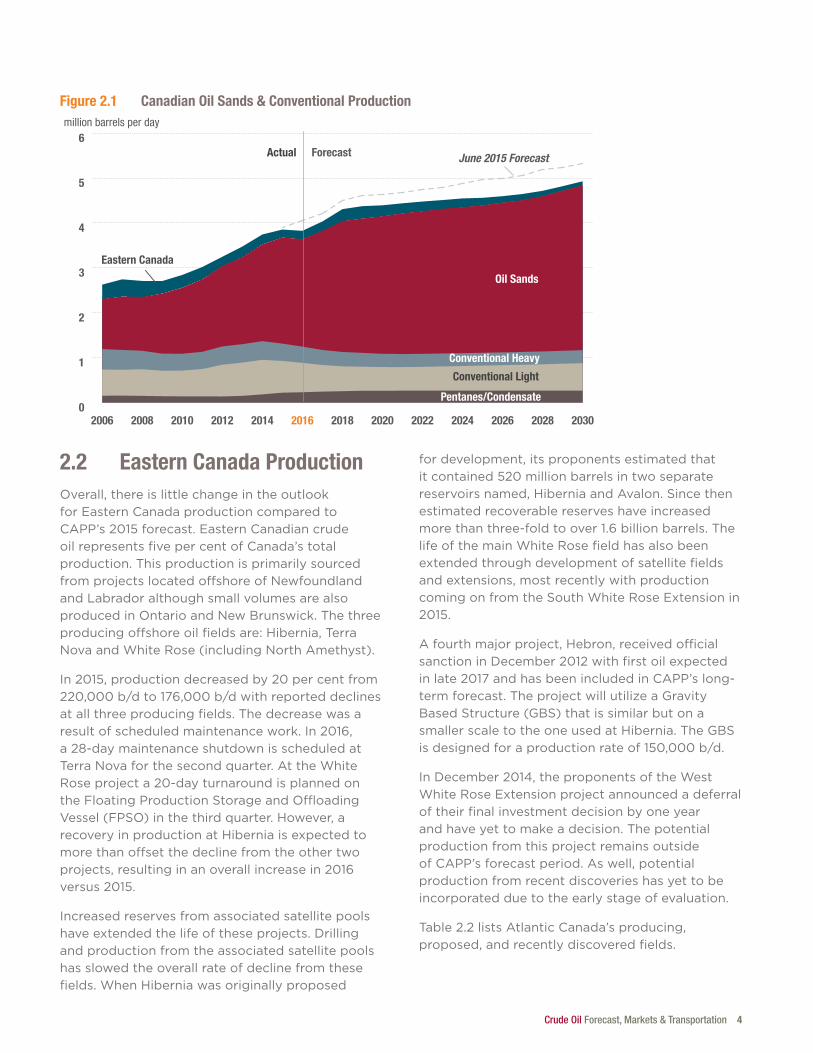
The total Canadian production forecast is shown in Figure 2.1.WesternCanada,butmorespecificallythe oil sands, is driving the overall growth in productionfrom3.9 million b/din2015byover1 million b/dto4.9 million b/dby2030.Incontrast,productionfromEasternCanadaisexpectedtodecline steadily while conventional production declinesbeforeremainingflatformostoftheoutlook.
WesternCanadaoilproductiongrowsthroughtheoutlookperiod,exceptin2016,whichwasimpacted by the wildfires. The overall pace of growth has slightly slowed compared to last year’s forecast. There could also be significant variability in the long term depending on the length of time before oil prices stabilize at a level that improves project economics allowing approved but yet to be constructed oil sands projects to proceed.
Crude Oil Production & Supply Forecast
2.
Crude oil is one of the most important commodities in the world. Not only is it the dominant source of transportation energy now and for the foreseeable future, it has many other uses. It is a crucial raw material for the chemical industry, and in the production of plastics, which makes possible almost every item in our daily lives. CAPP is forecasting Western Canada crude oil production to grow by over 1.1 million b/d by 2030. After blending and including imported diluent volumes, this means over 1.5 million b/d of crude oil supplies need to be transported to refining markets .
Crude Oil Forecast, Markets & Transportation 4
2.2 Eastern Canada Production
Overall,thereislittlechangeintheoutlookforEasternCanadaproductioncomparedtoCAPP’s2015forecast.EasternCanadiancrudeoilrepresentsfive per centofCanada’stotalproduction. This production is primarily sourced from projects located offshore of Newfoundland and Labrador although small volumes are also producedinOntarioandNewBrunswick.Thethreeproducing offshore oil fields are: Hibernia, Terra NovaandWhiteRose(includingNorthAmethyst).
In2015,productiondecreasedby20 per centfrom220,000 b/dto176,000 b/dwithreporteddeclinesat all three producing fields. The decrease was a resultofscheduledmaintenancework.In2016,a28-daymaintenanceshutdownisscheduledatTerraNovaforthesecondquarter.AttheWhiteRoseprojecta20-dayturnaroundisplannedontheFloatingProductionStorageandOffloadingVessel(FPSO)inthethirdquarter.However,arecovery in production at Hibernia is expected to more than offset the decline from the other two projects,resultinginanoverallincreasein2016versus2015.
Increasedreservesfromassociatedsatellitepoolshave extended the life of these projects. Drilling and production from the associated satellite pools has slowed the overall rate of decline from these fields.WhenHiberniawasoriginallyproposed
for development, its proponents estimated that itcontained520millionbarrelsintwoseparatereservoirsnamed,HiberniaandAvalon.Sincethenestimated recoverable reserves have increased morethanthree-foldtoover1.6billionbarrels.ThelifeofthemainWhiteRosefieldhasalsobeenextended through development of satellite fields and extensions, most recently with production comingonfromtheSouthWhiteRoseExtensionin2015.
A fourth major project, Hebron, received official sanctioninDecember2012withfirstoilexpectedinlate2017andhasbeenincludedinCAPP’slong-term forecast. The project will utilize a Gravity BasedStructure(GBS)thatissimilarbutonasmallerscaletotheoneusedatHibernia.TheGBSisdesignedforaproductionrateof150,000 b/d.
InDecember2014,theproponentsoftheWestWhiteRoseExtensionprojectannouncedadeferralof their final investment decision by one year and have yet to make a decision. The potential production from this project remains outside of CAPP’s forecast period. As well, potential production from recent discoveries has yet to be incorporated due to the early stage of evaluation.
Table 2.2listsAtlanticCanada’sproducing,proposed, and recently discovered fields.
0
1
2
3
4
5
6
2030202820262024202220202018201620142012201020082006
Pentanes/Condensate
million barrels per day
Actual Forecast
Eastern Canada
Conventional Light
June 2015 Forecast
Conventional Heavy
Oil Sands
Figure 2.1 Canadian Oil Sands & Conventional Production
5 CANADIAN ASSOCIATION OF PETROLEUM PRODUCERS
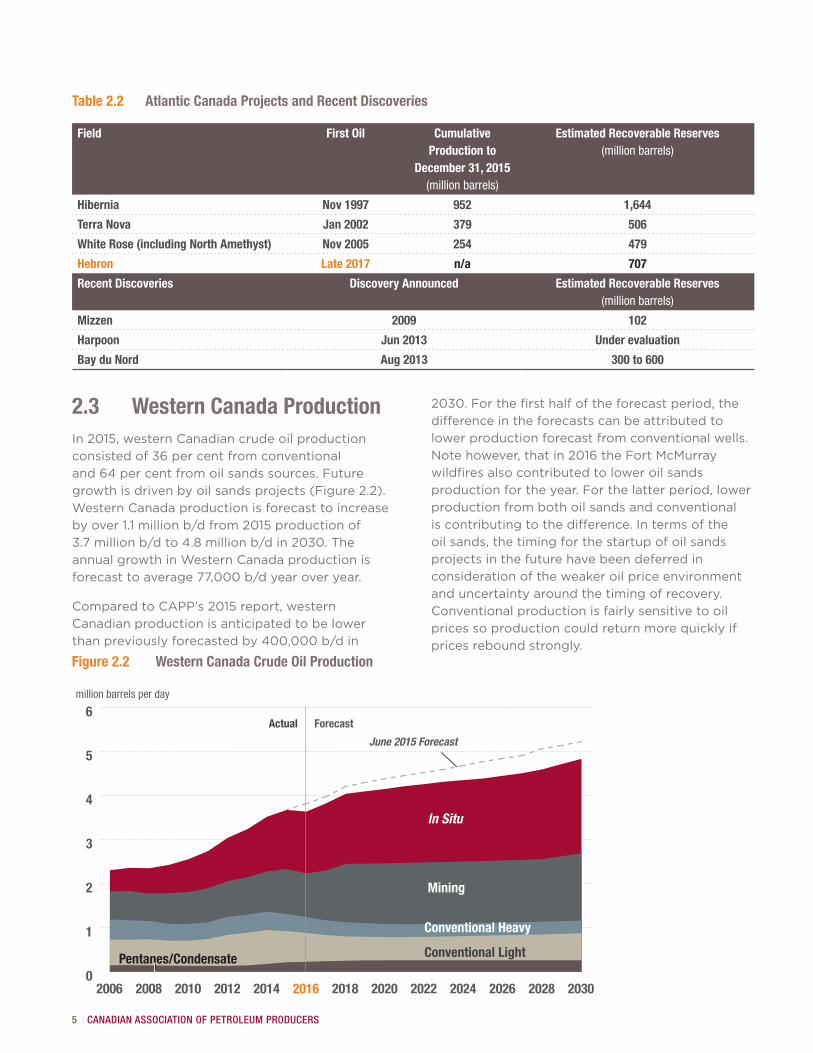
2.3 Western Canada ProductionIn2015,westernCanadiancrudeoilproductionconsistedof36 per centfromconventionaland64 per centfromoilsandssources.Futuregrowthisdrivenbyoilsandsprojects(Figure 2.2).WesternCanadaproductionisforecasttoincreasebyover1.1 million b/dfrom2015productionof3.7 million b/dto4.8 million b/din2030.TheannualgrowthinWesternCanadaproductionisforecasttoaverage77,000 b/dyearoveryear.
ComparedtoCAPP’s2015report,westernCanadian production is anticipated to be lower thanpreviouslyforecastedby400,000 b/din
2030.Forthefirsthalfoftheforecastperiod,thedifference in the forecasts can be attributed to lower production forecast from conventional wells. Notehowever,thatin2016theFortMcMurraywildfires also contributed to lower oil sands production for the year. For the latter period, lower production from both oil sands and conventional iscontributingtothedifference.Intermsoftheoil sands, the timing for the startup of oil sands projects in the future have been deferred in consideration of the weaker oil price environment and uncertainty around the timing of recovery. Conventional production is fairly sensitive to oil prices so production could return more quickly if prices rebound strongly.
Table 2.2 Atlantic Canada Projects and Recent Discoveries
Field First Oil Cumulative Production to
December 31, 2015(million barrels)
Estimated Recoverable Reserves (million barrels)
Hibernia Nov 1997 952 1,644
Terra Nova Jan 2002 379 506
White Rose (including North Amethyst) Nov 2005 254 479
Hebron Late 2017 n/a 707
Recent Discoveries Discovery Announced Estimated Recoverable Reserves(million barrels)
Mizzen 2009 102
Harpoon Jun 2013 Under evaluation
Bay du Nord Aug 2013 300 to 600
Figure 2.2 Western Canada Crude Oil Production
0
1
2
3
4
5
6
2030202820262024202220202018201620142012201020082006
Pentanes/Condensate
million barrels per day
Actual Forecast
Conventional Light
June 2015 Forecast
Conventional Heavy
In Situ
Mining
Crude Oil Forecast, Markets & Transportation 6
Table 2.3 Western Canada Crude Oil Production
million b/d 2015 2020 2025 2030 Conventional (including pentanes/
condensate)
1.31 1.09 1.11 1.17
Oil sands (bitumen & upgraded)
2.37 3.06 3.28 3.67
Total Western Canada 3.68 4.15 4.39 4.83
*Totals may not add up due to rounding.
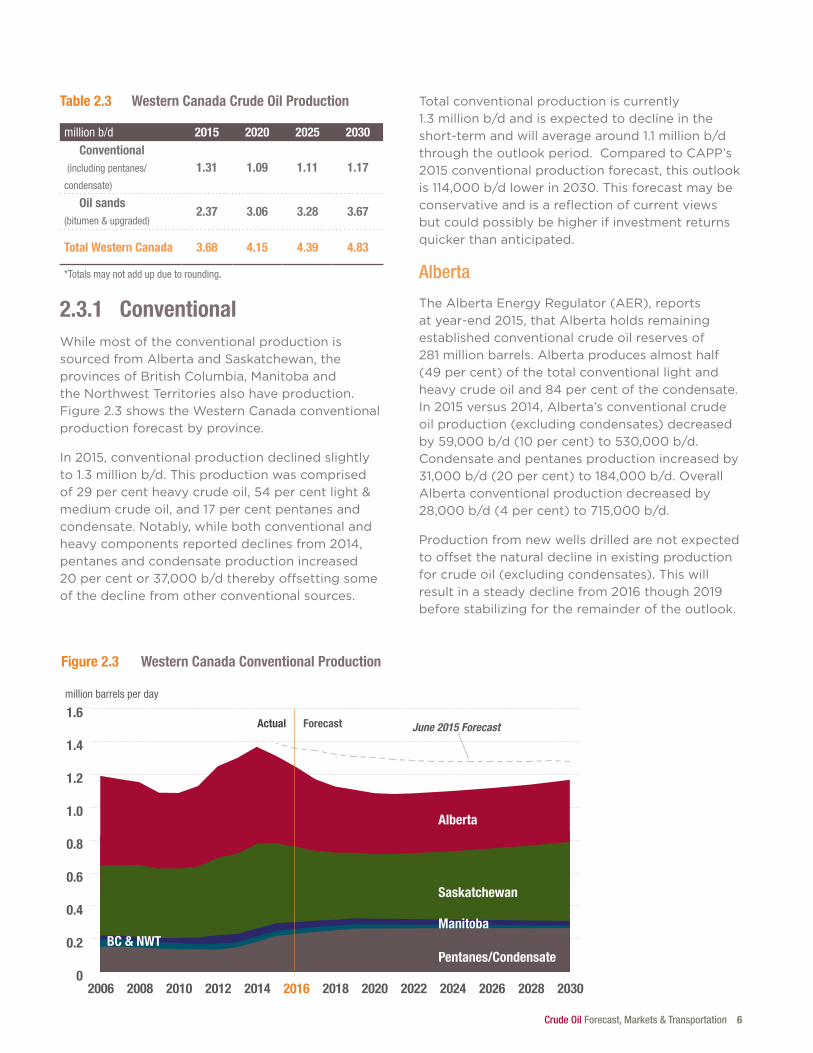
2.3.1 ConventionalWhilemostoftheconventionalproductionissourcedfromAlbertaandSaskatchewan,theprovincesofBritishColumbia,Manitobaandthe Northwest Territories also have production. Figure 2.3showstheWesternCanadaconventionalproduction forecast by province.
In2015,conventionalproductiondeclinedslightlyto1.3 million b/d.Thisproductionwascomprisedof29 per centheavycrudeoil,54 per centlight&mediumcrudeoil,and17 per centpentanesandcondensate. Notably, while both conventional and heavycomponentsreporteddeclinesfrom2014,pentanes and condensate production increased 20 per centor37,000 b/dtherebyoffsettingsomeof the decline from other conventional sources.
Total conventional production is currently 1.3 millionb/dandisexpectedtodeclineintheshort-termandwillaveragearound1.1 million b/dthrough the outlook period. Compared to CAPP’s 2015conventionalproductionforecast,thisoutlookis114,000 b/dlowerin2030.Thisforecastmaybeconservativeandisareflectionofcurrentviewsbut could possibly be higher if investment returns quicker than anticipated.
Alberta
TheAlbertaEnergyRegulator(AER),reportsatyear-end2015,thatAlbertaholdsremainingestablished conventional crude oil reserves of 281millionbarrels.Albertaproducesalmosthalf(49 per cent)ofthetotalconventionallightandheavycrudeoiland84 per centofthecondensate.In2015versus2014,Alberta’sconventionalcrudeoil production (excluding condensates) decreased by59,000 b/d(10 per cent)to530,000 b/d.Condensate and pentanes production increased by 31,000 b/d(20 per cent)to184,000 b/d.OverallAlberta conventional production decreased by 28,000 b/d(4 per cent)to715,000 b/d.
Production from new wells drilled are not expected to offset the natural decline in existing production for crude oil (excluding condensates). This will resultinasteadydeclinefrom2016though2019before stabilizing for the remainder of the outlook.
Figure 2.3 Western Canada Conventional Production
0
0.2
0.4
0.6
0.8
1.0
1.2
1.4
1.6
2030202820262024202220202018201620142012201020082006
Pentanes/Condensate
million barrels per day
Actual Forecast
Saskatchewan
ManitobaBC & NWT
Alberta
June 2015 Forecast
7 CANADIAN ASSOCIATION OF PETROLEUM PRODUCERS
Saskatchewan
In2015,Saskatchewanaccountedfor37 per centof total conventional production. The province produced486,000 b/dofcrudeoilcomprisedofalmost equal parts light and heavy conventional and negligible volumes of condensate. This was27,000 b/dlessthanproductionin2014(six per centdecline).Onaverage,Saskatchewanproductionisexpectedtocontribute428,000 b/dduring the outlook.
Manitoba, British Columbia, NWT
Manitobaaccountsforthree per centoftotalconventionalproductionfromWesternCanada.Currentproductionof46,000 b/disexpectedtodeclinegraduallyto29,000 b/dby2030.BritishColumbiaproduced55,000 b/dofconventionalproductionin2015,ofwhich34,000 b/dwascondensate.BritishColumbiaisthesecondlargestprovincial source of condensate after Alberta.
Little production currently comes from the NorthwestTerritories(NWT).TheNationalEnergyBoard(NEB)assessedconventionalpetroleumresourcesintheNWTat1.2 billion barrelsofcrudeoil.InMay2015,theNEBalsoreleasedanassessment of the unconventional oil-in-place resourcesfortheBluefishShaleandCanolShaleandstatedthatifonlyone per centoftheoil-in-placeassessedfortheCanolShalecouldbe recovered, it would represent a marketable resourceof1.45 billion barrels.However,thecurrentoil price environment has essentially halted further exploratory development in this region.
2.3.2 Oil SandsInthisforecast,oilsandsproductionisforecasttoincreaseby1.3 million b/dto3.7 million b/din2030(Table 2.4).Comparedtolastyear’sforecast,theoutlookisessentiallyunchangedupuntil2021butlowerby285,000 b/dby2030.
Table 2.4 Oil Sands Production
million b/d 2015 2020 2025 2030
Mining 1.02 1.38 1.41 1.53
In situ 1.34 1.69 1.87 2.14
Total* 2.36 3.07 3.28 3.67*Total may not add up due to rounding.
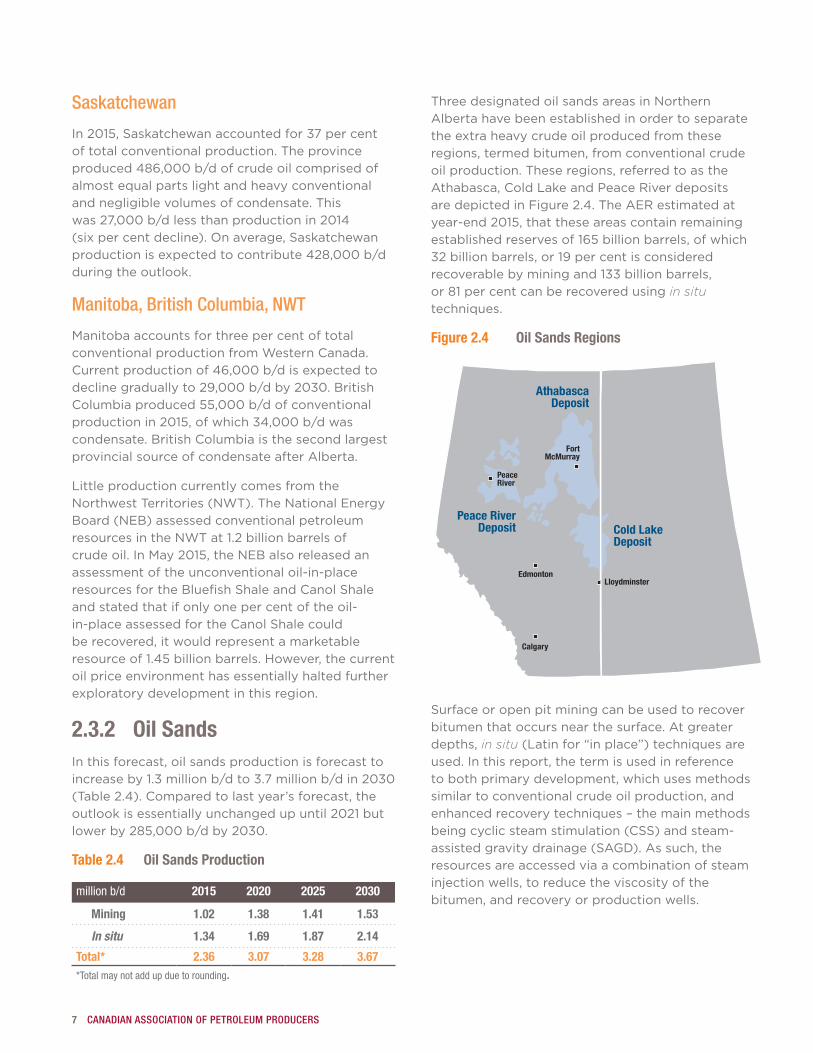
Three designated oil sands areas in Northern Alberta have been established in order to separate the extra heavy crude oil produced from these regions, termed bitumen, from conventional crude oil production. These regions, referred to as the Athabasca,ColdLakeandPeaceRiverdepositsaredepictedinFigure 2.4.TheAERestimatedatyear-end2015,thattheseareascontainremainingestablishedreservesof165billionbarrels,ofwhich32 billion barrels,or19 per centisconsideredrecoverablebyminingand133 billionbarrels,or81 per centcanberecoveredusingin situ techniques.
Figure 2.4 Oil Sands Regions
Edmonton
Calgary
Lloydminster
PeaceRiver
FortMcMurray
AthabascaDeposit
Cold LakeDeposit
Peace RiverDeposit
Surfaceoropenpitminingcanbeusedtorecoverbitumen that occurs near the surface. At greater depths, in situ (Latin for “in place”) techniques are used.Inthisreport,thetermisusedinreferenceto both primary development, which uses methods similar to conventional crude oil production, and enhanced recovery techniques – the main methods beingcyclicsteamstimulation(CSS)andsteam-assistedgravitydrainage(SAGD).Assuch,theresources are accessed via a combination of steam injection wells, to reduce the viscosity of the bitumen, and recovery or production wells.
Crude Oil Forecast, Markets & Transportation 8
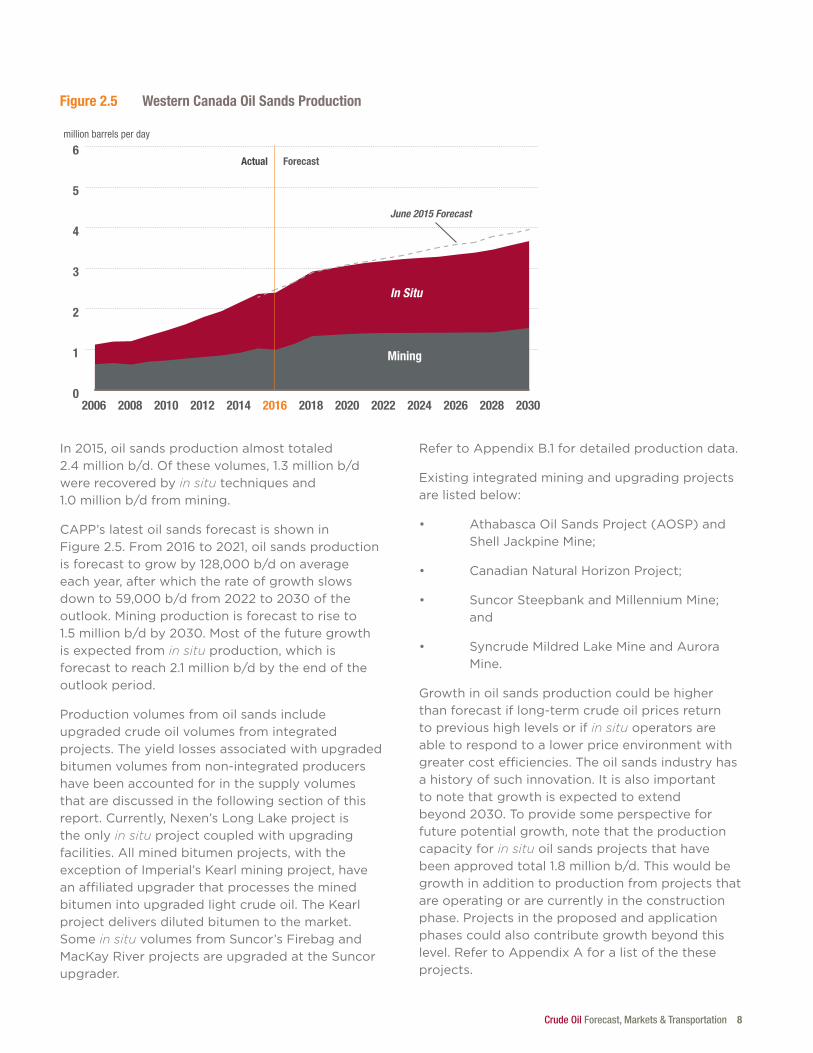
In2015,oilsandsproductionalmosttotaled2.4 million b/d.Ofthesevolumes,1.3 million b/dwere recovered by in situ techniques and 1.0 million b/dfrommining.
CAPP’s latest oil sands forecast is shown in Figure 2.5.From2016to2021,oilsandsproductionisforecasttogrowby128,000 b/donaverageeach year, after which the rate of growth slows downto59,000 b/dfrom2022to2030oftheoutlook. Mining production is forecast to rise to 1.5 million b/dby2030.Mostofthefuturegrowthis expected from in situ production, which is forecasttoreach2.1 million b/dbytheendoftheoutlook period.
Production volumes from oil sands include upgraded crude oil volumes from integrated projects. The yield losses associated with upgraded bitumen volumes from non-integrated producers have been accounted for in the supply volumes that are discussed in the following section of this report. Currently, Nexen’s Long Lake project is the only in situ project coupled with upgrading facilities. All mined bitumen projects, with the exceptionofImperial’sKearlminingproject,havean affiliated upgrader that processes the mined bitumen into upgraded light crude oil. The Kearl project delivers diluted bitumen to the market. Somein situvolumesfromSuncor’sFirebagandMacKayRiverprojectsareupgradedattheSuncorupgrader.
RefertoAppendix B.1fordetailedproductiondata.
Existingintegratedminingandupgradingprojectsare listed below:
• AthabascaOilSandsProject(AOSP)andShellJackpineMine;
• CanadianNaturalHorizonProject;
• SuncorSteepbankandMillenniumMine;and
• SyncrudeMildredLakeMineandAuroraMine.
Growth in oil sands production could be higher than forecast if long-term crude oil prices return to previous high levels or if in situ operators are able to respond to a lower price environment with greater cost efficiencies. The oil sands industry has ahistoryofsuchinnovation.Itisalsoimportantto note that growth is expected to extend beyond2030.Toprovidesomeperspectiveforfuture potential growth, note that the production capacity for in situ oil sands projects that have beenapprovedtotal1.8millionb/d.Thiswouldbegrowth in addition to production from projects that are operating or are currently in the construction phase. Projects in the proposed and application phases could also contribute growth beyond this level.RefertoAppendixAforalistofthetheseprojects.
Figure 2.5 Western Canada Oil Sands Production
0
1
2
3
4
5
6
2030202820262024202220202018201620142012201020082006
million barrels per day
Actual Forecast
June 2015 Forecast
In Situ
Mining
9 CANADIAN ASSOCIATION OF PETROLEUM PRODUCERS
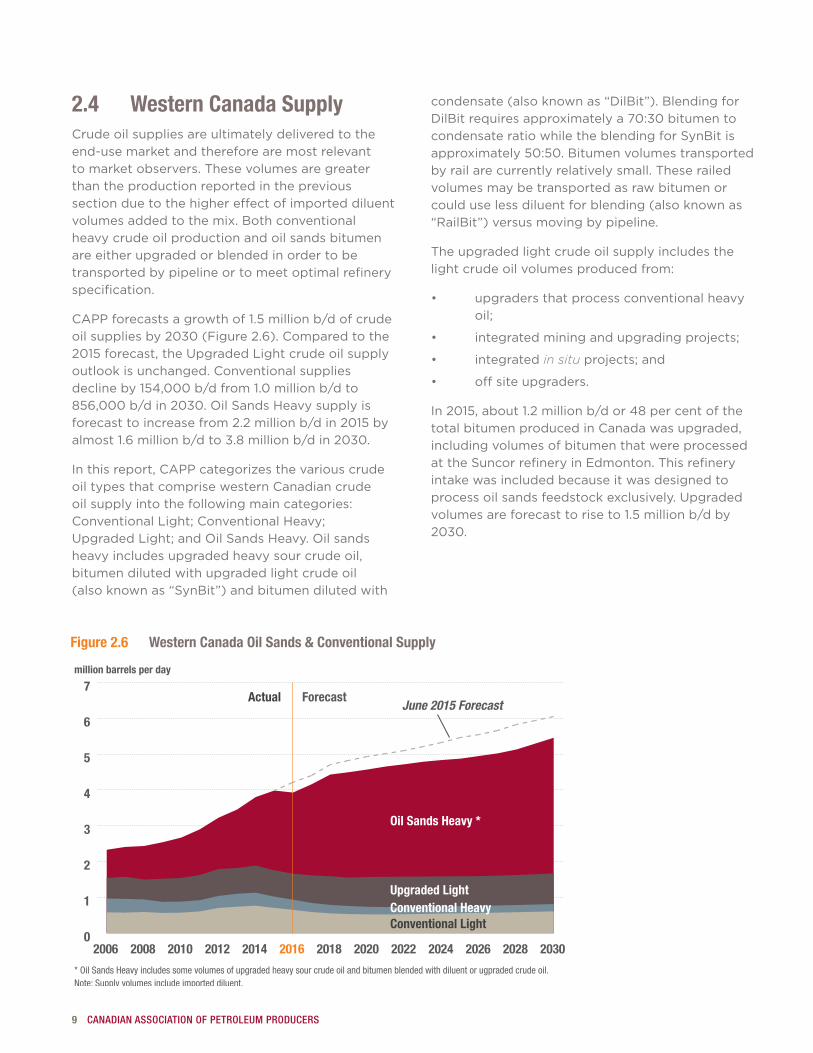
2.4 Western Canada SupplyCrude oil supplies are ultimately delivered to the end-use market and therefore are most relevant to market observers. These volumes are greater than the production reported in the previous section due to the higher effect of imported diluent volumesaddedtothemix.Bothconventionalheavy crude oil production and oil sands bitumen are either upgraded or blended in order to be transported by pipeline or to meet optimal refinery specification.
CAPPforecastsagrowthof1.5millionb/dofcrudeoilsuppliesby2030(Figure 2.6).Comparedtothe2015forecast,theUpgradedLightcrudeoilsupplyoutlook is unchanged. Conventional supplies declineby154,000b/dfrom1.0million b/dto856,000 b/din2030.OilSandsHeavysupplyisforecasttoincreasefrom2.2 million b/din2015byalmost1.6 million b/dto3.8 million b/din2030.
Inthisreport,CAPPcategorizesthevariouscrudeoil types that comprise western Canadian crude oil supply into the following main categories: Conventional Light; Conventional Heavy; UpgradedLight;andOilSandsHeavy.Oilsandsheavy includes upgraded heavy sour crude oil, bitumen diluted with upgraded light crude oil (alsoknownas“SynBit”)andbitumendilutedwith
condensate(alsoknownas“DilBit”).BlendingforDilBitrequiresapproximatelya70:30bitumentocondensateratiowhiletheblendingforSynBitisapproximately50:50.Bitumenvolumestransportedby rail are currently relatively small. These railed volumes may be transported as raw bitumen or could use less diluent for blending (also known as “RailBit”)versusmovingbypipeline.
The upgraded light crude oil supply includes the light crude oil volumes produced from:
• upgradersthatprocessconventionalheavyoil;
• integratedminingandupgradingprojects;
• integratedin situ projects; and
• offsiteupgraders.
In2015,about1.2 million b/dor48 per centofthetotal bitumen produced in Canada was upgraded, including volumes of bitumen that were processed attheSuncorrefineryinEdmonton.Thisrefineryintake was included because it was designed to processoilsandsfeedstockexclusively.Upgradedvolumesareforecasttoriseto1.5 million b/dby2030.
Figure 2.6 Western Canada Oil Sands & Conventio nal Supply
0
1
2
3
4
5
6
7
2030202820262024202220202018201620142012201020082006
Conventional Heavy
million barrels per day
Actual Forecast
Conventional Light
June 2015 Forecast
Conventional Heavy
Oil Sands Heavy *
Upgraded Light
* Oil Sands Heavy includes some volumes of upgraded heavy sour crude oil and bitumen blended with diluent or ugpraded crude oil.Note: Supply volumes include imported diluent.
Crude Oil Forecast, Markets & Transportation 10
Canada’s upgrading capacity is not expected to rise commensurately with bitumen production growth due to a number of economic challenges. Itisdifficultforanewupgradertocompetewiththe option of transporting heavy crude oil to the refineries already located throughout North America that have spare coking capacity, and hence the ability to refine the heavy crude oil slates producedinWesternCanada.
Ifitisnotupgraded,bitumenissoviscousatitsproduction stage that it needs to be diluted with a lighter hydrocarbon or diluent to create a type of crude oil that meets pipeline specifications for densityandviscosity.Unblendedbitumengenerallycannot be moved by pipeline. Less diluent could be used when bitumen is moved by rail if it is transported in heated rail cars as the heat lowers the viscosity of the bitumen. The main source of diluent is pentanes (also referred to as condensate) that are recovered from processing natural gas in WesternCanada.Thegapbetweentheavailablesupply of this blending source and the blending demand is expected to widen with growing bitumen production.
In2015,over400,000 b/dintotalofimportedcondensates, upgraded crude oil, as well as quantities of butane were needed to supplement the condensate supply from indigenous natural gaswellsinWesternCanada.CAPP’sforecastisnot constrained by the availability of condensate imports as new sources of condensate are assumed tobeavailabletomeetmarketrequirements.RefertoSection4.6fordetailsonexistingandproposeddiluent pipeline projects.
The potential for bitumen to travel by rail with reduced diluent requirement is not factored into theanalysisofcondensatedemand.Itisdifficulttoassess what volumes could potentially move by rail as long term commitments are not required given the lower capital investment for loading terminals compared to pipelines.
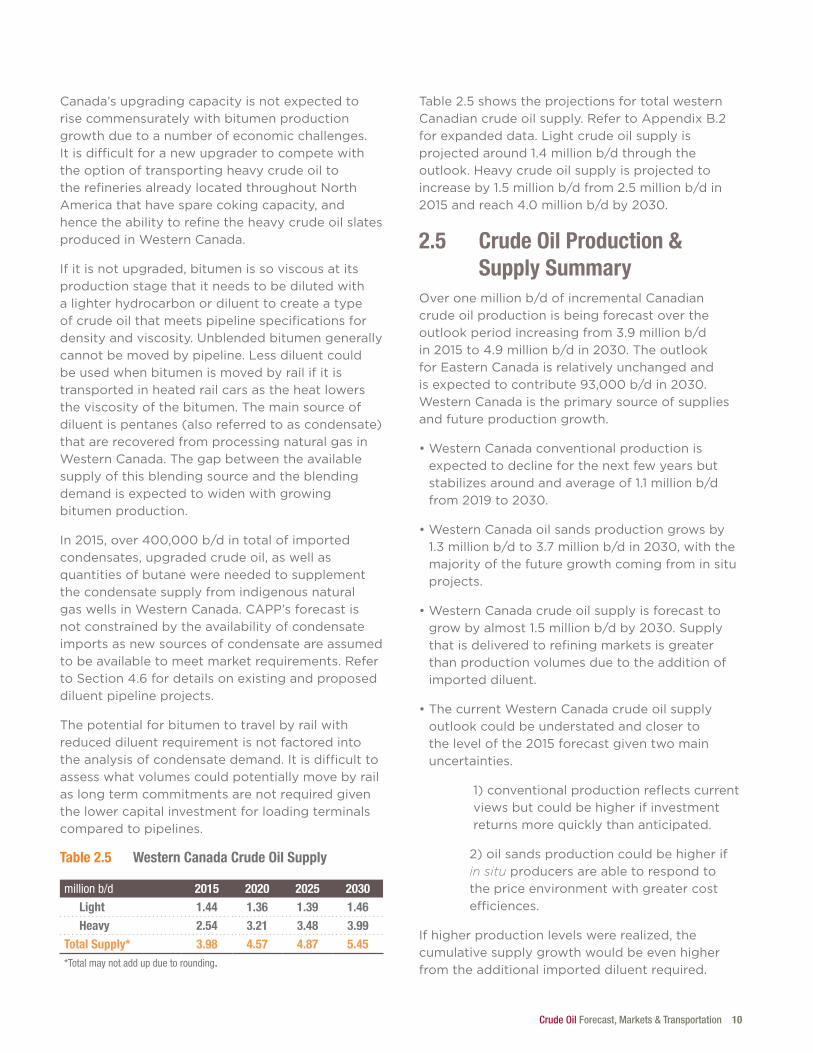
Table 2.5 Western Canada Crude Oil Supply
million b/d 2015 2020 2025 2030 Light 1.44 1.36 1.39 1.46 Heavy 2.54 3.21 3.48 3.99Total Supply* 3.98 4.57 4.87 5.45*Total may not add up due to rounding.
Table 2.5showstheprojectionsfortotalwesternCanadiancrudeoilsupply.RefertoAppendix B.2for expanded data. Light crude oil supply is projectedaround1.4 million b/dthroughtheoutlook. Heavy crude oil supply is projected to increaseby1.5 million b/dfrom2.5 million b/din2015andreach4.0 million b/dby2030.
2.5 Crude Oil Production & Supply Summary
Overone million b/dofincrementalCanadiancrude oil production is being forecast over the outlookperiodincreasingfrom3.9 million b/din2015to4.9 million b/din2030.TheoutlookforEasternCanadaisrelativelyunchangedandisexpectedtocontribute93,000b/din2030.WesternCanadaistheprimarysourceofsuppliesand future production growth.
•WesternCanadaconventionalproductionisexpected to decline for the next few years but stabilizesaroundandaverageof1.1 millionb/dfrom2019to2030.
•WesternCanadaoilsandsproductiongrowsby1.3 millionb/dto3.7millionb/din2030,withthemajority of the future growth coming from in situ projects.
•WesternCanadacrudeoilsupplyisforecasttogrowbyalmost1.5millionb/dby2030.Supplythat is delivered to refining markets is greater than production volumes due to the addition of imported diluent.
•ThecurrentWesternCanadacrudeoilsupplyoutlook could be understated and closer to thelevelofthe2015forecastgiventwomainuncertainties.
1)conventionalproductionreflectscurrentviews but could be higher if investment returns more quickly than anticipated.
2)oilsandsproductioncouldbehigherifin situ producers are able to respond to the price environment with greater cost efficiences.
Ifhigherproductionlevelswererealized,thecumulative supply growth would be even higher from the additional imported diluent required.
11 CANADIAN ASSOCIATION OF PETROLEUM PRODUCERS
AB, BC, SK[573]
PADD V [2,391]
PADD IV [602]
PADD III - Gulf Coast[8,531]
PADD II[3,561]
PADD I - East Coast [1,121]
[2015 total refinery receipts]
Sources: CAPP, CA Energy Commission, EIA, Statistics Canada
ON [354]
QC+ Atlantic Canada [726]
thousand barrels per day
U.S. - Alaska onlyU.S. (excluding Alaska)Other ImportsA. CanadaW. Canada
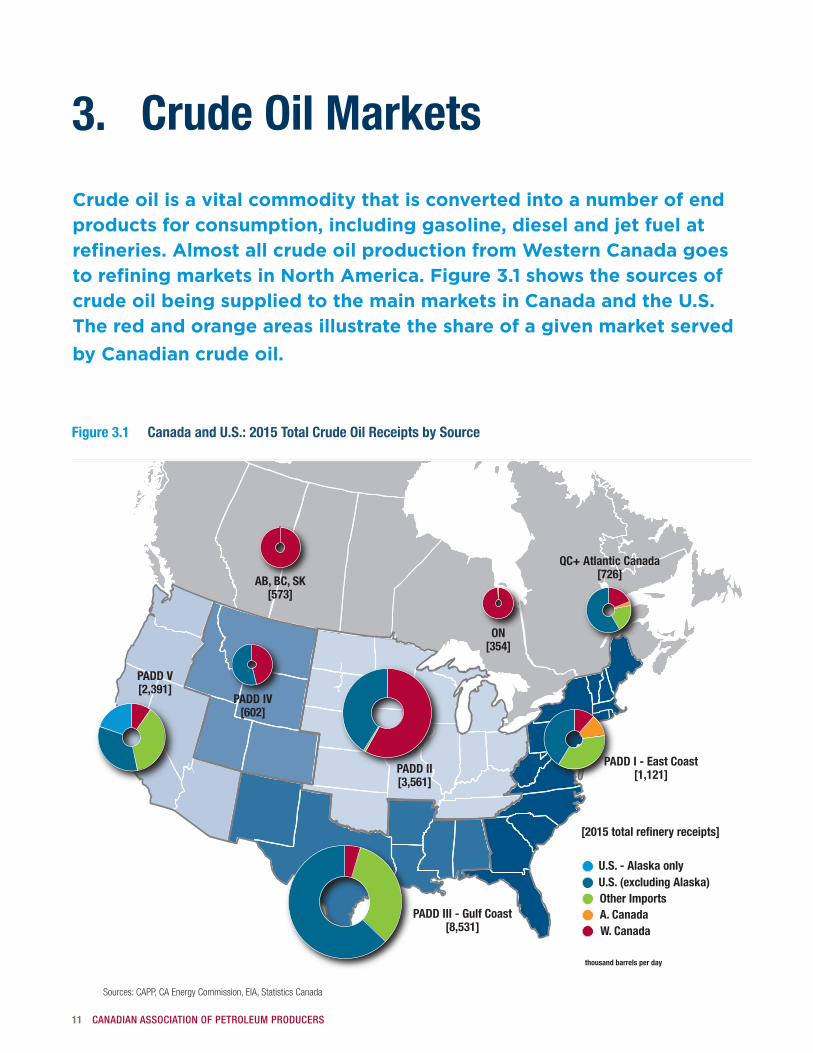
3.
Crude oil is a vital commodity that is converted into a number of end products for consumption, including gasoline, diesel and jet fuel at refineries. Almost all crude oil production from Western Canada goes to refining markets in North America. Figure 3.1 shows the sources of crude oil being supplied to the main markets in Canada and the U.S. The red and orange areas illustrate the share of a given market served by Canadian crude oil.
Crude Oil Markets
Figure 3.1 Canada and U.S.: 2015 Total Crude Oil Receipts by Source
Crude Oil Forecast, Markets & Transportation 12
Non-US5 [unknown]
Sources: CAPP, EIA, NEB, Statistics Canada
Note: 2015 demand does not equal available supply due to factors including inventory adjustment, timing differences, and the potential for U.S.production transiting in Canada before being re�ned in the U.S. being reported as Canadian exports
2015 TOTAL REFINING CAPACITY
2015 Demand 2020 Demand
2015 CDN EXPORTS:U.S. - 2,878Other - 5
SUPPLY2015 - 3,9812020 - 4,569
thousand barrels per day
PADD V0
500
1,000
1,500
2,000
2,500
2,880
PADD IV
0325650
660
W. CANADA
681
0350700
E. CANADA0
300600900
1,2001,174
PADD II
3,968
0
500
1,000
1,500
2,000
2,500
0
500
1,000
1,500
2,000
2,5009,259
PADD III
PADD I
1,300
0325650975
1,300
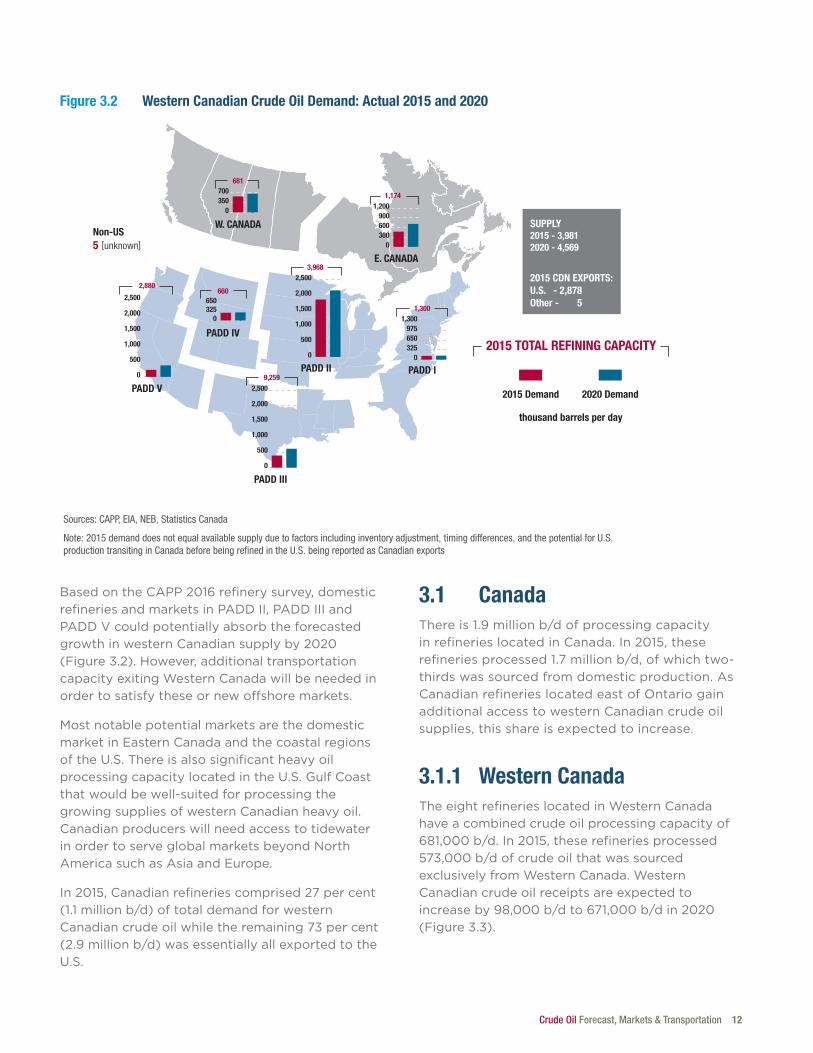
BasedontheCAPP2016refinerysurvey,domesticrefineriesandmarketsinPADD II,PADD IIIandPADD VcouldpotentiallyabsorbtheforecastedgrowthinwesternCanadiansupplyby2020(Figure 3.2).However,additionaltransportationcapacityexitingWesternCanadawillbeneededinorder to satisfy these or new offshore markets.
Most notable potential markets are the domestic marketinEasternCanadaandthecoastalregionsoftheU.S.ThereisalsosignificantheavyoilprocessingcapacitylocatedintheU.S.GulfCoastthat would be well-suited for processing the growing supplies of western Canadian heavy oil. Canadian producers will need access to tidewater in order to serve global markets beyond North AmericasuchasAsiaandEurope.
In2015,Canadianrefineriescomprised27 per cent(1.1 million b/d)oftotaldemandforwesternCanadiancrudeoilwhiletheremaining73 per cent(2.9 million b/d)wasessentiallyallexportedtotheU.S.
3.1 CanadaThereis1.9 million b/dofprocessingcapacityinrefinerieslocatedinCanada.In2015,theserefineriesprocessed1.7 million b/d,ofwhichtwo-thirds was sourced from domestic production. As CanadianrefinerieslocatedeastofOntariogainadditional access to western Canadian crude oil supplies, this share is expected to increase.
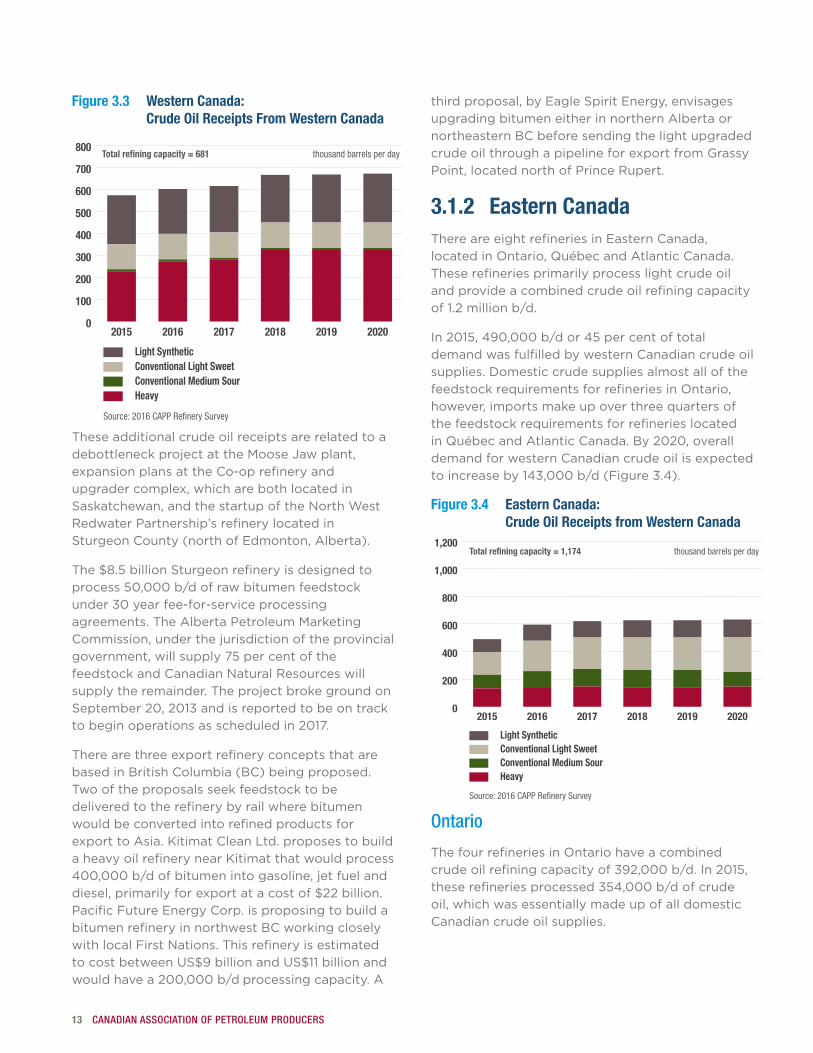
3.1.1 Western Canada TheeightrefinerieslocatedinWesternCanadahave a combined crude oil processing capacity of 681,000 b/d.In2015,theserefineriesprocessed573,000 b/dofcrudeoilthatwassourcedexclusivelyfromWesternCanada.WesternCanadian crude oil receipts are expected to increaseby98,000 b/dto671,000 b/din2020(Figure 3.3).
Figure 3.2 Western Canadian Crude Oil Demand: Actual 2015 and 2020
13 CANADIAN ASSOCIATION OF PETROLEUM PRODUCERS
Figure 3.3 Western Canada: Crude Oil Receipts From Western Canada
Source: 2016 CAPP Re�nery Survey
0
100
200
300
400
500
600
700
800
Light SyntheticConventional Light SweetConventional Medium SourHeavy
202020192018201720162015
Total refining capacity = 681 thousand barrels per day
These additional crude oil receipts are related to a debottleneckprojectattheMooseJawplant,expansion plans at the Co-op refinery and upgrader complex, which are both located in Saskatchewan,andthestartupoftheNorthWestRedwaterPartnership’srefinerylocatedinSturgeonCounty(northofEdmonton,Alberta).
The$8.5 billionSturgeonrefineryisdesignedtoprocess50,000 b/dofrawbitumenfeedstockunder30yearfee-for-serviceprocessingagreements. The Alberta Petroleum Marketing Commission, under the jurisdiction of the provincial government,willsupply75 per centofthefeedstockandCanadianNaturalResourceswillsupply the remainder. The project broke ground on September20,2013andisreportedtobeontracktobeginoperationsasscheduledin2017.
There are three export refinery concepts that are basedinBritishColumbia(BC)beingproposed.Two of the proposals seek feedstock to be delivered to the refinery by rail where bitumen would be converted into refined products for export to Asia. Kitimat Clean Ltd. proposes to build a heavy oil refinery near Kitimat that would process 400,000 b/dofbitumenintogasoline,jetfuelanddiesel,primarilyforexportatacostof$22 billion.PacificFutureEnergyCorp.isproposingtobuildabitumenrefineryinnorthwestBCworkingcloselywith local First Nations. This refinery is estimated tocostbetweenUS$9 billionandUS$11 billionandwouldhavea200,000 b/d processing capacity. A
thirdproposal,byEagleSpiritEnergy,envisagesupgrading bitumen either in northern Alberta or northeasternBCbeforesendingthelightupgradedcrude oil through a pipeline for export from Grassy Point,locatednorthofPrinceRupert.
3.1.2 Eastern CanadaThereareeightrefineriesinEasternCanada,locatedinOntario,QuébecandAtlanticCanada.These refineries primarily process light crude oil and provide a combined crude oil refining capacity of1.2 million b/d.
In2015,490,000 b/dor45 per centoftotaldemand was fulfilled by western Canadian crude oil supplies. Domestic crude supplies almost all of the feedstockrequirementsforrefineriesinOntario,however, imports make up over three quarters of the feedstock requirements for refineries located inQuébecandAtlanticCanada.By2020,overalldemand for western Canadian crude oil is expected toincreaseby143,000 b/d(Figure 3.4).
Figure 3.4 Eastern Canada: Crude Oil Receipts from Western Canada
Source: 2016 CAPP Re�nery Survey
0
200
400
600
800
1,000
1,200
Light SyntheticConventional Light SweetConventional Medium SourHeavy
202020192018201720162015
Total refining capacity = 1,174 thousand barrels per day
Ontario
ThefourrefineriesinOntariohaveacombinedcrudeoilrefiningcapacityof392,000 b/d.In2015,theserefineriesprocessed354,000 b/dofcrudeoil, which was essentially made up of all domestic Canadian crude oil supplies.
Crude Oil Forecast, Markets & Transportation 14
TheBowmanCentreisdevelopingaconceptforanew$10billionrefinerytobebuiltintheSarnia-Lambtonarea.TheprojectiscalledtheSarnia-LambtonAdvancedBitumenEnergyRefinery(SABER).
Québec & Atlantic ProvincesThereareatotaloffourrefineriesinQuébecand the Atlantic provinces that have a combined 782,000 b/dofcrudeoilprocessingcapacity.Domestic crude oil sources supply about 22 per centoftotalfeedstockdemand.Ofthe566,000 b/dofforeignimports,75 per centor422,000 b/dwassourcedfromtheU.S.ThelargeU.S.shareofthismarkethasbeendrivenbythegrowing availability of tight oil production from North Dakota, Texas, New Mexico and Colorado. AftertheU.S.,thetop5sourcesforCanadianimportsareSaudiArabia,Norway,Nigeria,Algeriaand Angola.
Enbridge’sLine9reversalprojectthathasbeenoperatingsincelate2015,candeliverwesternCanadiancrudeoilallthewaytoMontréal(seesection4.5.1).Withadditionaltransportationinfrastructure, these refineries will have increased access to receive western Canadian crude oil, and producers will have a greater opportunity to compete against foreign crude oil suppliers.
3.2 United StatesSince2004,CanadahasbeenthetopforeignsupplierofcrudeoiltotheU.S.Canadaislikelytoremain in this pole position for the foreseeable futuregiventhatin2015,importsfromCanadaexceededimportsfromSaudiArabia,thesecondlargestsupplier,byover2 million b/d.Mostofthegrowth in western Canadian crude oil supplies in 2015wasabsorbedbytheU.S.marketasalmostallCanadian exports of crude oil totaling 3.0 million b/d,wereexportedtotheU.S.
U.S.importsfromCanadahavebeenincreasingyear over year for the past five years despite a decrease in total imports over the same period. ImportsofCanadiancrudeoilhavebeendisplacingother foreign imports of heavy crude oil and the projected growth in western Canadian crude oil supplies could further displace other heavy crude oilimportsintheU.S.GulfCoastandinotherU.S.regions.
U.S.productionhasrisenrapidlyinrecentyears,resulting in the displacement of light crude oil importswithU.S.domesticproduction.TheEIAprojectsfurtherU.S.productiongrowthbeyond2016althoughthepaceanddurationisuncertain.Ofnote,inDecember2015theU.S.banoncrudeoil exports was lifted, which could have an impact onfutureflowsofcrudeoilbuttheseimpactswillbe moderated in the near-term if there remains a smalldifferentialbetweenU.S.andinternationalcrude oil prices.
TheU.S.DepartmentofEnergydividesthe50 statesintofivemarketregionstermedPetroleum Administration of Defense Districts or PADDs. These PADDs were originally created duringWorldWarIItohelpallocatefuelsderivedfrom petroleum products. Today, this delineation continues to be used when reporting data to describetheU.S.crudeoilmarketregions.
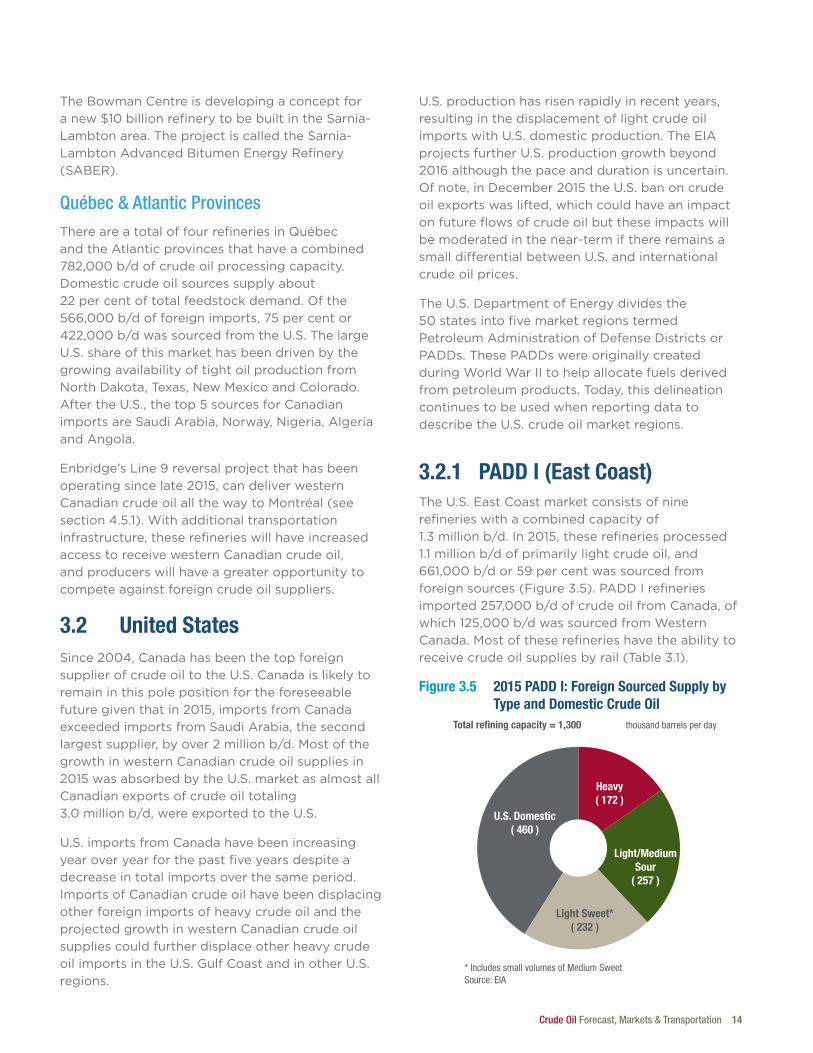
3.2.1 PADD I (East Coast)TheU.S.EastCoastmarketconsistsofninerefineries with a combined capacity of 1.3 million b/d.In2015,theserefineriesprocessed1.1 million b/dofprimarilylightcrudeoil,and661,000 b/dor59 per centwassourcedfromforeignsources(Figure 3.5).PADD Irefineriesimported257,000 b/dofcrudeoilfromCanada,ofwhich125,000 b/dwassourcedfromWesternCanada. Most of these refineries have the ability to receivecrudeoilsuppliesbyrail(Table 3.1).
Figure 3.5 2015 PADD I: Foreign Sourced Supply by Type and Domestic Crude Oil
U.S. Domestic( 460 )
Light Sweet*( 232 )
Light/MediumSour
( 257 )
Heavy( 172 )
Total refining capacity = 1,300 thousand barrels per day
* Includes small volumes of Medium SweetSource: EIA
15 CANADIAN ASSOCIATION OF PETROLEUM PRODUCERS
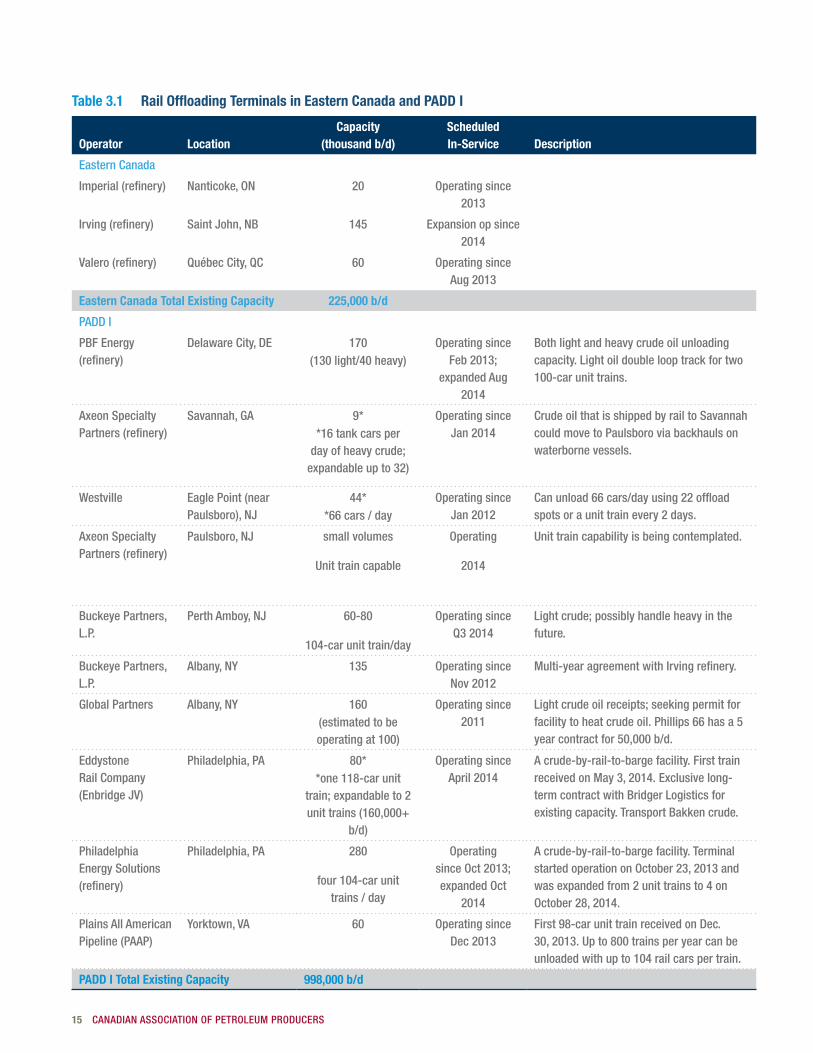
Table 3.1 Rail Offloading Terminals in Eastern Canada and PADD I
Operator LocationCapacity
(thousand b/d)Scheduled In-Service Description
Eastern Canada
Imperial (refinery) Nanticoke, ON 20 Operating since 2013
Irving (refinery) Saint John, NB 145 Expansion op since 2014
Valero (refinery) Québec City, QC 60 Operating since Aug 2013
Eastern Canada Total Existing Capacity 225,000 b/d
PADD I
PBF Energy (refinery)
Delaware City, DE 170 (130 light/40 heavy)
Operating since Feb 2013;
expanded Aug 2014
Both light and heavy crude oil unloading capacity. Light oil double loop track for two 100-car unit trains.
Axeon Specialty Partners (refinery)
Savannah, GA 9**16 tank cars per
day of heavy crude; expandable up to 32)
Operating since Jan 2014
Crude oil that is shipped by rail to Savannah could move to Paulsboro via backhauls on waterborne vessels.
Westville Eagle Point (near Paulsboro), NJ
44**66 cars / day
Operating since Jan 2012
Can unload 66 cars/day using 22 offload spots or a unit train every 2 days.
Axeon Specialty Partners (refinery)
Paulsboro, NJ small volumes
Unit train capable
Operating
2014
Unit train capability is being contemplated.
Buckeye Partners, L.P.
Perth Amboy, NJ 60-80
104-car unit train/day
Operating since Q3 2014
Light crude; possibly handle heavy in the future.
Buckeye Partners, L.P.
Albany, NY 135 Operating since Nov 2012
Multi-year agreement with Irving refinery.
Global Partners Albany, NY 160 (estimated to be operating at 100)
Operating since 2011
Light crude oil receipts; seeking permit for facility to heat crude oil. Phillips 66 has a 5 year contract for 50,000 b/d.
Eddystone Rail Company (Enbridge JV)
Philadelphia, PA 80**one 118-car unit
train; expandable to 2 unit trains (160,000+
b/d)
Operating since April 2014
A crude-by-rail-to-barge facility. First train received on May 3, 2014. Exclusive long-term contract with Bridger Logistics for existing capacity. Transport Bakken crude.
Philadelphia Energy Solutions (refinery)
Philadelphia, PA 280
four 104-car unit trains / day
Operating since Oct 2013; expanded Oct
2014
A crude-by-rail-to-barge facility. Terminal started operation on October 23, 2013 and was expanded from 2 unit trains to 4 on October 28, 2014.
Plains All American Pipeline (PAAP)
Yorktown, VA 60 Operating since Dec 2013
First 98-car unit train received on Dec. 30, 2013. Up to 800 trains per year can be unloaded with up to 104 rail cars per train.
PADD I Total Existing Capacity 998,000 b/d
Crude Oil Forecast, Markets & Transportation 16
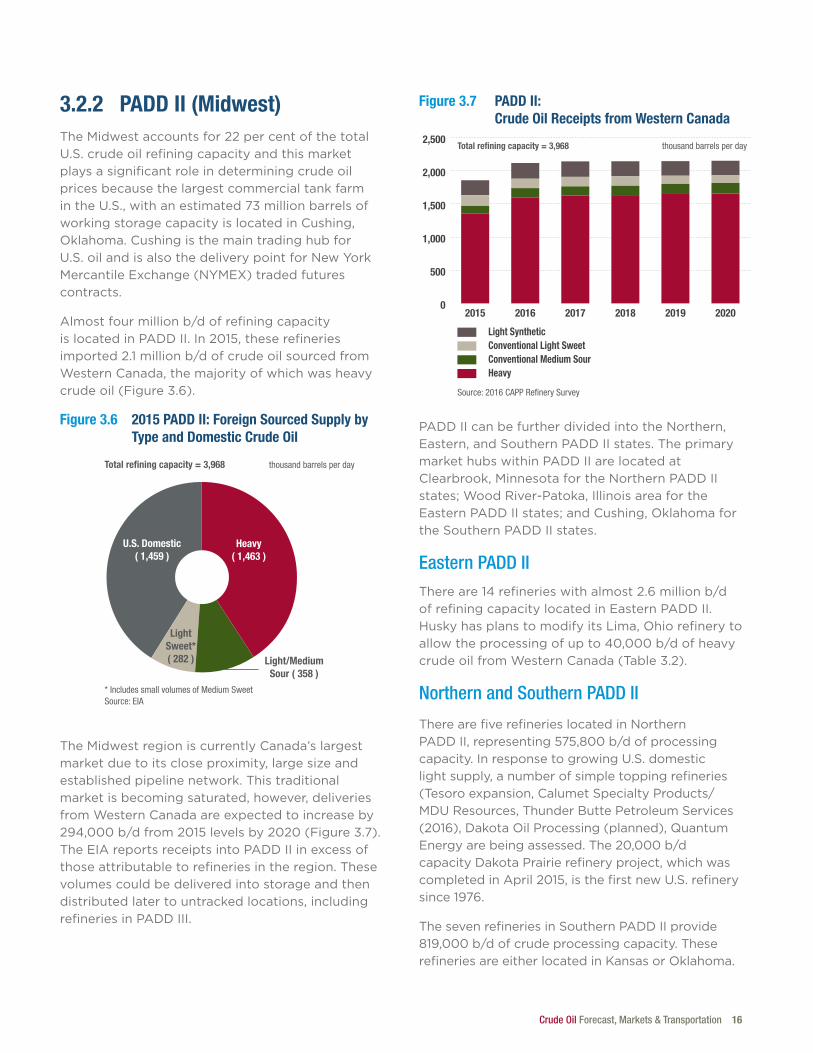
3.2.2 PADD II (Midwest)TheMidwestaccountsfor22 per centofthetotalU.S.crudeoilrefiningcapacityandthismarketplays a significant role in determining crude oil prices because the largest commercial tank farm intheU.S.,withanestimated73 million barrelsofworking storage capacity is located in Cushing, Oklahoma.CushingisthemaintradinghubforU.S.oilandisalsothedeliverypointforNewYorkMercantileExchange(NYMEX)tradedfuturescontracts.
Almostfour million b/dofrefiningcapacityislocatedinPADD II.In2015,theserefineriesimported2.1 million b/dofcrudeoilsourcedfromWesternCanada,themajorityofwhichwasheavycrudeoil(Figure 3.6).
Figure 3.6 2015 PADD II: Foreign Sourced Supply by Type and Domestic Crude Oil
U.S. Domestic( 1,459 )
LightSweet*( 282 ) Light/Medium
Sour ( 358 )
Heavy( 1,463 )
Total refining capacity = 3,968 thousand barrels per day
* Includes small volumes of Medium SweetSource: EIA
The Midwest region is currently Canada’s largest market due to its close proximity, large size and established pipeline network. This traditional market is becoming saturated, however, deliveries fromWesternCanadaareexpectedtoincreaseby294,000 b/dfrom2015levelsby2020(Figure 3.7).TheEIAreportsreceiptsintoPADD IIinexcessofthose attributable to refineries in the region. These volumes could be delivered into storage and then distributed later to untracked locations, including refineriesinPADD III.
Figure 3.7 PADD II: Crude Oil Receipts from Western Canada
Source: 2016 CAPP Re�nery Survey
0
500
1,000
1,500
2,000
2,500
Light SyntheticConventional Light SweetConventional Medium SourHeavy
202020192018201720162015
Total refining capacity = 3,968 thousand barrels per day
PADD IIcanbefurtherdividedintotheNorthern,Eastern,andSouthernPADD IIstates.TheprimarymarkethubswithinPADD IIarelocatedatClearbrook,MinnesotafortheNorthern PADD IIstates;WoodRiver-Patoka,IllinoisareafortheEasternPADD IIstates;andCushing,OklahomafortheSouthernPADD IIstates.
Eastern PADD IIThereare14refinerieswithalmost2.6 million b/dofrefiningcapacitylocatedinEasternPADD II.HuskyhasplanstomodifyitsLima,Ohiorefinerytoallowtheprocessingofupto40,000 b/dofheavycrudeoilfromWesternCanada(Table 3.2).
Northern and Southern PADD II
There are five refineries located in Northern PADD II,representing575,800 b/dofprocessingcapacity.InresponsetogrowingU.S.domesticlight supply, a number of simple topping refineries (Tesoroexpansion,CalumetSpecialtyProducts/MDUResources,ThunderButtePetroleumServices(2016),DakotaOilProcessing(planned),QuantumEnergyarebeingassessed.The20,000 b/dcapacity Dakota Prairie refinery project, which was completedinApril2015,isthefirstnewU.S.refinerysince1976.
ThesevenrefineriesinSouthernPADD IIprovide819,000 b/dofcrudeprocessingcapacity.TheserefineriesareeitherlocatedinKansasorOklahoma.
17 CANADIAN ASSOCIATION OF PETROLEUM PRODUCERS
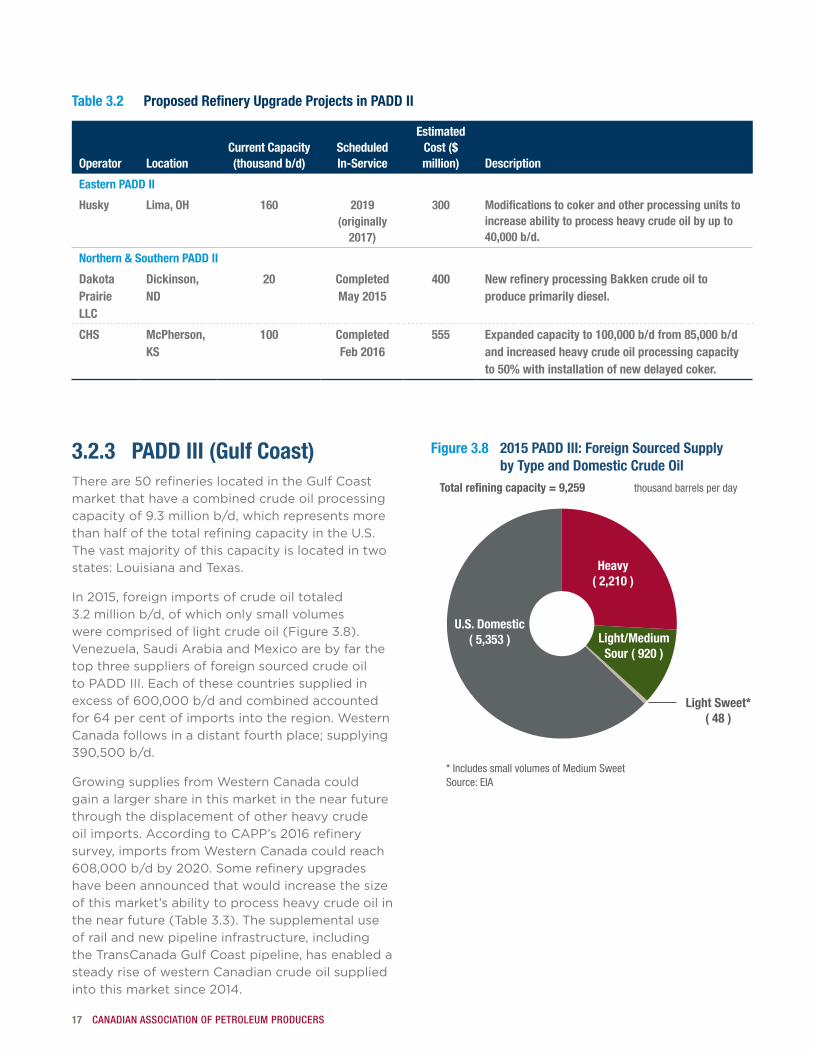
3.2.3 PADD III (Gulf Coast)Thereare50 refinerieslocatedintheGulfCoastmarket that have a combined crude oil processing capacityof9.3 million b/d,whichrepresentsmorethanhalfofthetotalrefiningcapacityintheU.S.The vast majority of this capacity is located in two states: Louisiana and Texas.
In2015,foreignimportsofcrudeoiltotaled3.2 million b/d,ofwhichonlysmallvolumeswerecomprisedoflightcrudeoil(Figure 3.8).Venezuela,SaudiArabiaandMexicoarebyfarthetop three suppliers of foreign sourced crude oil toPADD III.Eachofthesecountriessuppliedinexcessof600,000 b/dandcombinedaccountedfor64 per centofimportsintotheregion.WesternCanada follows in a distant fourth place; supplying 390,500 b/d.
GrowingsuppliesfromWesternCanadacouldgain a larger share in this market in the near future through the displacement of other heavy crude oilimports.AccordingtoCAPP’s2016refinerysurvey,importsfromWesternCanadacouldreach608,000 b/dby2020.Somerefineryupgradeshave been announced that would increase the size of this market’s ability to process heavy crude oil in thenearfuture(Table 3.3).Thesupplementaluseof rail and new pipeline infrastructure, including the TransCanada Gulf Coast pipeline, has enabled a steady rise of western Canadian crude oil supplied intothismarketsince2014.
Figure 3.8 2015 PADD III: Foreign Sourced Supply by Type and Domestic Crude Oil
U.S. Domestic( 5,353 )
Light Sweet*( 48 )
Light/MediumSour ( 920 )
Heavy( 2,210 )
Total refining capacity = 9,259 thousand barrels per day
* Includes small volumes of Medium SweetSource: EIA
Table 3.2 Proposed Refinery Upgrade Projects in PADD II
Operator LocationCurrent Capacity (thousand b/d)
Scheduled In-Service
Estimated Cost ($ million) Description
Eastern PADD II
Husky Lima, OH 160 2019(originally
2017)
300 Modifications to coker and other processing units to increase ability to process heavy crude oil by up to 40,000 b/d.
Northern & Southern PADD II
Dakota Prairie LLC
Dickinson, ND
20 Completed May 2015
400 New refinery processing Bakken crude oil to produce primarily diesel.
CHS McPherson, KS
100 Completed Feb 2016
555 Expanded capacity to 100,000 b/d from 85,000 b/d and increased heavy crude oil processing capacity to 50% with installation of new delayed coker.
Crude Oil Forecast, Markets & Transportation 18
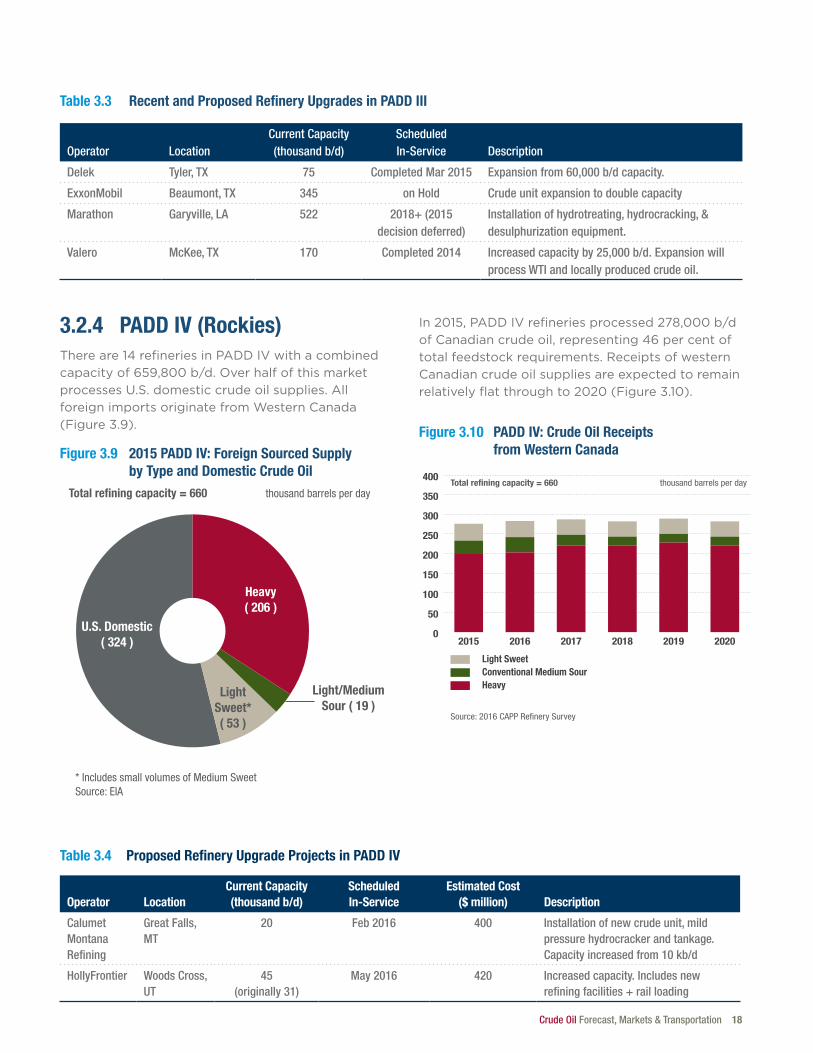
3.2.4 PADD IV (Rockies)Thereare14refineriesinPADD IVwithacombinedcapacityof659,800 b/d.OverhalfofthismarketprocessesU.S.domesticcrudeoilsupplies.AllforeignimportsoriginatefromWesternCanada(Figure 3.9).
Figure 3.9 2015 PADD IV: Foreign Sourced Supply by Type and Domestic Crude Oil
U.S. Domestic( 324 )
LightSweet*( 53 )
Light/MediumSour ( 19 )
Heavy( 206 )
Total refining capacity = 660 thousand barrels per day
* Includes small volumes of Medium SweetSource: EIA
In2015,PADD IVrefineriesprocessed278,000 b/dofCanadiancrudeoil,representing46 per centoftotalfeedstockrequirements.ReceiptsofwesternCanadian crude oil supplies are expected to remain relativelyflatthroughto2020(Figure 3.10).
Figure 3.10 PADD IV: Crude Oil Receipts from Western Canada
Source: 2016 CAPP Re�nery Survey
0
50
100
150
200
250
300
350
400
Light SweetConventional Medium SourHeavy
202020192018201720162015
Total refining capacity = 660 thousand barrels per day
Table 3.3 Recent and Proposed Refinery Upgrades in PADD III
Operator LocationCurrent Capacity (thousand b/d)
Scheduled In-Service Description
Delek Tyler, TX 75 Completed Mar 2015 Expansion from 60,000 b/d capacity.
ExxonMobil Beaumont, TX 345 on Hold Crude unit expansion to double capacity
Marathon Garyville, LA 522 2018+ (2015 decision deferred)
Installation of hydrotreating, hydrocracking, & desulphurization equipment.
Valero McKee, TX 170 Completed 2014 Increased capacity by 25,000 b/d. Expansion will process WTI and locally produced crude oil.
Table 3.4 Proposed Refinery Upgrade Projects in PADD IV
Operator LocationCurrent Capacity (thousand b/d)
Scheduled In-Service
Estimated Cost ($ million) Description
Calumet Montana Refining
Great Falls, MT
20 Feb 2016 400 Installation of new crude unit, mild pressure hydrocracker and tankage. Capacity increased from 10 kb/d
HollyFrontier Woods Cross, UT
45 (originally 31)
May 2016 420 Increased capacity. Includes new refining facilities + rail loading
19 CANADIAN ASSOCIATION OF PETROLEUM PRODUCERS
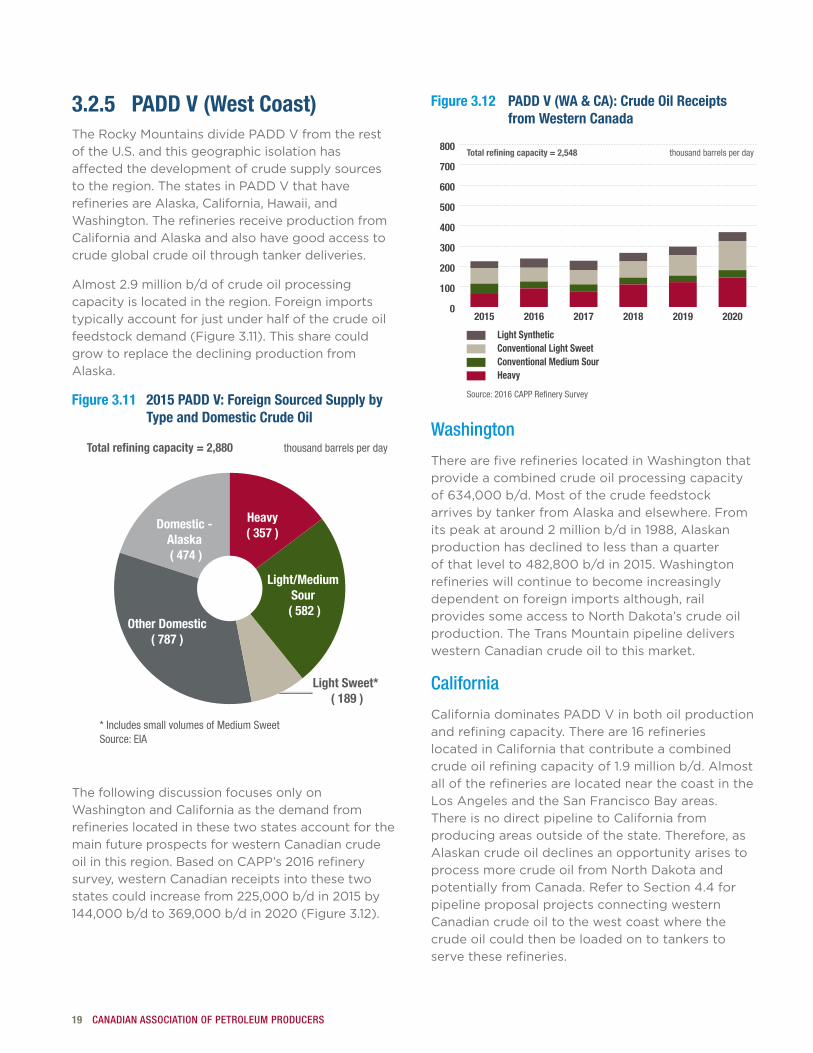
3.2.5 PADD V (West Coast)TheRockyMountainsdividePADD VfromtherestoftheU.S.andthisgeographicisolationhasaffected the development of crude supply sources totheregion.ThestatesinPADD Vthathaverefineries are Alaska, California, Hawaii, and Washington.TherefineriesreceiveproductionfromCalifornia and Alaska and also have good access to crude global crude oil through tanker deliveries.
Almost2.9 million b/dofcrudeoilprocessingcapacity is located in the region. Foreign imports typically account for just under half of the crude oil feedstockdemand(Figure 3.11).Thissharecouldgrow to replace the declining production from Alaska.
Figure 3.11 2015 PADD V: Foreign Sourced Supply by Type and Domestic Crude Oil
Domestic -Alaska ( 474 )
Other Domestic( 787 )
Light Sweet* ( 189 )
Light/MediumSour
( 582 )
Heavy( 357 )
Total refining capacity = 2,880 thousand barrels per day
* Includes small volumes of Medium SweetSource: EIA
The following discussion focuses only on WashingtonandCaliforniaasthedemandfromrefineries located in these two states account for the main future prospects for western Canadian crude oilinthisregion.BasedonCAPP’s2016refinerysurvey, western Canadian receipts into these two statescouldincreasefrom225,000 b/din2015by144,000 b/dto369,000 b/din2020(Figure 3.12).
Figure 3.12 PADD V (WA & CA): Crude Oil Receipts from Western Canada
Source: 2016 CAPP Re�nery Survey
0
100
200
300
400
500
600
700
800
Light SyntheticConventional Light SweetConventional Medium SourHeavy
202020192018201720162015
Total refining capacity = 2,548 thousand barrels per day
Washington
TherearefiverefinerieslocatedinWashingtonthatprovide a combined crude oil processing capacity of634,000 b/d.Mostofthecrudefeedstockarrives by tanker from Alaska and elsewhere. From itspeakataround2 million b/din1988,Alaskanproduction has declined to less than a quarter ofthatlevelto482,800 b/din2015.Washingtonrefineries will continue to become increasingly dependent on foreign imports although, rail provides some access to North Dakota’s crude oil production. The Trans Mountain pipeline delivers western Canadian crude oil to this market.
California
CaliforniadominatesPADD Vinbothoilproductionandrefiningcapacity.Thereare16 refinerieslocated in California that contribute a combined crudeoilrefiningcapacityof1.9 million b/d.Almostall of the refineries are located near the coast in the LosAngelesandtheSanFranciscoBayareas.There is no direct pipeline to California from producing areas outside of the state. Therefore, as Alaskan crude oil declines an opportunity arises to process more crude oil from North Dakota and potentiallyfromCanada.RefertoSection4.4forpipeline proposal projects connecting western Canadian crude oil to the west coast where the crude oil could then be loaded on to tankers to serve these refineries.
Crude Oil Forecast, Markets & Transportation 20
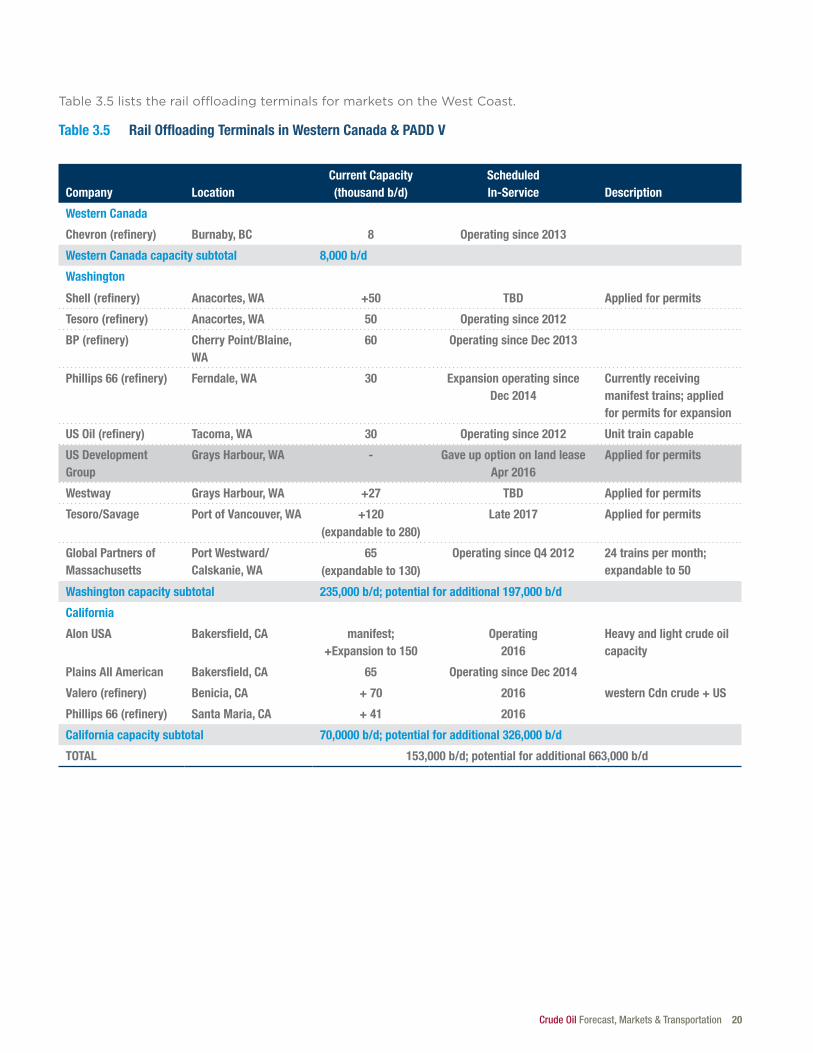
Table3.5liststherailoffloadingterminalsformarketsontheWestCoast.
Table 3.5 Rail Offloading Terminals in Western Canada & PADD V
Company LocationCurrent Capacity (thousand b/d)
Scheduled In-Service Description
Western Canada
Chevron (refinery) Burnaby, BC 8 Operating since 2013
Western Canada capacity subtotal 8,000 b/d
Washington
Shell (refinery) Anacortes, WA +50 TBD Applied for permits
Tesoro (refinery) Anacortes, WA 50 Operating since 2012
BP (refinery) Cherry Point/Blaine, WA
60 Operating since Dec 2013
Phillips 66 (refinery) Ferndale, WA 30 Expansion operating since Dec 2014
Currently receiving manifest trains; applied for permits for expansion
US Oil (refinery) Tacoma, WA 30 Operating since 2012 Unit train capable
US Development Group
Grays Harbour, WA - Gave up option on land lease Apr 2016
Applied for permits
Westway Grays Harbour, WA +27 TBD Applied for permits
Tesoro/Savage Port of Vancouver, WA +120 (expandable to 280)
Late 2017 Applied for permits
Global Partners of Massachusetts
Port Westward/Calskanie, WA
65 (expandable to 130)
Operating since Q4 2012 24 trains per month; expandable to 50
Washington capacity subtotal 235,000 b/d; potential for additional 197,000 b/d
California
Alon USA Bakersfield, CA manifest; +Expansion to 150
Operating 2016
Heavy and light crude oil capacity
Plains All American Bakersfield, CA 65 Operating since Dec 2014
Valero (refinery) Benicia, CA + 70 2016 western Cdn crude + US
Phillips 66 (refinery) Santa Maria, CA + 41 2016
California capacity subtotal 70,0000 b/d; potential for additional 326,000 b/d
TOTAL 153,000 b/d; potential for additional 663,000 b/d
21 CANADIAN ASSOCIATION OF PETROLEUM PRODUCERS
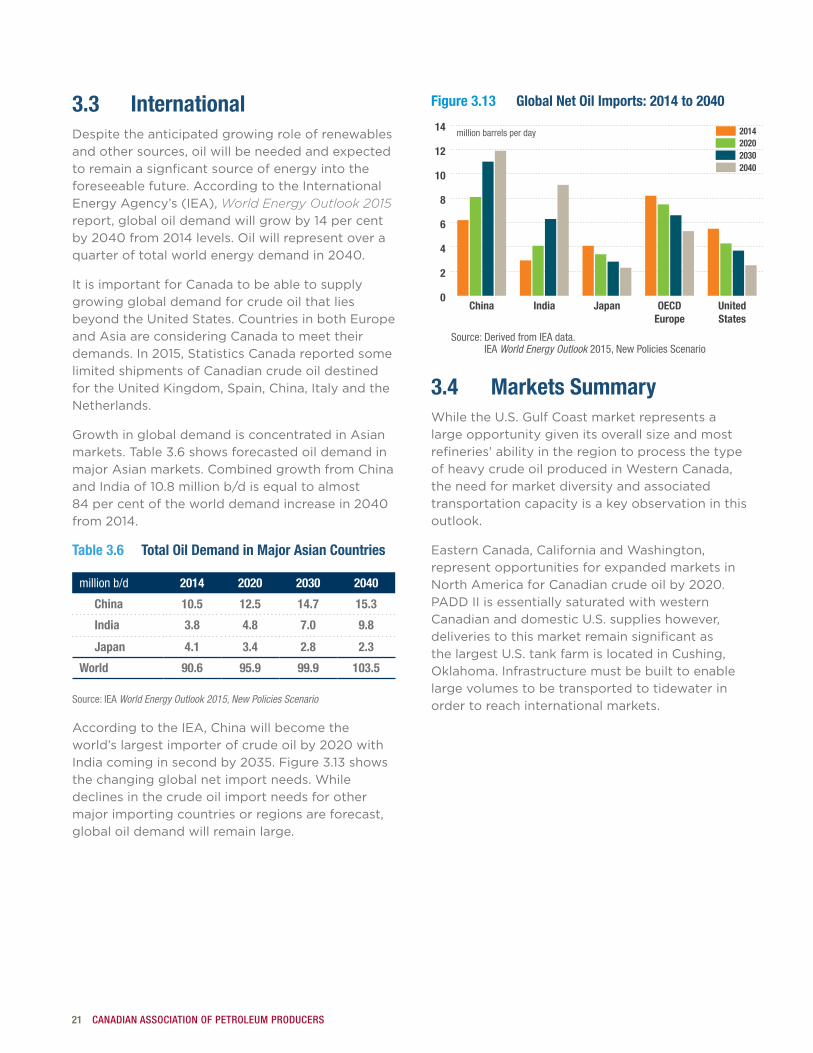
3.3 InternationalDespite the anticipated growing role of renewables and other sources, oil will be needed and expected to remain a signficant source of energy into the foreseeablefuture.AccordingtotheInternationalEnergyAgency’s(IEA),World Energy Outlook 2015 report,globaloildemandwillgrowby14percentby2040from2014levels.Oilwillrepresentoveraquarteroftotalworldenergydemandin2040.
ItisimportantforCanadatobeabletosupplygrowing global demand for crude oil that lies beyondtheUnitedStates.CountriesinbothEuropeand Asia are considering Canada to meet their demands.In2015,StatisticsCanadareportedsomelimited shipments of Canadian crude oil destined fortheUnitedKingdom,Spain,China,ItalyandtheNetherlands.
Growth in global demand is concentrated in Asian markets.Table 3.6showsforecastedoildemandinmajor Asian markets. Combined growth from China andIndiaof10.8 million b/disequaltoalmost84 per centoftheworlddemandincreasein2040from2014.
Table 3.6 Total Oil Demand in Major Asian Countries
million b/d 2014 2020 2030 2040
China 10.5 12.5 14.7 15.3
India 3.8 4.8 7.0 9.8
Japan 4.1 3.4 2.8 2.3
World 90.6 95.9 99.9 103.5
Source: IEA World Energy Outlook 2015, New Policies Scenario
AccordingtotheIEA,Chinawillbecometheworld’slargestimporterofcrudeoilby2020withIndiacominginsecondby2035.Figure 3.13showsthechangingglobalnetimportneeds.Whiledeclines in the crude oil import needs for other major importing countries or regions are forecast, global oil demand will remain large.
Figure 3.13 Global Net Oil Imports: 2014 to 2040
0
2
4
6
8
10
12
14
2040203020202014
UnitedStates
OECDEurope
JapanIndiaChina
million barrels per day
Source: Derived from IEA data. IEA World Energy Outlook 2015, New Policies Scenario
3.4 Markets SummaryWhiletheU.S.GulfCoastmarketrepresentsalarge opportunity given its overall size and most refineries’ ability in the region to process the type ofheavycrudeoilproducedinWesternCanada,the need for market diversity and associated transportation capacity is a key observation in this outlook.
EasternCanada,CaliforniaandWashington,represent opportunities for expanded markets in NorthAmericaforCanadiancrudeoilby2020.PADD IIisessentiallysaturatedwithwesternCanadiananddomesticU.S.supplieshowever,deliveries to this market remain significant as thelargestU.S.tankfarmislocatedinCushing,Oklahoma.Infrastructuremustbebuilttoenablelarge volumes to be transported to tidewater in order to reach international markets.
Crude Oil Forecast, Markets & Transportation 22
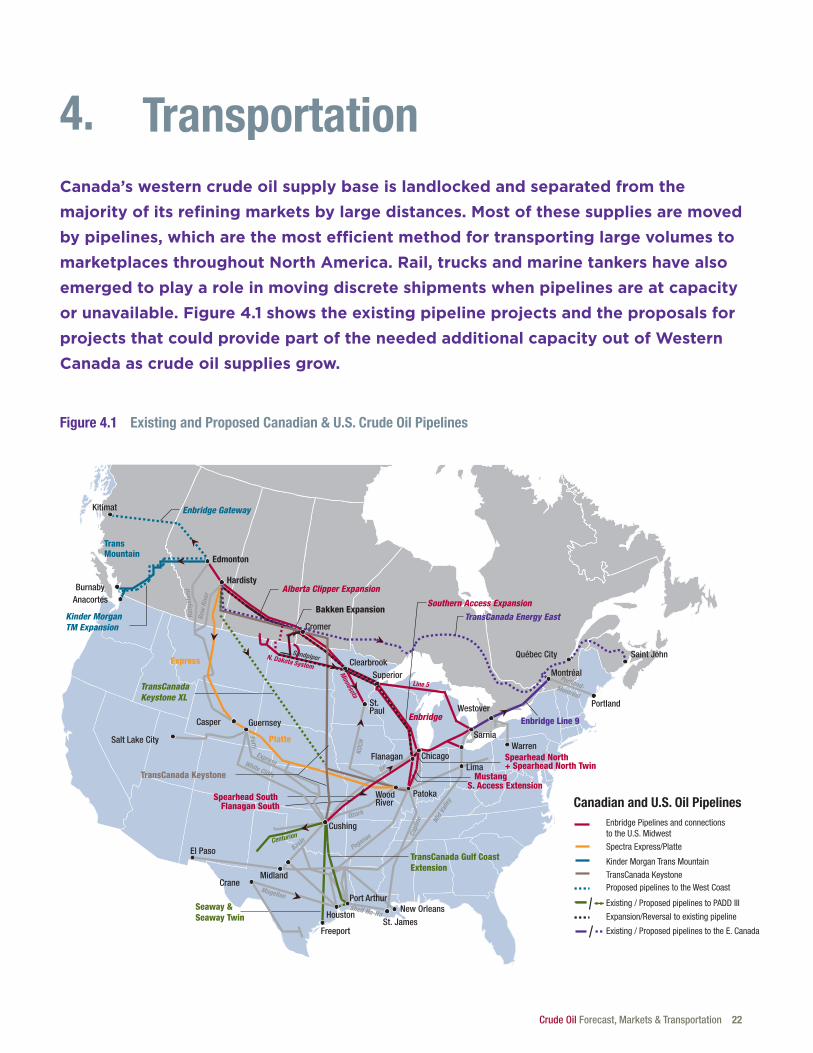
4. TransportationCanada’s western crude oil supply base is landlocked and separated from the majority of its refining markets by large distances. Most of these supplies are moved by pipelines, which are the most efficient method for transporting large volumes to marketplaces throughout North America. Rail, trucks and marine tankers have also emerged to play a role in moving discrete shipments when pipelines are at capacity or unavailable. Figure 4.1 shows the existing pipeline projects and the proposals for projects that could provide part of the needed additional capacity out of Western Canada as crude oil supplies grow.
Figure 4.1 Existing and Proposed Canadian & U.S. Crude Oil Pipelines
Portland
Montréal
Québec City Saint John
Sarnia
Cushing
St. Paul
Salt Lake City
HoustonSt. James
New Orleans
Crane
Freeport
Edmonton
AnacortesBurnaby
TransCanada Keystone
Alberta Clipper Expansion
TransMountain
BP
Ozark
Enbridge
Mid
Vall
ey
Hardisty
Shell Ho-Ho
Express
Platte
Spearhead South
Spearhead North + Spearhead North Twin
Superior
WoodRiver
Cromer
Clearbrook
Guernsey
TransCanadaKeystone XL
Kinder MorganTM Expansion
Kitimat Enbridge Gateway
MustangS. Access Extension
Patoka
Seaway & Seaway Twin
TransCanada Gulf CoastExtension
Enbridge Line 9
Lima
Warren
Westover
Southern Access ExpansionTransCanada Energy East
Flanagan South
Bakken Expansion
Flanagan Chicago
Capl
ine
Minnesota
N. Dakota System
KOCH
Rang
elan
d
Bow
Riv
er
Line 5
Pegasus
Pony
White Cliffs
BasinCenturion
Portland-Montréal
Port Arthur
Canadian and U.S. Oil PipelinesEnbridge Pipelines and connectionsto the U.S. Midwest
Spectra Express/Platte
Kinder Morgan Trans Mountain
TransCanada KeystoneProposed pipelines to the West Coast
Existing / Proposed pipelines to the E. Canada
Existing / Proposed pipelines to PADD III
Expansion/Reversal to existing pipeline
Sandpiper
El Paso
Magellan
Midland
Casper
Express
23 CANADIAN ASSOCIATION OF PETROLEUM PRODUCERS
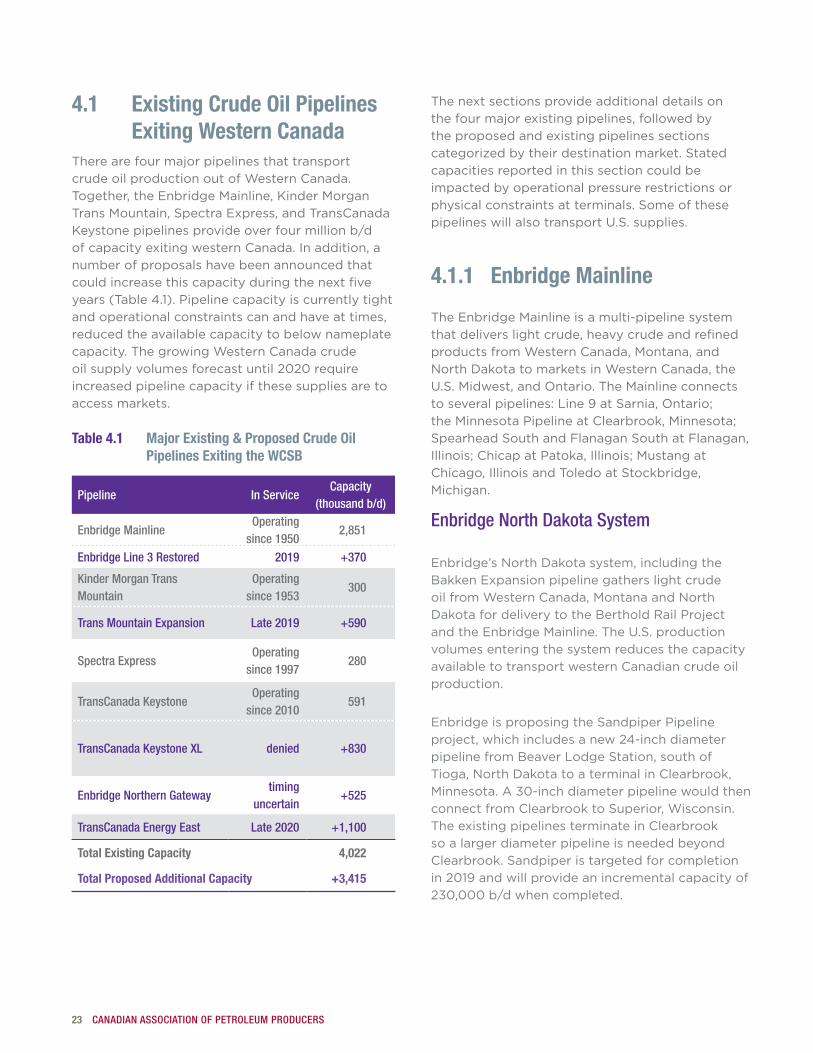
4.1 Existing Crude Oil Pipelines Exiting Western Canada
There are four major pipelines that transport crudeoilproductionoutofWesternCanada.Together,theEnbridgeMainline,KinderMorganTransMountain,SpectraExpress,andTransCanadaKeystonepipelinesprovideoverfour million b/dofcapacityexitingwesternCanada.Inaddition,anumber of proposals have been announced that could increase this capacity during the next five years(Table 4.1).Pipelinecapacityiscurrentlytightand operational constraints can and have at times, reduced the available capacity to below nameplate capacity.ThegrowingWesternCanadacrudeoilsupplyvolumesforecastuntil2020requireincreased pipeline capacity if these supplies are to access markets.
Table 4.1 Major Existing & Proposed Crude Oil Pipelines Exiting the WCSB
Pipeline In ServiceCapacity
(thousand b/d)
Enbridge MainlineOperating
since 19502,851
Enbridge Line 3 Restored 2019 +370
Kinder Morgan Trans Mountain
Operating since 1953
300
Trans Mountain Expansion Late 2019 +590
Spectra Express Operating
since 1997280
TransCanada KeystoneOperating
since 2010591
TransCanada Keystone XL denied +830
Enbridge Northern Gatewaytiming
uncertain+525
TransCanada Energy East Late 2020 +1,100
Total Existing Capacity 4,022
Total Proposed Additional Capacity +3,415
The next sections provide additional details on the four major existing pipelines, followed by the proposed and existing pipelines sections categorizedbytheirdestinationmarket.Statedcapacities reported in this section could be impacted by operational pressure restrictions or physicalconstraintsatterminals.SomeofthesepipelineswillalsotransportU.S.supplies.
4.1.1 Enbridge Mainline
TheEnbridgeMainlineisamulti-pipelinesystemthat delivers light crude, heavy crude and refined productsfromWesternCanada,Montana,andNorthDakotatomarketsinWesternCanada,theU.S.Midwest,andOntario.TheMainlineconnectstoseveralpipelines:Line9atSarnia,Ontario;the Minnesota Pipeline at Clearbrook, Minnesota; SpearheadSouthandFlanaganSouthatFlanagan,Illinois;ChicapatPatoka,Illinois;MustangatChicago,IllinoisandToledoatStockbridge,Michigan.
Enbridge North Dakota System
Enbridge’sNorthDakotasystem,includingtheBakkenExpansionpipelinegatherslightcrudeoilfromWesternCanada,MontanaandNorthDakotafordeliverytotheBertholdRailProjectandtheEnbridgeMainline.TheU.S.productionvolumes entering the system reduces the capacity available to transport western Canadian crude oil production.
EnbridgeisproposingtheSandpiperPipelineproject,whichincludesanew24-inchdiameterpipelinefromBeaverLodgeStation,southofTioga, North Dakota to a terminal in Clearbrook, Minnesota.A30-inchdiameterpipelinewouldthenconnectfromClearbrooktoSuperior,Wisconsin.The existing pipelines terminate in Clearbrook so a larger diameter pipeline is needed beyond Clearbrook.Sandpiperistargetedforcompletionin2019andwillprovideanincrementalcapacityof230,000 b/dwhencompleted.
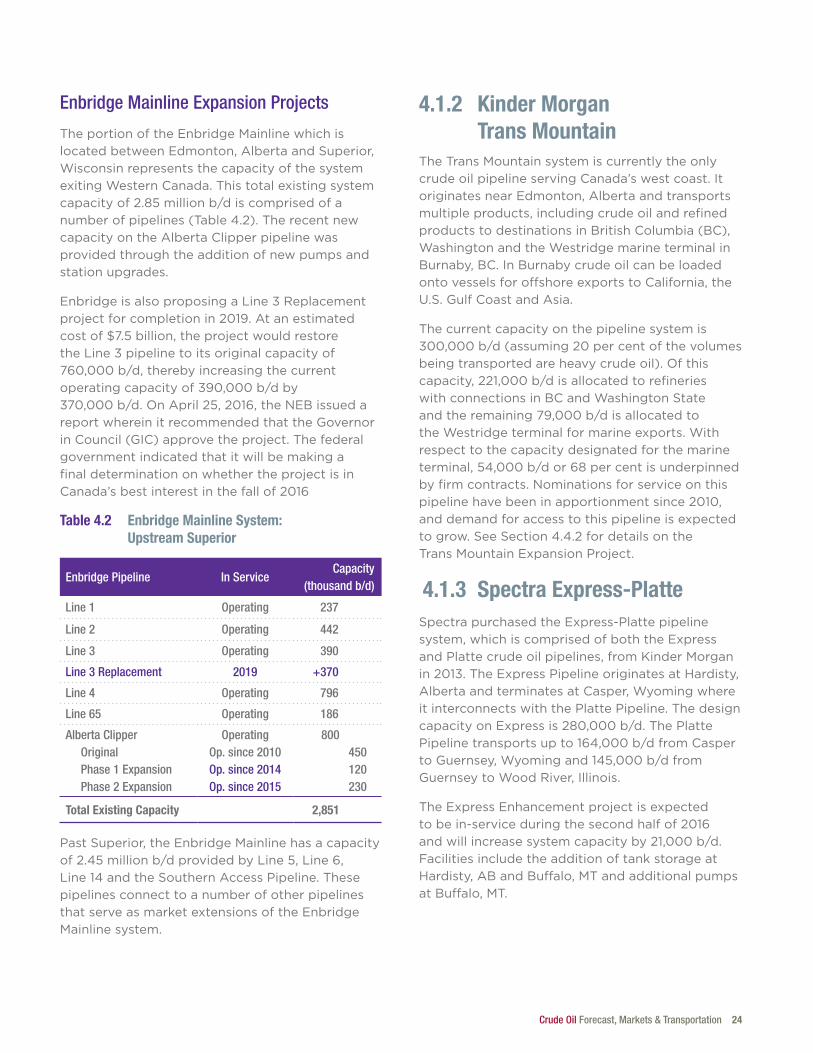
Crude Oil Forecast, Markets & Transportation 24
Enbridge Mainline Expansion Projects
TheportionoftheEnbridgeMainlinewhichislocatedbetweenEdmonton,AlbertaandSuperior,WisconsinrepresentsthecapacityofthesystemexitingWesternCanada.Thistotalexistingsystemcapacityof2.85 million b/discomprisedofanumberofpipelines(Table 4.2).Therecentnewcapacity on the Alberta Clipper pipeline was provided through the addition of new pumps and station upgrades.
EnbridgeisalsoproposingaLine 3Replacementprojectforcompletionin2019.Atanestimatedcostof$7.5 billion,theprojectwouldrestoretheLine 3pipelinetoitsoriginalcapacityof760,000 b/d,therebyincreasingthecurrentoperatingcapacityof390,000 b/dby370,000 b/d.OnApril25,2016,theNEBissuedareport wherein it recommended that the Governor inCouncil(GIC)approvetheproject.Thefederalgovernment indicated that it will be making a final determination on whether the project is in Canada’sbestinterestinthefallof2016
Table 4.2 Enbridge Mainline System: Upstream Superior
Enbridge Pipeline In ServiceCapacity
(thousand b/d)
Line 1 Operating 237
Line 2 Operating 442
Line 3 Operating 390
Line 3 Replacement 2019 +370
Line 4 Operating 796
Line 65 Operating 186
Alberta Clipper Original Phase 1 Expansion Phase 2 Expansion
Operating Op. since 2010 Op. since 2014 Op. since 2015
800 450 120 230
Total Existing Capacity 2,851
PastSuperior,theEnbridgeMainlinehasacapacityof2.45 million b/dprovidedbyLine 5,Line 6,Line 14andtheSouthernAccessPipeline.Thesepipelines connect to a number of other pipelines thatserveasmarketextensionsoftheEnbridgeMainline system.
4.1.2 Kinder Morgan Trans Mountain
The Trans Mountain system is currently the only crudeoilpipelineservingCanada’swestcoast.ItoriginatesnearEdmonton,Albertaandtransportsmultiple products, including crude oil and refined productstodestinationsinBritishColumbia(BC),WashingtonandtheWestridgemarineterminalinBurnaby,BC.InBurnabycrudeoilcanbeloadedonto vessels for offshore exports to California, the U.S.GulfCoastandAsia.
The current capacity on the pipeline system is 300,000 b/d(assuming20 per centofthevolumesbeingtransportedareheavycrudeoil).Ofthiscapacity,221,000 b/disallocatedtorefinerieswithconnectionsinBCandWashingtonStateandtheremaining79,000 b/disallocatedtotheWestridgeterminalformarineexports.Withrespect to the capacity designated for the marine terminal,54,000 b/dor68 per centisunderpinnedby firm contracts. Nominations for service on this pipelinehavebeeninapportionmentsince2010,and demand for access to this pipeline is expected togrow.SeeSection 4.4.2fordetailsontheTrans MountainExpansionProject.
4.1.3 Spectra Express-Platte SpectrapurchasedtheExpress-Plattepipelinesystem,whichiscomprisedofboththeExpressand Platte crude oil pipelines, from Kinder Morgan in2013.TheExpressPipelineoriginatesatHardisty,AlbertaandterminatesatCasper,Wyomingwhereit interconnects with the Platte Pipeline. The design capacityonExpressis280,000 b/d.ThePlattePipelinetransportsupto164,000 b/dfromCaspertoGuernsey,Wyomingand145,000 b/dfromGuernseytoWoodRiver,Illinois.
TheExpressEnhancementprojectisexpectedtobein-serviceduringthesecondhalfof2016andwillincreasesystemcapacityby21,000b/d.Facilities include the addition of tank storage at Hardisty,ABandBuffalo,MTandadditionalpumpsatBuffalo,MT.
25 CANADIAN ASSOCIATION OF PETROLEUM PRODUCERS
4.1.4 TransCanada KeystoneThe Keystone pipeline system originates at Hardisty,AlbertaandextendstoSteeleCity,Nebraska. From this juncture, crude oil can be transportedeasttoterminalsinWoodRiverandPatoka,IllinoisorsouthtoCushing,Oklahoma.Thepipelinesystemcandeliveratotalof590,000 b/dto either destination. The pipeline system began operatinginJuly2010initiallyservingtheWoodRiver/Patokamarketswithonly435,000 b/dcapacity. The system’s capacity subsequently expandedtoitscurrentcapacityinFebruary2011when the Cushing extension came online.
BetweenJuly10,2015andSeptember2,2015,TransCanadaheldasuccessfulOpenSeasonforanadditional15,000 b/dofcontractcapacity.Thesecontractswouldextendfor20yearswiththevolumesdestinedfortheU.S.GulfCoastmarkets.Priortothe2015openseason,contractedspaceonthepipelinewas530,000 b/dforanaverageof18 years.
4.2 Oil P ipelines to the U.S. Midwest
TheU.S.MidwestisthelargestmarketforwesternCanadian crude oil. The key market hubs in this regionarelocatedatWoodRiverandPatokainIllinoisandatCushing,Oklahoma.Table 4.3summarizes the pipelines which deliver Canadian crude oil to the Midwest.
4.2.1 Spectra Express-PlatteSeeSection4.1.3.
4.2.2 TransCanada KeystoneSeeSection4.1.4.
4.2.3 Enbridge Mainline Market Extensions
Enbridgehasrecentlycompletedanumberofsystem segment projects that have expanded its market reach to a number of Midwest markets. TheseincludeFlanaganSouth,theSouthernAccessExtension,SpearheadNorthtwinline(Table 4.3).Together,thesepipelineshaveaddedalmost1.5 million b/dsegmentsofnewcapacity.
4.2.4 Minnesota Pipeline System
The Minnesota Pipe Line (MPL) system transports crude oil originating in Canada and North Dakota through pipeline connections at Clearbook, Minnesota to the Twin Cities. The MPL system is owned by Minnesota Pipe Line Company and operatedbyKochPipelineCompany.Itistheprimary pipeline system that supplies crude oil to Minnesota’s two refineries.
The MPL system is comprised of four pipelines that together,cantransportabout465,000 b/d.ThefirstpipelineintheMPLsystemwasbuiltin1954;thesecondwasbuiltinthe1970s;thethirdinthe1980s;andthelastpipeline,MPLLine4,formerlyknownasMinnCan,wasconstructedin2008.MPLLine4cancurrentlytransportabout165,000 b/d.The Minnesota Pipe Line Company has proposed a project to increase capacity of the pipeline by 185,000 b/dtoreach350,000 b/dwhenneededthrough the addition of six pump stations and upgrading two existing stations. At an estimated costof$125million,thisprojectisintendedtogiveMPLtheflexibilitytoshiftvolumestoitsnewest pipeline in the event of an outage on other segments of the pipeline system. The construction istargetedtobecompletedinQ42017.
4.2.5 Plains All American Diamond Pipeline
Plains All American has plans to build a new 200,000 b/dcrudeoilpipelinefromCushing,OklahomatoValero’srefineryinMemphis,Tennessee.Engineeringplanshavebeenfinalizedand all the required permits and rights-of-wayacquisitionswerecompletedinlate2015.Construction is expected to be completed in early2017.Valerohasalsoexerciseditsoptiontopurchase50 per centinterestinthepipeline.
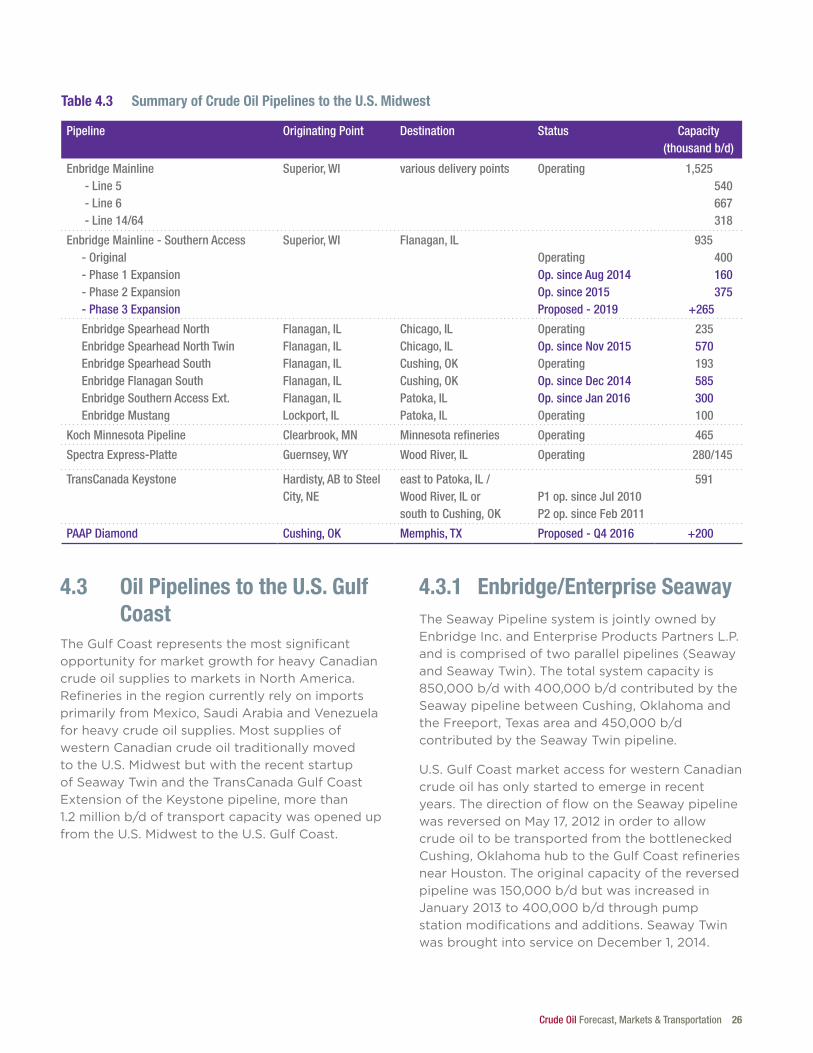
Crude Oil Forecast, Markets & Transportation 26
4.3 Oil Pipelines to the U.S. Gulf Coast
The Gulf Coast represents the most significant opportunity for market growth for heavy Canadian crude oil supplies to markets in North America. RefineriesintheregioncurrentlyrelyonimportsprimarilyfromMexico,SaudiArabiaandVenezuelafor heavy crude oil supplies. Most supplies of western Canadian crude oil traditionally moved totheU.S.MidwestbutwiththerecentstartupofSeawayTwinandtheTransCanadaGulfCoastExtensionoftheKeystonepipeline,morethan1.2 million b/doftransportcapacitywasopenedupfromtheU.S.MidwesttotheU.S.GulfCoast.
4.3.1 Enbridge/Enterprise SeawayTheSeawayPipelinesystemisjointlyownedbyEnbridgeInc.andEnterpriseProductsPartnersL.P.andiscomprisedoftwoparallelpipelines(SeawayandSeawayTwin).Thetotalsystemcapacityis850,000 b/dwith400,000 b/dcontributedbytheSeawaypipelinebetweenCushing,OklahomaandtheFreeport,Texasareaand450,000 b/dcontributedbytheSeawayTwinpipeline.
U.S.GulfCoastmarketaccessforwesternCanadiancrude oil has only started to emerge in recent years.ThedirectionofflowontheSeawaypipelinewasreversedonMay17,2012inordertoallowcrude oil to be transported from the bottlenecked Cushing,OklahomahubtotheGulfCoastrefineriesnear Houston. The original capacity of the reversed pipelinewas150,000 b/dbutwasincreasedinJanuary2013to400,000 b/dthroughpumpstationmodificationsandadditions.SeawayTwinwasbroughtintoserviceonDecember1,2014.
Table 4.3 Summary of Crude Oil Pipelines to the U.S. Midwest
Pipeline Originating Point Destination Status Capacity(thousand b/d)
Enbridge Mainline - Line 5 - Line 6 - Line 14/64
Superior, WI various delivery points Operating 1,525 540 667 318
Enbridge Mainline - Southern Access - Original - Phase 1 Expansion - Phase 2 Expansion - Phase 3 Expansion
Superior, WI Flanagan, ILOperatingOp. since Aug 2014Op. since 2015Proposed - 2019
935 400 160 375
+265
Enbridge Spearhead North Enbridge Spearhead North Twin Enbridge Spearhead South Enbridge Flanagan South Enbridge Southern Access Ext. Enbridge Mustang
Flanagan, ILFlanagan, ILFlanagan, ILFlanagan, ILFlanagan, ILLockport, IL
Chicago, ILChicago, ILCushing, OKCushing, OKPatoka, ILPatoka, IL
OperatingOp. since Nov 2015OperatingOp. since Dec 2014Op. since Jan 2016Operating
235570193585300100
Koch Minnesota Pipeline Clearbrook, MN Minnesota refineries Operating 465
Spectra Express-Platte Guernsey, WY Wood River, IL Operating 280/145
TransCanada Keystone Hardisty, AB to Steel City, NE
east to Patoka, IL / Wood River, IL or south to Cushing, OK
P1 op. since Jul 2010P2 op. since Feb 2011
591
PAAP Diamond Cushing, OK Memphis, TX Proposed - Q4 2016 +200
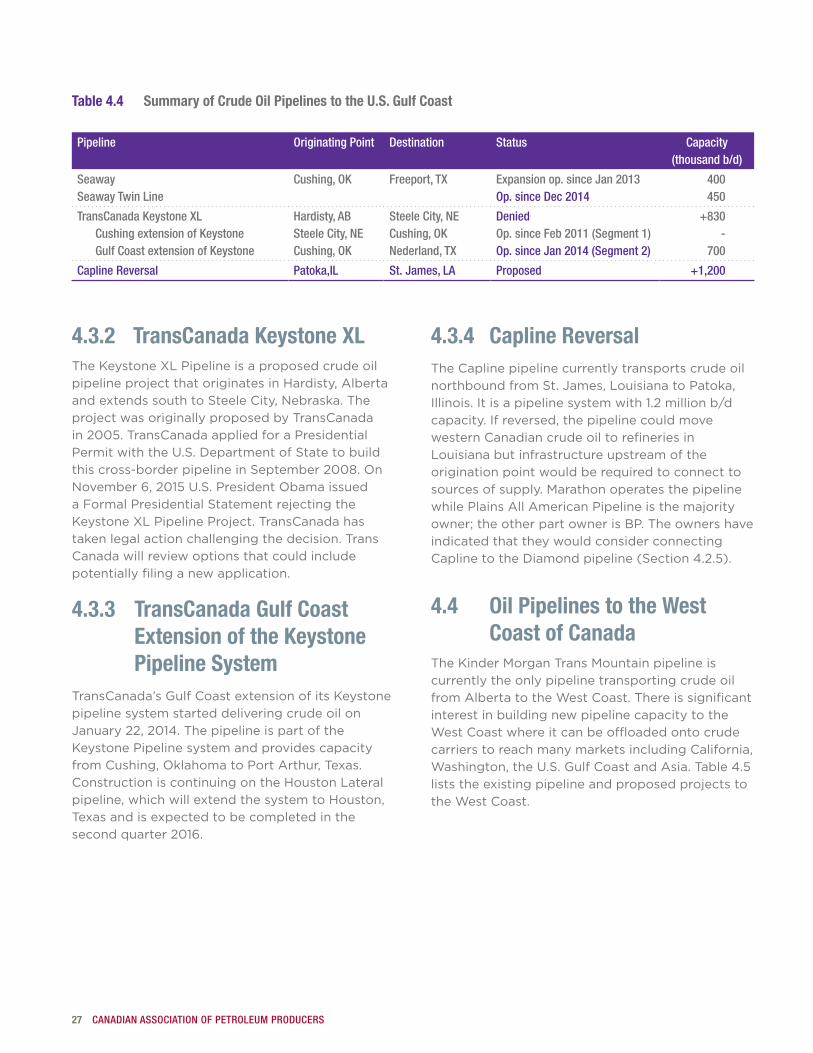
27 CANADIAN ASSOCIATION OF PETROLEUM PRODUCERS
4.3.2 TransCanada Keystone XLTheKeystoneXLPipelineisaproposedcrudeoilpipeline project that originates in Hardisty, Alberta andextendssouthtoSteeleCity,Nebraska.Theproject was originally proposed by TransCanada in2005.TransCanadaappliedforaPresidentialPermitwiththeU.S.DepartmentofStatetobuildthiscross-borderpipelineinSeptember2008.OnNovember 6,2015U.S.PresidentObamaissuedaFormalPresidentialStatementrejectingtheKeystoneXLPipelineProject.TransCanadahastaken legal action challenging the decision. Trans Canada will review options that could include potentially filing a new application.
4.3.3 TransCanada Gulf Coast Extension of the Keystone Pipeline System
TransCanada’s Gulf Coast extension of its Keystone pipeline system started delivering crude oil on January22,2014.ThepipelineispartoftheKeystone Pipeline system and provides capacity fromCushing,OklahomatoPortArthur,Texas.Construction is continuing on the Houston Lateral pipeline, which will extend the system to Houston, Texas and is expected to be completed in the secondquarter2016.
4.3.4 Capline Reversal The Capline pipeline currently transports crude oil northboundfromSt.James,LouisianatoPatoka,Illinois.Itisapipelinesystemwith1.2 million b/dcapacity.Ifreversed,thepipelinecouldmovewestern Canadian crude oil to refineries in Louisiana but infrastructure upstream of the origination point would be required to connect to sources of supply. Marathon operates the pipeline while Plains All American Pipeline is the majority owner;theotherpartownerisBP.Theownershaveindicated that they would consider connecting CaplinetotheDiamondpipeline(Section 4.2.5).
4.4 Oil Pipelines to the West Coast of Canada
The Kinder Morgan Trans Mountain pipeline is currently the only pipeline transporting crude oil fromAlbertatotheWestCoast.Thereissignificantinterest in building new pipeline capacity to the WestCoastwhereitcanbeoffloadedontocrudecarriers to reach many markets including California, Washington,theU.S.GulfCoastandAsia.Table 4.5lists the existing pipeline and proposed projects to theWestCoast.
Table 4.4 Summary of Crude Oil Pipelines to the U.S. Gulf Coast
Pipeline Originating Point Destination Status Capacity(thousand b/d)
Seaway Seaway Twin Line
Cushing, OK Freeport, TX Expansion op. since Jan 2013Op. since Dec 2014
400450
TransCanada Keystone XL Cushing extension of Keystone Gulf Coast extension of Keystone
Hardisty, ABSteele City, NECushing, OK
Steele City, NECushing, OKNederland, TX
DeniedOp. since Feb 2011 (Segment 1)Op. since Jan 2014 (Segment 2)
+830-
700
Capline Reversal Patoka,IL St. James, LA Proposed +1,200
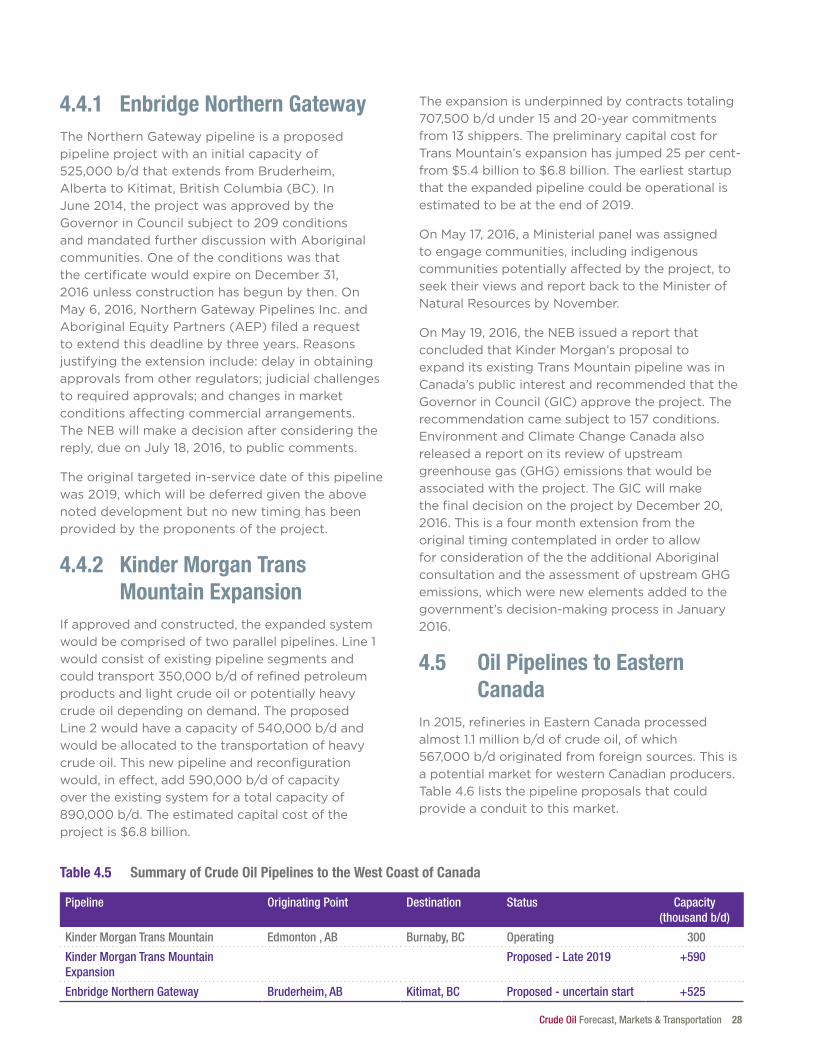
Crude Oil Forecast, Markets & Transportation 28
4.4.1 Enbridge Northern GatewayThe Northern Gateway pipeline is a proposed pipeline project with an initial capacity of 525,000 b/dthatextendsfromBruderheim,AlbertatoKitimat,BritishColumbia(BC).InJune2014,theprojectwasapprovedbytheGovernorinCouncilsubjectto209conditionsand mandated further discussion with Aboriginal communities.OneoftheconditionswasthatthecertificatewouldexpireonDecember31,2016unlessconstructionhasbegunbythen.OnMay 6,2016,NorthernGatewayPipelinesInc.andAboriginalEquityPartners(AEP)filedarequesttoextendthisdeadlinebythreeyears.Reasonsjustifying the extension include: delay in obtaining approvals from other regulators; judicial challenges to required approvals; and changes in market conditions affecting commercial arrangements. TheNEBwillmakeadecisionafterconsideringthereply,dueonJuly18,2016,topubliccomments.
The original targeted in-service date of this pipeline was2019,whichwillbedeferredgiventheabovenoted development but no new timing has been provided by the proponents of the project.
4.4.2 Kinder Morgan Trans Mountain Expansion
Ifapprovedandconstructed,theexpandedsystemwouldbecomprisedoftwoparallelpipelines.Line 1would consist of existing pipeline segments and couldtransport350,000 b/dofrefinedpetroleumproducts and light crude oil or potentially heavy crude oil depending on demand. The proposed Line 2wouldhaveacapacityof540,000 b/dandwould be allocated to the transportation of heavy crude oil. This new pipeline and reconfiguration would,ineffect,add590,000 b/dofcapacityover the existing system for a total capacity of 890,000 b/d.Theestimatedcapitalcostoftheprojectis$6.8 billion.
The expansion is underpinned by contracts totaling 707,500 b/dunder15and20-yearcommitmentsfrom13shippers.ThepreliminarycapitalcostforTransMountain’sexpansionhasjumped25 per cent-from$5.4 billionto$6.8 billion.Theearlieststartupthat the expanded pipeline could be operational is estimatedtobeattheendof2019.
OnMay17,2016,aMinisterialpanelwasassignedto engage communities, including indigenous communities potentially affected by the project, to seek their views and report back to the Minister of NaturalResourcesbyNovember.
OnMay19,2016,theNEBissuedareportthatconcluded that Kinder Morgan’s proposal to expand its existing Trans Mountain pipeline was in Canada’s public interest and recommended that the GovernorinCouncil(GIC)approvetheproject.Therecommendationcamesubjectto157conditions.EnvironmentandClimateChangeCanadaalsoreleased a report on its review of upstream greenhouse gas (GHG) emissions that would be associatedwiththeproject.TheGICwillmakethefinaldecisionontheprojectbyDecember 20,2016.Thisisafourmonthextensionfromtheoriginal timing contemplated in order to allow for consideration of the the additional Aboriginal consultation and the assessment of upstream GHG emissions, which were new elements added to the government’sdecision-makingprocessinJanuary2016.
4.5 Oil Pipelines to Eastern Canada
In2015,refineriesinEasternCanadaprocessedalmost1.1 million b/dofcrudeoil,ofwhich567,000 b/doriginatedfromforeignsources.Thisisa potential market for western Canadian producers. Table 4.6liststhepipelineproposalsthatcouldprovide a conduit to this market.
Table 4.5 Summary of Crude Oil Pipelines to the West Coast of Canada
Pipeline Originating Point Destination Status Capacity(thousand b/d)
Kinder Morgan Trans Mountain Edmonton , AB Burnaby, BC Operating 300
Kinder Morgan Trans Mountain Expansion
Proposed - Late 2019 +590
Enbridge Northern Gateway Bruderheim, AB Kitimat, BC Proposed - uncertain start +525
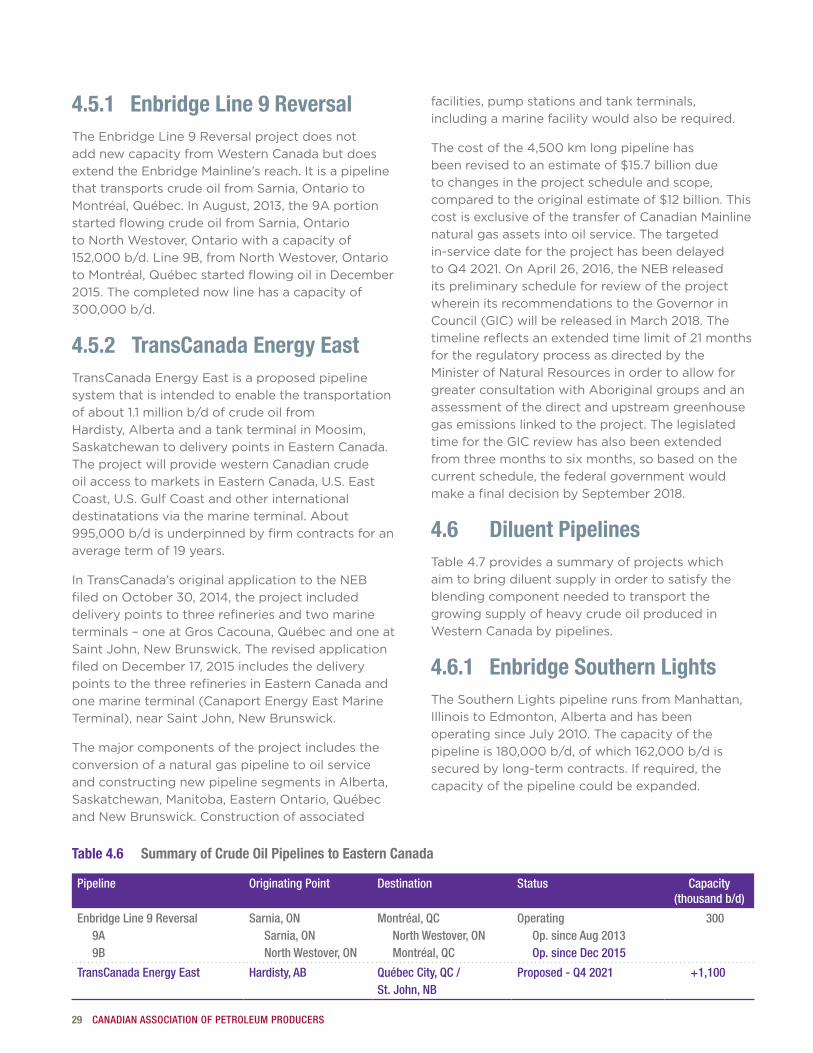
29 CANADIAN ASSOCIATION OF PETROLEUM PRODUCERS
4.5.1 Enbridge Line 9 ReversalTheEnbridgeLine9ReversalprojectdoesnotaddnewcapacityfromWesternCanadabutdoesextendtheEnbridgeMainline’sreach.ItisapipelinethattransportscrudeoilfromSarnia,OntariotoMontréal,Québec.InAugust,2013,the9AportionstartedflowingcrudeoilfromSarnia,OntariotoNorthWestover,Ontariowithacapacityof152,000 b/d.Line9B,fromNorthWestover,OntariotoMontréal,QuébecstartedflowingoilinDecember2015.Thecompletednowlinehasacapacityof300,000 b/d.
4.5.2 TransCanada Energy EastTransCanadaEnergyEastisaproposedpipelinesystem that is intended to enable the transportation ofabout1.1million b/dofcrudeoilfromHardisty, Alberta and a tank terminal in Moosim, SaskatchewantodeliverypointsinEasternCanada.The project will provide western Canadian crude oilaccesstomarketsinEasternCanada,U.S.EastCoast,U.S.GulfCoastandotherinternationaldestinatations via the marine terminal. About 995,000 b/disunderpinnedbyfirmcontractsforanaveragetermof19years.
InTransCanada’soriginalapplicationtotheNEBfiledonOctober30,2014,theprojectincludeddelivery points to three refineries and two marine terminals–oneatGrosCacouna,QuébecandoneatSaintJohn,NewBrunswick.TherevisedapplicationfiledonDecember17,2015includesthedeliverypointstothethreerefineriesinEasternCanadaandonemarineterminal(CanaportEnergyEastMarineTerminal),nearSaintJohn,NewBrunswick.
The major components of the project includes the conversion of a natural gas pipeline to oil service and constructing new pipeline segments in Alberta, Saskatchewan,Manitoba,EasternOntario,QuébecandNewBrunswick.Constructionofassociated
facilities, pump stations and tank terminals, including a marine facility would also be required.
Thecostofthe4,500kmlongpipelinehasbeenrevisedtoanestimateof$15.7billiondueto changes in the project schedule and scope, comparedtotheoriginalestimateof$12billion.Thiscost is exclusive of the transfer of Canadian Mainline natural gas assets into oil service. The targeted in-service date for the project has been delayed toQ4 2021.OnApril26,2016,theNEBreleasedits preliminary schedule for review of the project wherein its recommendations to the Governor in Council(GIC)willbereleasedinMarch2018.Thetimelinereflectsanextendedtimelimitof21monthsfor the regulatory process as directed by the MinisterofNaturalResourcesinordertoallowforgreater consultation with Aboriginal groups and an assessment of the direct and upstream greenhouse gas emissions linked to the project. The legislated timefortheGICreviewhasalsobeenextendedfromthree monthstosixmonths,sobasedonthecurrent schedule, the federal government would makeafinaldecisionbySeptember2018.
4.6 Diluent PipelinesTable 4.7providesasummaryofprojectswhichaim to bring diluent supply in order to satisfy the blending component needed to transport the growing supply of heavy crude oil produced in WesternCanadabypipelines.
4.6.1 Enbridge Southern LightsTheSouthernLightspipelinerunsfromManhattan,IllinoistoEdmonton,AlbertaandhasbeenoperatingsinceJuly2010.Thecapacityofthepipelineis180,000 b/d,ofwhich162,000 b/dissecuredbylong-termcontracts.Ifrequired,thecapacity of the pipeline could be expanded.
Table 4.6 Summary of Crude Oil Pipelines to Eastern Canada
Pipeline Originating Point Destination Status Capacity(thousand b/d)
Enbridge Line 9 Reversal 9A 9B
Sarnia, ON Sarnia, ON North Westover, ON
Montréal, QC North Westover, ON Montréal, QC
Operating Op. since Aug 2013 Op. since Dec 2015
300
TransCanada Energy East Hardisty, AB Québec City, QC / St. John, NB
Proposed - Q4 2021 +1,100
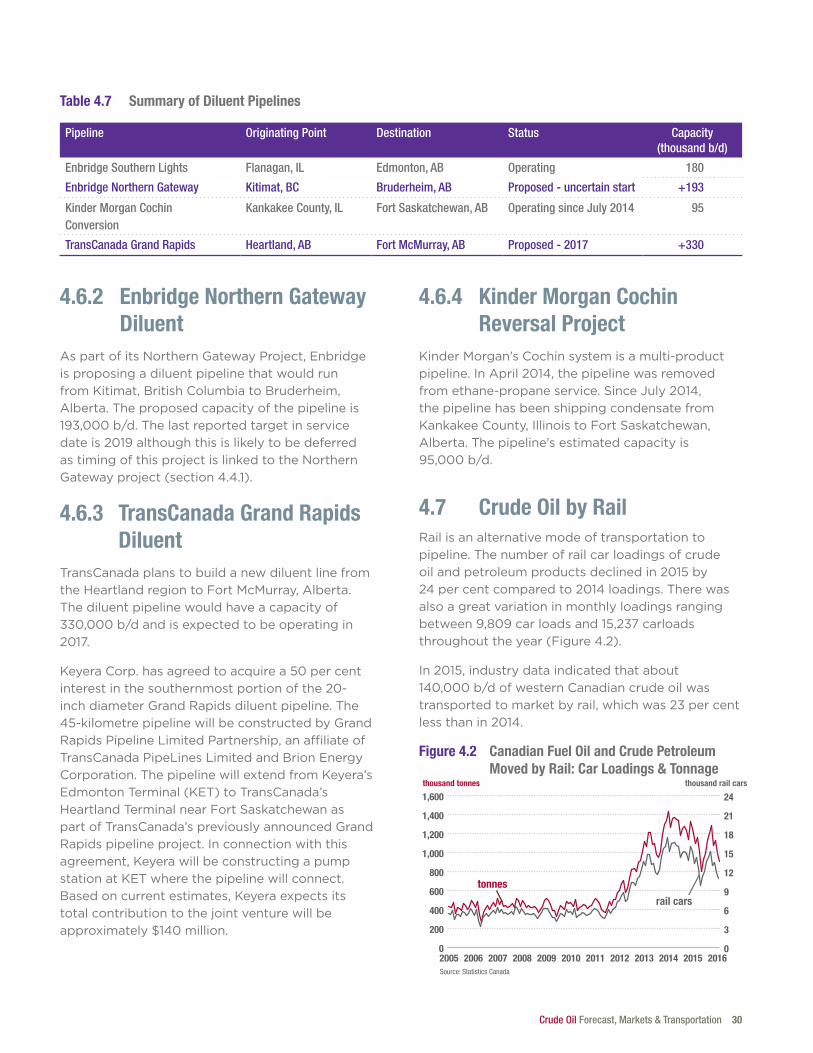
Crude Oil Forecast, Markets & Transportation 30
4.6.2 Enbridge Northern Gateway Diluent
AspartofitsNorthernGatewayProject,Enbridgeis proposing a diluent pipeline that would run fromKitimat,BritishColumbiatoBruderheim,Alberta. The proposed capacity of the pipeline is 193,000 b/d.Thelastreportedtargetinservicedateis2019althoughthisislikelytobedeferredas timing of this project is linked to the Northern Gatewayproject(section4.4.1).
4.6.3 TransCanada Grand Rapids Diluent
TransCanada plans to build a new diluent line from the Heartland region to Fort McMurray, Alberta. The diluent pipeline would have a capacity of 330,000 b/dandisexpectedtobeoperatingin2017.
KeyeraCorp.hasagreedtoacquirea50 per centinterestinthesouthernmostportionofthe20-inchdiameterGrandRapidsdiluentpipeline.The45-kilometrepipelinewillbeconstructedbyGrandRapidsPipelineLimitedPartnership,anaffiliateofTransCanadaPipeLinesLimitedandBrionEnergyCorporation. The pipeline will extend from Keyera’s EdmontonTerminal(KET)toTransCanada’sHeartlandTerminalnearFortSaskatchewanaspart of TransCanada’s previously announced Grand Rapidspipelineproject.Inconnectionwiththisagreement, Keyera will be constructing a pump stationatKETwherethepipelinewillconnect.Basedoncurrentestimates,Keyeraexpectsitstotal contribution to the joint venture will be approximately$140million.
4.6.4 Kinder Morgan Cochin Reversal Project
Kinder Morgan’s Cochin system is a multi-product pipeline.InApril2014,thepipelinewasremovedfromethane-propaneservice.SinceJuly2014,the pipeline has been shipping condensate from KankakeeCounty,IllinoistoFortSaskatchewan,Alberta. The pipeline’s estimated capacity is 95,000 b/d.
4.7 Crude Oil by RailRailisanalternativemodeoftransportationtopipeline. The number of rail car loadings of crude oilandpetroleumproductsdeclinedin2015by24 per centcomparedto2014loadings.Therewasalso a great variation in monthly loadings ranging between9,809carloadsand15,237carloadsthroughouttheyear(Figure 4.2).
In2015,industrydataindicatedthatabout140,000 b/dofwesternCanadiancrudeoilwastransportedtomarketbyrail,whichwas23 per centlessthanin2014.
Figure 4.2 Canadian Fuel Oil and Crude Petroleum Moved by Rail: Car Loadings & Tonnage
Source: Statistics Canada
thousand tonnes
0
200
400
600
800
1,000
1,200
1,400
1,600
2016201520142013201220112010200920082007200620050
3
6
9
12
15
18
21
24
tonnes
rail cars
thousand rail cars
Table 4.7 Summary of Diluent Pipelines
Pipeline Originating Point Destination Status Capacity(thousand b/d)
Enbridge Southern Lights Flanagan, IL Edmonton, AB Operating 180
Enbridge Northern Gateway Kitimat, BC Bruderheim, AB Proposed - uncertain start +193
Kinder Morgan Cochin Conversion
Kankakee County, IL Fort Saskatchewan, AB Operating since July 2014 95
TransCanada Grand Rapids Heartland, AB Fort McMurray, AB Proposed - 2017 +330
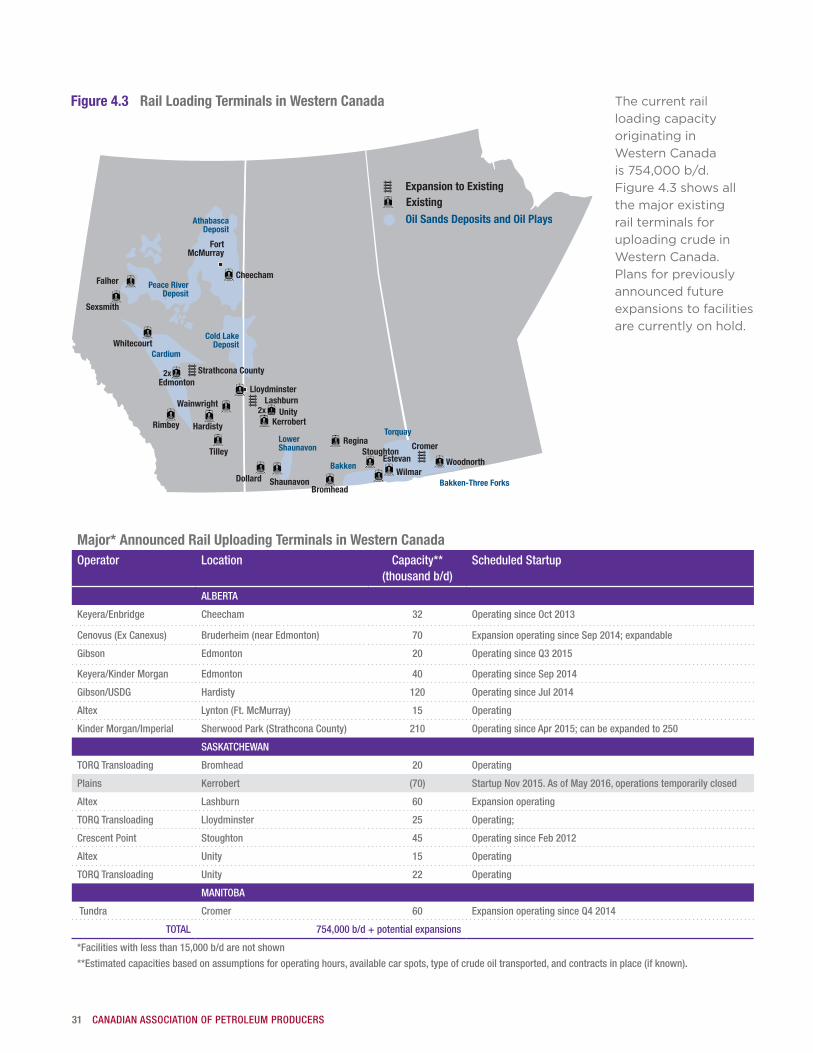
31 CANADIAN ASSOCIATION OF PETROLEUM PRODUCERS
The current rail loading capacity originating in WesternCanadais754,000 b/d.Figure 4.3showsallthe major existing rail terminals for uploading crude in WesternCanada.Plans for previously announced future expansions to facilities are currently on hold.
Figure 4.3 Rail Loading Terminals in Western Canada
Lloydminster
UnityKerrobert
Lashburn
HardistyRimbey
Tilley
Bromhead
Regina
FortMcMurray
AthabascaDeposit
Peace RiverDeposit
Cold LakeDeposit
Cromer
WoodnorthWilmar
EstevanStoughton
Shaunavon
Torquay
Oil Sands Deposits and Oil Plays
Expansion to ExistingExisting
Bakken-Three Forks
Bakken
Whitecourt
Edmonton
Cardium
Falher
Sexsmith
2x
LowerShaunavon
Dollard
Cheecham
Wainwright
Strathcona County
2x
Major* Announced Rail Uploading Terminals in Western CanadaOperator Location Capacity**
(thousand b/d)Scheduled Startup
ALBERTA
Keyera/Enbridge Cheecham 32 Operating since Oct 2013
Cenovus (Ex Canexus) Bruderheim (near Edmonton) 70 Expansion operating since Sep 2014; expandable
Gibson Edmonton 20 Operating since Q3 2015
Keyera/Kinder Morgan Edmonton 40 Operating since Sep 2014
Gibson/USDG Hardisty 120 Operating since Jul 2014
Altex Lynton (Ft. McMurray) 15 Operating
Kinder Morgan/Imperial Sherwood Park (Strathcona County) 210 Operating since Apr 2015; can be expanded to 250
SASKATCHEWAN
TORQ Transloading Bromhead 20 Operating
Plains Kerrobert (70) Startup Nov 2015. As of May 2016, operations temporarily closed
Altex Lashburn 60 Expansion operating
TORQ Transloading Lloydminster 25 Operating;
Crescent Point Stoughton 45 Operating since Feb 2012
Altex Unity 15 Operating
TORQ Transloading Unity 22 Operating
MANITOBA
Tundra Cromer 60 Expansion operating since Q4 2014
TOTAL 754,000 b/d + potential expansions
*Facilities with less than 15,000 b/d are not shown
**Estimated capacities based on assumptions for operating hours, available car spots, type of crude oil transported, and contracts in place (if known).
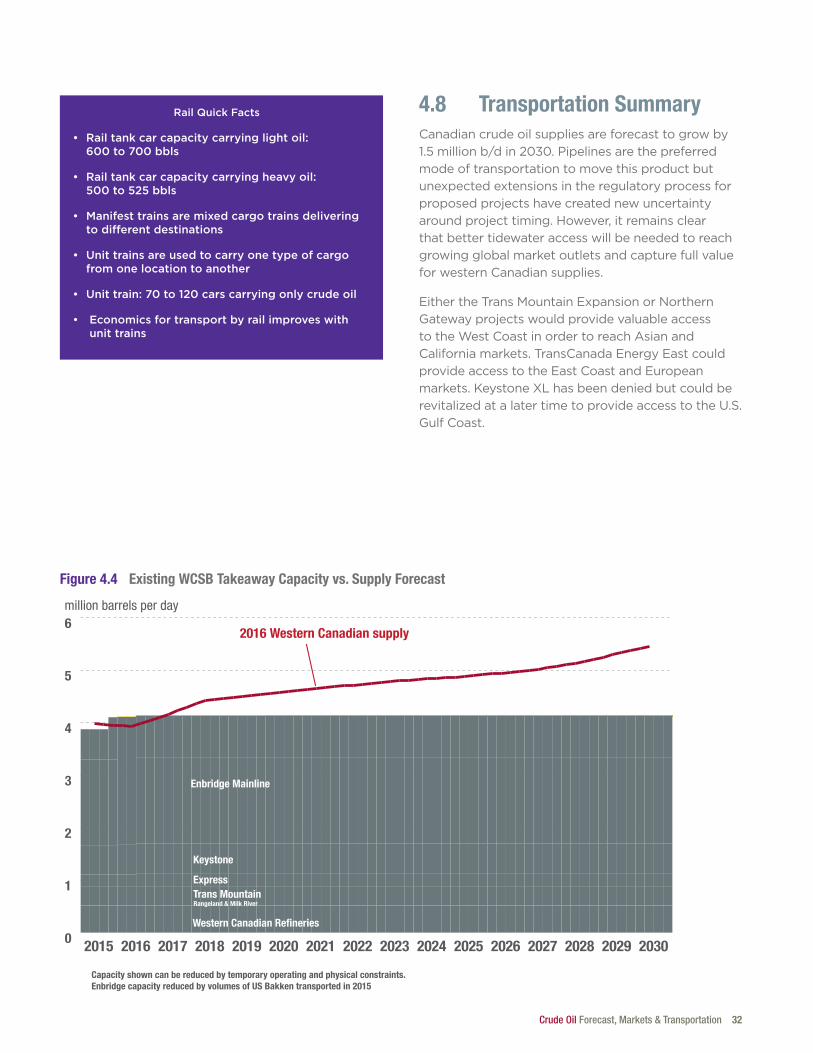
Crude Oil Forecast, Markets & Transportation 32
4.8 Transportation SummaryCanadian crude oil supplies are forecast to grow by 1.5 millionb/din2030.Pipelinesarethepreferredmode of transportation to move this product but unexpected extensions in the regulatory process for proposed projects have created new uncertainty around project timing. However, it remains clear that better tidewater access will be needed to reach growing global market outlets and capture full value for western Canadian supplies.
EithertheTransMountainExpansionorNorthernGateway projects would provide valuable access totheWestCoastinordertoreachAsianandCaliforniamarkets.TransCanadaEnergyEastcouldprovideaccesstotheEastCoastandEuropeanmarkets.KeystoneXLhasbeendeniedbutcouldberevitalizedatalatertimetoprovideaccesstotheU.S.Gulf Coast.
Figure 4.4 Existing WCSB Takeaway Capacity vs. Supply Forecast
0
1
2
3
4
5
6
2030202920282027202620252024202320222021202020192018201720162015
million barrels per day
Western Canadian Refineries
ExpressTrans Mountain
Enbridge Mainline
Rangeland & Milk River
2016 Western Canadian supply
Capacity shown can be reduced by temporary operating and physical constraints.Enbridge capacity reduced by volumes of US Bakken transported in 2015
Keystone
Rail Quick Facts
• Rail tank car capacity carrying light oil: 600 to 700 bbls
• Rail tank car capacity carrying heavy oil: 500 to 525 bbls
• Manifest trains are mixed cargo trains delivering to different destinations
• Unit trains are used to carry one type of cargo from one location to another
• Unit train: 70 to 120 cars carrying only crude oil
• Economics for transport by rail improves with unit trains
33 CANADIAN ASSOCIATION OF PETROLEUM PRODUCERS
GLOSSARYAsphalt plant A facility that processes crude oil into various types and grades of asphalt, ranging from
dust-abatement road oils to highway-grade asphalt, to roofing tar.
APIGravity AspecificgravityscaledevelopedbytheAmericanPetroleumInstitute(API)formeasuring the relative density or viscosity of various petroleum liquids.
Barrel Astandardoilbarrelisapproximatelyequalto35Imperialgallons(42U.S.gallons)orapproximately159litres.
Bitumen Aheavy,viscousoilthatmustbeprocessedextensivelytoconvertitintoacrudeoilbefore it can be used by refineries to produce gasoline and other petroleum products.
Coker The processing unit in which bitumen is cracked into lighter fractions and withdrawn to start the conversion of bitumen into upgraded crude oil.
Condensate Amixtureofmainlypentanesandheavierhydrocarbons.U.S.condensateisdividedintotwo broad categories. The first is lease condensate produced at or near the wellhead (either natural gas or crude oil). The second category is plant condensate, also known asNGLs,naturalgasoline,pentanesplusorC5+,thatremainsuspendedinnaturalgasatthe wellhead and is removed at a gas processing plant. For purposes of this report, both categoriesareincludedintheterm”condensate”.BothcategoriesofcondensatearesubstantiallysimilarincompositionbuttheU.S.EIAarbitrarilydefinesleasecondensateas crude oil and plant condensate as an NGL (pentanes plus). Furthermore, Department ofCommerce-BureauofIndustryandSecurity(BIS)regulationsalsodefineleasecondensate as crude oil.
Crude oil (Conventional) A mixture of pentanes and heavier hydrocarbons that is recovered or is recoverable at a wellfromanundergroundreservoir.Itisliquidattheconditionsunderwhichitsvolumesis measured or estimated and includes all other hydrocarbon mixtures so recovered or recoverable except raw gas, condensate, or bitumen.
Crudeoil(heavy) Crudeoilisdeemed,inthisreport,tobeheavycrudeoilifithasanAPIof27ºorless. No differentiation is made between sweet and sour crude oil that falls in the heavy category because heavy crude oil is generally sour.
Crudeoil(medium) Crudeoilisdeemed,inthisreport,tobemediumcrudeoilifithasanAPIgreaterthan27ºbutlessthan30º.Nodifferentiationismadebetweensweetandsourcrudeoilthatfalls in the medium category because medium crude oil is generally sour.
Crude oil (synthetic) A mixture of hydrocarbons, similar to crude oil, derived by upgrading bitumen from the oil sands.
Density The mass of matter per unit volume.
DilBit Bitumenthathasbeenreducedinviscositythroughadditionofadiluent(orsolvent)such as condensate or naphtha.
Diluent Lighter viscosity petroleum products that are used to dilute bitumen for transportation in pipelines.
Extraction Aprocessuniquetotheoilsandsindustry,inwhichbitumenisseparatedfromtheirsource (oil sands).
Crude Oil Forecast, Markets & Transportation 34
Feedstock Inthisreport,feedstockreferstotherawmaterialsuppliedtoarefineryoroilsandsupgrader.
Integratedmining Acombinedminingandupgradingoperationwhereoilsandsareminedfromopenpits. project The bitumen is then separated from the sand and upgraded by a refining process.
In situ recovery The process of recovering crude bitumen from oil sands by drilling.
Merchant upgrader Processing facilities that are not linked to any specific extraction project but is designed to accept raw bitumen on a contract basis from producers.
Oil Condensate,crudeoil,oraconstituentofrawgas,condensate,orcrudeoilthatisrecovered in processing and is liquid at the conditions under which its volume is measured or estimated.
Oilsands Referstoamixtureofsandandotherrockmaterialscontainingcrudebitumenorthecrude bitumen contained in those sands.
OilSandsDeposit Anaturalreservoircontainingorappearingtocontainanaccumulationofoilsandsseparatedorappearingtobeseparatedfromanyothersuchaccumulation.TheAERhas designated three areas in Alberta as oil sands areas.
OilSandsHeavy Inthisreport,OilSandsHeavyincludesupgradedheavysourcrudeoil,andbitumentowhich light oil fractions (i.e. diluent or upgraded crude oil) have been added in order to reduce its viscosity and density to meet pipeline specifications.
OpenSeason Aperiodoftimedesignatedbyapipelinecompanytodetermineshipperinterestonaproposedproject.Potentialcustomerscanindicatetheirinterest/supportbysigningatransportation services agreement for capacity on the pipeline.
Pentanes Plus A mixture mainly of pentanes and heavier hydrocarbons that ordinarily may contain some butanes and is obtained from the processing of raw gas, condensate or crude oil.
PADD Petroleum Administration for Defense District that defines a market area for crude oil in theU.S.
RefinedPetroleum Endproductsintherefiningprocess(e.g.,gasoline). Products
Specification Definedpropertiesofacrudeoilorrefinedpetroleumproduct.
SynBit Ablendofbitumenandsyntheticcrudeoilthathassimilarpropertiestomediumsourcrude oil.
Train (Manifest) Manifest trains carry multiple cargoes and make multiple stops. These are small group or single car load.
Train(Unit) Unittrainscarryasinglecargoanddeliverasingleshipmenttoonedestination,lowering the cost and shortening the trip.
Upgrading Theprocessthatconvertsbitumenorheavycrudeoilintoaproductwithalowerdensity and viscosity.
WestTexasIntermediate WTIisalightsweetcrudeoil,producedintheUnitedStates,whichisthebenchmarkgrade of crude oil for North American price quotations.
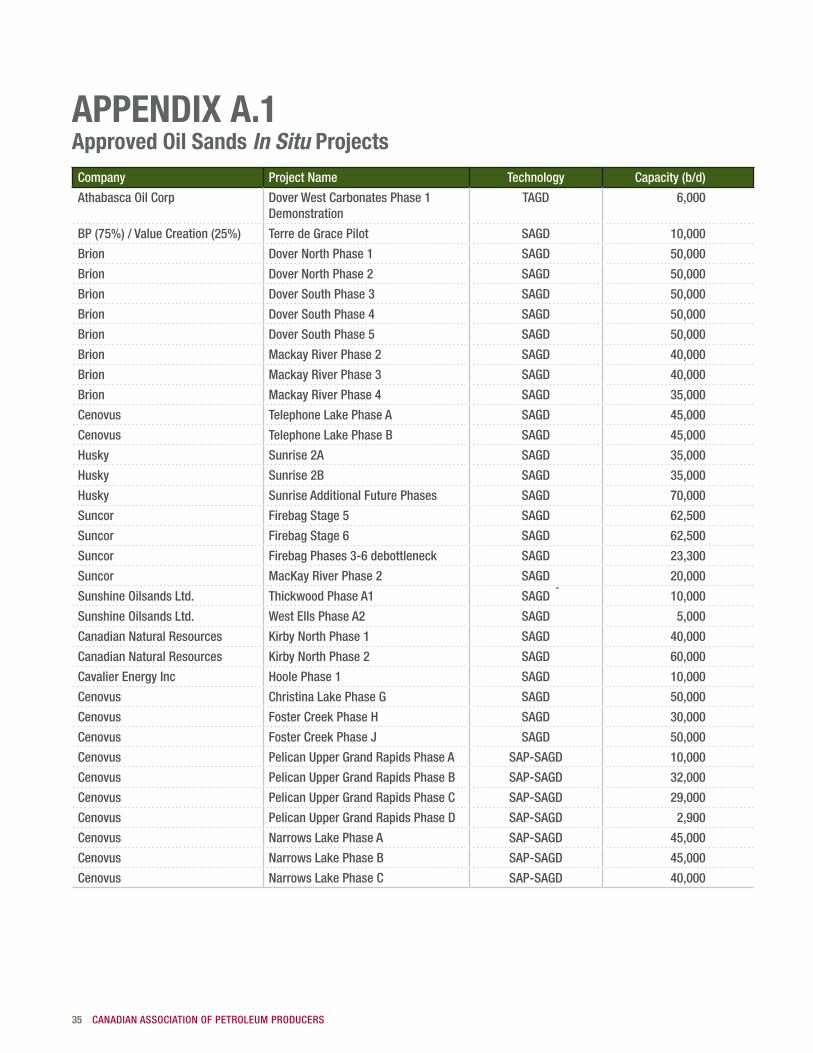
35 CANADIAN ASSOCIATION OF PETROLEUM PRODUCERS
APPENDIX A.1 Approved Oil Sands In Situ ProjectsCompany Project Name Technology Capacity (b/d)
Athabasca Oil Corp Dover West Carbonates Phase 1 Demonstration
TAGD 6,000
BP (75%) / Value Creation (25%) Terre de Grace Pilot SAGD 10,000
Brion Dover North Phase 1 SAGD 50,000
Brion Dover North Phase 2 SAGD 50,000
Brion Dover South Phase 3 SAGD 50,000
Brion Dover South Phase 4 SAGD 50,000
Brion Dover South Phase 5 SAGD 50,000
Brion Mackay River Phase 2 SAGD 40,000
Brion Mackay River Phase 3 SAGD 40,000
Brion Mackay River Phase 4 SAGD 35,000
Cenovus Telephone Lake Phase A SAGD 45,000
Cenovus Telephone Lake Phase B SAGD 45,000
Husky Sunrise 2A SAGD 35,000
Husky Sunrise 2B SAGD 35,000
Husky Sunrise Additional Future Phases SAGD 70,000
Suncor Firebag Stage 5 SAGD 62,500
Suncor Firebag Stage 6 SAGD 62,500
Suncor Firebag Phases 3-6 debottleneck SAGD 23,300
Suncor MacKay River Phase 2 SAGD 20,000
Sunshine Oilsands Ltd. Thickwood Phase A1 SAGD 10,000
Sunshine Oilsands Ltd. West Ells Phase A2 SAGD 5,000
Canadian Natural Resources Kirby North Phase 1 SAGD 40,000
Canadian Natural Resources Kirby North Phase 2 SAGD 60,000
Cavalier Energy Inc Hoole Phase 1 SAGD 10,000
Cenovus Christina Lake Phase G SAGD 50,000
Cenovus Foster Creek Phase H SAGD 30,000
Cenovus Foster Creek Phase J SAGD 50,000
Cenovus Pelican Upper Grand Rapids Phase A SAP-SAGD 10,000
Cenovus Pelican Upper Grand Rapids Phase B SAP-SAGD 32,000
Cenovus Pelican Upper Grand Rapids Phase C SAP-SAGD 29,000
Cenovus Pelican Upper Grand Rapids Phase D SAP-SAGD 2,900
Cenovus Narrows Lake Phase A SAP-SAGD 45,000
Cenovus Narrows Lake Phase B SAP-SAGD 45,000
Cenovus Narrows Lake Phase C SAP-SAGD 40,000
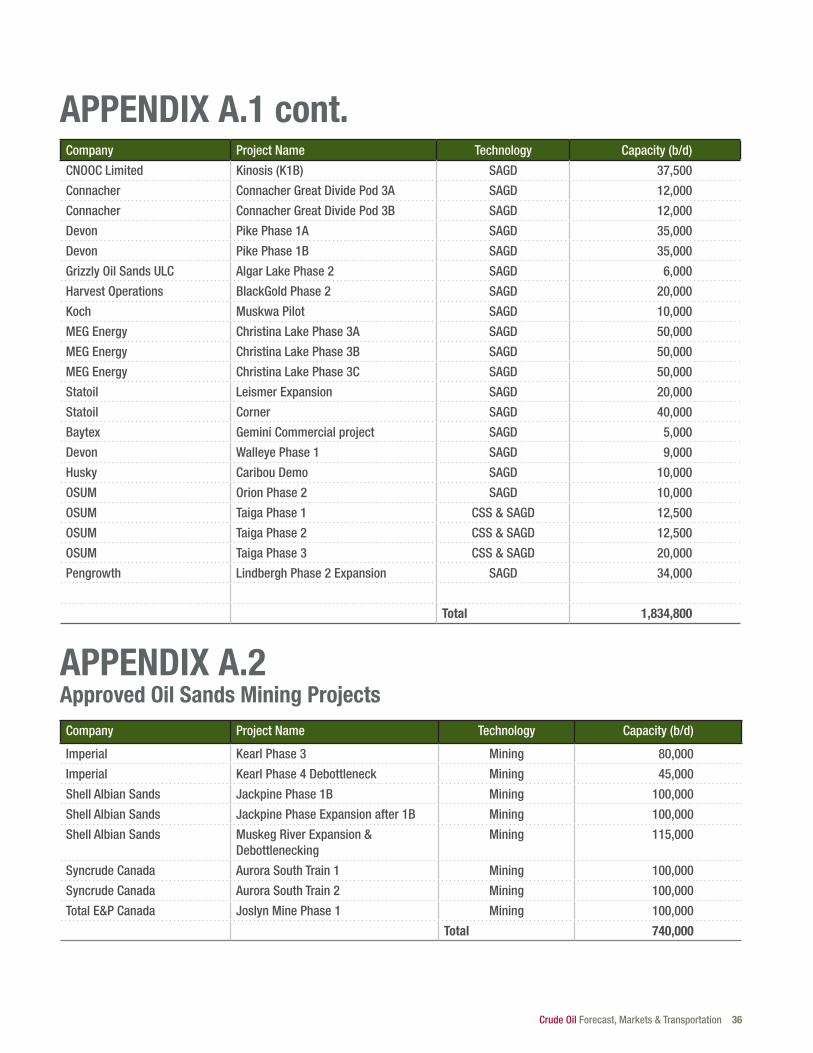
Crude Oil Forecast, Markets & Transportation 36
APPENDIX A.1 cont. Company Project Name Technology Capacity (b/d)
CNOOC Limited Kinosis (K1B) SAGD 37,500
Connacher Connacher Great Divide Pod 3A SAGD 12,000
Connacher Connacher Great Divide Pod 3B SAGD 12,000
Devon Pike Phase 1A SAGD 35,000
Devon Pike Phase 1B SAGD 35,000
Grizzly Oil Sands ULC Algar Lake Phase 2 SAGD 6,000
Harvest Operations BlackGold Phase 2 SAGD 20,000
Koch Muskwa Pilot SAGD 10,000
MEG Energy Christina Lake Phase 3A SAGD 50,000
MEG Energy Christina Lake Phase 3B SAGD 50,000
MEG Energy Christina Lake Phase 3C SAGD 50,000
Statoil Leismer Expansion SAGD 20,000
Statoil Corner SAGD 40,000
Baytex Gemini Commercial project SAGD 5,000
Devon Walleye Phase 1 SAGD 9,000
Husky Caribou Demo SAGD 10,000
OSUM Orion Phase 2 SAGD 10,000
OSUM Taiga Phase 1 CSS & SAGD 12,500
OSUM Taiga Phase 2 CSS & SAGD 12,500
OSUM Taiga Phase 3 CSS & SAGD 20,000
Pengrowth Lindbergh Phase 2 Expansion SAGD 34,000
Total 1,834,800
APPENDIX A.2 Approved Oil Sands Mining ProjectsCompany Project Name Technology Capacity (b/d)
Imperial Kearl Phase 3 Mining 80,000
Imperial Kearl Phase 4 Debottleneck Mining 45,000
Shell Albian Sands Jackpine Phase 1B Mining 100,000
Shell Albian Sands Jackpine Phase Expansion after 1B Mining 100,000
Shell Albian Sands Muskeg River Expansion & Debottlenecking
Mining 115,000
Syncrude Canada Aurora South Train 1 Mining 100,000
Syncrude Canada Aurora South Train 2 Mining 100,000
Total E&P Canada Joslyn Mine Phase 1 Mining 100,000
Total 740,000
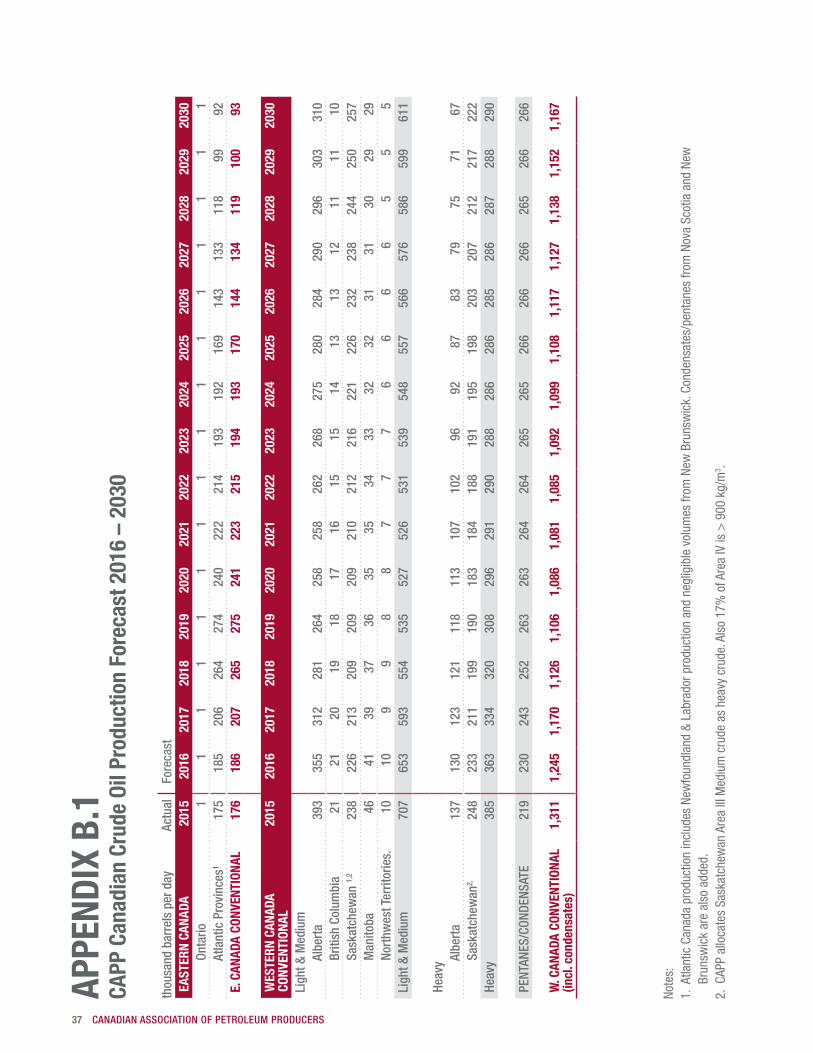
37 CANADIAN ASSOCIATION OF PETROLEUM PRODUCERS
APPE
NDIX
B.1
CA
PP C
anad
ian
Crud
e Oi
l Pro
duct
ion
Fore
cast
201
6 –
2030
thou
sand
bar
rels
per
day
Ac
tual
Fo
reca
stEA
STER
N CA
NADA
2015
2016
2017
2018
2019
2020
2021
2022
2023
2024
2025
2026
2027
2028
2029
2030
O
ntar
io1
11
11
11
11
11
11
11
1
Atla
ntic
Pro
vinc
es1
175
1
85
206
2
64
274
2
40
222
2
14
193
1
92
169
1
43
133
1
18
99
92
E. C
ANAD
A CO
NVEN
TION
AL17
618
620
726
527
524
122
321
519
419
317
014
413
411
910
093
WES
TERN
CAN
ADA
CONV
ENTI
ONAL
2015
2016
2017
2018
2019
2020
2021
2022
2023
2024
2025
2026
2027
2028
2029
2030
Ligh
t & M
ediu
m
Alb
erta
393
355
312
281
264
258
258
262
268
275
280
284
290
296
303
310
B
ritis
h Co
lum
bia
2121
2019
1817
1615
1514
1313
1211
1110
S
aska
tche
wan
1,2
238
226
213
209
209
209
210
212
216
221
226
232
238
244
250
257
M
anito
ba46
4139
3736
3535
3433
3232
3131
3029
29
Nor
thw
est T
errit
orie
s.10
109
98
87
77
66
66
55
5Li
ght &
Med
ium
707
653
593
554
535
527
526
531
539
548
557
566
576
586
599
611
Heav
y
Alb
erta
13
713
012
312
111
811
310
710
296
9287
8379
7571
67
Sas
katc
hew
an2,
248
233
211
199
190
183
184
188
191
195
198
203
207
212
217
222
Heav
y38
536
333
432
030
829
629
129
028
828
628
628
528
628
728
829
0
PENT
ANES
/CON
DENS
ATE
219
230
243
252
263
263
264
264
265
265
266
266
266
265
266
266
W. C
ANAD
A CO
NVEN
TION
AL
(incl
. con
dens
ates
)1,
311
1,24
51,
170
1,12
61,
106
1,08
61,
081
1,08
51,
092
1,09
91,
108
1,11
71,
127
1,13
81,
152
1,16
7
Note
s:
1. A
tlant
ic C
anad
a pr
oduc
tion
incl
udes
New
foun
dlan
d &
Labr
ador
pro
duct
ion
and
negl
igib
le v
olum
es fr
om N
ew B
runs
wic
k. C
onde
nsat
es/p
enta
nes
from
Nov
a Sc
otia
and
New
Br
unsw
ick
are
also
add
ed.
2. C
APP
allo
cate
s Sa
skat
chew
an A
rea
III M
ediu
m c
rude
as
heav
y cr
ude.
Als
o 17
% o
f Are
a IV
is >
900
kg/
m3 .
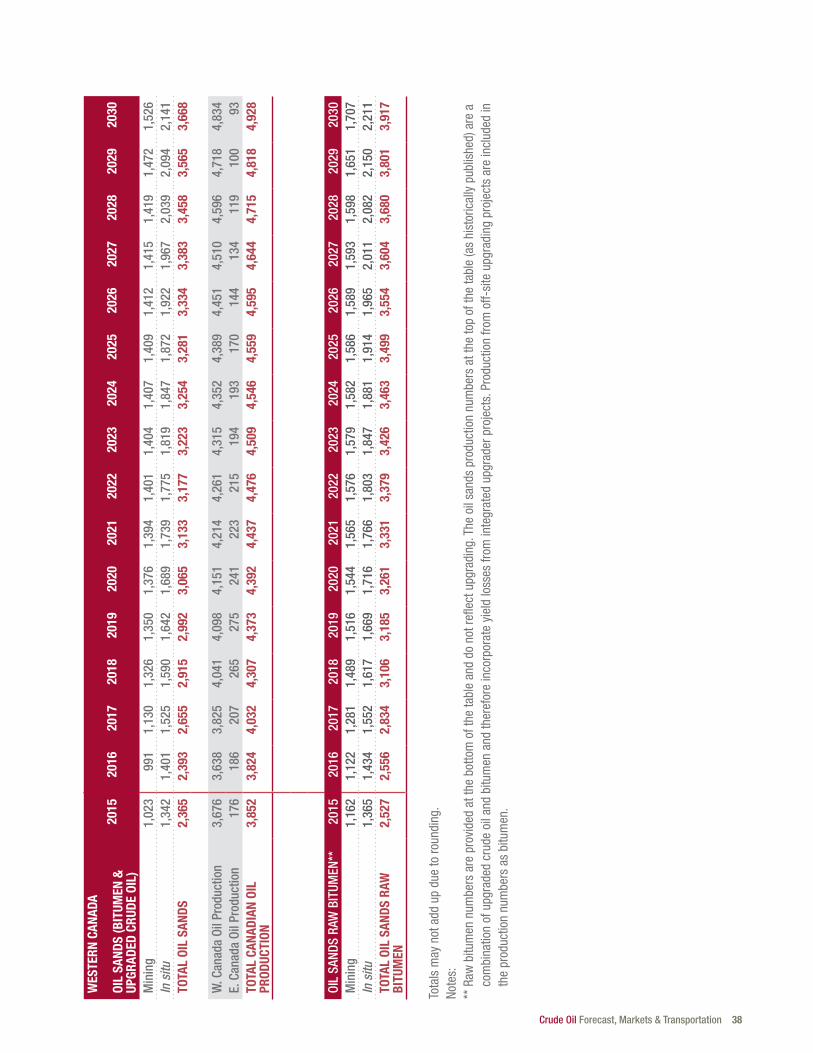
Crude Oil Forecast, Markets & Transportation 38
Tota
ls m
ay n
ot a
dd u
p du
e to
roun
ding
. No
tes:
**
Raw
bitu
men
num
bers
are
pro
vide
d at
the
botto
m o
f the
tabl
e an
d do
not
refle
ct u
pgra
ding
. The
oil
sand
s pr
oduc
tion
num
bers
at t
he to
p of
the
tabl
e (a
s hi
stor
ical
ly p
ublis
hed)
are
a
com
bina
tion
of u
pgra
ded
crud
e oi
l and
bitu
men
and
ther
efor
e in
corp
orat
e yi
eld
loss
es fr
om in
tegr
ated
upg
rade
r pro
ject
s. P
rodu
ctio
n fro
m o
ff-si
te u
pgra
ding
pro
ject
s ar
e in
clud
ed in
th
e pr
oduc
tion
num
bers
as
bitu
men
.
WES
TERN
CAN
ADA
OIL
SAND
S (B
ITUM
EN &
UP
GRAD
ED C
RUDE
OIL
)20
1520
1620
1720
1820
1920
2020
2120
2220
2320
2420
2520
2620
2720
2820
2920
30
Min
ing
1,0
23
991
1
,130
1
,326
1
,350
1
,376
1
,394
1
,401
1
,404
1
,407
1
,409
1
,412
1
,415
1
,419
1
,472
1
,526
In
situ
1,3
42
1,4
01
1,5
25
1,5
90
1,6
42
1,6
89
1,7
39
1,7
75
1,8
19
1,8
47
1,8
72
1,9
22
1,9
67
2,0
39
2,0
94
2,1
41
TOTA
L OI
L SA
NDS
2,3
65
2,3
93
2,6
55
2,9
15
2,9
92
3,0
65
3,1
33
3,1
77
3,2
23
3,2
54
3,2
81
3,3
34
3,3
83
3,4
58
3,5
65
3,6
68
W. C
anad
a Oi
l Pro
duct
ion
3,67
63,
638
3,82
54,
041
4,09
84,
151
4,21
44,
261
4,31
54,
352
4,38
94,
451
4,51
04,
596
4,71
84,
834
E. C
anad
a Oi
l Pro
duct
ion
176
186
207
265
275
241
223
215
194
193
170
144
134
119
100
93TO
TAL
CANA
DIAN
OIL
PR
ODUC
TION
3,85
23,
824
4,03
24,
307
4,37
34,
392
4,43
74,
476
4,50
94,
546
4,55
94,
595
4,64
44,
715
4,81
84,
928
OIL
SAND
S RA
W B
ITUM
EN**
2015
2016
2017
2018
2019
2020
2021
2022
2023
2024
2025
2026
2027
2028
2029
2030
Min
ing
1,16
21,
122
1,28
11,
489
1,51
61,
544
1,56
51,
576
1,57
91,
582
1,58
61,
589
1,59
31,
598
1,65
11,
707
In s
itu1,
365
1,43
41,
552
1,61
71,
669
1,71
61,
766
1,80
31,
847
1,88
11,
914
1,96
52,
011
2,08
22,
150
2,21
1TO
TAL
OIL
SAND
S RA
W
BITU
MEN
2,52
72,
556
2,83
43,
106
3,18
53,
261
3,33
13,
379
3,42
63,
463
3,49
93,
554
3,60
43,
680
3,80
13,
917
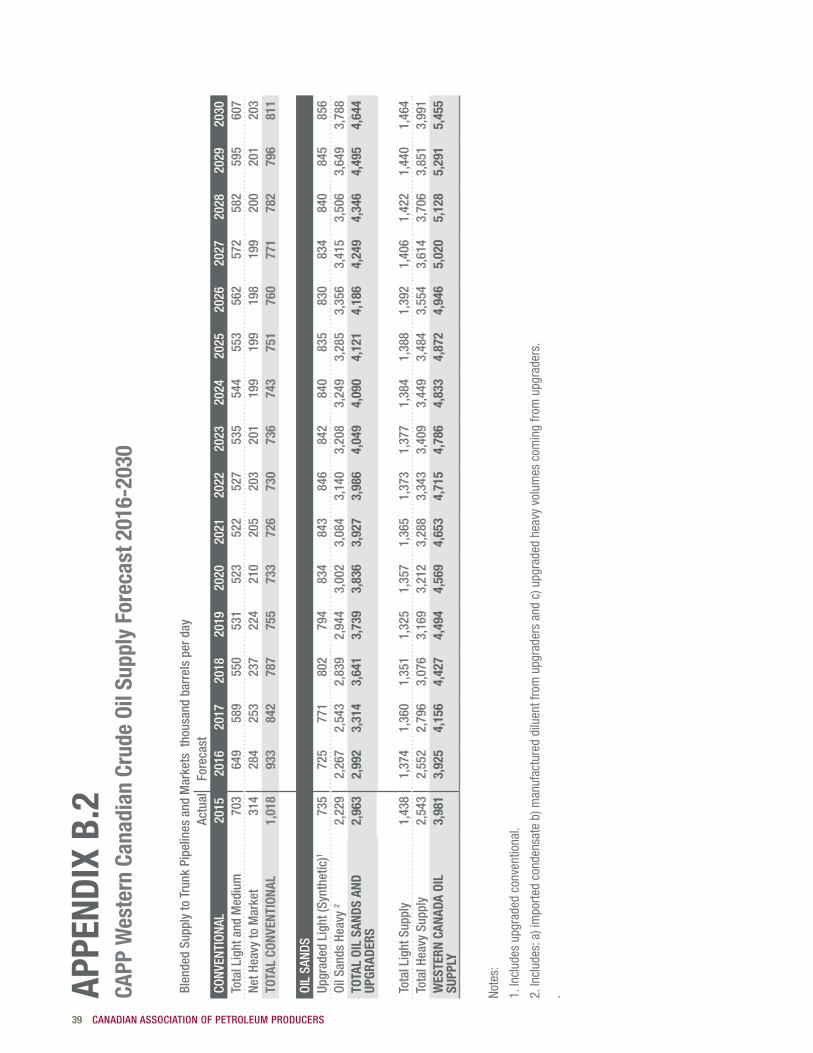
39 CANADIAN ASSOCIATION OF PETROLEUM PRODUCERS
APPE
NDIX
B.2
CAPP
Wes
tern
Can
adia
n Cr
ude
Oil S
uppl
y Fo
reca
st 2
016-
2030
Blen
ded
Supp
ly to
Tru
nk P
ipel
ines
and
Mar
kets
tho
usan
d ba
rrel
s pe
r day
A
ctua
l F
orec
ast
CONV
ENTI
ONAL
2015
2016
2017
2018
2019
2020
2021
2022
2023
2024
2025
2026
2027
2028
2029
2030
Tota
l Lig
ht a
nd M
ediu
m70
364
958
955
053
152
352
252
753
554
455
356
257
258
259
560
7Ne
t Hea
vy to
Mar
ket
314
284
253
237
224
210
205
203
201
199
199
198
199
200
201
203
TOTA
L CO
NVEN
TION
AL1,
018
933
842
787
755
733
726
730
736
743
751
760
771
782
796
811
OIL
SAND
SUp
grad
ed L
ight
(Syn
thet
ic)1
735
725
771
802
794
834
843
846
842
840
835
830
834
840
845
856
Oil S
ands
Hea
vy 2
2,22
92,
267
2,54
32,
839
2,94
43,
002
3,08
43,
140
3,20
83,
249
3,28
53,
356
3,41
53,
506
3,64
93,
788
TOTA
L OI
L SA
NDS
AND
UPGR
ADER
S2,
963
2,99
23,
314
3,64
13,
739
3,83
63,
927
3,98
64,
049
4,09
04,
121
4,18
64,
249
4,34
64,
495
4,64
4
Tota
l Lig
ht S
uppl
y1,
438
1,37
41,
360
1,35
11,
325
1,35
71,
365
1,37
31,
377
1,38
41,
388
1,39
21,
406
1,42
21,
440
1,46
4To
tal H
eavy
Sup
ply
2,54
32,
552
2,79
63,
076
3,16
93,
212
3,28
83,
343
3,40
93,
449
3,48
43,
554
3,61
43,
706
3,85
13,
991
WES
TERN
CAN
ADA
OIL
SUPP
LY3,
981
3,92
54,
156
4,42
74,
494
4,56
94,
653
4,71
54,
786
4,83
34,
872
4,94
65,
020
5,12
85,
291
5,45
5
Note
s:
1. In
clud
es u
pgra
ded
conv
entio
nal.
2. In
clud
es: a
) im
porte
d co
nden
sate
b) m
anuf
actu
red
dilu
ent f
rom
upg
rade
rs a
nd c
) upg
rade
d he
avy
volu
mes
com
ing
from
upg
rade
rs.
.
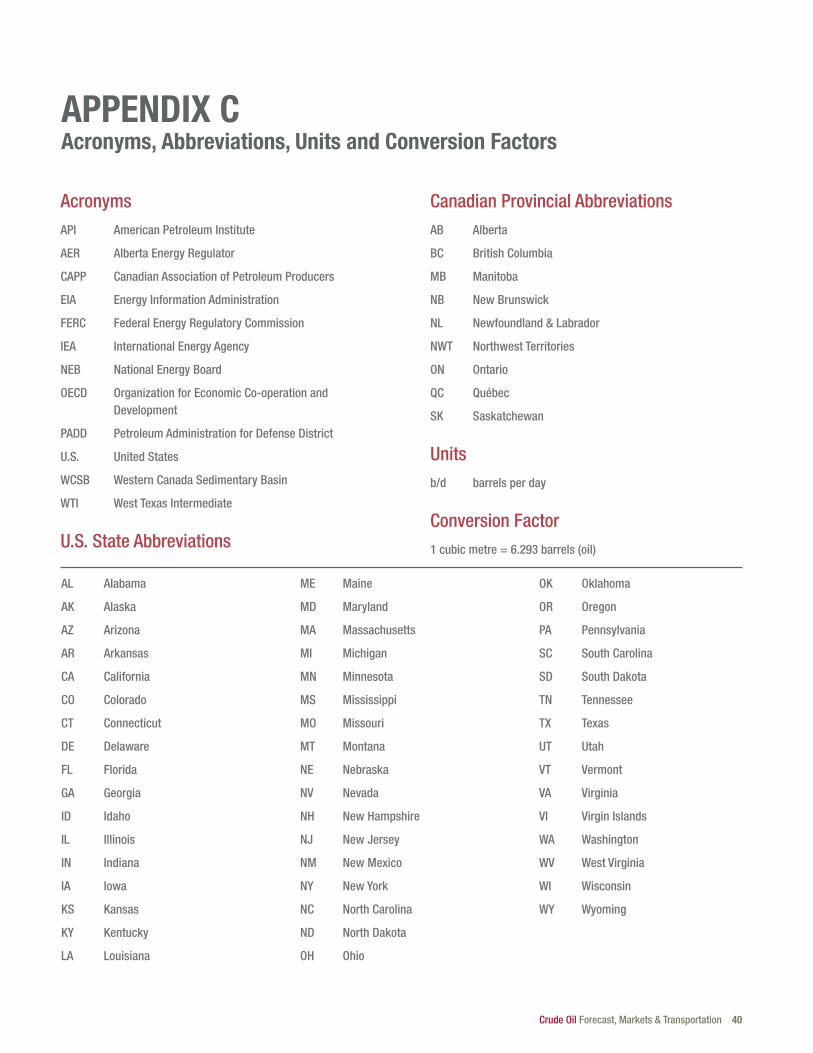
Crude Oil Forecast, Markets & Transportation 40
Acronyms API American Petroleum Institute
AER Alberta Energy Regulator
CAPP Canadian Association of Petroleum Producers
EIA Energy Information Administration
FERC Federal Energy Regulatory Commission
IEA International Energy Agency
NEB National Energy Board
OECD Organization for Economic Co-operation and Development
PADD Petroleum Administration for Defense District
U.S. United States
WCSB Western Canada Sedimentary Basin
WTI West Texas Intermediate
U.S. State Abbreviations
AL Alabama
AK Alaska
AZ Arizona
AR Arkansas
CA California
CO Colorado
CT Connecticut
DE Delaware
FL Florida
GA Georgia
ID Idaho
IL Illinois
IN Indiana
IA Iowa
KS Kansas
KY Kentucky
LA Louisiana
ME Maine
MD Maryland
MA Massachusetts
MI Michigan
MN Minnesota
MS Mississippi
MO Missouri
MT Montana
NE Nebraska
NV Nevada
NH New Hampshire
NJ New Jersey
NM New Mexico
NY New York
NC North Carolina
ND North Dakota
OH Ohio
OK Oklahoma
OR Oregon
PA Pennsylvania
SC South Carolina
SD South Dakota
TN Tennessee
TX Texas
UT Utah
VT Vermont
VA Virginia
VI Virgin Islands
WA Washington
WV West Virginia
WI Wisconsin
WY Wyoming
APPENDIX CAcronyms, Abbreviations, Units and Conversion Factors
Canadian Provincial AbbreviationsAB Alberta
BC British Columbia
MB Manitoba
NB New Brunswick
NL Newfoundland & Labrador
NWT Northwest Territories
ON Ontario
QC Québec
SK Saskatchewan
Unitsb/d barrels per day
Conversion Factor1 cubic metre = 6.293 barrels (oil)
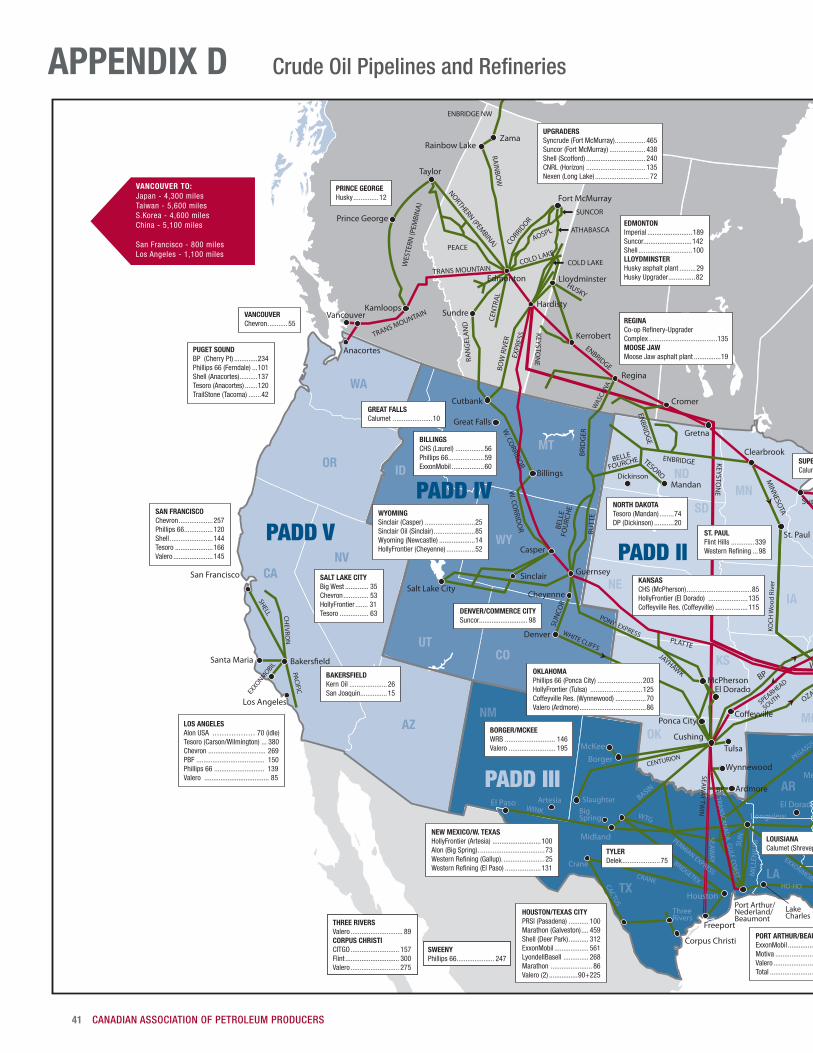
41 CANADIAN ASSOCIATION OF PETROLEUM PRODUCERS
FOR INFORMATION CONTACT: (403) 267-1141 / CAPP.CA
PADD V
PADD IV
PADD II
PADD III PADD I
PADD
WA
ORMT
CO
IA
WI
IN
NE
NM
GA
MS
ID
UT
NVCA
AZ
TX
OK
NDMN
SD
KS
WY
NC
KY
SC
IL
MI
MO
AR
AL
OH
TN
LA
VAWVDEMD
PA
NY
NH
MA
CT
VT
ME
NJ
RI
VANCOUVER TO:Japan - 4,300 milesTaiwan - 5,600 milesS.Korea - 4,600 milesChina - 5,100 miles
San Francisco - 800 milesLos Angeles - 1,100 miles
2015 CANADIAN CRUDE OIL PRODUCTION 000 m3/d 000 b/d
British Columbia 9 55Alberta 489 3,080Saskatchewan 77 487Manitoba 7 46Northwest Territories 2 10
Western Canada 584 3,676Eastern Canada 28 176Total Canada 612 3,852
Major Existing Crude Oil Pipelines carryingCanadian crude oil
Selected Other Crude Oil Pipelines
Crude Refining Capacities as at June 1, 2016(thousand barrels per day)
Petroleum Administration for Defense District
Dickinson
Flanagan PhiladelphiaNewell
Port Arthur/Nederland/Beaumont
ArtesiaBigSpring
Slaughter
ThreeRivers
Crane
FL
CENTURION
WAS
CANA
SPEARHEAD
SOUTH
PONY EXPRESSWHITE CLIFFS
TRANSCAN
ADA G
ULF CO
AST
SEAWAY TW
IN
ENBRIDGE LINE 9
KIAN
TON
E
PEGASUS
Come by Chance
LakeCharles
St.James
reviR dooW
HCOK
SHELL CHEVRO
NPACIFIC
EXXONMOBIL
BRIDGETEX
PERMIAN EXPRESSCRANE
HO-HOCACTUS
EXXONM
OBILKEYSTO
NE
KEYSTON
E
HUSKY
RAIN
BOW
ENBRIDGE NW
Saint John
Montréal
Westover
MONTREAL
VANCOUVERChevron........... 55
PUGET SOUNDBP (Cherry Pt) .............234Phillips 66 (Ferndale) ...101Shell (Anacortes)..........137Tesoro (Anacortes) .......120TrailStone (Tacoma) .......42
SAN FRANCISCOChevron...................257Phillips 66................120Shell ........................144Tesoro .....................166Valero ......................145
BAKERSFIELDKern Oil .....................26San Joaquin...............15
GREAT FALLSCalumet ......................10
BILLINGSCHS (Laurel) ................56Phillips 66....................59ExxonMobil ..................60
LOS ANGELESAlon USA .. . . . . . . . . . . . . . . . . 70 (idle)Tesoro (Carson/Wilmington) ... 380Chevron ................................ 269PBF ...................................... 150Phillips 66 ............................ 139Valero .................................... 85
EDMONTONImperial .........................189Suncor...........................142Shell ..............................100LLOYDMINSTERHusky asphalt plant .........29Husky Upgrader...............82
REGINA
Complex ......................................135MOOSE JAWMoose Jaw asphalt plant ...............19
WYOMINGSinclair (Casper) ............................25Sinclair Oil (Sinclair).......................85Wyoming (Newcastle) ....................14HollyFrontier (Cheyenne) ................52
OHIOBP-Husky (Toledo)........................160PBF (Toledo).................................170Marathon (Canton) .........................93Husky (Lima)................................160Marathon (Catlettsburg) ...............273
MISSISSIPPI RIVERExxonMobil (Baton Rouge) ...........503PBF (Chalmette)...........................189Marathon (Garyville).....................539Motiva (Convent)..........................230Motiva (Norco) .............................235Valero (Norco) ..............................215Valero (Meraux)............................125Phillips 66 (Belle Chasse).............247Alon (Krotz Springs) .......................74Placid (Port Allen)...........................60
HOUSTON/TEXAS CITYPRSI (Pasadena) ........... 100Marathon (Galveston).... 459Shell (Deer Park)........... 312ExxonMobil ................... 561LyondellBasell .............. 268Marathon ....................... 86Valero (2) ................90+225
ALABAMAHunt (Tuscaloosa) ..........................40Shell (Saraland) .............................85
THREE RIVERSValero ............................. 89CORPUS CHRISTICITGO ........................... 157Flint .............................. 300Valero ........................... 275
SWEENYPhillips 66..................... 247
LAKE CHARLESCITGO ............................. 425Phillips 66....................... 244Calcasieu.......................... 75
PORT ARTHUR/BEAUMONTExxonMobil ....................345Motiva ...........................578Valero ............................335Total ..............................226
SAINT JOHNIrving ...................300
NEW JERSEYPhillips 66 (Bayway)........ 238PBF (Paulsboro) .............. 168Axeon SP (Paulsboro) ........ 70DELAWAREPBF (Delaware City) ........ 190
MEMPHISValero ..................180EL DORADODelek.....................80
TYLERDelek.....................75
DETROITMarathon.......... 132
OKLAHOMAPhillips 66 (Ponca City) .........................203HollyFrontier (Tulsa) .............................125Coffeyville Res. (Wynnewood) .................70Valero (Ardmore).....................................86
KANSASCHS (McPherson)....................................85HollyFrontier (El Dorado) ......................135Coffeyville Res. (Coffeyville) ..................115
NEW MEXICO/W. TEXASHollyFrontier (Artesia) ...........................100Alon (Big Spring). ....................................73
BORGER/MCKEEWRB ............................ 146Valero .......................... 195
DENVER/COMMERCE CITYSuncor........................... 98
SALT LAKE CITYBig West ............. 35Chevron.............. 53HollyFrontier ....... 31Tesoro ................ 63
ST. PAULFlint Hills .............339
SUPERIORCalumet............45
CHICAGOBP ..........................430ExxonMobil ..............236PDV ........................180
NORTH DAKOTATesoro (Mandan) ........74DP (Dickinson) ...........20
SARNIAImperial ............... 119Shell ...................... 75Suncor................... 85NANTICOKEImperial ............... 113
MONTRÉAL/QUÉBECSuncor.................... 137Valero ..................... 230
PENNSYLVANIAMonroe Energy (Trainer)................ 195Phil. Energy Solutions (Phil.).......... 335
WARRENUnited .......... 70
NEWELL, WVErgon............ 23
UPGRADERSSyncrude (Fort McMurray)................. 465Suncor (Fort McMurray) .................... 438Shell (Scotford) ................................. 240CNRL (Horizon) ................................. 135Nexen (Long Lake) .............................. 72
WOOD RIVERWRB .................................314ROBINSONMarathon..........................212MT VERNONCountrymark.......................28
NEWFOUNDLAND & LABRADORSilver Range (Come by Chance) .......... 115
PRINCE GEORGEHusky.............. 12
Hibernia White Rose
Terra NovaHebron
MISSISSIPPIChevron (Pascagoula) ..................330Ergon (Vicksburg)...........................25
LOUISIANACalumet (Shreveport) ........ 60
PIPELINE TOLLS FOR LIGHT OIL (US$ PER BARREL)
Edmonton to Burnaby (Trans Mountain) 1.70 Anacortes (Trans Mountain/Puget) 2.00 Sarnia (Enbridge) 4.40 Montréal (Enbridge) 6.05 Chicago (Enbridge) 4.00 Cushing (Enbridge) 5.15*-6.40 Wood River (Enbridge/Mustang/Capwood) 5.40 USGC (Enbridge/Seaway) 6.10†-10.40Hardisty to Guernsey (Express/Platte) 3.10* Wood River (Express/Platte) 4.80* Wood River (Keystone) 4.50**-5.35 USGC (Keystone/Gulf Coast Ext.) 7.15**-11.65
USEC to Montréal (Portland/Montréal) 1.40
St. James to Wood River (Capline/Capwood) 1.30
PIPELINE TOLLS FOR HEAVY OIL (US$ PER BARREL)
Hardisty to: Chicago (Enbridge) 4.20 Cushing (Enbridge) 5.35*-6.60 Cushing (Keystone) 6.20**-6.90 Wood River (Enbridge/Mustang/Capwood) 6.05 Wood River (Keystone) 5.15**-6.05 Wood River (Express/Platte) 5.35* USGC (Enbridge/Seaway) 6.95†-11.10 USGC (Keystone/Gulf Coast Ext.) 7.80**-12.60
Notes 1) Assumed exchange rate = 0.77 US$ / 1C$ (May 2016 average) 2) Tolls rounded to nearest 5 cents 3) Tolls in effect July 1, 2016
* 10-year committed toll**20-year committed toll†First Open Season,15-year, 50,000+ b/d committed volumes
APPENDIX D Crude Oil Pipelines and Refineries
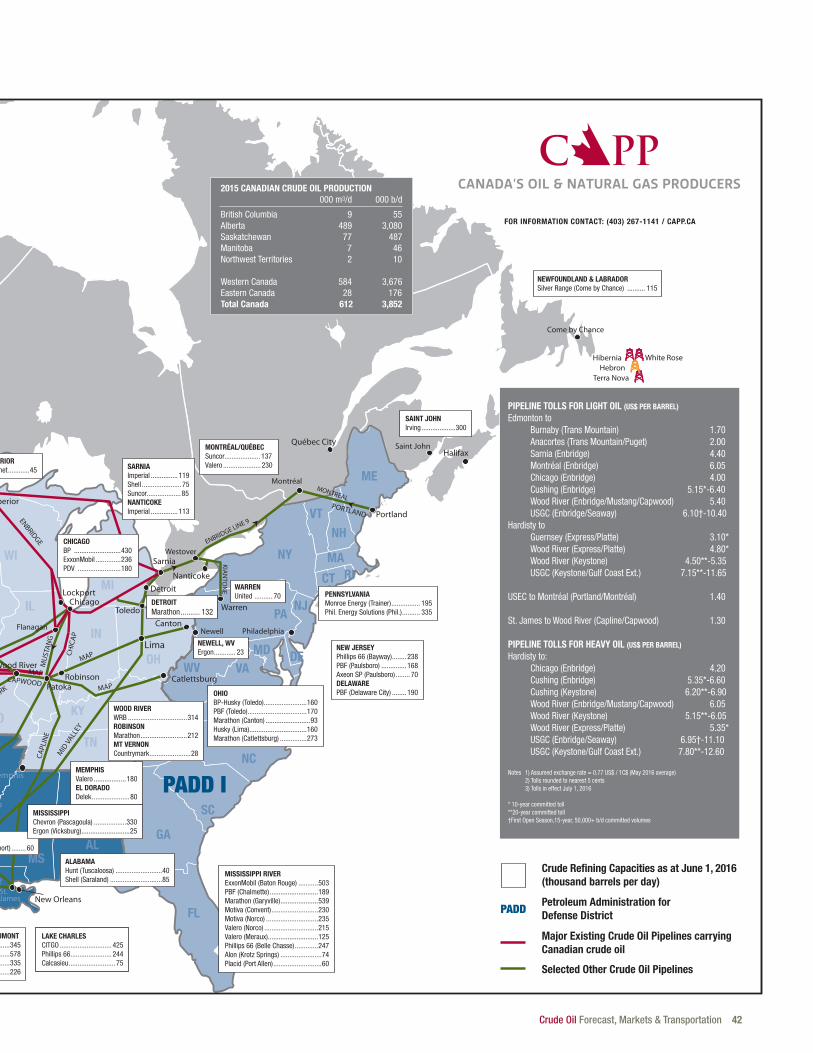
Crude Oil Forecast, Markets & Transportation 42
FOR INFORMATION CONTACT: (403) 267-1141 / CAPP.CA
PADD V
PADD IV
PADD II
PADD III PADD I
PADD
WA
ORMT
CO
IA
WI
IN
NE
NM
GA
MS
ID
UT
NVCA
AZ
TX
OK
NDMN
SD
KS
WY
NC
KY
SC
IL
MI
MO
AR
AL
OH
TN
LA
VAWVDEMD
PA
NY
NH
MA
CT
VT
ME
NJ
RI
VANCOUVER TO:Japan - 4,300 milesTaiwan - 5,600 milesS.Korea - 4,600 milesChina - 5,100 miles
San Francisco - 800 milesLos Angeles - 1,100 miles
2015 CANADIAN CRUDE OIL PRODUCTION 000 m3/d 000 b/d
British Columbia 9 55Alberta 489 3,080Saskatchewan 77 487Manitoba 7 46Northwest Territories 2 10
Western Canada 584 3,676Eastern Canada 28 176Total Canada 612 3,852
Major Existing Crude Oil Pipelines carryingCanadian crude oil
Selected Other Crude Oil Pipelines
Crude Refining Capacities as at June 1, 2016(thousand barrels per day)
Petroleum Administration for Defense District
Dickinson
Flanagan PhiladelphiaNewell
Port Arthur/Nederland/Beaumont
ArtesiaBigSpring
Slaughter
ThreeRivers
Crane
FL
CENTURION
WAS
CANA
SPEARHEAD
SOUTH
PONY EXPRESSWHITE CLIFFS
TRANSCAN
ADA G
ULF CO
AST
SEAWAY TW
IN
ENBRIDGE LINE 9
KIAN
TON
E
PEGASUS
Come by Chance
LakeCharles
St.James
reviR dooW
HCOK
SHELL CHEVRO
NPACIFIC
EXXONMOBIL
BRIDGETEX
PERMIAN EXPRESSCRANE
HO-HOCACTUS
EXXONM
OBIL
KEYSTON
E
KEYSTON
E
HUSKY
RAIN
BOW
ENBRIDGE NW
Saint John
Montréal
Westover
MONTREAL
VANCOUVERChevron........... 55
PUGET SOUNDBP (Cherry Pt) .............234Phillips 66 (Ferndale) ...101Shell (Anacortes)..........137Tesoro (Anacortes) .......120TrailStone (Tacoma) .......42
SAN FRANCISCOChevron...................257Phillips 66................120Shell ........................144Tesoro .....................166Valero ......................145
BAKERSFIELDKern Oil .....................26San Joaquin...............15
GREAT FALLSCalumet ......................10
BILLINGSCHS (Laurel) ................56Phillips 66....................59ExxonMobil ..................60
LOS ANGELESAlon USA .. . . . . . . . . . . . . . . . . 70 (idle)Tesoro (Carson/Wilmington) ... 380Chevron ................................ 269PBF ...................................... 150Phillips 66 ............................ 139Valero .................................... 85
EDMONTONImperial .........................189Suncor...........................142Shell ..............................100LLOYDMINSTERHusky asphalt plant .........29Husky Upgrader...............82
REGINA
Complex ......................................135MOOSE JAWMoose Jaw asphalt plant ...............19
WYOMINGSinclair (Casper) ............................25Sinclair Oil (Sinclair).......................85Wyoming (Newcastle) ....................14HollyFrontier (Cheyenne) ................52
OHIOBP-Husky (Toledo)........................160PBF (Toledo).................................170Marathon (Canton) .........................93Husky (Lima)................................160Marathon (Catlettsburg) ...............273
MISSISSIPPI RIVERExxonMobil (Baton Rouge) ...........503PBF (Chalmette)...........................189Marathon (Garyville).....................539Motiva (Convent)..........................230Motiva (Norco) .............................235Valero (Norco) ..............................215Valero (Meraux)............................125Phillips 66 (Belle Chasse).............247Alon (Krotz Springs) .......................74Placid (Port Allen)...........................60
HOUSTON/TEXAS CITYPRSI (Pasadena) ........... 100Marathon (Galveston).... 459Shell (Deer Park)........... 312ExxonMobil ................... 561LyondellBasell .............. 268Marathon ....................... 86Valero (2) ................90+225
ALABAMAHunt (Tuscaloosa) ..........................40Shell (Saraland) .............................85
THREE RIVERSValero ............................. 89CORPUS CHRISTICITGO ........................... 157Flint .............................. 300Valero ........................... 275
SWEENYPhillips 66..................... 247
LAKE CHARLESCITGO ............................. 425Phillips 66....................... 244Calcasieu.......................... 75
PORT ARTHUR/BEAUMONTExxonMobil ....................345Motiva ...........................578Valero ............................335Total ..............................226
SAINT JOHNIrving ...................300
NEW JERSEYPhillips 66 (Bayway)........ 238PBF (Paulsboro) .............. 168Axeon SP (Paulsboro) ........ 70DELAWAREPBF (Delaware City) ........ 190
MEMPHISValero ..................180EL DORADODelek.....................80
TYLERDelek.....................75
DETROITMarathon.......... 132
OKLAHOMAPhillips 66 (Ponca City) .........................203HollyFrontier (Tulsa) .............................125Coffeyville Res. (Wynnewood) .................70Valero (Ardmore).....................................86
KANSASCHS (McPherson)....................................85HollyFrontier (El Dorado) ......................135Coffeyville Res. (Coffeyville) ..................115
NEW MEXICO/W. TEXASHollyFrontier (Artesia) ...........................100Alon (Big Spring). ....................................73
BORGER/MCKEEWRB ............................ 146Valero .......................... 195
DENVER/COMMERCE CITYSuncor........................... 98
SALT LAKE CITYBig West ............. 35Chevron.............. 53HollyFrontier ....... 31Tesoro ................ 63
ST. PAULFlint Hills .............339
SUPERIORCalumet............45
CHICAGOBP ..........................430ExxonMobil ..............236PDV ........................180
NORTH DAKOTATesoro (Mandan) ........74DP (Dickinson) ...........20
SARNIAImperial ............... 119Shell ...................... 75Suncor................... 85NANTICOKEImperial ............... 113
MONTRÉAL/QUÉBECSuncor.................... 137Valero ..................... 230
PENNSYLVANIAMonroe Energy (Trainer)................ 195Phil. Energy Solutions (Phil.).......... 335
WARRENUnited .......... 70
NEWELL, WVErgon............ 23
UPGRADERSSyncrude (Fort McMurray)................. 465Suncor (Fort McMurray) .................... 438Shell (Scotford) ................................. 240CNRL (Horizon) ................................. 135Nexen (Long Lake) .............................. 72
WOOD RIVERWRB .................................314ROBINSONMarathon..........................212MT VERNONCountrymark.......................28
NEWFOUNDLAND & LABRADORSilver Range (Come by Chance) .......... 115
PRINCE GEORGEHusky.............. 12
Hibernia White Rose
Terra NovaHebron
MISSISSIPPIChevron (Pascagoula) ..................330Ergon (Vicksburg)...........................25
LOUISIANACalumet (Shreveport) ........ 60
PIPELINE TOLLS FOR LIGHT OIL (US$ PER BARREL)
Edmonton to Burnaby (Trans Mountain) 1.70 Anacortes (Trans Mountain/Puget) 2.00 Sarnia (Enbridge) 4.40 Montréal (Enbridge) 6.05 Chicago (Enbridge) 4.00 Cushing (Enbridge) 5.15*-6.40 Wood River (Enbridge/Mustang/Capwood) 5.40 USGC (Enbridge/Seaway) 6.10†-10.40Hardisty to Guernsey (Express/Platte) 3.10* Wood River (Express/Platte) 4.80* Wood River (Keystone) 4.50**-5.35 USGC (Keystone/Gulf Coast Ext.) 7.15**-11.65
USEC to Montréal (Portland/Montréal) 1.40
St. James to Wood River (Capline/Capwood) 1.30
PIPELINE TOLLS FOR HEAVY OIL (US$ PER BARREL)
Hardisty to: Chicago (Enbridge) 4.20 Cushing (Enbridge) 5.35*-6.60 Cushing (Keystone) 6.20**-6.90 Wood River (Enbridge/Mustang/Capwood) 6.05 Wood River (Keystone) 5.15**-6.05 Wood River (Express/Platte) 5.35* USGC (Enbridge/Seaway) 6.95†-11.10 USGC (Keystone/Gulf Coast Ext.) 7.80**-12.60
Notes 1) Assumed exchange rate = 0.77 US$ / 1C$ (May 2016 average) 2) Tolls rounded to nearest 5 cents 3) Tolls in effect July 1, 2016
* 10-year committed toll**20-year committed toll†First Open Season,15-year, 50,000+ b/d committed volumes
APPENDIX D Crude Oil Pipelines and Refineries
43 CANADIAN ASSOCIATION OF PETROLEUM PRODUCERS
THE CANADIAN ASSOCIATION OF
PETROLEUM PRODUCERS (CAPP)
REPRESENTS COMPANIES, LARGE
AND SMALL, THAT EXPLORE FOR,
DEVELOP AND PRODUCE NATURAL
GAS AND CRUDE OIL THROUGHOUT
CANADA. CAPP’S MEMBER COMPANIES
PRODUCE ABOUT 85 PER CENT
OF CANADA’S NATURAL GAS AND
CRUDE OIL. CAPP’S ASSOCIATE
MEMBERS PROVIDE A WIDE RANGE
OF SERVICES THAT SUPPORT
THE UPSTREAM CRUDE OIL AND
NATURAL GAS INDUSTRY. TOGETHER
CAPP’S MEMBERS AND ASSOCIATE
MEMBERS ARE AN IMPORTANT PART
OF A NATIONAL INDUSTRY WITH
REVENUES FROM OIL AND NATURAL
GAS PRODUCTION OF ABOUT
$120 BILLION A YEAR.
CANADA’S OIL & NATURAL GAS PRODUCERS
CALGARY 2100, 350 - 7 Avenue SW Calgary, Alberta, Canada T2P 3N9
OTTAWA 1000, 275 Slater Street Ottawa, Ontario, Canada K1P 5H9
ST.JOHN’S 1004, 235 Water Street St. John’s, Newfoundland and Labrador, Canada A1C 1B6
VICTORIA 360B Harbour RoadVictoria, British Columbia, CanadaV9A 3S1
capp.ca
2016 - 0007