CROWNE Current Ratio Outlier With Neighbor Estimator Sagar S. SabadeDuncan M. Walker Department of...
16
CROWNE Current Ratio Outlier With Neighbor Estimator Sagar S. Sabade Duncan M. Walker Department of Computer Science Texas A&M University College Station, TX 77843-3112 http://ee.tamu.edu/~sagar
Transcript of CROWNE Current Ratio Outlier With Neighbor Estimator Sagar S. SabadeDuncan M. Walker Department of...

CROWNECurrent Ratio Outlier With Neighbor Estimator
CROWNECurrent Ratio Outlier With Neighbor Estimator
Sagar S. Sabade Duncan M. WalkerDepartment of Computer Science
Texas A&M University
College Station, TX 77843-3112
http://ee.tamu.edu/~sagar
Sagar S. Sabade Duncan M. WalkerDepartment of Computer Science
Texas A&M University
College Station, TX 77843-3112
http://ee.tamu.edu/~sagar

OutlineOutline
Introduction Variability in Current Ratios Use of Wafer Spatial Information
– NCR metric Combining Multiple Parameters Experimental Results Conclusions
IntroductionIntroduction
IDDQ test needs to survive in DSM era Many methods reported in literature
– Goal: Reduce variance in “fault-free” IDDQ
Current Ratio (CR)– Ratio of maximum to minimum IDDQ of a chip
– Within-chip IDDQ variation similar for fault-free chip (magnitudes may differ)
– Ease of implementation in production
CR Variation for Real ChipsCR Variation for Real Chips
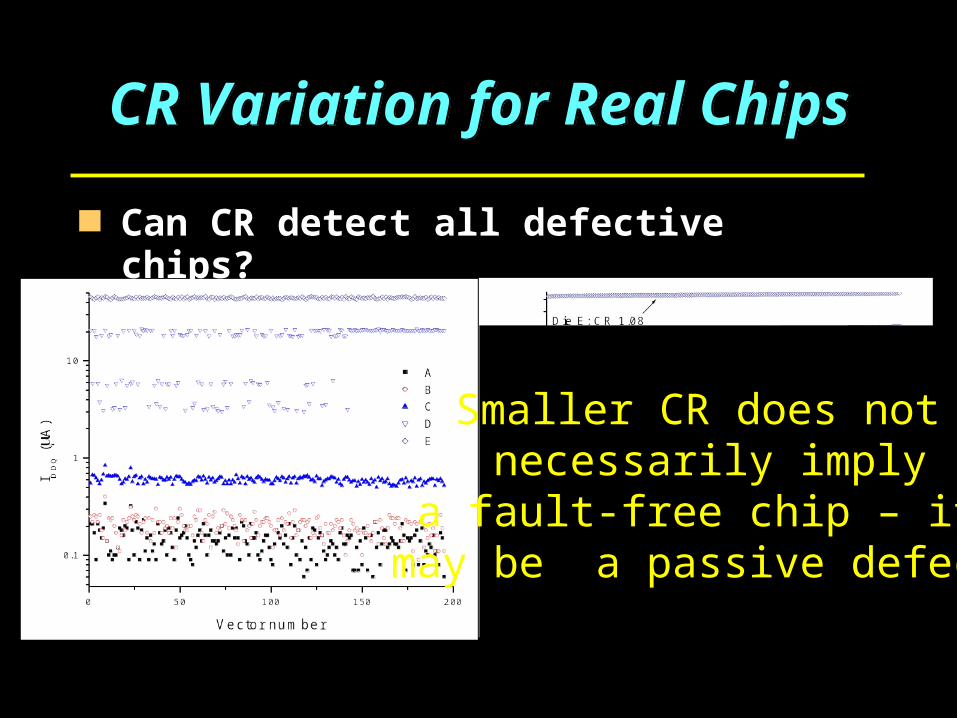
Can CR detect all defective chips?
Smaller CR does not necessarily imply
a fault-free chip – it may be a passive defect!

Why Use Spatial Information?Why Use Spatial Information?
Neighboring fault-free Chips have similar IDDQ
For same vector
Neighbor Current Ratio (NCR)Neighbor Current Ratio (NCR)
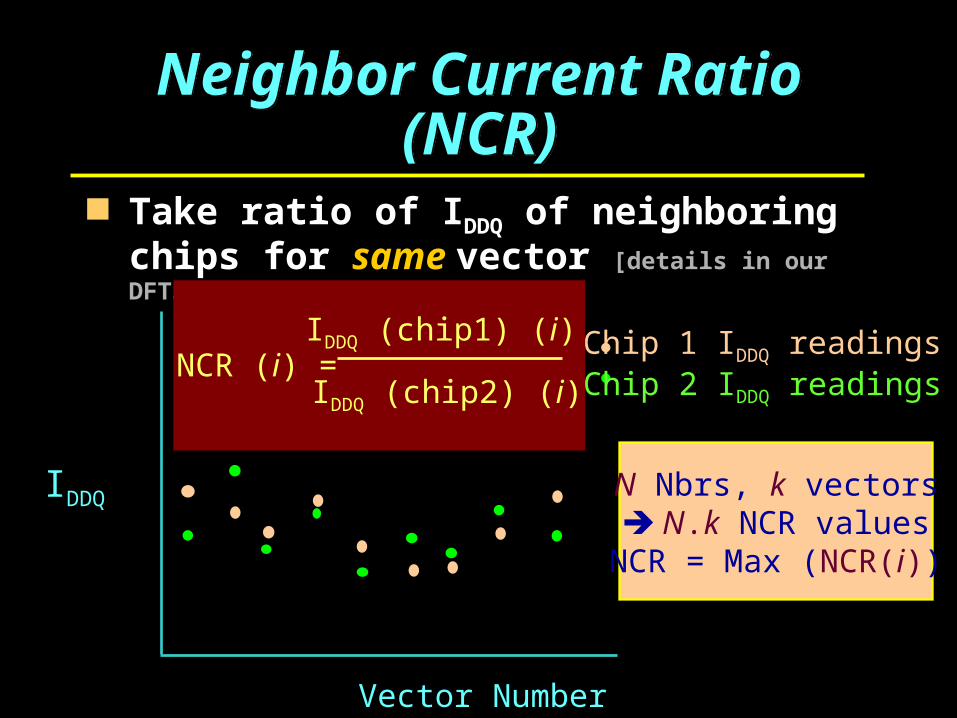
Take ratio of IDDQ of neighboring chips for same vector [details in our DFTS 02 paper]
IDDQ
Vector Number
Chip 1 IDDQ readingsChip 2 IDDQ readings
NCR (i) = IDDQ (chip1) (i)
IDDQ (chip2) (i)
N Nbrs, k vectors N.k NCR values
NCR = Max (NCR(i))
Combining CR and NCRCombining CR and NCR
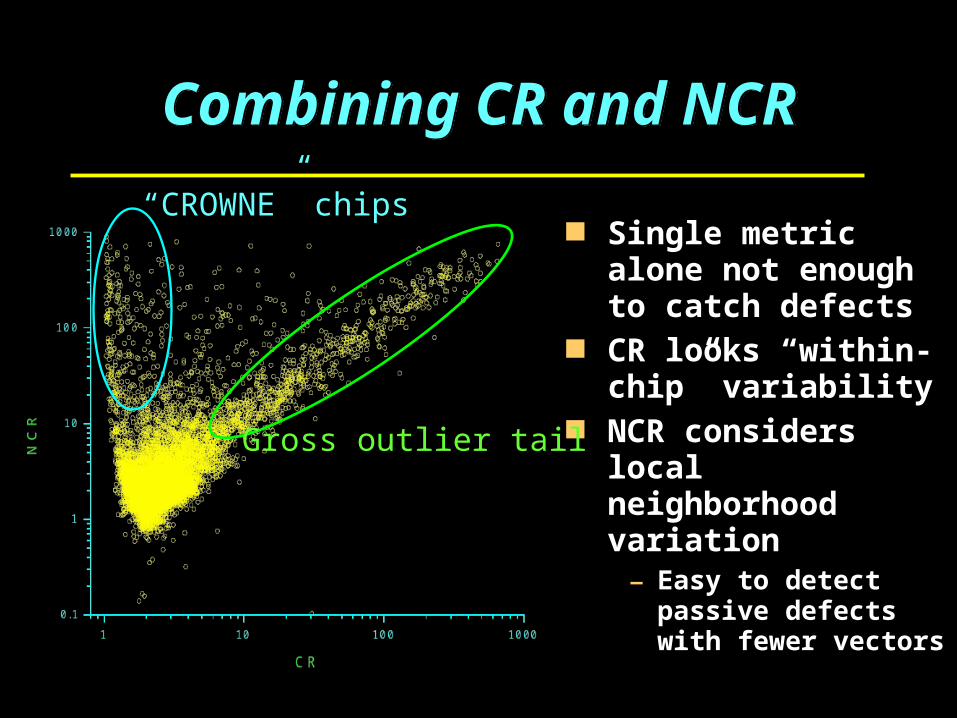
Single metric alone not enough to catch defects
CR looks “within-chip” variability
NCR considers local neighborhood variation
– Easy to detect passive defects with fewer vectors
Gross outlier tail
“CROWNE” chips

CR/NCR Combination InsightsCR/NCR Combination Insights
CR
NCR
NCR Threshold
CR Threshold1
Region DNominal CR,NCRFault-free Chips/Good chips in
Bad neighborhood
Region ANominal CR
Subtle active defectsSpatial Outliers
Region BCR, NCR Outliers
Active defects
Region COutliers in
Bad neighborhoodPassivedefects
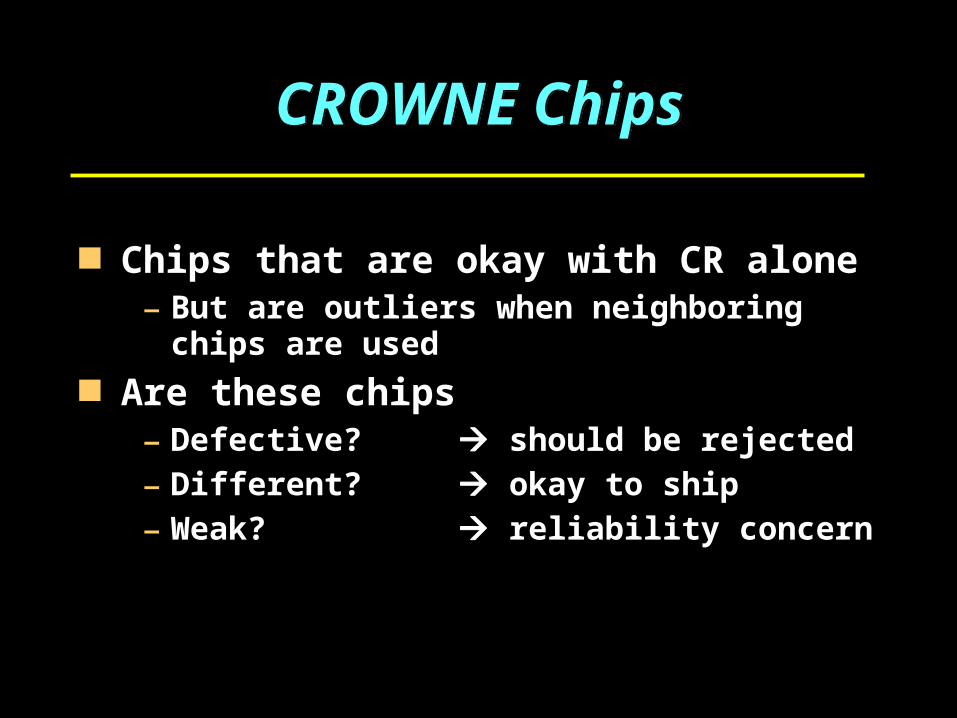
CROWNE ChipsCROWNE Chips
Chips that are okay with CR alone– But are outliers when neighboring chips are used
Are these chips– Defective? should be rejected
– Different? okay to ship
– Weak? reliability concern

CR, NCR and Flush DelayCR, NCR and Flush Delay
XY projection

How does combination help us?How does combination help us?
CR NCR Delay Result
Low Low Small Fast wafer regionLarge Resistive short/defect?
Low High Small A chip with passive defectLarge in a good neighborhood
High Low Small A chip with active defectLarge in a bad neighborhood
High High Small A chip with active defectLarge in a good neighborhood
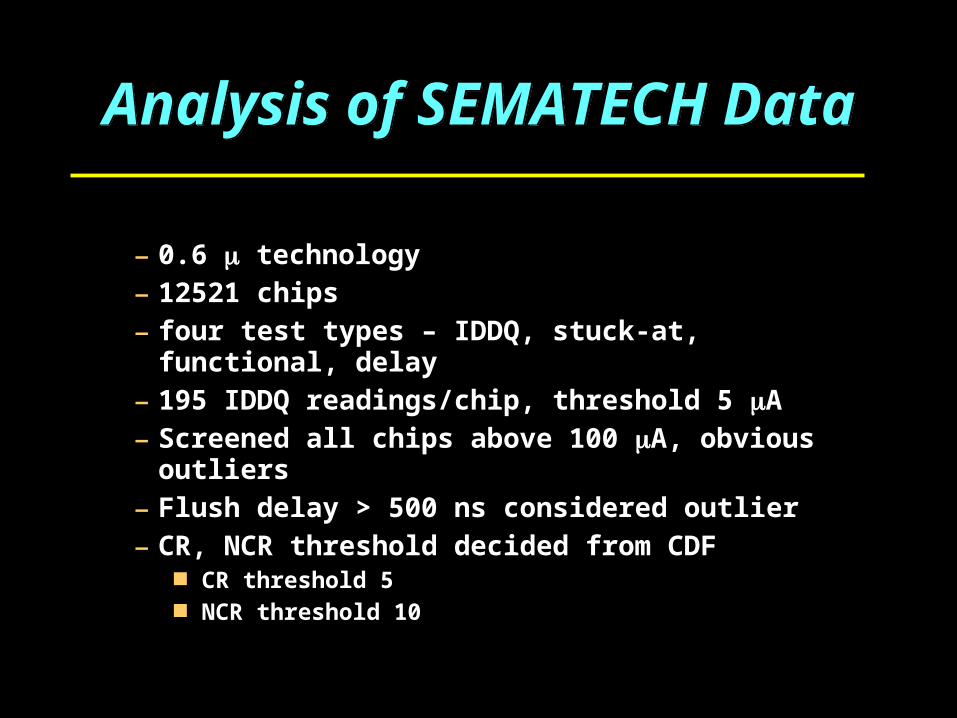
Analysis of SEMATECH DataAnalysis of SEMATECH Data
– 0.6 technology
– 12521 chips
– four test types – IDDQ, stuck-at, functional, delay
– 195 IDDQ readings/chip, threshold 5 A
– Screened all chips above 100 A, obvious outliers
– Flush delay > 500 ns considered outlier
– CR, NCR threshold decided from CDF CR threshold 5 NCR threshold 10

CR/NCR scatter plot for low CRCR/NCR scatter plot for low CR
More activeMore passive

CR/NCR scatter plotsCR/NCR scatter plots
Some delay failures can be identified by NCR– No systematic pattern
1 10 100
1
10
100
NC
R
CR
Delay-only fail Delay+I
DDQ fail

Flush delay/NCR scatter plotFlush delay/NCR scatter plot
Poor correlation between NCR and flush delay– NCR cannot screen delay failures well
1 10 100
400
450
500
550
Flu
sh d
ela
y
NCR
Delay-only fails I
DDQ+Delay fails

ConclusionConclusion
Low CR is deceptive – Can be passive defect; reliability hazard
– Spatial information useful (e.g. NCR) Combination of CR/NCR has better outlier
screening– NCR not suited for delay failures
– Additional screen needed More data analysis needed to validate claims