Crowdsourcing and Knowledge Sharing: Strategic User Behavior
10
Crowdsourcing and Knowledge Sharing: Strategic User Behavior on Taskcn Jiang Yang 1 , Lada A. Adamic 1 , Mark S. Ackerman 1,2 1 School of Information, 2 Department of EECS University of Michigan,1085 South University Ave. 304 West Hall, Ann Arbor, MI 48109-1107, USA (yangjian,ladamic,ackerm)@umich.edu ABSTRACT Witkeys are a thriving type of web-based knowledge sharing market in China, supporting a form of crowdsourcing. In a Witkey site, users offer a small award for a solution to a task, and other users compete to have their solution selected. In this paper, we examine the behavior of users on one of the biggest Witkey websites in China, Taskcn.com. On Taskcn, we observed several characteristics in users’ activity over time. Most users become inactive after only a few submissions. Others keep attempting tasks. Over time, users tend to select tasks where they are competing against fewer opponents to increase their chances of winning. They will also, perhaps counterproductively, select tasks with higher expected rewards. Yet, on average, they do not increase their chances of winning, and in some categories of tasks, their chances actually decrease. This does not paint the full picture, however, because there is a very small core of successful users who manage not only to win multiple tasks, but to increase their win-to- submission ratio over time. This core group proposes nearly 20% of the winning solutions on the site. The patterns we observe on Taskcn, we believe, hold clues to the future of crowdsourcing and freelance marketplaces, and raise interesting design implications for such sites. Categories and Subject Descriptors H.5.3 [Information Interfaces and Presentation (e.g., HCI) ]: Group and Organizational Interfaces – collaborative computing, computer-supported cooperative work, theory and models, web- based interaction. J.0 [Computer Applications] General. General Terms: Measurement, Human Factors. Keywords: Online communities, virtual communities, question- answer sites, knowledge market, crowdsourcing, learning, Witkey. 1. INTRODUCTION Crowdsourcing, or the use of an Internet-scale community to outsource a task, has garnered considerable interest in the popular press. Articles in Wired [1] and Business Week [2], for example, repeat the same success stories for video, stock photography, and even corporate R&D. However, the media coverage consists primarily of anecdotal evidence in an often relentlessly enthusiastic manner. Empirically-based analytical studies of crowd sourcing sites are, unfortunately, lacking. This paper presents one such study. It analyzes use of a Witkey site, Taskcn.com where users offer monetary awards for solutions to problems. Other users provide solutions in the hopes of winning the awards. Taskcn.com has 1.7 million registered users. Users have requested solutions for nearly 3100 tasks, and 543,000 solutions have been proposed in less than 2 years. It might appear that the site should be drowning in newbies and lurkers; yet, the site appears to be quite successful. Askers clearly get solutions. More interestingly, the site appears to be socially stable: there is a core of users who repeatedly propose and win. The large numbers of new users ensure many answers, while also providing new members for the stable core. Our data argue that crowdsourcing works, albeit perhaps only as long as it is a popular phenomenon. In this paper we focus on three important aspects of this expertise sharing marketplace. The first is whether tasks are priced according to expertise and effort level required. The second are the factors involved in strategic selection, e.g., whether users learn to better their chances of winning over time. The third is what distinguishes the successful winners over time from other users. All of these are important to maintaining the site as an ongoing and successful marketplace. The paper proceeds as follows: First we introduce Witkeys and Taskcn.com in particular. We then talk about our data collection. This is followed by a discussion of our findings about pricing, strategic selection, and winners. We conclude with related work, design implications, and future work. 2. TASKCN.COM AS A KNOWLEDGE MARKET A Witkey website is a new type of knowledge market website, in which a user offers a monetary award for a question or task and other users provide solutions to compete for the award. The website plays the role of the third party by collecting the money from the requester and distributing the award to the winner(s) who is (are) decided by the requester. The website takes a small portion of the award as a service fee. Permission to make digital or hard copies of all or part of this work for personal or classroom use is granted without fee provided that copies are not made or distributed for profit or commercial advantage and that copies bear this notice and the full citation on the first page. To copy otherwise, or republish, to post on servers or to redistribute to lists, requires prior specific permission and/or a fee. EC’08, July 8–12, 2008, Chicago, Illinois, USA. Copyright 2008 ACM 978-1-60558-169-9/08/07...$5.00. 246
Transcript of Crowdsourcing and Knowledge Sharing: Strategic User Behavior
Crowdsourcing and Knowledge Sharing: Strategic User Behavior on Taskcn
Jiang Yang1, Lada A. Adamic1, Mark S. Ackerman1,2 1School of Information, 2Department of EECS
University of Michigan,1085 South University Ave. 304 West Hall, Ann Arbor, MI 48109-1107, USA (yangjian,ladamic,ackerm)@umich.edu
ABSTRACT Witkeys are a thriving type of web-based knowledge sharing market in China, supporting a form of crowdsourcing. In a Witkey site, users offer a small award for a solution to a task, and other users compete to have their solution selected.
In this paper, we examine the behavior of users on one of the biggest Witkey websites in China, Taskcn.com. On Taskcn, we observed several characteristics in users’ activity over time. Most users become inactive after only a few submissions. Others keep attempting tasks. Over time, users tend to select tasks where they are competing against fewer opponents to increase their chances of winning. They will also, perhaps counterproductively, select tasks with higher expected rewards. Yet, on average, they do not increase their chances of winning, and in some categories of tasks, their chances actually decrease. This does not paint the full picture, however, because there is a very small core of successful users who manage not only to win multiple tasks, but to increase their win-to-submission ratio over time. This core group proposes nearly 20% of the winning solutions on the site. The patterns we observe on Taskcn, we believe, hold clues to the future of crowdsourcing and freelance marketplaces, and raise interesting design implications for such sites.
Categories and Subject Descriptors H.5.3 [Information Interfaces and Presentation (e.g., HCI)]: Group and Organizational Interfaces – collaborative computing, computer-supported cooperative work, theory and models, web-based interaction. J.0 [Computer Applications] General.
General Terms: Measurement, Human Factors.
Keywords: Online communities, virtual communities, question-answer sites, knowledge market, crowdsourcing, learning, Witkey.
1. INTRODUCTION Crowdsourcing, or the use of an Internet-scale community to outsource a task, has garnered considerable interest in the popular
press. Articles in Wired [1] and Business Week [2], for example, repeat the same success stories for video, stock photography, and even corporate R&D. However, the media coverage consists primarily of anecdotal evidence in an often relentlessly enthusiastic manner. Empirically-based analytical studies of crowd sourcing sites are, unfortunately, lacking.
This paper presents one such study. It analyzes use of a Witkey site, Taskcn.com where users offer monetary awards for solutions to problems. Other users provide solutions in the hopes of winning the awards. Taskcn.com has 1.7 million registered users. Users have requested solutions for nearly 3100 tasks, and 543,000 solutions have been proposed in less than 2 years.
It might appear that the site should be drowning in newbies and lurkers; yet, the site appears to be quite successful. Askers clearly get solutions. More interestingly, the site appears to be socially stable: there is a core of users who repeatedly propose and win. The large numbers of new users ensure many answers, while also providing new members for the stable core. Our data argue that crowdsourcing works, albeit perhaps only as long as it is a popular phenomenon.
In this paper we focus on three important aspects of this expertise sharing marketplace. The first is whether tasks are priced according to expertise and effort level required. The second are the factors involved in strategic selection, e.g., whether users learn to better their chances of winning over time. The third is what distinguishes the successful winners over time from other users. All of these are important to maintaining the site as an ongoing and successful marketplace.
The paper proceeds as follows: First we introduce Witkeys and Taskcn.com in particular. We then talk about our data collection. This is followed by a discussion of our findings about pricing, strategic selection, and winners. We conclude with related work, design implications, and future work.
2. TASKCN.COM AS A KNOWLEDGE MARKET A Witkey website is a new type of knowledge market website, in which a user offers a monetary award for a question or task and other users provide solutions to compete for the award. The website plays the role of the third party by collecting the money from the requester and distributing the award to the winner(s) who is (are) decided by the requester. The website takes a small portion of the award as a service fee.
Permission to make digital or hard copies of all or part of this work for personal or classroom use is granted without fee provided that copies are not made or distributed for profit or commercial advantage and that copies bear this notice and the full citation on the first page. To copy otherwise, or republish, to post on servers or to redistribute to lists, requires prior specific permission and/or a fee. EC’08, July 8–12, 2008, Chicago, Illinois, USA. Copyright 2008 ACM 978-1-60558-169-9/08/07...$5.00.
246
The term "Witkey" was coined by the founder of the first website Witkey.com1 in 2005, and became the name of a series of similar websites in China. This business pattern has quickly motivated a number of followers: in the last two years, more than 10 Witkey websites have been launched (e.g., Witkey.com, Taskcn.com, zhubajie.com, and k68.cn). Within a relatively short timet, the Witkey model has demonstrated its capability to gather people to share knowledge. As mentioned, Taskcn.com, one of the biggest Witkey websites in China, is the site we analyze here, 1,691,404 users have registered between June 2006 and December 2007. On k68.com, 936,462 users have participated in at least one task from July 2004 to January 2008;2 and zhubajie.com, another famous Witkey website, claims to have 497,169 users from its launch date of December 2005 to January 2008.3
1 http://www.witkey.com/lfarticle/articledt.asp?aid=20000 2 http://www.k68.cn/ 3 http://www.zhubajie.com/info/about/
Witkey websites can be seen as harbingers of the freelance markets that were forecast in Malone’s "The Future of Work" [3]. Witkeys differ from open question answer forums such as Yahoo! Answers, because instead of questions that are answered by other users without payment, the requesters offer awards for completion of tasks they pose. Witkeys also differ from the (now defunct) Google Answers, which while allowing requesters to offer rewards for answered questions, limited the participation of those competing to answer to a few (< 500) vetted individuals. In contrast, Witkeys seem to foster a new and completely open way to share more complex knowledge among individuals of distributed expertise [4]. On Witkey websites, tasks usually require particular expertise and include a moderate investment of effort on behalf of the task solvers. For example, many companies are looking for logo designs, a task that requires solution providers to have particular
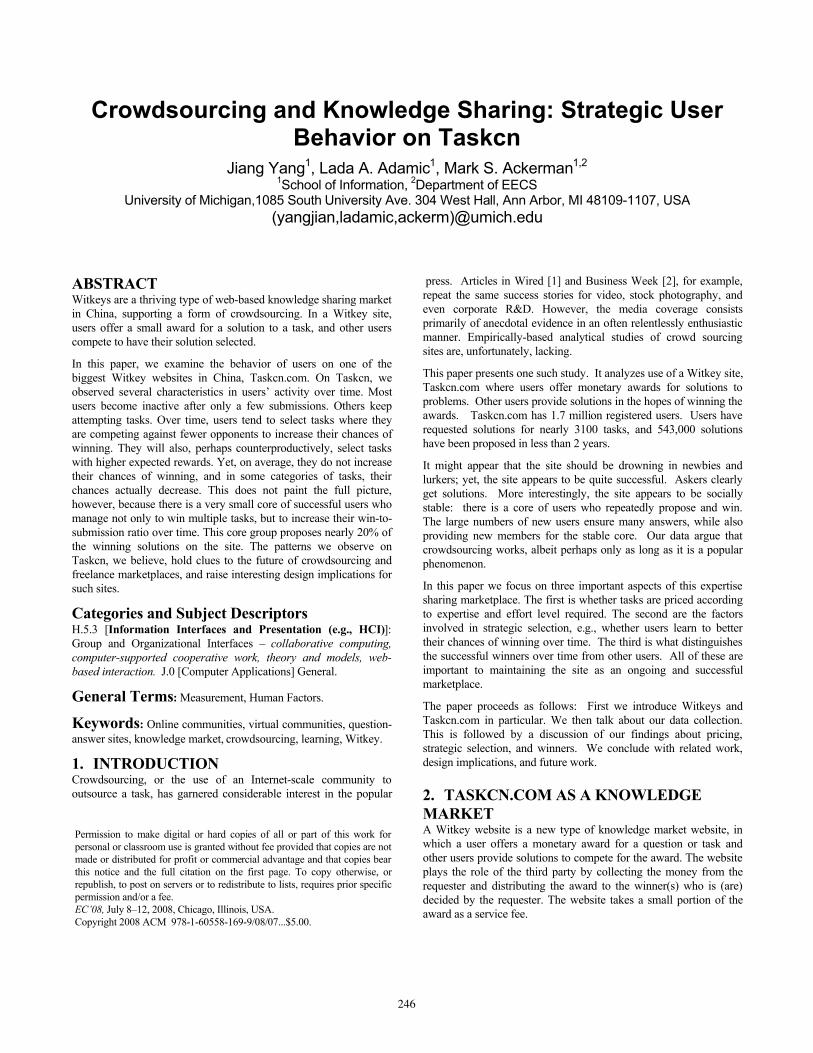
Figure 1: Home page of Taskcn.com (snapshot on Jan 3, 2008).
247
design expertise. In addition, to complete the tasks the solution providers need to take efforts to learn about the companies. The mechanism provides an incentive: the potential monetary award that encourages people’s participation.
Because users submit their work directly, and concurrently with other users competing on the same task, they have little guarantee that their work will receive a monetary reward. This is different from Google Answers, which recruited a small number of expert answerers. Google Answers' answerers would select tasks to complete, and would have an exclusive lock on the task for a period of time. Witkeys also differ from sites such as eLance and TopCoder, where requesters pose a task, and anyone can submit their credentials and proposals, but the task is not attempted until after the requester chooses a person or team to complete it.
Witkeys therefore occupy an interesting position in the design space of online knowledge and expertise sharing sites. The tasks submitted must necessarily be of relatively low complexity and effort, since a user has no guarantee of collecting the award before submitting their solution. However, this also poses a distinct advantage to the requester, as they are able to choose among several possible solutions to their task. The financial component also encourages users to contribute expertise beyond simple question answering, as might occur on no-fee sites such as Yahoo! Answers. For instance, some tasks ask for professionals to develop websites: there are relatively fewer individuals who have this particular expertise than there are people who would be able to answer a typical question on Yahoo Answers such as: "what is good facial cleanser for acne?" Therefore, the monetary-award competitive mechanism aims to attract people with some expertise, but for relatively non-complex tasks.
2.1 Taskcn.com Taskcn.com, the Witkey website we selected for our study, is one of the biggest Witkey websites in China. Taskcn.com has had slightly over 3100 posted tasks categorized into 7 different types: design, strategy planning, programming, personal service, website, and “others”. Around half of the all tasks are in the design category: 1412 design tasks out of a total of 3112.
Figure 1 is a snapshot of the front page of the website taken on January 3, 2008. This page contains categorized task lists (by post date, by number of views, by award etc.), task categories, and help/tutorial information. The tasks vary in topic and amount of award. For example, there are tasks that offer 2 yuan (at 7.5 yuan/dollar) and also at the same time a task that offers 4000 yuan. The task contents range from logo design and website development to business plan writing. On the top of the page, there is an instant status-updater: the number of tasks that have been submitted and announced, the award that has been offered, the number of registered users, and the number of users currently online. These numbers all show that the website is a very active community of knowledge exchange.
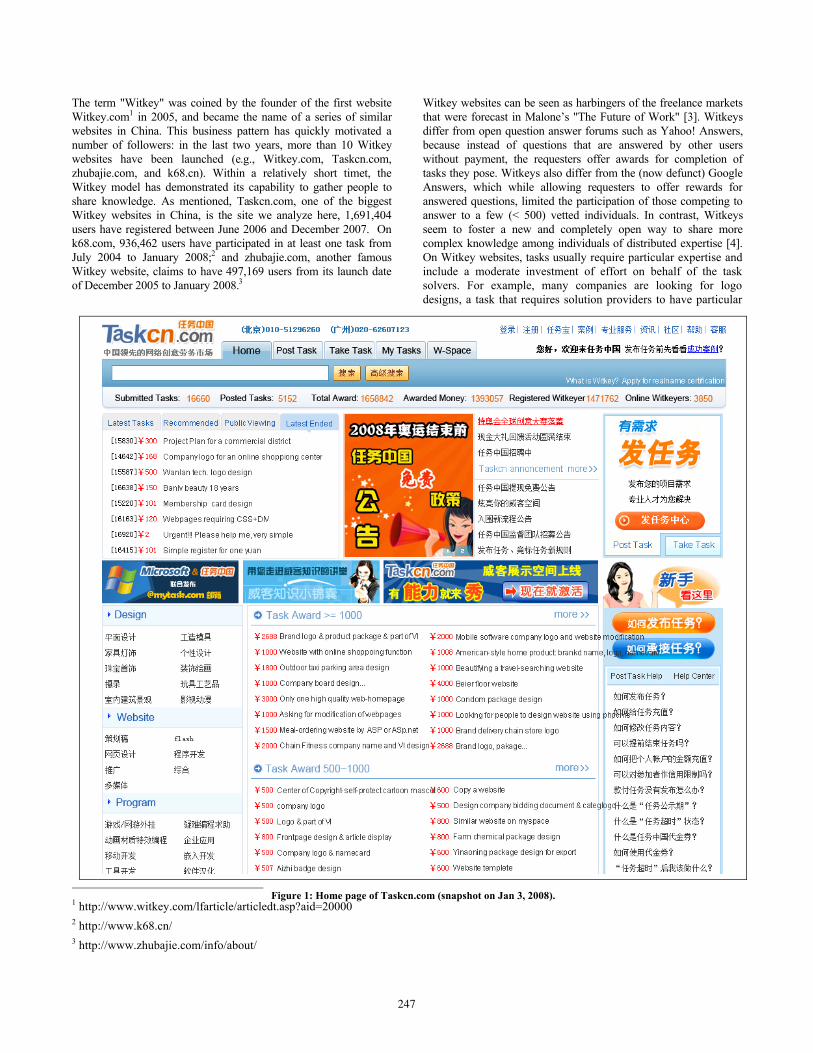
Taskcn.com exhibits potentially excessive entry, where decentralized participation creates market inefficiencies since many entrants race to compete for a single prize but ignore the negative externality on other participants of their entry [5]: Out of 185,429 users (11% of all registered users) who have participated at least once, there are only 5953 (3.2%) who have ever won. Yet, for all the completed tasks, each task has an average of 184 competitors, with each user being able to submit only once. Note,
however, the heavy skew in the distribution of submissions shown in Figure 2. This variable, namely the number of competitors in a task, is the single strongest factor determining a user’s probability of winning, exceeding even the individual's past winning record [4]. This result in particular suggests that intentionally choosing less popular tasks to participate could potentially enhance winning probabilities, even if one’s own expertise remains the same. In section 5 of the paper, we will see that, as they gain experience, users in fact do choose less crowded tasks.
Figure 2: The distribution of the number of solutions posted to the
different tasks.
3. DATA SET & APPROACHES The data include all 3112 tasks that were completed (i.e., the task is closed and winner is decided) from June 2006 (Taskcn's launch date) to December 2007. A task has these basic variables:
Table 1. Variables of Task Variable Name Description Task Start-Time When a task is posted and competition starts Task End-Time The deadline for submission Task Period The period between Start-time and End-time, counted by day Task Type The type the task has been categorized into Task Award The amount of monetary award the task offers
# of Registrations The number of users who registered to participate in the task # of Submissions The number of users who submitted solutions for the task # of Winners Some tasks can have more than one winner, this variable is
obtained by the actual result of the competition
We also collected activity data on all users who had participated at least once in these tasks and excluded those who had registered on the website but had never contributed. This yielded a total of 185,429 users with data on the number of submissions made (excluding tasks for which they registered but did not submit a solution), the number of wins, and initial date they registered on the website. Although Taskcn.com requires users to provide their real names, we excluded all identifiable information in this study. We also collected data on the interaction between a user and a task, such as the time of submission and whether or not the user won in the task.
248
4. TASKS, EFFORT, AND AWARD Our first goal was to understand the relationship between task properties and users’ participation, particularly with regard to the effects of pricing. To do this, we employed human-coding to rate the implicit properties of tasks. We used two raters (professional designers) to evaluate 157 randomly selected tasks in the design category (10% of the total tasks in the category) in terms of following task dimensions:
Table 2: Human-coded variables Dimension Definition Inter-rater
reliability Skill requirement
The lowest professional skill required for completing the task
Spearman's rho = 0.38**
Workload The time an average person of the required skill level will take to complete the task
Spearman's rho = 0.40**
The raters evaluated the tasks without knowing the amount of reward that had been offered, so did not obtain cues as to the value of the task from the price. For this sample of tasks, the inter-rater reliability is relatively low. However, note that we are then using these scores (the average of the ratings given by the two raters) to correlate e.g. the skill level required to the amount of the reward. The low inter-rater reliability would only introduce noise that would make the correlation with any other variable lower than it potentially is. We therefore report these correlations with the understanding that the effect we are observing is at least of this strength. So for example, we may be underestimating the degree to which skill level correlates with the amount of reward offered, but we are not overestimating it. There are interesting correlations among the task properties. Task award is a positive indicator of the skill requirement, which means that users tend to offer more money on tasks of higher skill requirement. A combination of interest in both money and design can make those tasks more desirable.
Table 3: Spearman’s correlations of task variables
Award Skill-Required Skill-Required 0.493**
Workload -0.443** -0.629** Interestingly, award and skill-required are negatively correlated with workload. Although at first one may expect that tasks that require more effort in terms of time should be compensated appropriately, note that the raters were instructed to rate the amount of time it would take a person of an appropriate skill level to complete the task. Even so, it is interesting that workload should be negatively correlated with reward. Anecdotally, users who post a high-quality task and offer more money often just ask for a concise solution. For example, one task offered 2000 yuan for a logo design for a conference organized by a famous magazine. On the other hand, there are also many cases in which tasks requiring a great deal of work come with a tiny money award.
Table 4. Spearman’s correlation between task properties and average-submission# of users who attend the task
Award Skill-Required Workload Ave-submission # 0.211 0.253** -0.242** ** Correlation is significant at the 0.01 level (2-tailed).
We also find that these task property variables influence participation: Award and required skill level attract users, while people avoid the tasks that have larger workload or don’t offer sufficient award. We will show in section 5.7 that these task properties also have different effects on participation for experienced users.
5. WINNING AS INCENTIVE TO CONTINUE We also wanted to understand users' strategic selection of tasks. Before we discuss this in detail, however, it is important to note that merely winning appears to play an important role in contribution. The vast majority of the users on the Witkey websites actually get nothing from their contributions, since the probability of winning is so small. One might therefore expect that a lot of users would leave after a couple of failures. In fact, from 2006 June to May 2007, there were 66,182 users who had one, two, or three submissions during this period and never submitted anything else after May 2007. These users, one third of Taskcn's total, disappeared. The high number of registered users who have never attempted a task (89%) suggests that although there are many people interested in participating, they might be hindered by the very likely futility of their efforts.
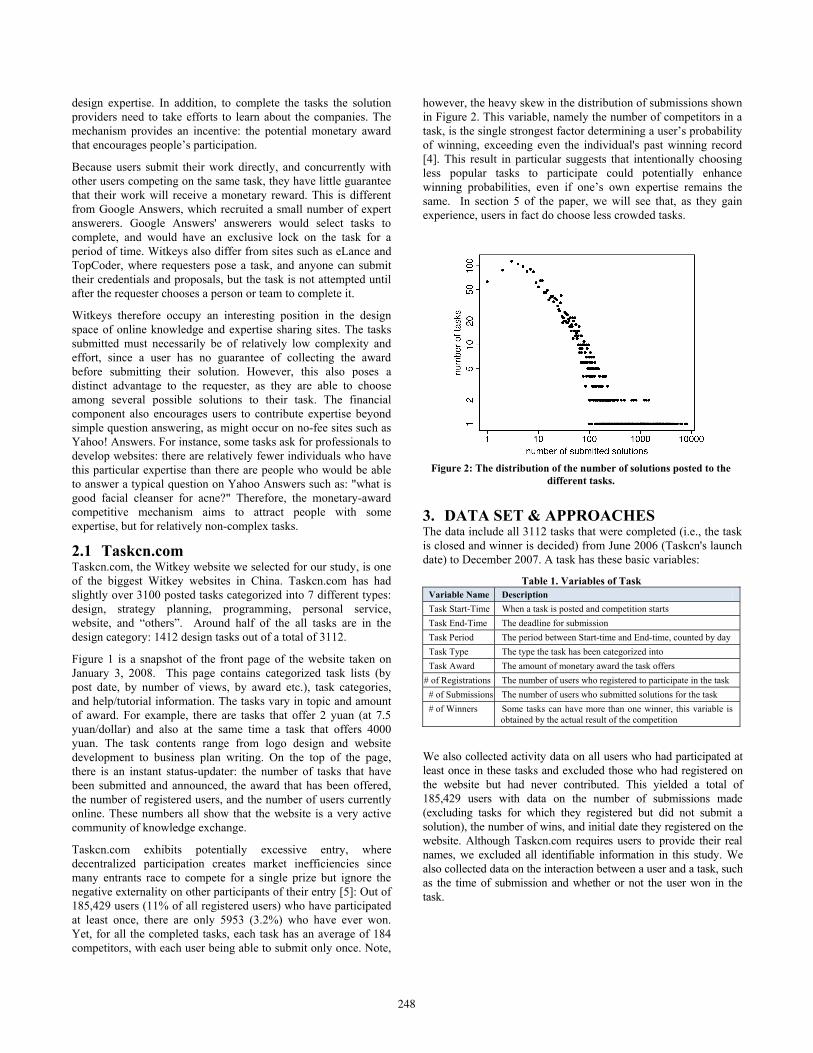
For those who do elect to participate, the first attempt in the competition can be very important in influencing their subsequent participation in Taskcn. There are 2307 users who won on the first attempt and 169,456 others who failed on the first attempt. Figure 3 shows the portion of users in the winner and loser group who had 2, 3, 4 … j attempts. Both groups have a heavy tailed distribution of attempts: the majority of users have a couple of attempts and a handful of users attempt many tasks. One can observe that, on average, the winners have more attempts than the losers group.
A Cox proportional hazards analysis shows that users who win on the first attempt have a 19% lower probability (p = 0.000) of stopping after each subsequent attempt. As Table 5 shows, this translates to approximately 1 additional attempt on average for the winner group. If the first win occurs on the third attempt, there is a smaller difference of 12% in whether the user continues participating. This suggests that the result of a user's first, and subsequent, competitions can be an important factor in later participation behavior: winning encourages users’ contribution.
Table 5. Comparison between the number of submissions for first time winners and losers
Winners in 1st
attempt Losers in 1st
attempt Mean 4.388817 3.20194 Variance 85.02092 25.54748 Observations 2307 169456 P(T<=t) two-tail 8.04E-10 t Critical two-tail 1.960985
249
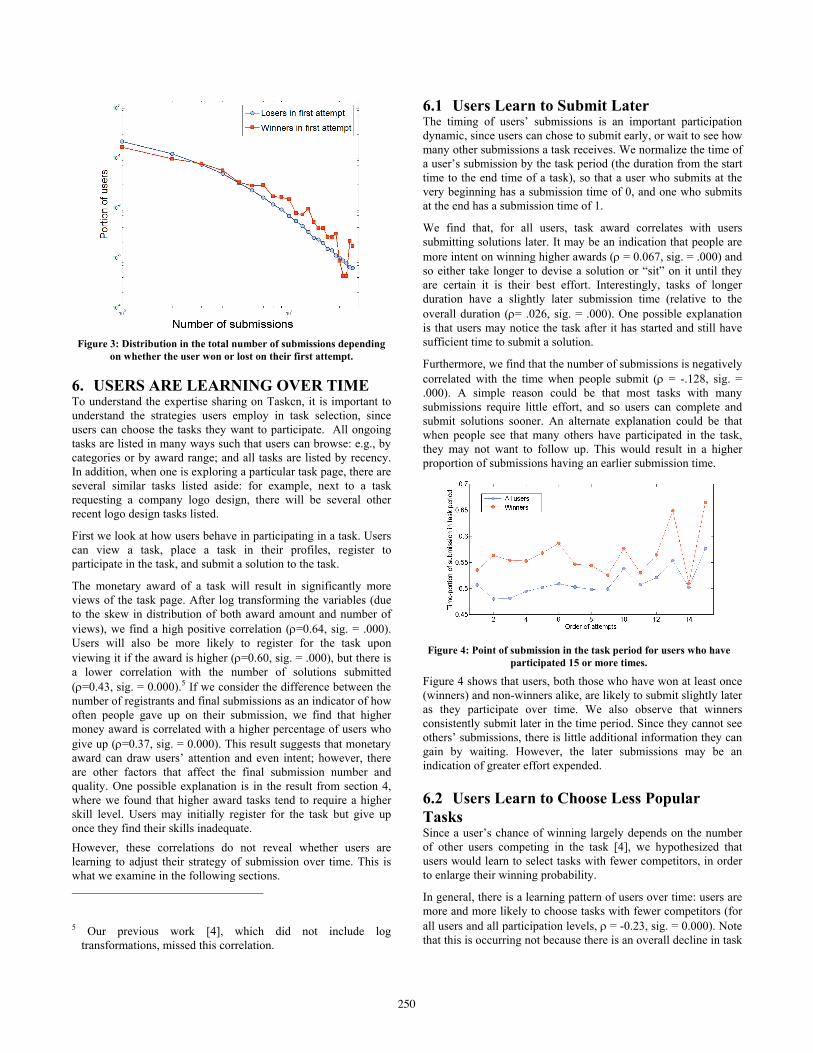
Figure 3: Distribution in the total number of submissions depending
on whether the user won or lost on their first attempt.
6. USERS ARE LEARNING OVER TIME To understand the expertise sharing on Taskcn, it is important to understand the strategies users employ in task selection, since users can choose the tasks they want to participate. All ongoing tasks are listed in many ways such that users can browse: e.g., by categories or by award range; and all tasks are listed by recency. In addition, when one is exploring a particular task page, there are several similar tasks listed aside: for example, next to a task requesting a company logo design, there will be several other recent logo design tasks listed.
First we look at how users behave in participating in a task. Users can view a task, place a task in their profiles, register to participate in the task, and submit a solution to the task.
The monetary award of a task will result in significantly more views of the task page. After log transforming the variables (due to the skew in distribution of both award amount and number of views), we find a high positive correlation (!=0.64, sig. = .000). Users will also be more likely to register for the task upon viewing it if the award is higher (!=0.60, sig. = .000), but there is a lower correlation with the number of solutions submitted (!=0.43, sig. = 0.000).5 If we consider the difference between the number of registrants and final submissions as an indicator of how often people gave up on their submission, we find that higher money award is correlated with a higher percentage of users who give up (!=0.37, sig. = 0.000). This result suggests that monetary award can draw users’ attention and even intent; however, there are other factors that affect the final submission number and quality. One possible explanation is in the result from section 4, where we found that higher award tasks tend to require a higher skill level. Users may initially register for the task but give up once they find their skills inadequate. However, these correlations do not reveal whether users are learning to adjust their strategy of submission over time. This is what we examine in the following sections. 5 Our previous work [4], which did not include log
transformations, missed this correlation.
6.1 Users Learn to Submit Later The timing of users’ submissions is an important participation dynamic, since users can chose to submit early, or wait to see how many other submissions a task receives. We normalize the time of a user’s submission by the task period (the duration from the start time to the end time of a task), so that a user who submits at the very beginning has a submission time of 0, and one who submits at the end has a submission time of 1.
We find that, for all users, task award correlates with users submitting solutions later. It may be an indication that people are more intent on winning higher awards (! = 0.067, sig. = .000) and so either take longer to devise a solution or “sit” on it until they are certain it is their best effort. Interestingly, tasks of longer duration have a slightly later submission time (relative to the overall duration (!= .026, sig. = .000). One possible explanation is that users may notice the task after it has started and still have sufficient time to submit a solution.
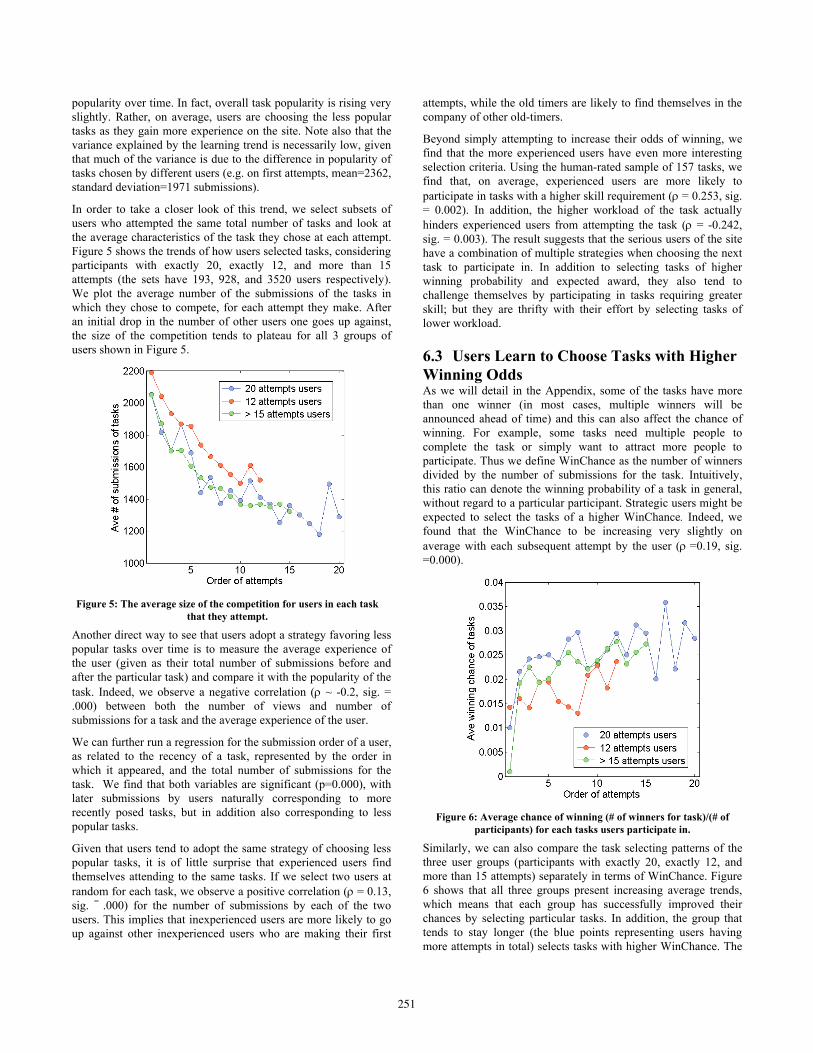
Furthermore, we find that the number of submissions is negatively correlated with the time when people submit (! = -.128, sig. = .000). A simple reason could be that most tasks with many submissions require little effort, and so users can complete and submit solutions sooner. An alternate explanation could be that when people see that many others have participated in the task, they may not want to follow up. This would result in a higher proportion of submissions having an earlier submission time.
Figure 4: Point of submission in the task period for users who have
participated 15 or more times.
Figure 4 shows that users, both those who have won at least once (winners) and non-winners alike, are likely to submit slightly later as they participate over time. We also observe that winners consistently submit later in the time period. Since they cannot see others’ submissions, there is little additional information they can gain by waiting. However, the later submissions may be an indication of greater effort expended.
6.2 Users Learn to Choose Less Popular Tasks Since a user’s chance of winning largely depends on the number of other users competing in the task [4], we hypothesized that users would learn to select tasks with fewer competitors, in order to enlarge their winning probability.
In general, there is a learning pattern of users over time: users are more and more likely to choose tasks with fewer competitors (for all users and all participation levels, !"= -0.23, sig. = 0.000). Note that this is occurring not because there is an overall decline in task
250
popularity over time. In fact, overall task popularity is rising very slightly. Rather, on average, users are choosing the less popular tasks as they gain more experience on the site. Note also that the variance explained by the learning trend is necessarily low, given that much of the variance is due to the difference in popularity of tasks chosen by different users (e.g. on first attempts, mean=2362, standard deviation=1971 submissions).
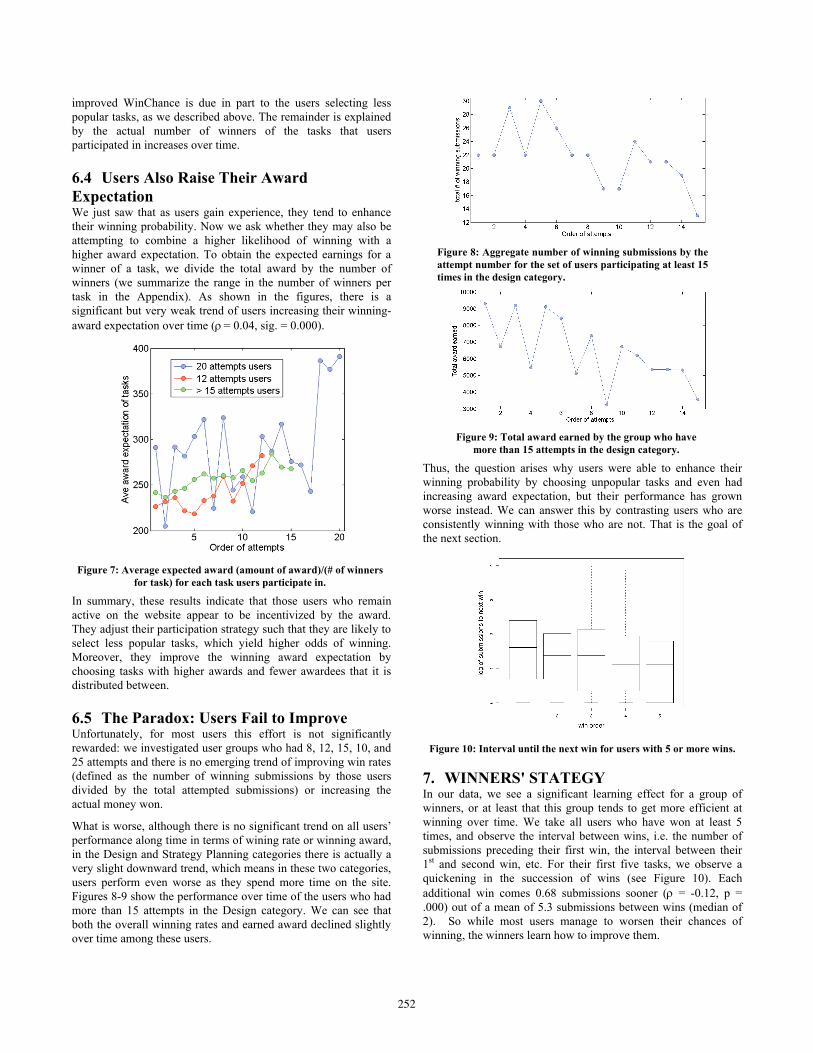
In order to take a closer look of this trend, we select subsets of users who attempted the same total number of tasks and look at the average characteristics of the task they chose at each attempt. Figure 5 shows the trends of how users selected tasks, considering participants with exactly 20, exactly 12, and more than 15 attempts (the sets have 193, 928, and 3520 users respectively). We plot the average number of the submissions of the tasks in which they chose to compete, for each attempt they make. After an initial drop in the number of other users one goes up against, the size of the competition tends to plateau for all 3 groups of users shown in Figure 5.
Figure 5: The average size of the competition for users in each task
that they attempt.
Another direct way to see that users adopt a strategy favoring less popular tasks over time is to measure the average experience of the user (given as their total number of submissions before and after the particular task) and compare it with the popularity of the task. Indeed, we observe a negative correlation (! ~ -0.2, sig. = .000) between both the number of views and number of submissions for a task and the average experience of the user.
We can further run a regression for the submission order of a user, as related to the recency of a task, represented by the order in which it appeared, and the total number of submissions for the task. We find that both variables are significant (p=0.000), with later submissions by users naturally corresponding to more recently posed tasks, but in addition also corresponding to less popular tasks.
Given that users tend to adopt the same strategy of choosing less popular tasks, it is of little surprise that experienced users find themselves attending to the same tasks. If we select two users at random for each task, we observe a positive correlation (! = 0.13, sig. = .000) for the number of submissions by each of the two users. This implies that inexperienced users are more likely to go up against other inexperienced users who are making their first
attempts, while the old timers are likely to find themselves in the company of other old-timers.
Beyond simply attempting to increase their odds of winning, we find that the more experienced users have even more interesting selection criteria. Using the human-rated sample of 157 tasks, we find that, on average, experienced users are more likely to participate in tasks with a higher skill requirement (! = 0.253, sig. = 0.002). In addition, the higher workload of the task actually hinders experienced users from attempting the task (! = -0.242, sig. = 0.003). The result suggests that the serious users of the site have a combination of multiple strategies when choosing the next task to participate in. In addition to selecting tasks of higher winning probability and expected award, they also tend to challenge themselves by participating in tasks requiring greater skill; but they are thrifty with their effort by selecting tasks of lower workload.
6.3 Users Learn to Choose Tasks with Higher Winning Odds As we will detail in the Appendix, some of the tasks have more than one winner (in most cases, multiple winners will be announced ahead of time) and this can also affect the chance of winning. For example, some tasks need multiple people to complete the task or simply want to attract more people to participate. Thus we define WinChance as the number of winners divided by the number of submissions for the task. Intuitively, this ratio can denote the winning probability of a task in general, without regard to a particular participant. Strategic users might be expected to select the tasks of a higher WinChance. Indeed, we found that the WinChance to be increasing very slightly on average with each subsequent attempt by the user (! =0.19, sig. =0.000).
Figure 6: Average chance of winning (# of winners for task)/(# of
participants) for each tasks users participate in.
Similarly, we can also compare the task selecting patterns of the three user groups (participants with exactly 20, exactly 12, and more than 15 attempts) separately in terms of WinChance. Figure 6 shows that all three groups present increasing average trends, which means that each group has successfully improved their chances by selecting particular tasks. In addition, the group that tends to stay longer (the blue points representing users having more attempts in total) selects tasks with higher WinChance. The
251
improved WinChance is due in part to the users selecting less popular tasks, as we described above. The remainder is explained by the actual number of winners of the tasks that users participated in increases over time.
6.4 Users Also Raise Their Award Expectation We just saw that as users gain experience, they tend to enhance their winning probability. Now we ask whether they may also be attempting to combine a higher likelihood of winning with a higher award expectation. To obtain the expected earnings for a winner of a task, we divide the total award by the number of winners (we summarize the range in the number of winners per task in the Appendix). As shown in the figures, there is a significant but very weak trend of users increasing their winning-award expectation over time (! = 0.04, sig. = 0.000).
Figure 7: Average expected award (amount of award)/(# of winners
for task) for each task users participate in.
In summary, these results indicate that those users who remain active on the website appear to be incentivized by the award. They adjust their participation strategy such that they are likely to select less popular tasks, which yield higher odds of winning. Moreover, they improve the winning award expectation by choosing tasks with higher awards and fewer awardees that it is distributed between.
6.5 The Paradox: Users Fail to Improve Unfortunately, for most users this effort is not significantly rewarded: we investigated user groups who had 8, 12, 15, 10, and 25 attempts and there is no emerging trend of improving win rates (defined as the number of winning submissions by those users divided by the total attempted submissions) or increasing the actual money won.
What is worse, although there is no significant trend on all users’ performance along time in terms of wining rate or winning award, in the Design and Strategy Planning categories there is actually a very slight downward trend, which means in these two categories, users perform even worse as they spend more time on the site. Figures 8-9 show the performance over time of the users who had more than 15 attempts in the Design category. We can see that both the overall winning rates and earned award declined slightly over time among these users.
Figure 8: Aggregate number of winning submissions by the attempt number for the set of users participating at least 15 times in the design category.
Figure 9: Total award earned by the group who have
more than 15 attempts in the design category. Thus, the question arises why users were able to enhance their winning probability by choosing unpopular tasks and even had increasing award expectation, but their performance has grown worse instead. We can answer this by contrasting users who are consistently winning with those who are not. That is the goal of the next section.
Figure 10: Interval until the next win for users with 5 or more wins.
7. WINNERS' STATEGY In our data, we see a significant learning effect for a group of winners, or at least that this group tends to get more efficient at winning over time. We take all users who have won at least 5 times, and observe the interval between wins, i.e. the number of submissions preceding their first win, the interval between their 1st and second win, etc. For their first five tasks, we observe a quickening in the succession of wins (see Figure 10). Each additional win comes 0.68 submissions sooner (! = -0.12, p = .000) out of a mean of 5.3 submissions between wins (median of 2). So while most users manage to worsen their chances of winning, the winners learn how to improve them.
252
Even though there were only 231 users winning 5 or more tasks, their wins accounted for a full 19.9% of the total wins on the site. It is therefore especially interesting to observe that this core set of users learned effective strategies for winning.
So what is it that winners do differently? In many ways, they are just like other users. Winners (here defined as users who won at least once) tend to have the same strategy as the rest of the users, in that they participate in less popular tasks over time. However, they tend to take longer to submit the task (note that the content of other submissions is not visible users before the task finishes, so that one does not benefit from seeing others' solutions). All submitters except for winners have a mean of .5039, which indicates these users tend to submit solutions in the middle of the task duration; while the winners, are likely to submit later at 0.6176 (after 61.8% of the task period has elapsed). The difference is statistically significant at p =.001. Similarly, comparing users from the winner group (who won at least once) and the rest of the users, we find that the winners tend to submit later than other users (mean difference = 0.095, sig. = .000). Figure 7 shows that like all users, winners also tend to delay their submission time over the sequence of attempts, but they also have a consistent delay relative to other users: they are always submitting later than others.
Figure 11: Ave-submissions of the tasks users who had at least 5 attempts participated: losers are those who have never won and
winners are those who won at least 5 times.
Similarly, when considering popularity, winners are selecting less and less popular tasks on average. But the winning group has actually been successful in selecting the tasks of even lower popularity, starting with their very first attempt. The difference is significant (sig. < 0.0001). As we can see in the Figure 11, the winner group has always a significant lower average number of competitors than the loser group (defined by those users who had never won in all their at least 5 attempts). This result does not directly suggest that these users are more expert, but it does show that they on average more aggressively practice the strategy of choosing unpopular tasks, in order to enhance their winning probability.
Similarly, the winner group is often able to find tasks of higher winning chance on average. The difference is also statistically significant (sig. < 0.0001). (See Figure 12.)
Figure 12: Ave-WinChance of the tasks users who had at least 5 attempts participated: losers are those who have never won and
winners are those who won at least 5 times.
However, there is no difference between winners and others in terms of award expectation over time, although averages for the two groups both hint at a slight upward trend.
The comparison between the winner group and others implies winners are better than others at starting and sticking with a strategy that will improve their winning chance. This result is consistent with our previous finding that the best predictor of whether an individual will win is the size of the competition, only then followed by the expertise of the user. Winners are simply better at executing this strategy.
8. RELATED WORK There have been a number of studies of high-stakes auction bidding behavior and students' learning bidding strategies in experimental economics experiments, but relatively few empirical studies of learning in online markets. Even there, most studies have been restricted to online auctions, where users compete to purchase goods. On eBay, it has been found that users learn over time to snipe, or submit their bids close to the end of the bidding period [7]. Although the timing of the bid should not matter if all players are rational and submit their true valuation, early bidding can prompt irrational bidders to up their bid. It is therefore advantageous to submit one’s bid later, and indeed, 13% of the bids on eBay occur in the last 5 minutes of the auction [8]. Wilcox [7] also found that more experienced users are less likely to submit multiple bids on the same item (for example increasing their limit once they observe that they have been outbid), especially for items with a large common value component, as opposed to items where individuals have different private valuations. In our case, we studied the timing of the submission of the solution; however, the solution is not visible to other competitors, so that it serves only as an indirect signal by adding to the total number of submissions for a task. Therefore users would not be prompted to improve their submission by seeing the work of others.
Little is known empirically about the success of markets for expertise. It has been modeled [9], though not measured. In sites such as eLance, where requesters submit tasks and individuals or teams submit bids to complete the task, decentralized schemes can in theory do very well in comparison to centralized schemes. In this scenario individuals must coordinate to submit bids, when they might know little about the capabilities of the others with
253
whom they are coordinating or competing. Similarly, the requester must select bids for one or more solutions, without a centralized broker to assemble teams. The ex-ante quality of the output is unknown. In comparison, our analysis looks at a simpler problem where bidders directly submit completed solutions to tasks and no coordination occurs. The learning stems from task selection in order to increase the chance of winning.
Our finding that a large fraction of the contributions, in this case winning task solutions, is contributed by a small core group of individuals, concurs with what has been observed in other online settings. This was first observed, to our knowledge, by Hiltz and Turoff [10], and has been found in a large number of other computer-mediated communication (CMC) systems and other online settings. For example, there have been numerous studies of the skewness of contribution to Internet peer production systems, including Wikipedia [6] and participation in online social media and filtering such as Del.icio.us [11] and FlickR [12]. In Wikipedia, a subset of authors not only make a large fraction of the edits, but their edits have greater longevity [6]. In contrast, users who casually contribute content have a higher rate of bad edits that are quickly reversed. In all these systems, participation is open to anyone, but a large portion of the content is contributed by a small minority of the participants. Nonetheless, quality is high: for example, Wikipedia has been shown to be close in accuracy to Encyclopedia Britannica [13]. Interestingly, a recent trend has been toward increased contribution by non-elite users to both Wikipedia and Del.icio.us [14], with interesting implications for the quality and growth of the systems.
Recent work has examined the dynamics of expertise sharing in other online forums besides Taskcn. These systems were quite different from Taskcn, and expose other points in the design space of expertise sharing systems. We examined the relatively focused Java Forum [15] hosted by Sun, where users request and share programming expertise, and the very diverse Yahoo! Answers [16], where many questions are prompts for discussion or support, rather than pure information or advice seeking. In Java Forum, we found that the most active users also tend to be the most expert. They are also likely to be helping newbie questions as well as technical questions requiring high levels of expertise. For Yahoo Answers, we found that in top level categories, such as science and math, where most questions are of a factual nature, specializing within a subcategory correlates with a higher proportion of “winning” answers. Harper et al. [17] conducted a controlled field study comparing answer quality in Google and Yahoo Answers and found that the system that offered money (Google Answers) yielded better answers.
9. CONCLUSIONS We observed several characteristics in users’ activity over time on Taskcn that have implications for crowdsourcing and similar phenomena. On Witkey sites, many participants are willing to put their solutions forward in exchange for a chance to win payment. What is more, the requester of the task benefits by being able to choose among different solutions. While some designers perceive such sites as encouraging "spec work", there is little doubt that Witkeys present an open marketplace to match workers with tasks, where it makes sense for the workers to present up-front effort.
The patterns we observe hold clues to both the success of a freelance marketplace and crowdsourcing, and raise interesting design implications for such sites. On Taskcn, most users become inactive after only a few submissions. Others keep attempting tasks. Among those users, we see different behaviors. Over time, users will tend to select tasks where they are competing against fewer opponents, to increase their chances of winning. They will also, perhaps counterproductively, select tasks with higher expected rewards. However, on average, they do not increase their chances of winning, and in some categories of tasks, their chances actually decrease. This does not paint the full picture, however, because there is a very small core of successful users who manage not only to win multiple tasks, but to increase their win-to-submission ratio over time. Whether this is a case of the rich getting richer, since their successful wins give them a reputation that may enhance the chances that their submission is selected, or whether it true evidence of learning, remains unclear. The design implications of this work are important: it likely that it will be necessary to incentivize this core group of winners in order to maintain their continued presence on the site. It should be possible to identify and reward these users. For example, one could modify the interface to guide users to less popular tasks, or ones that match their particular expertise based on prior tasks they had participated in. As well, it is likely to be critical to identify promising participants early (perhaps earlier than is currently possible on Taskcn), since many people leave after only a couple of task attempts. Furthermore, given the way that Taskcn works, it is critical to continue to drive large numbers of prospective members towards the site, since those members may over time become a part of small, but highly active core of users that provides 80% of the solutions. In future work, we would like to further examine whether task awards are commensurate with the skill and effort level they require. We would also like to know whether both users and task providers have similar expectations about a task. This is likely to require a brief survey instrument to understand their expectations. We also want to examine whether a core group is necessary to other expertise sharing systems (e.g., Yahoo Answers) and how its members' trajectories vary over time. Finally, we would like to compare learning trends in question-answer forums that do not support cash rewards, but instead contain reputation scores based on having ones answers selected as best.
10. ACKNOWLEDGMENTS We would like to thank George Furnas, Jun Zhang, Xiao Wei, Paul Resnick, and James Fowler for insightful discussions. We’d also like to thank Yan Chen for conversations about monetary incentives and answer quality in Google Answers. This work was funded in part by Intel Research, the Army Research Institute, and the National Science Foundation (grant IRI-9702904).
11. REFERENCES [1] J. Howe, "The Rise of Crowdsourcing," Wired, vol. 14, pp.
1-4, 2006. [2] J. Hempel., "Crowdsourcing: Milk the Masses for
Inspiration," in Business Week, 2006, pp. 38. [3] T. W. Malone, The Future of Work. Cambridge, MA:
Harvard Business School Press, 2004.
254
[4] J. Yang, L. A. Adamic, and M. S. Ackerman, "Competing to Share Expertise: the Taskcn Knowledge Sharing Community," presented at International Conference on Weblogs and Social Media, 2008.
[ 5] P. Dasgupta and J. Stiglitz, "Industrial Structure and the Nature of Innovative Activity," The Economic Journal, vol. 90, pp. 266-293, 1980.
[6] B. T. Adler and L. de Alfaro, "A Content-Driven Reputation System for the Wikipedia," WWW2007, 2007.
[7] R. T. Wilcox, "Experts and Amateurs: The Role of Experience in Internet Auctions," Marketing Letters, vol. 11, pp. 363-374, 2000.
[8] L. Brothers, J. Hollan, J. Nielsen, S. Stornetta, S. Abney, G. Furnas, and M. Littman, "Supporting Informal Communication via Ephemeral Interest Groups," in Conference on Computer-Supported Cooperative Work, 1992, pp. 84-90.
[9] A. Arora, V. Choudhary, K. Kannan, R. Krishnan, and R. Padman, "Coordination and decision-making in a market with uncertainty," Management Science.
[10] S. R. Hiltz and M. Turoff, The Network Nation. Reading, MA: Addison-Wesley, 1978.
[11] S. A. Golder and B. A. Huberman, "Usage patterns of collaborative tagging systems," Journal of Information Science, vol. 32, pp. 198, 2006.
[12] C. Marlow, M. Naaman, D. Boyd, and M. Davis, "HT06, tagging paper, taxonomy, Flickr, academic article, to read," Proceedings of the seventeenth conference on Hypertext and hypermedia, pp. 31-40, 2006.
[13] J. Giles, "Special Report: Internet Encyclopedias Go Head to Head," Nature, vol. 438, pp. 900-901, 2005.
[14] A. Kittur, E. Chi, B. A. Pendleton, B. Suh, and T. Mytkowicz, "Power of the Few vs. Wisdom of the Crowd", http://www.viktoria.se/altchi/index.php?action=showsubmission&id=41.
[15] J. Zhang, M. S. Ackerman, and L. Adamic, "Expertise Networks in Online Communities: Structure and Algorithms," WWW 2007, 2007.
[16] J. Zhang, L. Adamic, M. S. Ackerman, and E. Bakshy, "Everyone knows something: Examining knowledge sharing on Yahoo Answers," World Wide Web (WWW'08), 2008.
[17] F. M. Harper, D. Raban, S. Rafaeli, J. A. Konstan, “Predictors of Answer Quality in Online Q&A Sites”, CHI2008, 2008.
Appendix: POSTERS’ PARTICIPATION
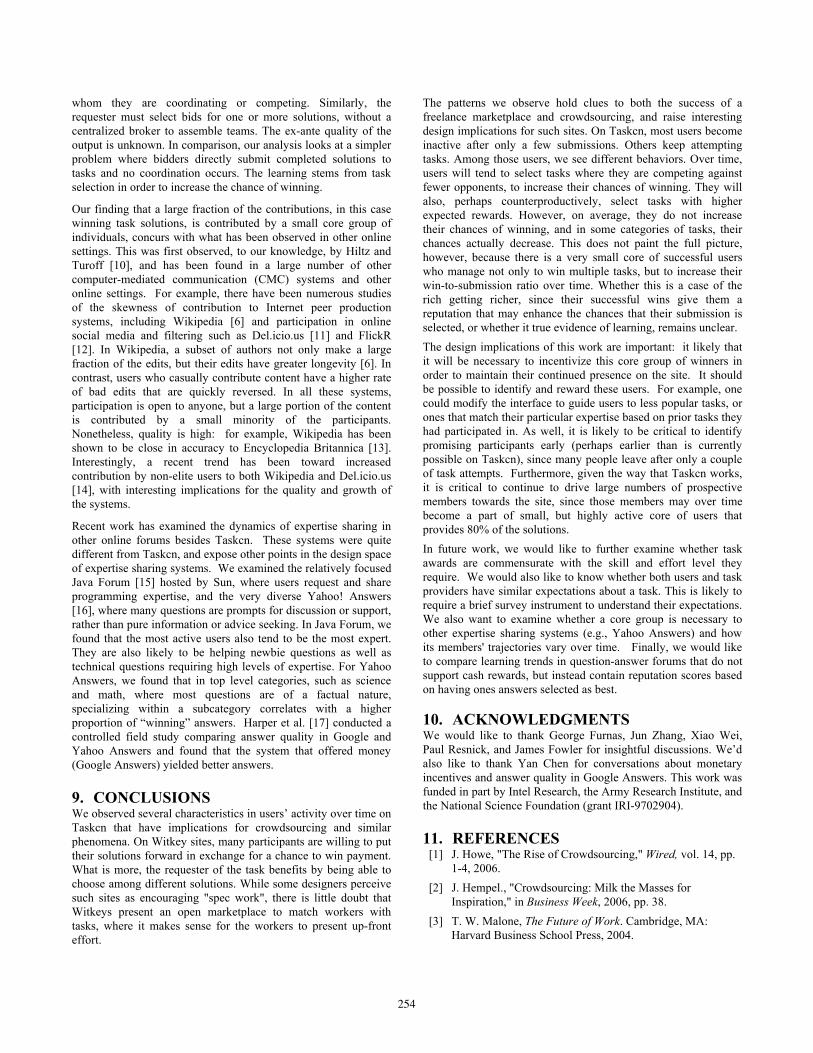
Multi-Winner Tasks Some tasks offer multiple winners. In the extreme, some tasks promise to reward all participants. A task might ask people to register on a particular website: when they get the verification of registration they win the very small fee. For example, in the Programming category, there is a multi-winner task that is actually recruiting people who can program, and it consequently had 33 winners. In other cases, requesters simply want to
encourage people’s contribution by offering more winning slots in order to get as many as possible participants. First we look at the distribution of multiple-winner tasks among different categories. The Design category has the largest number of tasks but the lowest proportion of multi-winner tasks. The Personal Service category has the highest portion of multi-winner tasks. The tendency of a category to contain multi-winner tasks appears to correspond to the nature of the tasks themselves. For example, there are a considerable number of tasks in these three categories: Others, Personal Service, and Website, which ask participants to register on some new website, post threads on forums, or recommend appropriate people for another task. These tasks are different from design tasks in that they can benefit from multiple solutions and each of these solutions is valuable to some extent; while in the Design category, usually only one solution will be implemented.
Figure A1: Multi-winner task distribution.
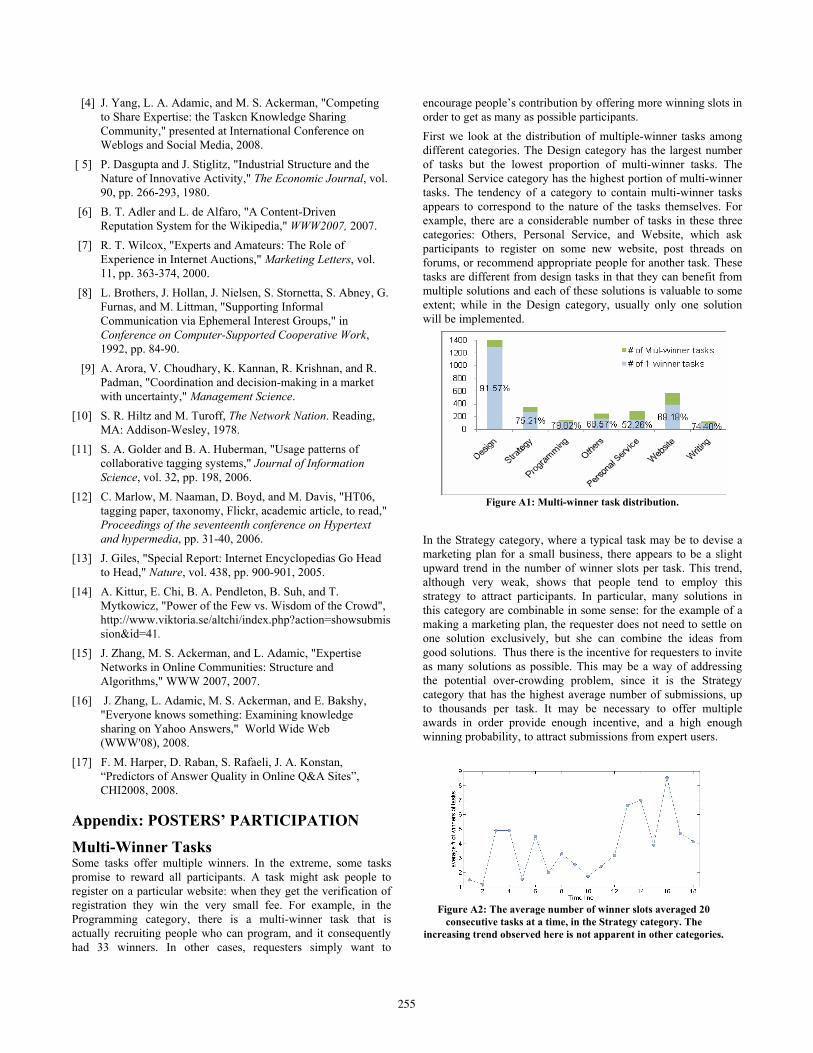
In the Strategy category, where a typical task may be to devise a marketing plan for a small business, there appears to be a slight upward trend in the number of winner slots per task. This trend, although very weak, shows that people tend to employ this strategy to attract participants. In particular, many solutions in this category are combinable in some sense: for the example of a making a marketing plan, the requester does not need to settle on one solution exclusively, but she can combine the ideas from good solutions. Thus there is the incentive for requesters to invite as many solutions as possible. This may be a way of addressing the potential over-crowding problem, since it is the Strategy category that has the highest average number of submissions, up to thousands per task. It may be necessary to offer multiple awards in order provide enough incentive, and a high enough winning probability, to attract submissions from expert users.
Figure A2: The average number of winner slots averaged 20
consecutive tasks at a time, in the Strategy category. The increasing trend observed here is not apparent in other categories.
255


![Getting (and Sharing!) the FACTS: Factors, Analogies, CER’s & … FACTS... · 2017. 1. 23. · | 7 | Crowdsourcing* The crowdsourcing model [taps] the collective knowledge of the](https://static.fdocuments.us/doc/165x107/60b5543f4f531500087ece17/getting-and-sharing-the-facts-factors-analogies-ceras-facts-2017.jpg)