English: Power of the Crowd - Keynote on Crowd funding, Crowd sourcing and Crowd Movement (English)

Vis Comput (2012) 28:1039–1048DOI 10.1007/s00371-012-0731-y
O R I G I NA L A RT I C L E
Crowd simulation: applying mobile grids to the social force model
Priscila Saboia · Siome Goldenstein
Published online: 30 May 2012© Springer-Verlag 2012
Abstract The social force model (SF) is able to reproducemany emergent phenomena observed in real crowds. Unfor-tunately, in some situations, such as low density environ-ments, SF may produce counterintuitive results where thetrajectories simulated look more like particles than to realpeople. We modify the SF model through the use of a mo-bile grid to allow the simulated pedestrians to change thedirection of their desired velocity at reasonable times, thusavoiding nearby blocked or crowded areas smoothly. Our ex-periments focus on qualitative behavior, and verify that ourmodel produces the desired trajectories of the pedestrians,achieving softer and more coherent trajectories when com-pared to the pure SF model solution. Like SF, our modelreproduces the “faster-is-slower” and the arching underly-ing the clogging effects. Finally, we examine the occupationrates of the space when pedestrians were submitted to nar-rowed corridors and observe the “edge effect.”
Keywords Crowd simulation · Social force model · Mobilegrid
1 Introduction
A crowd is as a large group of individuals in the same phys-ical environment, sharing a common purpose, with the pos-sibility of acting differently than when they are by them-selves [5].
P. Saboia (�) · S. GoldensteinInstitute of Computing, University of Campinas, Campinas, SP,Brazile-mail: [email protected]
The movement of crowds includes a number of differentpeople, or agents, moving independently in a shared envi-ronment, aiming to reach specific destinations. Understand-ing the movement of crowds is essential to plan and improvepublic places, not only to facilitate and expedite the move-ment of citizens, but also to guarantee their safety, especiallyin conditions of imminent danger when there is need forevacuation.
Behavior patterns in crowds arise from the interactionsand influences between individuals and environment. Dy-namic aspects of evacuation processes have been character-ized through modeling, due to the absence of data from realevacuations. Several computer models have been proposedin this direction. The social force model (SF) [5] is one ofthem, in which the motion of each pedestrian is a result ofboth physical and psychological forces.
This model has described successfully phenomena suchas the “faster-is-slower” and the arching underlying theclogging effects. Nevertheless, in some low-density scenar-ios, experiments show that the simulated individuals do notbehave as expected, working as irrational particles ratherthan rational people. For example, in the cited model, itis common to watch many simulated individuals going re-peatedly and directly towards columns, rather than finding away to deviate and safely exit the room. This occurs becausethe desired direction of a pedestrian’s motion always pointsto the target position, even in the presence of obstacles (orother pedestrians) between its current position and the targetposition.
Here, we modify the SF model, redesigning the force ofdesire in order to permit pedestrians to change their desireddirection of movement voluntarily, based on their percep-tions of other pedestrians and obstacles in their surround-ings. We mapped the space around each pedestrian as amobile grid, (as in [3]) in order to obtain spatial informa-

1040 P. Saboia, S. Goldenstein
tion concerning the surroundings and to choose the desirefore direction used in the SF model. In our experiments, weshow that the modified model improves the trajectories ofthe pedestrians, while maintaining its ability to reproducethe “faster-is-slower” and the arching underlying the clog-ging effects. Furthermore, our experiments demonstrate theemergent phenomenon called “edge effects” that is observedin real crowds according to Still [19].
2 Related work
We can roughly classify the approaches used for crowd sim-ulation into two categories: macroscopic and microscopicmodels. Macroscopic models describe the dynamic of thedensity and velocity of the whole crowd. Within this ap-proach, Hughes [9], Huang et al. [8], and Treuille et al. [21],utilize fluid dynamics to describe the density and velocityof the crowd by the means of partial differential equations.Musse et al. [14] propose a model based on trajectories cap-tured automatically from filmed video sequences. These tra-jectories are grouped into similar classes and an extrapolatedvelocity field is generated for each class.
Microscopic models describe the speed and position ofeach agent in a given time. The work of Reynolds [16]is pioneer in this direction where each simulated bird isimplemented as an independent actor that navigates ac-cording to its local perception of the dynamic environ-ment. Tu and Terzopoulos [22] simulated groups of artificialfishes.
Kapadia et al. [10] propose the use of egocentric affor-dance fields for obtain the speed and the direction of eachpedestrian at each step simulation. Varas et al. [23] and Perezet al. [15] introduce cellular automata models for motion, inwhich pedestrians are located at nodes of a grid and theircoordinates are updated at discrete time intervals. Mura-matsu et al. [12], Tajima and Nagatani [20], and Guo andHuang [3] define navigational models by probabilistic andstatistic functions based on lattice-gas concepts, a specialcase of cellular automata.
Lerner et al. [11] present a approach for fitting behav-iors to simulated pedestrian crowds. These behaviors go be-yond the walk such as talk on cellular, comb hair, move thehead left, right, down, and back. Musse and Thalmann [13]proposed a hierarchical crowd organization with groups ofdifferent autonomy levels. Goldenstein et al. [1] used non-linear approach for agent control. Two nonlinear dynamicsystems run in parallel, one for the heading direction, andthe second for assisting the data fusion of the attractors andrepellers. Later, the authors used the low-level system in ahybrid configuration [2] that allowed complex crowd envi-ronments and a global solution without agents getting stuckin local minima. Finally, social force models introduced by
Helbing et al. [5] describe the motion of each pedestrian asa result of physical and psychological forces. The crowddynamics is consequence of local interaction between thepedestrians.
There are two types of analysis over the behavior of in-dividuals in a crowd, quantitative and qualitative. Quantita-tive analysis is when one or more well-defined measurablequantities have their magnitude accurately measured, allow-ing comparisons and optimization.
As an example of quantitative analysis, Henderson wasa pioneer [7] when collected and established distributionfunctions for the speed and the velocity of individuals inreal crowds. A more recent example is the work by Shaoand Terzopoulos [17], which measured, collected, and mini-mized the number of collisions among the individuals of thecrowd.
On the other hand, qualitative analysis is when re-searchers cling to aspects less susceptible to accurate mea-surement, such as visual patterns that emerge on the crowd,or specific arrangements of the individuals in space. Follow-ing this line of study, Helbing and Molnár [4] and Still [19],were concerned to develop computer models able to repro-duce crowd-spatial phenomena such as the “edge effects”and arching underlying the clogging effects.
Lately, facing the diversity of models, metrics, and so-lutions for the analysis of the movement of crowds, Singhet al. [18] realized the importance of standardizing and fa-cilitating the evaluation and the comparison of the differentapproaches applied to such problem. Thus, they proposed abenchmark suite for evaluating steering behaviors.
In this paper, we focus our analysis in the qualitative as-pects of our method.
3 Overview
We modify the social force model (SF) to improve the waypedestrians approach obstacles and other pedestrians; seeFig. 1. To do so, we redesign the force of desire compo-nent of the model to let pedestrians voluntarily change theirdirections of movement, based on their perceptions of theenvironment.
For each pedestrian, a mobile grid help us find the direc-tion of movement, inspired by Guo and Huang [3]. We di-vide the area around the pedestrian in n possible directions,each with a different weight.
At each time t of simulation, the direction of the forceof desire of a pedestrian is the one with the greatest weightvalue on its mobile grid.
In the next sections, we describe the SF in more detail,introduce the mobile grids approach for each pedestrian, aswell as the assignment of weight values.
Crowd simulation: applying mobile grids to the social force model 1041
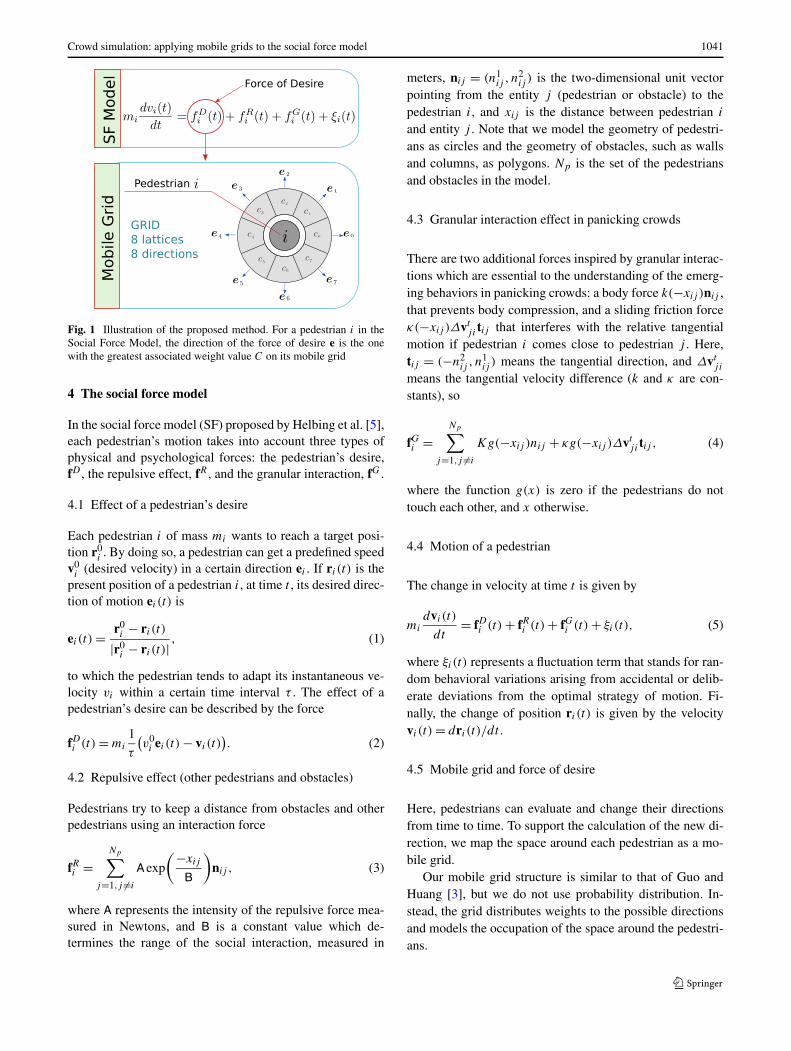
Fig. 1 Illustration of the proposed method. For a pedestrian i in theSocial Force Model, the direction of the force of desire e is the onewith the greatest associated weight value C on its mobile grid
4 The social force model
In the social force model (SF) proposed by Helbing et al. [5],each pedestrian’s motion takes into account three types ofphysical and psychological forces: the pedestrian’s desire,fD , the repulsive effect, fR , and the granular interaction, fG.
4.1 Effect of a pedestrian’s desire
Each pedestrian i of mass mi wants to reach a target posi-tion r0
i . By doing so, a pedestrian can get a predefined speedv0i (desired velocity) in a certain direction ei . If ri (t) is the
present position of a pedestrian i, at time t , its desired direc-tion of motion ei (t) is
ei (t) = r0i − ri (t)
|r0i − ri (t)|
, (1)
to which the pedestrian tends to adapt its instantaneous ve-locity vi within a certain time interval τ . The effect of apedestrian’s desire can be described by the force
fDi (t) = mi
1
τ
(v0i ei (t) − vi (t)
). (2)
4.2 Repulsive effect (other pedestrians and obstacles)
Pedestrians try to keep a distance from obstacles and otherpedestrians using an interaction force
fRi =Np∑
j=1,j �=i
A exp
(−xij
B
)nij , (3)
where A represents the intensity of the repulsive force mea-sured in Newtons, and B is a constant value which de-termines the range of the social interaction, measured in
meters, nij = (n1ij , n
2ij ) is the two-dimensional unit vector
pointing from the entity j (pedestrian or obstacle) to thepedestrian i, and xij is the distance between pedestrian i
and entity j . Note that we model the geometry of pedestri-ans as circles and the geometry of obstacles, such as wallsand columns, as polygons. Np is the set of the pedestriansand obstacles in the model.
4.3 Granular interaction effect in panicking crowds
There are two additional forces inspired by granular interac-tions which are essential to the understanding of the emerg-ing behaviors in panicking crowds: a body force k(−xij )nij ,that prevents body compression, and a sliding friction forceκ(−xij )Δvt
j itij that interferes with the relative tangentialmotion if pedestrian i comes close to pedestrian j . Here,tij = (−n2
ij , n1ij ) means the tangential direction, and Δvt
j i
means the tangential velocity difference (k and κ are con-stants), so
fGi =Np∑
j=1,j �=i
Kg(−xij )nij + κg(−xij )Δvtj itij , (4)
where the function g(x) is zero if the pedestrians do nottouch each other, and x otherwise.
4.4 Motion of a pedestrian
The change in velocity at time t is given by
mi
dvi (t)
dt= fDi (t) + fRi (t) + fGi (t) + ξi(t), (5)
where ξi(t) represents a fluctuation term that stands for ran-dom behavioral variations arising from accidental or delib-erate deviations from the optimal strategy of motion. Fi-nally, the change of position ri (t) is given by the velocityvi (t) = dri (t)/dt .
4.5 Mobile grid and force of desire
Here, pedestrians can evaluate and change their directionsfrom time to time. To support the calculation of the new di-rection, we map the space around each pedestrian as a mo-bile grid.
Our mobile grid structure is similar to that of Guo andHuang [3], but we do not use probability distribution. In-stead, the grid distributes weights to the possible directionsand models the occupation of the space around the pedestri-ans.

1042 P. Saboia, S. Goldenstein
Fig. 2 Mobile grid partitioned into 8 directions around a pedestrian i
(lighter gray circle)
Fig. 3 Lattices and directions of a mobile grid with 8 bins
5 Mobile grid
Just as in the SF model, each pedestrian i is represented bya circle of radius Ri . The mobile grid is an area formed byan annulus around a pedestrian i, evenly partitioned into n
directions, or bins. It is conventional to name as lattice eachone of the partitions, denoted by ck , where k ∈ [0, n − 1].
The annulus is formed by two concentric circles of cen-ter ri (t), where the inner radius of the circle is given byRi +η, and the radius of the external circumference is givenby the radius of the pedestrian’s greatest neighborhood, i.e.,max(PR,OR), where PR represents the radius of the neigh-borhood of the pedestrian i in relation to other pedestrians,and OR represents the radius of the neighborhood in relationto obstacles. The constant η represents the minimum dis-tance at which a pedestrian desires to be from other pedes-trians and obstacles. Figure 2 shows a pedestrian’s currentposition and an annulus around it.
The lattices are bounded by vectors in the sequenceL0,L1, . . . ,Ln−1, as illustrated in Fig. 3. Each lattice ck
has an opening angle θ = 360◦/n, a direction defined bythe vector dk
i , and two limiting unit vectors La and Lb ,respectively put in a counterclockwise direction, with a =(i modn) and b = ((i + 1)modn).
Fig. 4 Grid in the absence of obstacles in the direction of the vector dsi
Fig. 5 Endpoints zj1 and zj2 of the object j
Moreover, lattices are arranged in the counterclockwisedirection on the basis of the output vector ds
i (obtained inthe same way that ei in Eq. (1)).
In the absence of obstacles in the direction of the vectords
i , the grid is arranged so that the lattice c0 has its represen-tative vector d0
i = dsi , (Fig. 4). Otherwise, the direction of
d0i is obtained by taking into account the vector ds
i and theendpoints of the object j in relation to the pedestrian i.
Considering the points zj1 and zj2 as endpoints of theobject j , they are obtained based on the angle subtended byj to ri (t), which is the center of the pedestrian i, as onecan see in Fig. 5. Thus, once defined the endpoints and datavectors rizj1 and rizj2, the vector d0
i is equal to the vec-tor among those which present the smallest angle with thevector ds
i (Fig. 6).The grid is the mechanism to find the new desired di-
rection of the velocity ei (t) in Eq. (2). For that, there is aweight distribution (P k
i ) between its lattices, indicating thelikelihood of choosing each one. The direction of the chosenlattice will be the new desired direction of the velocity.

Crowd simulation: applying mobile grids to the social force model 1043
6 Distribution of weights on the grid
For a pedestrian i, the distribution of weights for each latticek is denoted by P k
i
Pki = Nδk
i Ik
(Dk
i + Accesski
2
). (6)
The term Accesski represents the measure of the accessibil-
ity of the lattice ck to a pedestrian i, i.e., how much obsta-cles and pedestrians are not obstructing the passage of thepedestrian i through the given lattice k. It is calculated bythe lowest value of Sk
ij
Accesski = min
j∈ωi
(Sk
ij
), (7)
where the set ωi represents all the pedestrians and obstaclesin the neighborhood of the pedestrian i. The term Sk
i,j rep-resents how much the pedestrian i is walking away from j ,inside the lattice k. Its value varies in the interval [0,1], andis calculated by
Ski,j =
{1, j doesn’t intersect k,
Aki,j + (1 − Ak
i,j )Bki,j , otherwise,
(8)
where the value of Akij represents a percentage of separation
between the pedestrian i and the part of the pedestrian (or
Fig. 6 Grid in the presence of an obstacle j in the direction of thevector ds
i
obstacle) j which has an intersection with the lattice k,
Aki,j =
⎧⎪⎪⎨
⎪⎪⎩
0, if Hki,j ≤ η,
Hki,j −η
ρ−Hki,j
, if η < Hki,j < ρ,
1, if Hki,j ≥ ρ,
(9)
where ρ is related to the radius of the neighborhood of thepedestrian i, and j is a neighbor pedestrian. ρ has the samevalue of the constant PR. On the other hand, being j a neigh-bor obstacle, ρ has the same value of the constant OR. Theconstants η and ρ determine the inferior and superior quota,respectively, for the value of Hk
i,j , which, in turn, representsa measure of the distance between the pedestrian i and thepiece of j inside the lattice ck . It is illustrated by Fig. 7.
In the Eq. (8), the term Bki,j represents the percentage of
θ , which is the angular opening of the lattice ck that is notoccupied by the piece of the pedestrian j that lies on thelattice ck ,
Bki,j = αk
i,j
θ, (10)
where the term αki,j is an angular value in the interval [0, θ ]
and represents a free angular opening of the lattice ck . Inthe case of nonoccurrence of any endpoint of j inside theregion of the lattice ck , αk
i,j must assume a null value, asillustrated in Fig. 8(a). This happens when j occupies ck sothat any angular opening is free, as in Fig. 8(b). The term Dk
i
(still referring to Eq. (6)) represents the strength that makes apedestrian walk towards its target according to the vector d0
i
Dki = D
(cos(θk,0) + 1)2
4, (11)
where the drift D, of which value is between 0 and 1, repre-sents the strength drifting in the direction d0
i from the pedes-trian’s current position to exit. θk,0 is the angle between theunit vector in direction dk
i and the unit vector in direction d0i .
Figure 9 shows the angle θ2,0 related to lattice c2. For a givenlattice, its value is proportional to its likelihood to the exit di-rection d0
i . This guarantees that pedestrians have lower pref-erence to take directions opposite to the exit.
The term N is a normalization factor responsible for en-suring that
∑d P k
i = 1, and δki models people’s preference
Fig. 7 Distance Hki,j used in
the calculation of Aki,j in three
possible situations. (a) Centralpoint of j is at the lattice ck .(b) There is an endpoint of j atthe lattice ck . (c) Neither thecentral point of j nor itsendpoints are at ck
1044 P. Saboia, S. Goldenstein
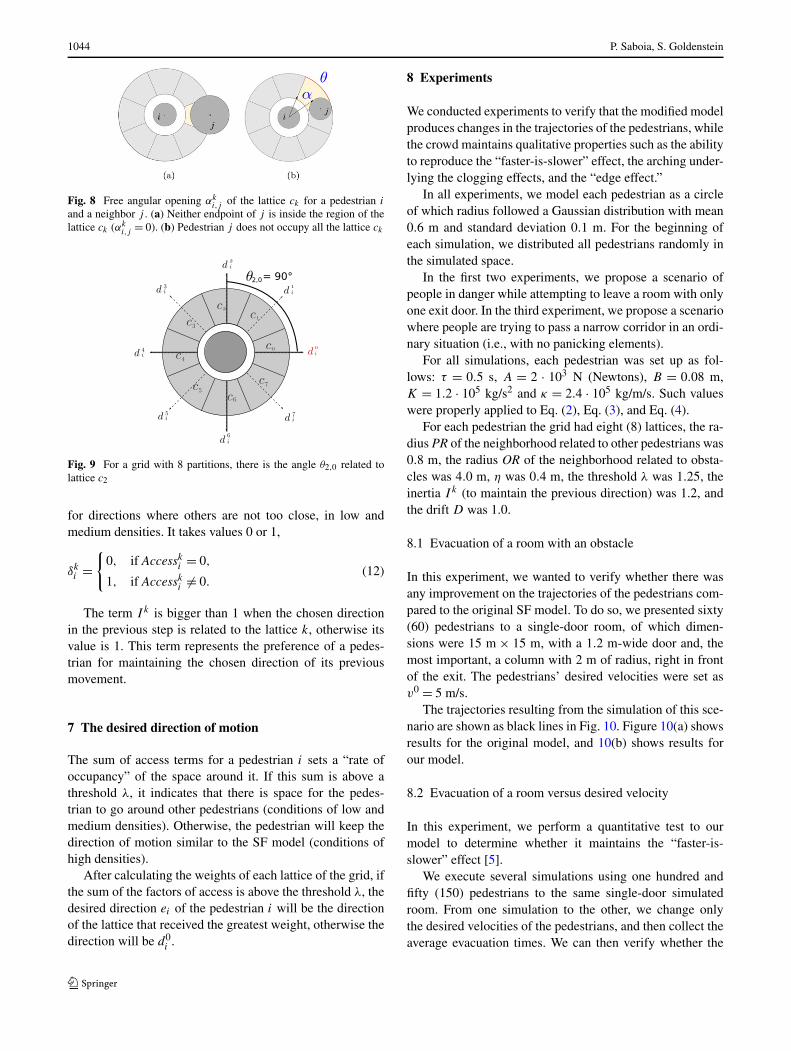
Fig. 8 Free angular opening αki,j of the lattice ck for a pedestrian i
and a neighbor j . (a) Neither endpoint of j is inside the region of thelattice ck (αk
i,j = 0). (b) Pedestrian j does not occupy all the lattice ck
Fig. 9 For a grid with 8 partitions, there is the angle θ2,0 related tolattice c2
for directions where others are not too close, in low andmedium densities. It takes values 0 or 1,
δki =
{0, if Accessk
i = 0,
1, if Accesski �= 0.
(12)
The term I k is bigger than 1 when the chosen directionin the previous step is related to the lattice k, otherwise itsvalue is 1. This term represents the preference of a pedes-trian for maintaining the chosen direction of its previousmovement.
7 The desired direction of motion
The sum of access terms for a pedestrian i sets a “rate ofoccupancy” of the space around it. If this sum is above athreshold λ, it indicates that there is space for the pedes-trian to go around other pedestrians (conditions of low andmedium densities). Otherwise, the pedestrian will keep thedirection of motion similar to the SF model (conditions ofhigh densities).
After calculating the weights of each lattice of the grid, ifthe sum of the factors of access is above the threshold λ, thedesired direction ei of the pedestrian i will be the directionof the lattice that received the greatest weight, otherwise thedirection will be d0
i .
8 Experiments
We conducted experiments to verify that the modified modelproduces changes in the trajectories of the pedestrians, whilethe crowd maintains qualitative properties such as the abilityto reproduce the “faster-is-slower” effect, the arching under-lying the clogging effects, and the “edge effect.”
In all experiments, we model each pedestrian as a circleof which radius followed a Gaussian distribution with mean0.6 m and standard deviation 0.1 m. For the beginning ofeach simulation, we distributed all pedestrians randomly inthe simulated space.
In the first two experiments, we propose a scenario ofpeople in danger while attempting to leave a room with onlyone exit door. In the third experiment, we propose a scenariowhere people are trying to pass a narrow corridor in an ordi-nary situation (i.e., with no panicking elements).
For all simulations, each pedestrian was set up as fol-lows: τ = 0.5 s, A = 2 · 103 N (Newtons), B = 0.08 m,K = 1.2 · 105 kg/s2 and κ = 2.4 · 105 kg/m/s. Such valueswere properly applied to Eq. (2), Eq. (3), and Eq. (4).
For each pedestrian the grid had eight (8) lattices, the ra-dius PR of the neighborhood related to other pedestrians was0.8 m, the radius OR of the neighborhood related to obsta-cles was 4.0 m, η was 0.4 m, the threshold λ was 1.25, theinertia I k (to maintain the previous direction) was 1.2, andthe drift D was 1.0.
8.1 Evacuation of a room with an obstacle
In this experiment, we wanted to verify whether there wasany improvement on the trajectories of the pedestrians com-pared to the original SF model. To do so, we presented sixty(60) pedestrians to a single-door room, of which dimen-sions were 15 m × 15 m, with a 1.2 m-wide door and, themost important, a column with 2 m of radius, right in frontof the exit. The pedestrians’ desired velocities were set asv0 = 5 m/s.
The trajectories resulting from the simulation of this sce-nario are shown as black lines in Fig. 10. Figure 10(a) showsresults for the original model, and 10(b) shows results forour model.
8.2 Evacuation of a room versus desired velocity
In this experiment, we perform a quantitative test to ourmodel to determine whether it maintains the “faster-is-slower” effect [5].
We execute several simulations using one hundred andfifty (150) pedestrians to the same single-door simulatedroom. From one simulation to the other, we change onlythe desired velocities of the pedestrians, and then collect theaverage evacuation times. We can then verify whether the

Crowd simulation: applying mobile grids to the social force model 1045
Fig. 10 (a) and (b) Trajectories of 60 pedestrians in the first experi-ment. (c) Screenshot of the first experiment with the modified SF model5.38 s after initialization
time for all pedestrians to leave the room decreases whenthe desired velocities are increased, just as it occurs in theSF model.
We use the same room similar of the first experiment,except for the column. We place 150 randomly distributedpedestrians with the same desired velocity, and each simu-lation had the following values for the desired velocities v0:0.8, 1.0, 1.5, 1.75, 2.0, 2.25, 2.5, 3.0, 3.5, 4.0, 5.0, 6.0, and7.0.
Fig. 11 Evacuation times of the pedestrians for various desired veloc-ities v0
Figure 11 shows the relation between the average evacua-tion time and the desired velocity obtained from simulationswith the original and the modified SF models.
8.3 Narrowed corridor
In this experiment, we perform a qualitative test on ourmodel to determine whether it reproduces the “edge effects”emergent phenomena, observed in real crowds.
As described by Still [19], the “edge effects” occurs innarrowed corridors, with a bottleneck formation. When peo-ple go through the corridor, right after the end of the bot-tleneck the crowd maintains itself constricted as if the con-stricting formation was still there.
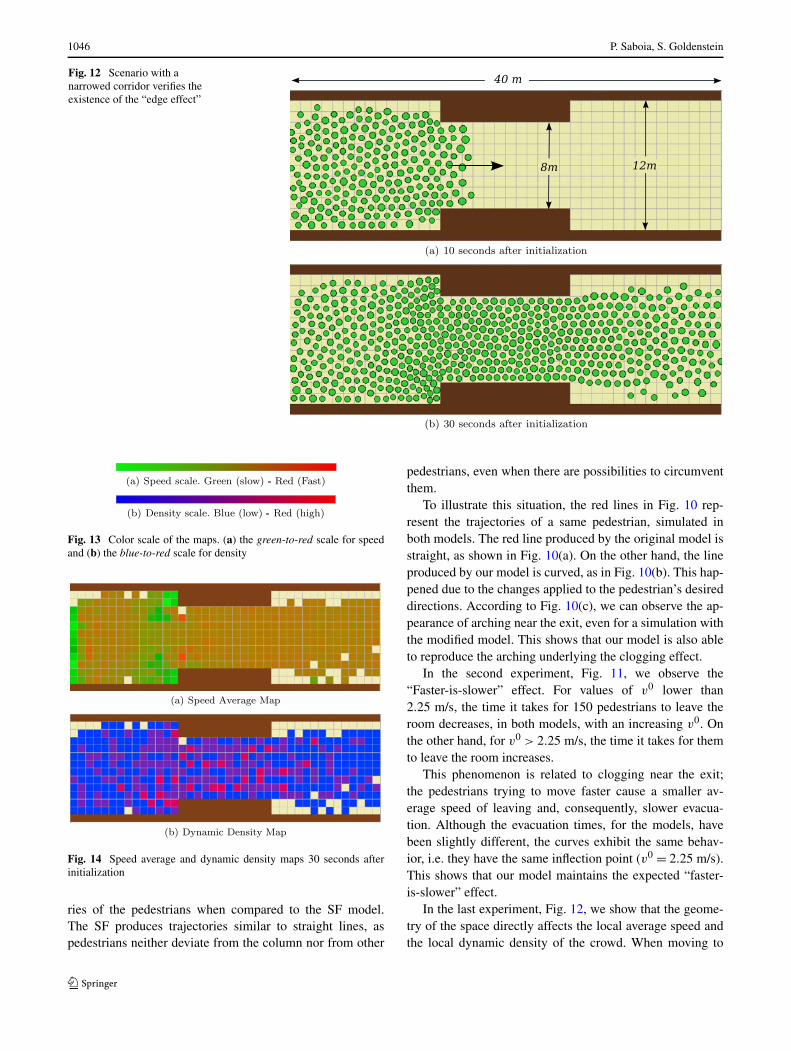
To reproduce such situation, we create a scenario with a40 m long narrowed corridor, of which varying widths were12 m, 8 m, and 12 m (see Fig. 12(a) for details). People ac-cessed the corridor from its left side at a 20 pedestrians/srate. After 30 s of simulation, at least six hundred (600)people entered the space with the same desired velocity of1.35 m/s (see Fig. 12(b)).
We use dynamic density and average speed based mapsto visualize the “edge effects” phenomena with a color code(see Fig. 13) similar to Still’s [19].
Figures 14(a) and 14(b) display the average speed anddynamic density based maps, respectively, at 30 s of simu-lation. For the average speed, the smallest and largest val-ues were 0 and 2.4 m/s, respectively. For the dynamic den-sity, its smallest and largest collected values were 0 and4 pedestrians/m2, respectively.
9 Results and discussion
According to the results from the first experiment, in Fig. 10,our model produces significant changes in the trajecto-
1046 P. Saboia, S. Goldenstein
Fig. 12 Scenario with anarrowed corridor verifies theexistence of the “edge effect”
Fig. 13 Color scale of the maps. (a) the green-to-red scale for speedand (b) the blue-to-red scale for density
Fig. 14 Speed average and dynamic density maps 30 seconds afterinitialization
ries of the pedestrians when compared to the SF model.The SF produces trajectories similar to straight lines, aspedestrians neither deviate from the column nor from other
pedestrians, even when there are possibilities to circumventthem.
To illustrate this situation, the red lines in Fig. 10 rep-resent the trajectories of a same pedestrian, simulated inboth models. The red line produced by the original model isstraight, as shown in Fig. 10(a). On the other hand, the lineproduced by our model is curved, as in Fig. 10(b). This hap-pened due to the changes applied to the pedestrian’s desireddirections. According to Fig. 10(c), we can observe the ap-pearance of arching near the exit, even for a simulation withthe modified model. This shows that our model is also ableto reproduce the arching underlying the clogging effect.
In the second experiment, Fig. 11, we observe the“Faster-is-slower” effect. For values of v0 lower than2.25 m/s, the time it takes for 150 pedestrians to leave theroom decreases, in both models, with an increasing v0. Onthe other hand, for v0 > 2.25 m/s, the time it takes for themto leave the room increases.
This phenomenon is related to clogging near the exit;the pedestrians trying to move faster cause a smaller av-erage speed of leaving and, consequently, slower evacua-tion. Although the evacuation times, for the models, havebeen slightly different, the curves exhibit the same behav-ior, i.e. they have the same inflection point (v0 = 2.25 m/s).This shows that our model maintains the expected “faster-is-slower” effect.
In the last experiment, Fig. 12, we show that the geome-try of the space directly affects the local average speed andthe local dynamic density of the crowd. When moving to
Crowd simulation: applying mobile grids to the social force model 1047
a bottleneck formation, the local dynamic density increasesimmediately before the constricted area and the local aver-age speed decreases. The space immediately after the end ofthe constricted area is not entirely occupied. This shows thatour model reproduces the expected “edge effect.”
10 Conclusions and future work
Simple local models are computationally efficient for sim-ulations, scale well, and are easily to parallelize. They area good solution for crowd simulation, as long as the de-sired crowd behaviors emerge from the combination of thesesmall mindless agents.
We used a mobile grid to improve how pedestrians ap-proach obstacles and other pedestrians in the SF model.Pedestrians evaluate and change their directions from timeto time.
We focused on the analysis of the qualitative behaviors ofour methods, and our results show that our model improvedthe trajectories of the pedestrians without losing the abilityto reproduce the “faster-is-slower” and the arching underly-ing the clogging effects. We also show in experiments theeffect of a narrowed corridor in the trajectories, where theemergent patterns before and after bottleneck formations oc-curred as expected [19].
Just as the original SF model, our model does not dealwith collision avoidance explicitly. Our model is a micro-scopic agent control mechanism and has no global way toenforce that two pedestrians cannot occupy the same space,which can happen with a poor configuration of parametervalues. This is a common drawback of force-based meth-ods for agent control. Also, for complex environments withmaze-like structures, it is necessary to add extra steps to es-timate the direction of desire, such as harmonic functions.Hybrid methods [2] try to remediate these drawbacks withthe combination and interaction of multiple local and globalmodules.
In the future, we intend to study our model in scenar-ios with counterflow [12]. We also plan to investigate ifour model is able to simulate the effects of “stop-and-gowaves,” and the real crowd phenomena called “crowd tur-bulence” [6].
Acknowledgements We would like to thank CNPq, CAPES, andFAPESP for the financial support. We also express our gratitude toDirk Helbing, Illés Farkas, and Tamás Vicsek for kindly providing uswith their source code.
References
1. Goldenstein, S., Large, E., Metaxas, D.: Non-linear dynamicalsystem approach to behavior modeling. Vis. Comput. 15(7), 349–364 (1999)
2. Goldenstein, S., Karavelas, M., Metaxas, D., Guibas, L., Aaron,E., Goswami, A.: Scalable nonlinear dynamical systems for agentsteering and crowd simulation. Comput. Graph. 25(6), 983–998(2001)
3. Guo, R., Huang, H.: A mobile lattice gas model for simulatingpedestrian evacuation. Physica A, Stat. Mech. Appl. 387(2–3),580–586 (2008)
4. Helbing, D., Molnár, P.: Social force model for pedestrian dynam-ics. Phys. Rev. E, Stat. Phys. Plasmas Fluids Relat. Interdiscip.Topics 51(5), 4282–4286 (1995)
5. Helbing, D., Farkas, I., Vicsek, T.: Simulating dynamical featuresof escape panic. Nature 407(6803), 487–490 (2000)
6. Helbing, D., Johansson, A., Al-Abideen, H.: The dynamics ofcrowd disasters: An empirical study. Phys. Rev. E, Stat. Nonlin.Soft Matter Phys. 75(4) (2007)
7. Henderson, L.F.: The statistics of crowd fluids. Nature 229(5284),381–383 (1971)
8. Huang, L., Wong, S.C., Zhang, M., Shu, C., Lam, W.H.K.: Revis-iting Hughes’ dynamic continuum model for pedestrian flow andthe development of an efficient solution algorithm. Transp. Res.,Part B, Methodol. 43(1), 127–141 (2009)
9. Hughes, R.L.: A continuum theory for the flow of pedestrians.Transp. Res., Part B, Methodol. 36(6), 507–535 (2002)
10. Kapadia, M., Singh, S., Hewlett, W., Faloutsos, P.: Egocentric af-fordance fields in pedestrian steering. In: Proceedings of the 2009Symposium on Interactive 3D Graphics and Games, pp. 215–223(2009)
11. Lerner, A., Fitusi, E., Chrysanthou, Y., Cohen-Or, D.: Fitting be-haviors to pedestrian simulations. In: Eurographics Symposium onComputer Animation, pp. 199–208 (2009)
12. Muramatsu, M., Irie, T., Nagatani, T.: Jamming transition inpedestrian counter flow. Physica A, Stat. Theor. Phys. 267(3–4),487–498 (1999)
13. Musse, S., Thalmann, D.: Hierarchical model for real time simu-lation of virtual human crowds. IEEE Trans. Vis. Comput. Graph.7, 152–164 (2001)
14. Musse, S., Jung, C., Jacques, J. Jr., Braun, A.: Using computervision to simulate the motion of virtual agents: Research articles.Comput. Animat. Virtual Worlds 18(2), 83–93 (2007)
15. Perez, G.J., Tapang, G., Lim, M., Saloma, C.: Streaming, dis-ruptive interference and power-law behavior in the exit dynamicsof confined pedestrians. Physica A, Stat. Mech. Appl. 312(3–4),609–618 (2002)
16. Reynolds, C.: Flocks, herds and schools: A distributed behavioralmodel. SIGGRAPH 21(4), 25–34 (1987)
17. Shao, W., Terzopoulos, D.: Autonomous pedestrians. In: Euro-graphics Symposium on Computer Animation, pp. 19–28 (2005)
18. Singh, S., Kapadia, M., Faloutsos, P., Reinman, G.: Steerbench:A benchmark suite for evaluating steering behaviors. Comput. An-imat. Virtual Worlds 20(5–6), 533–548 (2009)
19. Still, G.: Crowd dynamics. Ph.D. thesis, Mathematics Department,Warwick University (2000)
20. Tajima, Y., Nagatani, T.: Scaling behavior of crowd flow outside ahall. Physica A, Stat. Mech. Appl. 292(1–4), 545–554 (2001)
21. Treuille, A., Cooper, S., Popovic, Z.: Continuum crowds. In: SIG-GRAPH, pp. 1160–1168 (2006)
22. Tu, X., Terzopoulos, D.: Artificial fishes: Physics, locomotion,perception, behavior. In: SIGGRAPH, pp. 43–50 (1994)
23. Varas, A., Cornejo, M., Mainemer, D., Toledo, B., Rogan, J.,Munoz, V., Valdivia, J.: Cellular automaton model for evacuationprocess with obstacles. Physica A, Stat. Mech. Appl. 382(2), 631–642 (2007)

1048 P. Saboia, S. Goldenstein
Priscila Saboia was born in Belem,Brazil. She received the B.Sc. de-gree in Computer Science from theFederal University of Para (UFPA),Brazil, in 2006. After a year actingin the software development mar-ket as a systems analyst and as asoftware test engineer, she decidedto move to Campinas, Brazil, in or-der to join the University of Camp-inas (UNICAMP), as a M.Sc. candi-date. By doing research in the fieldof crowd simulation, the M.Sc. de-gree was obtained in 2010, from theComputer Institute at Unicamp (IC-
UNICAMP). In the same year, she was accepted for Ph.D. studies atthe same institute, this time doing research about shredded documentreconstruction, in the field of computer forensics.
Siome Goldenstein is an AssociateProfessor at the Institute of Comput-ing, University of Campinas, Uni-camp, Brazil and a senior IEEEmember. He received a Ph.D. inComputer and Information Sciencefrom the University of Pennsylvaniain 2002, a M.Sc. in Computer Sci-ence from Pontificia UniversidadeCatolica do Rio de Janeiro in 1997,and an Electronic Engineering de-gree from the Federal University ofRio de Janeiro in 1995. His inter-ests lie in computer vision, com-puter graphics, computer forensics,
and machine learning.He is an Area Editor of two journals, Computer Vision and Image Un-derstanding (CVIU) and Graphicsl Models (GMOD), has been in theprogram committee of multiple conferences and workshops, was thelocal organizer of the 2007 IEEE Intl. Conference on Computer Visionin Brazil, and was co-chair of the 2007 IEEE Workshop on ComputerVision Applications for Developing Regions, and co-chair of the 2008IEEE Workitorial of vision of the unseen.